Next Issue
Volume 11, January-2
Previous Issue
Volume 10, December
 
 
remotesensing-logo

Journal Browser

Journal Browser

Remote Sens., Volume 11, Issue 1 (January-1 2019) – 102 articles

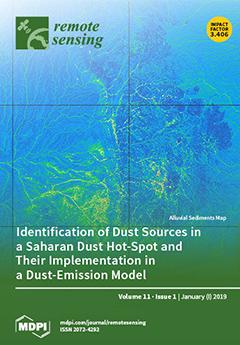
Cover Story (view full-size image): Mineral dust is a key player in the Earth’s climate system. However, climate and weather prediction models still have difficulty predicting the amount and distribution of mineral dust in the atmosphere. One reason for this is the limited understanding of the spatiotemporal activity of dust sources. Here, an approach is presented to determine the location of potential dust sources in a study area in the central Sahara. For this, high-resolution optical data of the Sentinel-2 satellite together with HydroSHEDS flow accumulation data is used to create a sediment supply map, which is then implemented in a dust emission model. A comparison of the simulated dust flux to the observed dust source activation frequency reveals the extent to which the model benefits from having more accurate information on the distribution of dust sources. View this paper.
  • Issues are regarded as officially published after their release is announced to the table of contents alert mailing list.
  • You may sign up for e-mail alerts to receive table of contents of newly released issues.
  • PDF is the official format for papers published in both, html and pdf forms. To view the papers in pdf format, click on the "PDF Full-text" link, and use the free Adobe Reader to open them.
Order results
Result details
Section
Select all
Export citation of selected articles as:
19 pages, 16427 KiB  
Article
The Challenge of Spatial Resolutions for GRACE-Based Estimates Volume Changes of Larger Man-Made Lake: The Case of China’s Three Gorges Reservoir in the Yangtze River
by Linsong Wang, Mikhail K. Kaban, Maik Thomas, Chao Chen and Xian Ma
Remote Sens. 2019, 11(1), 99; https://doi.org/10.3390/rs11010099 - 8 Jan 2019
Cited by 19 | Viewed by 5784
Abstract
The Three Gorges Reservoir (TGR) in China, with the largest dam in the world, stores a large volume of water and may influence the Earth’s gravity field on sub-seasonal to interannual timescales. Significant changes of the total water storage (TWS) might be detectable [...] Read more.
The Three Gorges Reservoir (TGR) in China, with the largest dam in the world, stores a large volume of water and may influence the Earth’s gravity field on sub-seasonal to interannual timescales. Significant changes of the total water storage (TWS) might be detectable by satellite-based data provided by the Gravity Recovery and Climate Experiment (GRACE) mission. To detect these store water changes, effects of other factors are to be removed first from these data due to band-limited representation of near-surface mass changes from GRACE. Here, we evaluated three current popular land surface models (LSMs) basing on in situ measurements and found that the WaterGAP Global Hydrology Model (WGHM) demonstrates higher correlation than other analyzed models with the in-situ rainfall measurement. Then we used the WGHM outputs to remove climate-induced TWS changes, such as surface water storage, soil, canopy, snow, and groundwater storage. The residual results (GRACE minus WGHM) indicated a strong trend (3.85 ± 2 km3/yr) that is significantly higher than the TGR analysis and hindcast experiments (2.29 ± 1 km3/yr) based on in-situ water level measurements. We also estimated the seepage response to the TGR filling, contributions from other anthropogenic dams, and used in-situ gravity and GPS observations to evaluate dominant factors responsible for the GRACE-based overestimate of the TGR volume change. We found that the modeled seepage variability through coarse-grained materials explained most of the difference between the GRACE based estimate of TGR volume changes and in situ measurements, but the agreement with in-situ gravity observations is considerably lower. In contrast, the leakage contribution from 13 adjacent reservoirs explained ~74% of the TGR volume change derived from GRACE and WGHM. Our results demonstrate that GRACE-based overestimate TGR mass change mainly from the contribution of surrounding artificial reservoirs and underestimated TWS variations in WGHM simulations due to the large uncertainty of WGHM in groundwater component. In additional, this study also indicates that reservoir or lake volume changes can be reliably derived from GRACE data when they are used in combination with relevant complementary observations. Full article
(This article belongs to the Special Issue GRACE Facing the Challenge of Extreme Spatial and Temporal Scales)
Show Figures

Graphical abstract

19 pages, 12160 KiB  
Article
Flood Hazard Mapping and Assessment on the Angkor World Heritage Site, Cambodia
by Jie Liu, Zhiwei Xu, Fulong Chen, Fang Chen and Lu Zhang
Remote Sens. 2019, 11(1), 98; https://doi.org/10.3390/rs11010098 - 8 Jan 2019
Cited by 53 | Viewed by 9654
Abstract
World Heritage sites in general are exposed to the impacts of natural hazards, which threaten their integrity and may compromise their value. Floods are a severe threat to the Angkor World Heritage site. Studies of regional floods and flood hazard zoning have played [...] Read more.
World Heritage sites in general are exposed to the impacts of natural hazards, which threaten their integrity and may compromise their value. Floods are a severe threat to the Angkor World Heritage site. Studies of regional floods and flood hazard zoning have played an increasingly important role in ensuring sustainability of the Angkor site. This study developed a flood hazard index (FHI) model based on a geographic information system (GIS) and used synthetic aperture radar (SAR) data to extract historical floods at Angkor from 2007 to 2013. Four indices (flood affected frequency, absolute elevation, elevation standard deviation, drainage density) were used to identify flood-prone areas. The Analytic Hierarchy Process (AHP) and the Delphi method were employed to determine the weight of each index. The weighted indices were then used to develop a distribution map of flood hazards at Angkor. The results show that 9 monuments are at risk by potential floods among the 52 components of the Angkor monuments. The high hazard and moderate-to-high hazard areas in the core zone are mainly located surrounding the West Baray but will not bring direct risk impact on the monuments located in the core archaeological zone. The moderate hazard areas are located on both sides of the Siem Reap and Roluos rivers and in the flooded area of the Tonle Sap Lake in the core archaeological zone. These areas cover 19.4 km2, accounting for 9.13% of the total area of the core zone. This moderate hazard zone poses a greater flood threat to the core zone and must be given higher attention. The buffer zone is a small area with fewer sites. As such, flooding has a low impact on the buffer zone. The methods used in this study can be applied to flood hazard assessments of other heritage sites in Southeast Asia. Full article
Show Figures

Graphical abstract

33 pages, 13666 KiB  
Article
Estimating Tree Volume Distributions in Subtropical Forests Using Airborne LiDAR Data
by Lin Cao, Zhengnan Zhang, Ting Yun, Guibin Wang, Honghua Ruan and Guanghui She
Remote Sens. 2019, 11(1), 97; https://doi.org/10.3390/rs11010097 - 8 Jan 2019
Cited by 18 | Viewed by 6282
Abstract
Accurate and reliable information on tree volume distributions, which describe tree frequencies in volume classes, plays a key role in guiding timber harvest, managing carbon budgets, and supplying ecosystem services. Airborne Light Detection and Ranging (LiDAR) has the capability of offering reliable estimates [...] Read more.
Accurate and reliable information on tree volume distributions, which describe tree frequencies in volume classes, plays a key role in guiding timber harvest, managing carbon budgets, and supplying ecosystem services. Airborne Light Detection and Ranging (LiDAR) has the capability of offering reliable estimates of the distributions of structure attributes in forests. In this study, we predicted individual tree volume distributions over a subtropical forest of southeast China using airborne LiDAR data and field measurements. We first estimated the plot-level total volume by LiDAR-derived standard and canopy metrics. Then the performances of three Weibull parameter prediction methods, i.e., parameter prediction method (PPM), percentile-based parameter recover method (PPRM), and moment-based parameter recover method (MPRM) were assessed to estimate the Weibull scale and shape parameters. Stem density for each plot was calculated by dividing the estimated plot total volume using mean tree volume (i.e., mean value of distributions) derived from the LiDAR-estimated Weibull parameters. Finally, the individual tree volume distributions were generated by the predicted scale and shape parameters, and then scaled by the predicted stem density. The results demonstrated that, compared with the general models, the forest type-specific (i.e., coniferous forests, broadleaved forests, and mixed forests) models had relatively higher accuracies for estimating total volume and stem density, as well as predicting Weibull parameters, percentiles, and raw moments. The relationship between the predicted and reference volume distributions showed a relatively high agreement when the predicted frequencies were scaled to the LiDAR-predicted stem density (mean Reynolds error index eR = 31.47–54.07, mean Packalén error index eP = 0.14–0.21). In addition, the predicted individual tree volume distributions predicted by PPRM of (average mean eR = 37.75) performed the best, followed by MPRM (average mean eR = 40.43) and PPM (average mean eR = 41.22). This study demonstrated that the LiDAR can potentially offer improved estimates of the distributions of tree volume in subtropical forests. Full article
(This article belongs to the Section Forest Remote Sensing)
Show Figures

Graphical abstract

16 pages, 5685 KiB  
Article
Studies of Internal Waves in the Strait of Georgia Based on Remote Sensing Images
by Caixia Wang, Xin Wang and Jose C. B. Da Silva
Remote Sens. 2019, 11(1), 96; https://doi.org/10.3390/rs11010096 - 8 Jan 2019
Cited by 17 | Viewed by 5432
Abstract
This paper analyzes over 500 sets of internal waves in the Strait of Georgia (British Columbia, Canada) based on a large number of satellite remote sensing images. The spatial and temporal distribution of internal waves in the central region of the strait are [...] Read more.
This paper analyzes over 500 sets of internal waves in the Strait of Georgia (British Columbia, Canada) based on a large number of satellite remote sensing images. The spatial and temporal distribution of internal waves in the central region of the strait are discussed via statistical analysis. Possible generation origins of the observed internal waves are divided into three categories based on their different propagation directions and geographical locations: (1) the interaction between the narrow channels to the south of the Strait and the tidal currents, leading to the formation of mainly eastward and northward propagating waves; (2) the interaction between the tidal currents and the topography near Point Roberts, resulting in mainly westward propagating waves; (3) excitation by river plume, mainly near Fraser River mouth, leading to the formation of mainly westward waves along the direction of the river plume. The relation between the occurrence of internal waves in remote sensing images and wind or tide level is also discussed. It is found that most of the observed internal waves occur at low tides. However, due to the influence of the river, the eastward propagating internal waves near the river mouth seldom occur at the lowest tide. Also, internal waves are captured more easily by remote sensing images in summer due to the lower wind speed than winter and therefore the seasonal distribution of internal waves in remote sensing images may not be able to completely represent the real situation in the study area. Finally, combining the in situ measured data and model output data, the Benjamin-Ono equation is found to satisfyingly simulate the characteristic parameters of the studied internal waves. Full article
(This article belongs to the Section Ocean Remote Sensing)
Show Figures

Graphical abstract

21 pages, 7312 KiB  
Article
Dominant Features of Global Surface Soil Moisture Variability Observed by the SMOS Satellite
by Maria Piles, Joaquim Ballabrera-Poy and Joaquín Muñoz-Sabater
Remote Sens. 2019, 11(1), 95; https://doi.org/10.3390/rs11010095 - 8 Jan 2019
Cited by 31 | Viewed by 6551
Abstract
Soil moisture observations are expected to play an important role in monitoring global climate trends. However, measuring soil moisture is challenging because of its high spatial and temporal variability. Point-scale in-situ measurements are scarce and, excluding model-based estimates, remote sensing remains the only [...] Read more.
Soil moisture observations are expected to play an important role in monitoring global climate trends. However, measuring soil moisture is challenging because of its high spatial and temporal variability. Point-scale in-situ measurements are scarce and, excluding model-based estimates, remote sensing remains the only practical way to observe soil moisture at a global scale. The ESA-led Soil Moisture and Ocean Salinity (SMOS) mission, launched in 2009, measures the Earth’s surface natural emissivity at L-band and provides highly accurate soil moisture information with a 3-day revisiting time. Using the first six full annual cycles of SMOS measurements (June 2010–June 2016), this study investigates the temporal variability of global surface soil moisture. The soil moisture time series are decomposed into a linear trend, interannual, seasonal, and high-frequency residual (i.e., subseasonal) components. The relative distribution of soil moisture variance among its temporal components is first illustrated at selected target sites representative of terrestrial biomes with distinct vegetation type and seasonality. A comparison with GLDAS-Noah and ERA5 modeled soil moisture at these sites shows general agreement in terms of temporal phase except in areas with limited temporal coverage in winter season due to snow. A comparison with ground-based estimates at one of the sites shows good agreement of both temporal phase and absolute magnitude. A global assessment of the dominant features and spatial distribution of soil moisture variability is then provided. Results show that, despite still being a relatively short data set, SMOS data provides coherent and reliable variability patterns at both seasonal and interannual scales. Subseasonal components are characterized as white noise. The observed linear trends, based upon one strong El Niño event in 2016, are consistent with the known El Niño Southern Oscillation (ENSO) teleconnections. This work provides new insight into recent changes in surface soil moisture and can help further our understanding of the terrestrial branch of the water cycle and of global patterns of climate anomalies. Also, it is an important support to multi-decadal soil moisture observational data records, hydrological studies and land data assimilation projects using remotely sensed observations. Full article
(This article belongs to the Special Issue Ten Years of Remote Sensing at Barcelona Expert Center)
Show Figures

Graphical abstract

23 pages, 4360 KiB  
Article
The Global Spatiotemporal Distribution of the Mid-Tropospheric CO2 Concentration and Analysis of the Controlling Factors
by Liangzhong Cao, Xi Chen, Chi Zhang, Alishir Kurban, Jin Qian, Tao Pan, Zuozhong Yin, Xiugong Qin, Friday Uchenna Ochege and Philippe De Maeyer
Remote Sens. 2019, 11(1), 94; https://doi.org/10.3390/rs11010094 - 8 Jan 2019
Cited by 25 | Viewed by 5060
Abstract
The atmospheric infrared sounder (AIRS) provides a robust and accurate data source to investigate the variability of mid-tropospheric CO2 globally. In this paper, we use the AIRS CO2 product and other auxiliary data to survey the spatiotemporal distribution characteristics of mid-tropospheric [...] Read more.
The atmospheric infrared sounder (AIRS) provides a robust and accurate data source to investigate the variability of mid-tropospheric CO2 globally. In this paper, we use the AIRS CO2 product and other auxiliary data to survey the spatiotemporal distribution characteristics of mid-tropospheric CO2 and the controlling factors using linear regression, empirical orthogonal functions (EOFs), geostatistical analysis, and correlation analysis. The results show that areas with low mid-tropospheric CO2 concentrations (20°S–5°N) (384.2 ppm) are formed as a result of subsidence in the atmosphere, the presence of the Amazon rainforest, and the lack of high CO2 emission areas. The areas with high mid-tropospheric CO2 concentrations (30°N–70°N) (382.1 ppm) are formed due to high CO2 emissions. The global mid-tropospheric CO2 concentrations increased gradually (the annual average rate of increase in CO2 concentration is 2.11 ppm/a), with the highest concentration occurring in spring (384.0 ppm) and the lowest value in winter (382.5 ppm). The amplitude of the seasonal variation retrieved from AIRS (average: 1.38 ppm) is consistent with that of comprehensive observation network for trace gases (CONTRAIL), but smaller than the surface ground stations, which is related to altitude and coverage. These results contribute to a comprehensive understanding of the spatiotemporal distribution of mid-tropospheric CO2 and related mechanisms. Full article
(This article belongs to the Special Issue Remote Sensing of Air Quality)
Show Figures

Graphical abstract

17 pages, 11839 KiB  
Article
Satellite-Based Spatiotemporal Trends of Canopy Urban Heat Islands and Associated Drivers in China’s 32 Major Cities
by Long Li and Yong Zha
Remote Sens. 2019, 11(1), 102; https://doi.org/10.3390/rs11010102 - 8 Jan 2019
Cited by 35 | Viewed by 5496
Abstract
The urban heat island (UHI) effect, in which urbanized areas tend to have warmer conditions compared to their rural surroundings, has drawn increasing attention in recent years. Using ground-based and satellite remote sensing data, we present a method to quantify the spatial pattern [...] Read more.
The urban heat island (UHI) effect, in which urbanized areas tend to have warmer conditions compared to their rural surroundings, has drawn increasing attention in recent years. Using ground-based and satellite remote sensing data, we present a method to quantify the spatial pattern and diurnal and seasonal variations in canopy layer heat islands (CLHIs) in China’s 32 major cities during 2009 and investigate their relationships with built-up intensity (BI), nighttime lights, vegetation activity, surface albedo, and surface urban heat island intensity (SUHII). The results show that both the annual daytime and nighttime CLHI intensities (CLHIIs) were positive ranging from 0.2 °C to 2.2 °C and from 0.3 °C to 2.4 °C for these major cities, respectively. Higher CLHIIs were observed in the night, especially for northern parts of China. Along urban–rural gradients, the CLHI effect had an exponential decay shape and differed greatly by season. The CLHII distribution correlated positively and significantly to BI and nighttime lights. Vegetation activity was negatively correlated with the CLHII and more strongly in summer. Surface albedo showed an extremely weak correlation with the CLHII. In addition, CLHII had a strong correlation with SUHII. The annual daytime SUHII was 1.2 ± 1.1 °C (mean ± standard deviation) with 0.40 °C (95% confidence interval 0.36 to 0.44 °C) of annual daytime CLHII. The annual nighttime SUHII was 2.0 ± 0.8 °C with 1.04 °C (0.99 to 1.09 °C) of annual nighttime CLHII. Our results suggest that, reducing built-up intensity and anthropogenic heat emissions and increasing urban vegetation provide a co-benefit of mitigating SUHI and CLHI effects. Full article
(This article belongs to the Special Issue Urban Heat Island Remote Sensing)
Show Figures

Figure 1

13 pages, 2817 KiB  
Article
Enhanced Warming and Intensification of the Kuroshio Extension, 1999–2013
by You-Lin Wang and Chau-Ron Wu
Remote Sens. 2019, 11(1), 101; https://doi.org/10.3390/rs11010101 - 8 Jan 2019
Cited by 11 | Viewed by 5818
Abstract
The Pacific climate regime has anomalous warm and cool periods every decade associated with atmospheric circulation changes, which are known to have modulated the tropical and subtropical Pacific during the recent Pacific hiatus regime (1999–2013). However, the influence of the hiatus regime on [...] Read more.
The Pacific climate regime has anomalous warm and cool periods every decade associated with atmospheric circulation changes, which are known to have modulated the tropical and subtropical Pacific during the recent Pacific hiatus regime (1999–2013). However, the influence of the hiatus regime on the Kuroshio Extension (KE) remains unclear. Here, we show that the KE jet underwent enhanced warming (increased 1–1.5 °C), intensification (8–19%) and northward migration (0.5–1°). The KE jet became more perturbed in the upstream region (increased by 70%, west of 146°E) but became stable downstream (perturbation decreased 5–11%, east of 146°E). A poleward shift of the mid-latitude jet stream and weakened Aleutian Low (AL) contributed to the northward migration and intensification of the KE jet, respectively. The weakened AL was associated with negative wind stress curl (WSC) in the eastern Pacific, and this WSC generated an underlying positive sea surface height anomaly that propagated westward, intensifying the KE jet when it reached the KE region. Since the recent Pacific hiatus regime ended after 2013, these changes of the KE jet may reverse during the ongoing warming regime. Full article
(This article belongs to the Section Ocean Remote Sensing)
Show Figures

Figure 1

24 pages, 6383 KiB  
Article
Combining Binary and Post-Classification Change Analysis of Augmented ALOS Backscatter for Identifying Subtle Land Cover Changes
by Dyah R. Panuju, David J. Paull and Bambang H. Trisasongko
Remote Sens. 2019, 11(1), 100; https://doi.org/10.3390/rs11010100 - 8 Jan 2019
Cited by 21 | Viewed by 4687
Abstract
This research aims to detect subtle changes by combining binary change analysis, the Iteratively Reweighted Multivariate Alteration Detection (IRMAD), over dual polarimetric Advanced Land Observing Satellite (ALOS) backscatter with augmented data for post-classification change analysis. The accuracy of change detection was iteratively evaluated [...] Read more.
This research aims to detect subtle changes by combining binary change analysis, the Iteratively Reweighted Multivariate Alteration Detection (IRMAD), over dual polarimetric Advanced Land Observing Satellite (ALOS) backscatter with augmented data for post-classification change analysis. The accuracy of change detection was iteratively evaluated based on thresholds composed of mean and a range constant of standard deviation. Four datasets were examined for post-classification change analysis including the dual polarimetric backscatter as the benchmark and its augmented data with indices, entropy alpha decomposition and selected texture features. Variable importance was then evaluated to build a best subset model employing seven classifiers, including Bagged Classification and Regression Tree (CAB), Extreme Learning Machine Neural Network (ENN), Bagged Multivariate Adaptive Regression Spline (MAB), Regularised Random Forest (RFG), Original Random Forest (RFO), Support Vector Machine (SVM), and Extreme Gradient Boosting Tree (XGB). The best accuracy was 98.8%, which resulted from thresholding MAD variate-2 with constants at 1.7. The highest improvement of classification accuracy was obtained by amending the grey level co-occurrence matrix (GLCM) texture. The identification of variable importance (VI) confirmed that selected GLCM textures (mean and variance of HH or HV) were equally superior, while the contribution of index and decomposition were negligible. The best model produced similar classification accuracy at about 90% for both years 2007 and 2010. Tree-based algorithms including RFO, RFG and XGB were more robust than SVM and ENN. Subtle changes indicated by binary change analysis were somewhat hidden in post-classification analysis. Reclassification by combining all important variables and adding five classes to include subtle changes assisted by Google Earth yielded an accuracy of 82%. Full article
(This article belongs to the Section Remote Sensing in Agriculture and Vegetation)
Show Figures

Graphical abstract

25 pages, 5919 KiB  
Article
Predictive Ecosystem Mapping of South-Eastern Australian Temperate Forests Using Lidar-Derived Structural Profiles and Species Distribution Models
by Melissa Fedrigo, Stephen B. Stewart, Stephen H. Roxburgh, Sabine Kasel, Lauren T. Bennett, Helen Vickers and Craig R. Nitschke
Remote Sens. 2019, 11(1), 93; https://doi.org/10.3390/rs11010093 - 7 Jan 2019
Cited by 16 | Viewed by 6900
Abstract
Modern approaches to predictive ecosystem mapping (PEM) have not thoroughly explored the use of ‘characteristic’ gradients, which describe vegetation structure (e.g., light detection and ranging (lidar)-derived structural profiles). In this study, we apply a PEM approach by classifying the dominant stand types within [...] Read more.
Modern approaches to predictive ecosystem mapping (PEM) have not thoroughly explored the use of ‘characteristic’ gradients, which describe vegetation structure (e.g., light detection and ranging (lidar)-derived structural profiles). In this study, we apply a PEM approach by classifying the dominant stand types within the Central Highlands region of south-eastern Australia using both lidar and species distribution models (SDMs). Similarity percentages analysis (SIMPER) was applied to comprehensive floristic surveys to identify five species which best separated stand types. The predicted distributions of these species, modelled using random forests with environmental (i.e., climate, topography) and optical characteristic gradients (Landsat-derived seasonal fractional cover), provided an ecological basis for refining stand type classifications based only on lidar-derived structural profiles. The resulting PEM model represents the first continuous distribution map of stand types across the study region that delineates ecotone stands, which are seral communities comprised of species typical of both rainforest and eucalypt forests. The spatial variability of vegetation structure incorporated into the PEM model suggests that many stand types are not as continuous in cover as represented by current ecological vegetation class distributions that describe the region. Improved PEM models can facilitate sustainable forest management, enhanced forest monitoring, and informed decision making at landscape scales. Full article
(This article belongs to the Special Issue Advances in Remote Sensing of Forest Structure and Applications)
Show Figures

Graphical abstract

15 pages, 4272 KiB  
Article
Optimizing the Remote Detection of Tropical Rainforest Structure with Airborne Lidar: Leaf Area Profile Sensitivity to Pulse Density and Spatial Sampling
by Danilo Roberti Alves de Almeida, Scott C. Stark, Gang Shao, Juliana Schietti, Bruce Walker Nelson, Carlos Alberto Silva, Eric Bastos Gorgens, Ruben Valbuena, Daniel de Almeida Papa and Pedro Henrique Santin Brancalion
Remote Sens. 2019, 11(1), 92; https://doi.org/10.3390/rs11010092 - 7 Jan 2019
Cited by 76 | Viewed by 11903
Abstract
Airborne Laser Scanning (ALS) has been considered as a primary source to model the structure and function of a forest canopy through the indicators leaf area index (LAI) and vertical canopy profiles of leaf area density (LAD). However, little is known about the [...] Read more.
Airborne Laser Scanning (ALS) has been considered as a primary source to model the structure and function of a forest canopy through the indicators leaf area index (LAI) and vertical canopy profiles of leaf area density (LAD). However, little is known about the effects of the laser pulse density and the grain size (horizontal binning resolution) of the laser point cloud on the estimation of LAD profiles and their associated LAIs. Our objective was to determine the optimal values for reliable and stable estimates of LAD profiles from ALS data obtained over a dense tropical forest. Profiles were compared using three methods: Destructive field sampling, Portable Canopy profiling Lidar (PCL) and ALS. Stable LAD profiles from ALS, concordant with the other two analytical methods, were obtained when the grain size was less than 10 m and pulse density was high (>15 pulses m−2). Lower pulse densities also provided stable and reliable LAD profiles when using an appropriate adjustment (coefficient K). We also discuss how LAD profiles might be corrected throughout the landscape when using ALS surveys of lower density, by calibrating with LAI measurements in the field or from PCL. Appropriate choices of grain size, pulse density and K provide reliable estimates of LAD and associated tree plot demography and biomass in dense forest ecosystems. Full article
(This article belongs to the Special Issue 3D Point Clouds in Forests)
Show Figures

Graphical abstract

34 pages, 4037 KiB  
Article
A Bibliometric Profile of the Remote Sensing Open Access Journal Published by MDPI between 2009 and 2018
by YuYing Zhang, Prasad S. Thenkabail and Peng Wang
Remote Sens. 2019, 11(1), 91; https://doi.org/10.3390/rs11010091 - 7 Jan 2019
Cited by 22 | Viewed by 10730
Abstract
Remote Sensing Open Access Journal (RS OAJ) is an international leading journal in the field of remote sensing science and technology. It was first published in the year 2009 and is currently celebrating tenth year of publications. In this research, a bibliometric analysis [...] Read more.
Remote Sensing Open Access Journal (RS OAJ) is an international leading journal in the field of remote sensing science and technology. It was first published in the year 2009 and is currently celebrating tenth year of publications. In this research, a bibliometric analysis of RS OAJ was conducted based on 5588 articles published during the 10-year (2009–2018) time-period. The bibliometric analysis includes a comprehensive set of indicators such as dynamics and trends of publications, journal impact factor, total cites, eigenfactor score, normalized eigenfactor, CiteScore, h-index, h-classic publications, most productive countries (or territories) and institutions, co-authorship collaboration about countries (territories), research themes, citation impact of co-occurrences keywords, intellectual structure, and knowledge commutation. We found that publications of RS OAJ presented an exponential growth in the past ten years. From 2010 to 2017 (for which complete years data were available), the h-index of RS OAJ is 67. From 2009–2018, RS OAJ includes publications from 129 countries (or territories) and 3826 institutions. The leading nations contributing articles, based on 2009–2018 data, and listed based on ranking were: China, United States, Germany, Italy, France, Spain, Canada, England, Australia, Netherlands, Japan, Switzerland and Austria. The leading institutions, also for the same period and listed based on ranking were: Chinese Academy of Sciences, Wuhan University, University of Chinese Academy of Sciences, Beijing Normal University, The university of Maryland, National Aeronautics and Space Administration, National Oceanic and Atmospheric Administration, China University of Geosciences, United States Geological Survey, German Aerospace Centre, University of Twente, and California Institute of Technology. For the year 2017, RS OAJ had an impressive journal impact factor of 3.4060, a CiteScore of 4.03, eigenfactor score of 0.0342, and normalized eigenfactor score of 3.99. In addition, based on 2009–2018, data co-word analysis determined that “remote sensing”, “MODIS”, “Landsat”, “LiDAR” and “NDVI” are the high-frequency of author keywords co-occurrence in RS OAJ. The main themes of RS OAJ are multi-spectral and hyperspectral remote sensing, LiDAR scanning and forestry remote sensing monitoring, MODIS and LAI data applications, Remote sensing applications and Synthetic Aperture Radar (SAR). Through author keywords citation impact analysis, we find the most influential keyword is Unmanned Aerial Vehicle (UAV), followed, forestry, Normalized Difference Vegetation Index (NDVI), terrestrial laser scanning, airborne laser scanning, forestry inventory, urban heat island, monitoring, agriculture, and laser scanning. By analyzing the intellectual structure of RS OAJ, we identify the main reference publications and find that the themes are about Random Forests, MODIS vegetation indices and image analysis, etc. RS OAJ ranks first in cited journals and third in citing, this indicates that RS OAJ has the internal knowledge flow. Our results will bring more benefits to scholars, researchers and graduate students, who hopes to get a quick overview of the RS OAJ. And this article will also be the starting point for communication between scholars and practitioners. Finally, this paper proposed a nuanced h-index (nh-index) to measure productivity and intellectual contribution of authors by considering h-index based on whether the one is first, second, third, or nth author. This nuanced approach to determining h-index of authors is powerful indicator of an academician’s productivity and intellectual contribution. Full article
(This article belongs to the Special Issue Remote Sensing: 10th Anniversary)
Show Figures

Graphical abstract

24 pages, 9971 KiB  
Article
Gap-Filling of MODIS Fractional Snow Cover Products via Non-Local Spatio-Temporal Filtering Based on Machine Learning Techniques
by Jinliang Hou, Chunlin Huang, Ying Zhang, Jifu Guo and Juan Gu
Remote Sens. 2019, 11(1), 90; https://doi.org/10.3390/rs11010090 - 7 Jan 2019
Cited by 40 | Viewed by 5458
Abstract
Cloud obscuration leaves significant gaps in MODIS snow cover products. In this study, an innovative gap-filling method based on the concept of non-local spatio-temporal filtering (NSTF) is proposed to reconstruct the cloud gaps in MODIS fractional snow cover (SCF) products. The ground information [...] Read more.
Cloud obscuration leaves significant gaps in MODIS snow cover products. In this study, an innovative gap-filling method based on the concept of non-local spatio-temporal filtering (NSTF) is proposed to reconstruct the cloud gaps in MODIS fractional snow cover (SCF) products. The ground information of a gap pixel was estimated by using the appropriate similar pixels in the remaining known part of an image via an automatic machine learning technique. We take the MODIS SCF product cloud gap filling data from 2001 to 2016 in Northern Xinjiang, China as an example. The results demonstrate that the methodology can generate almost continuous spatio-temporal, daily MODIS SCF images, and it leaves only 0.52% of cloud gaps long-term, on average. The validation results based on “cloud assumption” exhibit high accuracy, with a higher R 2 exceeding 0.8, a lower RMSE of 0.1, an overestimated error of 1.13%, an underestimated error of 1.4%, and a spatial efficiency (SPAEF) of 0.78. The validation based on 50 in situ snow depth observations demonstrates the superiority of the methodology in terms of accuracy and consistency. The overall accuracy is 93.72%. The average omission and commission error have increased approximately 1.16 and 0.53% compared with the original MODIS SCF products under a clear sky term. Full article
Show Figures

Graphical abstract

19 pages, 11835 KiB  
Article
SAR Interferometry for Sinkhole Early Warning and Susceptibility Assessment along the Dead Sea, Israel
by Ran N. Nof, Meir Abelson, Eli Raz, Yochay Magen, Simone Atzori, Stefano Salvi and Gidon Baer
Remote Sens. 2019, 11(1), 89; https://doi.org/10.3390/rs11010089 - 7 Jan 2019
Cited by 45 | Viewed by 7621
Abstract
During the past three decades, the Dead Sea (DS) water level has dropped at an average rate of ~1 m/year, resulting in the formation of thousands of sinkholes along its coastline that severely affect the economy and infrastructure of the region. The sinkholes [...] Read more.
During the past three decades, the Dead Sea (DS) water level has dropped at an average rate of ~1 m/year, resulting in the formation of thousands of sinkholes along its coastline that severely affect the economy and infrastructure of the region. The sinkholes are associated with gradual land subsidence, preceding their collapse by periods ranging from a few days to about five years. We present the results of over six years of systematic high temporal and spatial resolution interferometric synthetic aperture radar (InSAR) observations, incorporated with and refined by detailed Light Detection and Ranging (LiDAR) measurements. The combined data enable the utilization of interferometric pairs with a wide range of spatial baselines to detect minute precursory subsidence before the catastrophic collapse of the sinkholes and to map zones susceptible to future sinkhole formation. We present here four case studies that illustrate the timelines and effectiveness of our methodology as well as its limitations and complementary methodologies used for sinkhole monitoring and hazard assessment. Today, InSAR-derived subsidence maps have become fundamental for sinkhole early warning and mitigation along the DS coast in Israel and are incorporated in all sinkhole potential maps which are mandatory for the planning and licensing of new infrastructure. Full article
(This article belongs to the Special Issue Remote Sensing of Land Subsidence)
Show Figures

Figure 1

21 pages, 8075 KiB  
Article
Fusing High-Spatial-Resolution Remotely Sensed Imagery and OpenStreetMap Data for Land Cover Classification Over Urban Areas
by Nianxue Luo, Taili Wan, Huaixu Hao and Qikai Lu
Remote Sens. 2019, 11(1), 88; https://doi.org/10.3390/rs11010088 - 7 Jan 2019
Cited by 29 | Viewed by 6191
Abstract
Land cover classification of urban areas is critical for understanding the urban environment. High-resolution remotely sensed imagery provides abundant, detailed spatial information for urban classification. In the meantime, OpenStreetMap (OSM) data, as typical crowd-sourced geographical information, have been an emerging data source for [...] Read more.
Land cover classification of urban areas is critical for understanding the urban environment. High-resolution remotely sensed imagery provides abundant, detailed spatial information for urban classification. In the meantime, OpenStreetMap (OSM) data, as typical crowd-sourced geographical information, have been an emerging data source for obtaining urban information. In this context, a land cover classification method that fuses high-resolution remotely sensed imagery and OSM data is proposed. Training samples were generated by integrating the OSM data and multiple information indexes. OSM data, which contain class attributes and location information of urban objects, served as the labels of initial training samples. Multiple information indexes that reflect spectral and spatial characteristics of different classes were utilized to improve the training set. Morphological attribute profiles were used because the structural and contextual information of images was effective in distinguishing the classes with similar spectral characteristics. Moreover, a road superimposition strategy that considers road hierarchy was developed because OSM data provide road information with high completeness in the urban area. Experiments were conducted on the data captured over Wuhan city, and three state-of-the-art approaches were adopted for comparison. Results show that the proposed approach obtains satisfactory results and outperforms the other comparative approaches. Full article
(This article belongs to the Special Issue Citizen Science and Earth Observation II)
Show Figures

Figure 1

14 pages, 3064 KiB  
Article
The Continental Impact of European Forest Conservation Policy and Management on Productivity Stability
by Adam Moreno, Mathias Neumann, Phillip M. Mohebalian, Christopher Thurnher and Hubert Hasenauer
Remote Sens. 2019, 11(1), 87; https://doi.org/10.3390/rs11010087 - 6 Jan 2019
Cited by 9 | Viewed by 3730
Abstract
The ecological impact of continental scale land-use policies that influence forest management is often difficult to quantify. European forest conservation began in 1909 with a marked increase in designated areas with the inception of Natura 2000 in the early 1990s. It has been [...] Read more.
The ecological impact of continental scale land-use policies that influence forest management is often difficult to quantify. European forest conservation began in 1909 with a marked increase in designated areas with the inception of Natura 2000 in the early 1990s. It has been shown that increases in European forest mortality may be linked to climate variability. Measuring productivity response to climate variability may be a valid proxy indicating a forest’s ability to bear this disturbance. Net Primary Production (NPP) response to climate variability has also been linked to functional diversity within forests. Using a European specific annual MODIS NPP estimates, we assess the NPP response to climate variability differences between actively managed forests, which experience human interventions and conserved, Protected Area (PA) forests with minimal to no human impact. We found, on the continental scale, little to no differences in NPP response between managed and conserved forests. However, on the regional scale, differences emerge that are driven by the historic forest management practices and the potential speciation of the area. Northern PA forests show the same NPP response to climate variability as their actively managed counter parts. PA forests tend to have less NPP response to climate variability in the South and in older conserved forests. As the time a forest has been designated, as a PA, extends past its typically actively managed rotation length, greater differences begin to emerge between the two management types. Full article
(This article belongs to the Section Forest Remote Sensing)
Show Figures

Graphical abstract

19 pages, 5550 KiB  
Article
Multi-Temporal Analysis of Forest Fire Probability Using Socio-Economic and Environmental Variables
by Sea Jin Kim, Chul-Hee Lim, Gang Sun Kim, Jongyeol Lee, Tobias Geiger, Omid Rahmati, Yowhan Son and Woo-Kyun Lee
Remote Sens. 2019, 11(1), 86; https://doi.org/10.3390/rs11010086 - 6 Jan 2019
Cited by 99 | Viewed by 9769
Abstract
As most of the forest fires in South Korea are related to human activity, socio-economic factors are critical in estimating their probability. To estimate and analyze how human activity is influencing forest fire probability, this study considered not only environmental factors such as [...] Read more.
As most of the forest fires in South Korea are related to human activity, socio-economic factors are critical in estimating their probability. To estimate and analyze how human activity is influencing forest fire probability, this study considered not only environmental factors such as precipitation, elevation, topographic wetness index, and forest type, but also socio-economic factors such as population density and distance from urban area. The machine learning Maximum Entropy (Maxent) and Random Forest models were used to predict and analyze the spatial distribution of forest fire probability in South Korea. The model performance was evaluated using the receiver operating characteristic (ROC) curve method, and models’ outputs were compared based on the area under the ROC curve (AUC). In addition, a multi-temporal analysis was conducted to determine the relationships between forest fire probability and socio-economic or environmental changes from the 1980s to the 2000s. The analysis revealed that the spatial distribution was concentrated in or around cities, and the probability had a strong correlation with variables related to human activity and accessibility over the decades. The AUC values for validation were higher in the Random Forest result compared to the Maxent result throughout the decades. Our findings can be useful for developing preventive measures for forest fire risk reduction considering socio-economic development and environmental conditions. Full article
Show Figures

Graphical abstract

17 pages, 10332 KiB  
Article
Investigating Subsidence in the Bursa Plain, Turkey, Using Ascending and Descending Sentinel-1 Satellite Data
by Gokhan Aslan, Ziyadin Cakir, Cécile Lasserre and François Renard
Remote Sens. 2019, 11(1), 85; https://doi.org/10.3390/rs11010085 - 5 Jan 2019
Cited by 40 | Viewed by 8130
Abstract
We characterize and monitor subsidence of the Bursa Plain (southern Marmara region of Turkey), which has been interpreted as resulting from tectonic motions in the region. We quantify the subsidence using Interferometric Synthetic Aperture Radar (InSAR) time-series analysis. The Stanford Method for Persistent [...] Read more.
We characterize and monitor subsidence of the Bursa Plain (southern Marmara region of Turkey), which has been interpreted as resulting from tectonic motions in the region. We quantify the subsidence using Interferometric Synthetic Aperture Radar (InSAR) time-series analysis. The Stanford Method for Persistent Scatterers InSAR package (StaMPS) is employed to process series of Sentinel 1 A-B radar images acquired between 2014 and 2017 along both ascending and descending orbits. The vertical velocity field obtained after decomposition of line-of-sight velocity fields on the two tracks reveals that the Bursa plain is subsiding at rates up to 25 mm/yr. The most prominent subsidence signal in the basin forms an east-west elongated ellipse of deformation in the east, and is bounded by a Quaternary alluvial plain undergoing average vertical subsidence at ~10 mm/yr. Another localized subsidence signal is located 5 km north of the city, following the Bursa alluvial fan, and is subsiding at velocities up to 25 mm/yr. The comparison between temporal variations of the subsiding surface displacements and variations of the water pressure head in the aquifer allows estimation of the compressibility of the aquifer, α . It falls in the range of 0.5 × 10 6 2 × 10 6 Pa−1, which corresponds to typical values for clay and sand sediments. We find a clear correlation between subsidence patterns and the lithology, suggesting a strong lithological control over subsidence. In addition, the maximum rate of ground subsidence occurs where agricultural activity relies on groundwater exploitation. The InSAR time series within the observation period is well correlated with changes in the depth of the ground water. These observations indicate that the recent acceleration of subsidence is mainly due to anthropogenic activities rather than tectonic motion. Full article
(This article belongs to the Special Issue Remote Sensing of Land Subsidence)
Show Figures

Graphical abstract

19 pages, 5028 KiB  
Article
Evaluation of Ground Surface Models Derived from Unmanned Aerial Systems with Digital Aerial Photogrammetry in a Disturbed Conifer Forest
by Alexander Graham, Nicholas C. Coops, Michael Wilcox and Andrew Plowright
Remote Sens. 2019, 11(1), 84; https://doi.org/10.3390/rs11010084 - 4 Jan 2019
Cited by 37 | Viewed by 7173
Abstract
Detailed vertical forest structure information can be remotely sensed by combining technologies of unmanned aerial systems (UAS) and digital aerial photogrammetry (DAP). A key limitation in the application of DAP methods, however, is the inability to produce accurate digital elevation models (DEM) in [...] Read more.
Detailed vertical forest structure information can be remotely sensed by combining technologies of unmanned aerial systems (UAS) and digital aerial photogrammetry (DAP). A key limitation in the application of DAP methods, however, is the inability to produce accurate digital elevation models (DEM) in areas of dense vegetation. This study investigates the terrain modeling potential of UAS-DAP methods within a temperate conifer forest in British Columbia, Canada. UAS-acquired images were photogrammetrically processed to produce high-resolution DAP point clouds. To evaluate the terrain modeling ability of DAP, first, a sensitivity analysis was conducted to estimate optimal parameters of three ground-point classification algorithms designed for airborne laser scanning (ALS). Algorithms tested include progressive triangulated irregular network (TIN) densification (PTD), hierarchical robust interpolation (HRI) and simple progressive morphological filtering (SMRF). Points were classified as ground from the ALS and served as ground-truth data to which UAS-DAP derived DEMs were compared. The proportion of area with root mean square error (RMSE) <1.5 m were 56.5%, 51.6% and 52.3% for the PTD, HRI and SMRF methods respectively. To assess the influence of terrain slope and canopy cover, error values of DAP-DEMs produced using optimal parameters were compared to stratified classes of canopy cover and slope generated from ALS point clouds. Results indicate that canopy cover was approximately three times more influential on RMSE than terrain slope. Full article
(This article belongs to the Special Issue Aerial and Near-Field Remote Sensing Developments in Forestry)
Show Figures

Graphical abstract

22 pages, 17974 KiB  
Article
Semantic Segmentation on Remotely Sensed Images Using an Enhanced Global Convolutional Network with Channel Attention and Domain Specific Transfer Learning
by Teerapong Panboonyuen, Kulsawasd Jitkajornwanich, Siam Lawawirojwong, Panu Srestasathiern and Peerapon Vateekul
Remote Sens. 2019, 11(1), 83; https://doi.org/10.3390/rs11010083 - 4 Jan 2019
Cited by 89 | Viewed by 9647
Abstract
In the remote sensing domain, it is crucial to complete semantic segmentation on the raster images, e.g., river, building, forest, etc., on raster images. A deep convolutional encoder–decoder (DCED) network is the state-of-the-art semantic segmentation method for remotely sensed images. However, the accuracy [...] Read more.
In the remote sensing domain, it is crucial to complete semantic segmentation on the raster images, e.g., river, building, forest, etc., on raster images. A deep convolutional encoder–decoder (DCED) network is the state-of-the-art semantic segmentation method for remotely sensed images. However, the accuracy is still limited, since the network is not designed for remotely sensed images and the training data in this domain is deficient. In this paper, we aim to propose a novel CNN for semantic segmentation particularly for remote sensing corpora with three main contributions. First, we propose applying a recent CNN called a global convolutional network (GCN), since it can capture different resolutions by extracting multi-scale features from different stages of the network. Additionally, we further enhance the network by improving its backbone using larger numbers of layers, which is suitable for medium resolution remotely sensed images. Second, “channel attention” is presented in our network in order to select the most discriminative filters (features). Third, “domain-specific transfer learning” is introduced to alleviate the scarcity issue by utilizing other remotely sensed corpora with different resolutions as pre-trained data. The experiment was then conducted on two given datasets: (i) medium resolution data collected from Landsat-8 satellite and (ii) very high resolution data called the ISPRS Vaihingen Challenge Dataset. The results show that our networks outperformed DCED in terms of F 1 for 17.48% and 2.49% on medium and very high resolution corpora, respectively. Full article
(This article belongs to the Special Issue Convolutional Neural Networks Applications in Remote Sensing)
Show Figures

Graphical abstract

15 pages, 3526 KiB  
Article
Comparison of Computational Intelligence Methods Based on Fuzzy Sets and Game Theory in the Synthesis of Safe Ship Control Based on Information from a Radar ARPA System
by Józef Lisowski and Mostefa Mohamed-Seghir
Remote Sens. 2019, 11(1), 82; https://doi.org/10.3390/rs11010082 - 4 Jan 2019
Cited by 27 | Viewed by 4563
Abstract
This article presents safe ship control optimization design for navigator advisory system. Optimal safe ship control is presented as multistage decision-making in a fuzzy environment and as multistep decision-making in a game environment. The navigator’s subjective and the maneuvering parameters are taken under [...] Read more.
This article presents safe ship control optimization design for navigator advisory system. Optimal safe ship control is presented as multistage decision-making in a fuzzy environment and as multistep decision-making in a game environment. The navigator’s subjective and the maneuvering parameters are taken under consideration in the model process. A computer simulation of fuzzy neural anticollision (FNAC) and matrix game anticollision (MGAC) algorithms was carried out on MATLAB software on an example of the real navigational situation of passing three encountered ships in the Skagerrak Strait, in good and restricted visibility at sea. The developed solution can be applied in decision-support systems on board a ship. Full article
(This article belongs to the Special Issue Radar and Sonar Imaging and Processing)
Show Figures

Figure 1

16 pages, 4185 KiB  
Article
Extended Dependence of the Hydrological Regime on the Land Cover Change in the Three-North Region of China: An Evaluation under Future Climate Conditions
by Yi Yao, Xianhong Xie, Shanshan Meng, Bowen Zhu, Kang Zhang and Yibing Wang
Remote Sens. 2019, 11(1), 81; https://doi.org/10.3390/rs11010081 - 4 Jan 2019
Cited by 17 | Viewed by 4092
Abstract
The hydrological regime in arid and semi-arid regions is quite sensitive to climate and land cover changes (LCC). The Three-North region (TNR) in China experiences diverse climate conditions, from arid to humid zones. In this region, substantial LCC has occurred over the past [...] Read more.
The hydrological regime in arid and semi-arid regions is quite sensitive to climate and land cover changes (LCC). The Three-North region (TNR) in China experiences diverse climate conditions, from arid to humid zones. In this region, substantial LCC has occurred over the past decades due to ecological restoration programs and urban expansion. At a regional scale, the hydrological effects of LCC have been demonstrated to be less observable than the effects of climate change, but it is unclear whether or not the effects of LCC may be intensified by future climate conditions. In this study, we employed remote sensing datasets and a macro-scale hydrological modeling to identify the dependence of the future hydrological regime of the TNR on past LCC. The hydrological effects over the period from 2020–2099 were evaluated based on a Representative Concentration Pathway climate scenario. The results indicated that the forest area increased in the northwest (11,691 km2) and the north (69 km2) of China but declined in the northeast (30,042 km2) over the past three decades. Moreover, the urban area has expanded by 1.3% in the TNR. Under the future climate condition, the hydrological regime will be influenced significantly by LCC. Those changes from 1986 to 2015 may alter the future hydrological cycle mainly by promoting runoff (3.24 mm/year) and decreasing evapotranspiration (3.23 mm/year) over the whole region. The spatial distribution of the effects may be extremely uneven: the effects in humid areas would be stronger than those in other areas. Besides, with rising temperatures and precipitation from 2020 to 2099, the LCC may heighten the risk of dryland expansion and flooding more than climate change alone. Despite uncertainties in the datasets and methods, the regional-scale hydrological model provides new insights into the extended impacts of ecological restoration and urbanization on the hydrological regime of the TNR. Full article
(This article belongs to the Special Issue Remote Sensing of the Terrestrial Hydrologic Cycle)
Show Figures

Figure 1

34 pages, 3600 KiB  
Review
Studies of General Precipitation Features with TRMM PR Data: An Extensive Overview
by Nan Li, Zhenhui Wang, Xi Chen and Geoffrey Austin
Remote Sens. 2019, 11(1), 80; https://doi.org/10.3390/rs11010080 - 4 Jan 2019
Cited by 23 | Viewed by 5026
Abstract
The Precipitation Radar (PR), the first space-borne precipitation radar onboard the Tropical Rainfall Measuring Mission (TRMM) satellite, could observe three-dimensional precipitation in global tropical regions and acquire continuous rainfall information with moderate temporal and high spatial resolutions. TRMM PR had carried out 17 [...] Read more.
The Precipitation Radar (PR), the first space-borne precipitation radar onboard the Tropical Rainfall Measuring Mission (TRMM) satellite, could observe three-dimensional precipitation in global tropical regions and acquire continuous rainfall information with moderate temporal and high spatial resolutions. TRMM PR had carried out 17 years of observations and ended collecting data in April, 2015. So far, comprehensive and abundant research results related to the application of PR data have been analyzed in the current literature, but overall precipitation features are not yet identified, a gap that this review intends to fill. Studies on comparisons with ground-based radars and rain gauges are first introduced to summarize the reliability of PR observations or estimates. Then, this paper focuses on general precipitation features abstracted from about 130 studies, from 2000 to 2018, regarding lightning analysis, latent heat retrieval, and rainfall observation by PR data. Finally, we describe the existing problems and limitations as well as the future prospects of the space-borne precipitation radar data. Full article
(This article belongs to the Section Atmospheric Remote Sensing)
Show Figures

Graphical abstract

21 pages, 9668 KiB  
Article
Road Information Extraction from High-Resolution Remote Sensing Images Based on Road Reconstruction
by Tingting Zhou, Chenglin Sun and Haoyang Fu
Remote Sens. 2019, 11(1), 79; https://doi.org/10.3390/rs11010079 - 4 Jan 2019
Cited by 27 | Viewed by 5814
Abstract
Traditional road extraction algorithms, which focus on improving the accuracy of road surfaces, cannot overcome the interference of shelter caused by vegetation, buildings, and shadows. In this paper, we extract the roads via road centerline extraction, road width extraction, broken centerline connection, and [...] Read more.
Traditional road extraction algorithms, which focus on improving the accuracy of road surfaces, cannot overcome the interference of shelter caused by vegetation, buildings, and shadows. In this paper, we extract the roads via road centerline extraction, road width extraction, broken centerline connection, and road reconstruction. We use a multiscale segmentation algorithm to segment the images, and feature extraction to get the initial road. The fast marching method (FMM) algorithm is employed to obtain the boundary distance field and the source distance field, and the branch backing-tracking method is used to acquire the initial centerline. Road width of each initial centerline is calculated by combining the boundary distance fields, before a tensor field is applied for connecting the broken centerline to gain the final centerline. The final centerline is matched with its road width when the final road is reconstructed. Three experimental results show that the proposed method improves the accuracy of the centerline and solves the problem of broken centerline, and that the method reconstructing the roads is excellent for maintain their integrity. Full article
(This article belongs to the Special Issue Remote Sensing-Based Urban Planning Indicators)
Show Figures

Figure 1

21 pages, 14214 KiB  
Article
Operational Use of Surfcam Online Streaming Images for Coastal Morphodynamic Studies
by Umberto Andriolo, Elena Sánchez-García and Rui Taborda
Remote Sens. 2019, 11(1), 78; https://doi.org/10.3390/rs11010078 - 4 Jan 2019
Cited by 33 | Viewed by 6842
Abstract
Coastal video monitoring has been proven to be a valuable shore-based remote-sensing technique to study coastal processes, as it offers the possibility of high-frequency, continuous and autonomous observations of the coastal area. However, the installation of a video systems infrastructure requires economical and [...] Read more.
Coastal video monitoring has been proven to be a valuable shore-based remote-sensing technique to study coastal processes, as it offers the possibility of high-frequency, continuous and autonomous observations of the coastal area. However, the installation of a video systems infrastructure requires economical and technical efforts, along with being often limited by logistical constraints. This study presents methodological approaches to exploit “surfcam” internet streamed images for quantitative scientific studies. Two different methodologies to collect the required ground control points (GCPs), both during fieldwork and using web tools freely available are presented, in order to establish a rigorous geometric connection between terrestrial and image spaces. The application of an image projector tool allowed the estimation of the unknown camera parameters necessary to georectify the online streamed images. Three photogrammetric procedures are shown, distinct both in the design of the computational steps and in number of GCPs available to solve the spatial resection system. Results showed the feasibility of the methodologies to generate accurate rectified planar images, with the best horizontal projection accuracy of 1.3 m compatible with that required for a quantitative analysis of coastal processes. The presented methodologies can turn “surfcam” infrastructures and any online streaming beach cam, into fully remote shore-based observational systems, fostering the use of these freely available images for the study of nearshore morphodynamics. Full article
Show Figures

Graphical abstract

23 pages, 3729 KiB  
Article
Integration of UAV, Sentinel-1, and Sentinel-2 Data for Mangrove Plantation Aboveground Biomass Monitoring in Senegal
by José Antonio Navarro, Nur Algeet, Alfredo Fernández-Landa, Jessica Esteban, Pablo Rodríguez-Noriega and María Luz Guillén-Climent
Remote Sens. 2019, 11(1), 77; https://doi.org/10.3390/rs11010077 - 3 Jan 2019
Cited by 132 | Viewed by 13652
Abstract
Due to the increasing importance of mangroves in climate change mitigation projects, more accurate and cost-effective aboveground biomass (AGB) monitoring methods are required. However, field measurements of AGB may be a challenge because of their remote location and the difficulty to walk in [...] Read more.
Due to the increasing importance of mangroves in climate change mitigation projects, more accurate and cost-effective aboveground biomass (AGB) monitoring methods are required. However, field measurements of AGB may be a challenge because of their remote location and the difficulty to walk in these areas. This study is based on the Livelihoods Fund Oceanium project that monitors 10,000 ha of mangrove plantations. In a first step, the possibility of replacing traditional field measurements of sample plots in a young mangrove plantation by a semiautomatic processing of UAV-based photogrammetric point clouds was assessed. In a second step, Sentinel-1 radar and Sentinel-2 optical imagery were used as auxiliary information to estimate AGB and its variance for the entire study area under a model-assisted framework. AGB was measured using UAV imagery in a total of 95 sample plots. UAV plot data was used in combination with non-parametric support vector regression (SVR) models for the estimation of the study area AGB using model-assisted estimators. Purely UAV-based AGB estimates and their associated standard error (SE) were compared with model-assisted estimates using (1) Sentinel-1, (2) Sentinel-2, and (3) a combination of Sentinel-1 and Sentinel-2 data as auxiliary information. The validation of the UAV-based individual tree height and crown diameter measurements showed a root mean square error (RMSE) of 0.21 m and 0.32 m, respectively. Relative efficiency of the three model-assisted scenarios ranged between 1.61 and 2.15. Although all SVR models improved the efficiency of the monitoring over UAV-based estimates, the best results were achieved when a combination of Sentinel-1 and Sentinel-2 data was used. Results indicated that the methodology used in this research can provide accurate and cost-effective estimates of AGB in young mangrove plantations. Full article
(This article belongs to the Special Issue Remote Sensing of Mangroves)
Show Figures

Graphical abstract

21 pages, 2211 KiB  
Article
Joint Learning of the Center Points and Deep Metrics for Land-Use Classification in Remote Sensing
by Zhiqiang Gong, Ping Zhong, Weidong Hu and Yuming Hua
Remote Sens. 2019, 11(1), 76; https://doi.org/10.3390/rs11010076 - 3 Jan 2019
Cited by 20 | Viewed by 4463
Abstract
Deep learning methods, especially convolutional neural networks (CNNs), have shown remarkable ability for remote sensing scene classification. However, the traditional training process of standard CNNs only takes the point-wise penalization of the training samples into consideration, which usually makes the learned CNNs sub-optimal [...] Read more.
Deep learning methods, especially convolutional neural networks (CNNs), have shown remarkable ability for remote sensing scene classification. However, the traditional training process of standard CNNs only takes the point-wise penalization of the training samples into consideration, which usually makes the learned CNNs sub-optimal especially for remote sensing scenes with large intra-class variance and low inter-class variance. To address this problem, deep metric learning, which incorporates the metric learning into the deep model, is used to maximize the inter-class variance and minimize the intra-class variance for better representation. This work introduces structured metric learning for remote sensing scene representation, a special deep metric learning which can take full advantage of the training batch. However, the deep metrics only consider the pairwise correlation between the training samples, and ignores the classwise correlation from the class view. To take the classwise penalization into consideration, this work defines the center points of the learned features of each class in the training process to represent the class. Through increasing the variance between different center points and decreasing the variance between the learned features from each class and the corresponding center point, the representational ability can be further improved. Therefore, this work develops a novel center-based structured metric learning to take advantage of both the deep metrics and the center points. Finally, joint supervision of the cross-entropy loss and the center-based structured metric learning is developed for the land-use classification in remote sensing. It can joint learn the center points and the deep metrics to take advantage of the point-wise, the pairwise, and the classwise correlation. Experiments are conducted over three real-world remote sensing scene datasets, namely UC Merced Land-Use dataset, Brazilian Coffee Scene dataset, and Google dataset. The classification performance can achieve 97.30%, 91.24%, and 92.04% with the proposed method over the three datasets which are better than other state-of-the-art methods under the same experimental setups. The results demonstrate that the proposed method can improve the representational ability for the remote sensing scenes. Full article
Show Figures

Figure 1

18 pages, 3791 KiB  
Article
Efficient Numerical Full-Polarized Facet-Based Model for EM Scattering from Rough Sea Surface within a Wide Frequency Range
by Jinxing Li, Min Zhang, Ye Zhao and Wangqiang Jiang
Remote Sens. 2019, 11(1), 75; https://doi.org/10.3390/rs11010075 - 3 Jan 2019
Cited by 7 | Viewed by 3709
Abstract
A full-polarized facet based scattering model (FPFSM) for investigating the electromagnetic (EM) scattering by two-dimensional electrically large sea surfaces with high efficiency at high microwave bands is proposed. For this method, the scattering field over a large sea facet in a diffuse scattering [...] Read more.
A full-polarized facet based scattering model (FPFSM) for investigating the electromagnetic (EM) scattering by two-dimensional electrically large sea surfaces with high efficiency at high microwave bands is proposed. For this method, the scattering field over a large sea facet in a diffuse scattering region is numerically deduced according to the Bragg scattering mechanism. In regard to near specular directions, a novel approach is proposed to calculate the scattered field from a sea surface based on the second order small slope approximation (SSA-II), which saves computer memory considerably and is able to analyze the EM scattering by electrically large sea surfaces. The feasibility of this method in evaluating the radar returns from the sea surface is proved by comparing the normalized radar cross sections (NRCS) and the Doppler spectrum with the SSA-II. Then NRCS results in monostatic and bistatic configurations under different polarization states, scattering angles and wind speeds are analyzed as well as the Doppler spectrum at Ka-band. Numerical results show that the FPFSM is a reliable and efficient method to analyze the full-polarized scattering characteristics from electrically large sea surface within a wide frequency range. Full article
(This article belongs to the Special Issue Radar Remote Sensing of Oceans and Coastal Areas)
Show Figures

Graphical abstract

13 pages, 1121 KiB  
Technical Note
Detection of Glacier Calving Margins with Convolutional Neural Networks: A Case Study
by Yara Mohajerani, Michael Wood, Isabella Velicogna and Eric Rignot
Remote Sens. 2019, 11(1), 74; https://doi.org/10.3390/rs11010074 - 3 Jan 2019
Cited by 61 | Viewed by 9651
Abstract
The continuous and precise mapping of glacier calving fronts is essential for monitoring and understanding rapid glacier changes in Antarctica and Greenland, which have the potential for significant sea level rise within the current century. This effort has been mostly restricted to the [...] Read more.
The continuous and precise mapping of glacier calving fronts is essential for monitoring and understanding rapid glacier changes in Antarctica and Greenland, which have the potential for significant sea level rise within the current century. This effort has been mostly restricted to the slow and painstaking manual digitalization of the calving front positions in thousands of satellite imagery products. Here, we have developed a machine learning toolkit to automatically detect glacier calving front margins in satellite imagery. The toolkit is based on semantic image segmentation using Convolutional Neural Networks (CNN) with a modified U-Net architecture to isolate the calving fronts from satellite images after having been trained with a dataset of images and their corresponding manually-determined calving fronts. As a case study we train our neural network on a varied set of Landsat images with lowered resolutions from Jakobshavn, Sverdrup, and Kangerlussuaq glaciers, Greenland and test the results on images from Helheim glacier, Greenland to evaluate the performance of the approach. The neural network is able to identify the calving front in new images with a mean deviation of 96.3 m from the true fronts, equivalent to 1.97 pixels on average, while the corresponding error for manually-determined fronts on the same resolution images is 92.5 m (1.89 pixels). We find that the trained neural network significantly outperforms common edge detection techniques, and can be used to continuously map out calving-ice fronts with a variety of data products. Full article
Show Figures

Graphical abstract

24 pages, 8704 KiB  
Article
Indoor Topological Localization Using a Visual Landmark Sequence
by Jiasong Zhu, Qing Li, Rui Cao, Ke Sun, Tao Liu, Jonathan M. Garibaldi, Qingquan Li, Bozhi Liu and Guoping Qiu
Remote Sens. 2019, 11(1), 73; https://doi.org/10.3390/rs11010073 - 3 Jan 2019
Cited by 17 | Viewed by 5932
Abstract
This paper presents a novel indoor topological localization method based on mobile phone videos. Conventional methods suffer from indoor dynamic environmental changes and scene ambiguity. The proposed Visual Landmark Sequence-based Indoor Localization (VLSIL) method is capable of addressing problems by taking steady indoor [...] Read more.
This paper presents a novel indoor topological localization method based on mobile phone videos. Conventional methods suffer from indoor dynamic environmental changes and scene ambiguity. The proposed Visual Landmark Sequence-based Indoor Localization (VLSIL) method is capable of addressing problems by taking steady indoor objects as landmarks. Unlike many feature or appearance matching-based localization methods, our method utilizes highly abstracted landmark sematic information to represent locations and thus is invariant to illumination changes, temporal variations, and occlusions. We match consistently detected landmarks against the topological map based on the occurrence order in the videos. The proposed approach contains two components: a convolutional neural network (CNN)-based landmark detector and a topological matching algorithm. The proposed detector is capable of reliably and accurately detecting landmarks. The other part is the matching algorithm built on the second order hidden Markov model and it can successfully handle the environmental ambiguity by fusing sematic and connectivity information of landmarks. To evaluate the method, we conduct extensive experiments on the real world dataset collected in two indoor environments, and the results show that our deep neural network-based indoor landmark detector accurately detects all landmarks and is expected to be utilized in similar environments without retraining and that VLSIL can effectively localize indoor landmarks. Full article
(This article belongs to the Special Issue Mobile Mapping Technologies)
Show Figures

Figure 1

Previous Issue
Back to TopTop