Next Issue
Volume 14, January-1
Previous Issue
Volume 13, December-1
 
 
remotesensing-logo

Journal Browser

Journal Browser

Remote Sens., Volume 13, Issue 24 (December-2 2021) – 227 articles

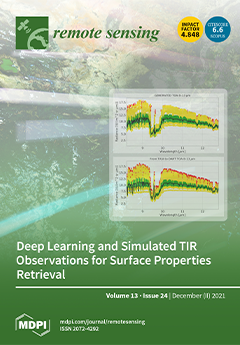
Cover Story (view full-size image): The availability of huge datasets of satellite remote sensing measurements has fostered the development of fast, efficient retrieval codes. Deep learning techniques were recently applied to satellite retrievals. Forward models are a fundamental part of retrieval code development and mission design. However, the application of deep learning techniques to radiative transfer simulations is still underexplored. Here, deep learning techniques are applied to the design of the retrieval chain of an upcoming satellite mission, LSTM, a candidate for Sentinel 9: they are used to generate spectral features and analyze simulated observations. The performance of deep learning algorithms shows promising results for the production of both simulated spectra and parameter retrievals, one of the main advances being the reduction in computational costs.View this paper
  • Issues are regarded as officially published after their release is announced to the table of contents alert mailing list.
  • You may sign up for e-mail alerts to receive table of contents of newly released issues.
  • PDF is the official format for papers published in both, html and pdf forms. To view the papers in pdf format, click on the "PDF Full-text" link, and use the free Adobe Reader to open them.
Order results
Result details
Section
Select all
Export citation of selected articles as:
17 pages, 16605 KiB  
Article
Toward a Simple and Generic Approach for Identifying Multi-Year Cotton Cropping Patterns Using Landsat and Sentinel-2 Time Series
by Qiqi Li, Guilin Liu and Weijia Chen
Remote Sens. 2021, 13(24), 5183; https://doi.org/10.3390/rs13245183 - 20 Dec 2021
Cited by 7 | Viewed by 3748
Abstract
The sustainable development goals of the United Nations, as well as the era of pandemics have introduced serious challenges for agricultural production and management. Precise management of agricultural practices based on satellite-borne remote sensing has been considered an effective means for monitoring cropping [...] Read more.
The sustainable development goals of the United Nations, as well as the era of pandemics have introduced serious challenges for agricultural production and management. Precise management of agricultural practices based on satellite-borne remote sensing has been considered an effective means for monitoring cropping patterns and crop-farming patterns. Therefore, we proposed a simple and generic approach to identify multi-year cotton-cropping patterns based on time series of Landsat and Sentinel-2 images, with few ground samples that covered many years, a simple classification algorithm, and had a high classification accuracy. In this approach, we extended the size of training samples using active learning, and we employed a random forest algorithm to extract multi-year cotton planting patterns based on dense time series of Landsat and Sentinel-2 data from 2014 to 2018. We created annual crop cultivation maps based on training samples with an accuracy greater than 95.69%. The accuracy of multi-year cotton cropping patterns was 96.93%. The proposed approach was effective and robust in identifying multi-year cropping patterns, and it could be applied in other regions. Full article
(This article belongs to the Special Issue Remote Sensing Applications in Agricultural Ecosystems)
Show Figures

Figure 1

22 pages, 128572 KiB  
Article
Deep Learning-Based Object Detection System for Identifying Weeds Using UAS Imagery
by Aaron Etienne, Aanis Ahmad, Varun Aggarwal and Dharmendra Saraswat
Remote Sens. 2021, 13(24), 5182; https://doi.org/10.3390/rs13245182 - 20 Dec 2021
Cited by 32 | Viewed by 5911
Abstract
Current methods of broadcast herbicide application cause a negative environmental and economic impact. Computer vision methods, specifically those related to object detection, have been reported to aid in site-specific weed management procedures for targeted herbicide application within a field. However, a major challenge [...] Read more.
Current methods of broadcast herbicide application cause a negative environmental and economic impact. Computer vision methods, specifically those related to object detection, have been reported to aid in site-specific weed management procedures for targeted herbicide application within a field. However, a major challenge to developing a weed detection system is the requirement for a properly annotated database to differentiate between weeds and crops under field conditions. This research involved creating an annotated database of 374 red, green, and blue (RGB) color images organized into monocot and dicot weed classes. The images were acquired from corn and soybean research plots located in north-central Indiana using an unmanned aerial system (UAS) flown at 30 and 10 m heights above ground level (AGL). A total of 25,560 individual weed instances were manually annotated. The annotated database consisted of four different subsets (Training Image Sets 1–4) to train the You Only Look Once version 3 (YOLOv3) deep learning model for five separate experiments. The best results were observed with Training Image Set 4, consisting of images acquired at 10 m AGL. For monocot and dicot weeds, respectively, an average precision (AP) score of 91.48 % and 86.13% was observed at a 25% IoU threshold (AP @ T = 0.25), as well as 63.37% and 45.13% at a 50% IoU threshold (AP @ T = 0.5). This research has demonstrated a need to develop large, annotated weed databases to evaluate deep learning models for weed identification under field conditions. It also affirms the findings of other limited research studies utilizing object detection for weed identification under field conditions. Full article
(This article belongs to the Special Issue Advances of Remote Sensing in Precision Agriculture)
Show Figures

Figure 1

15 pages, 2654 KiB  
Article
Using CYGNSS Data to Map Flood Inundation during the 2021 Extreme Precipitation in Henan Province, China
by Shuangcheng Zhang, Zhongmin Ma, Zhenhong Li, Pengfei Zhang, Qi Liu, Yang Nan, Jingjiang Zhang, Shengwei Hu, Yuxuan Feng and Hebin Zhao
Remote Sens. 2021, 13(24), 5181; https://doi.org/10.3390/rs13245181 - 20 Dec 2021
Cited by 46 | Viewed by 4726
Abstract
On 20 July 2021, parts of China’s Henan Province received the highest precipitation levels ever recorded in the region. Floods caused by heavy rainfall resulted in hundreds of casualties and tens of billions of dollars’ worth of property loss. Due to the highly [...] Read more.
On 20 July 2021, parts of China’s Henan Province received the highest precipitation levels ever recorded in the region. Floods caused by heavy rainfall resulted in hundreds of casualties and tens of billions of dollars’ worth of property loss. Due to the highly dynamic nature of flood disasters, rapid and timely spatial monitoring is conducive for early disaster prevention, mid-term disaster relief, and post-disaster reconstruction. However, existing remote sensing satellites cannot provide high-resolution flood monitoring results. Seeing as spaceborne global navigation satellite system-reflectometry (GNSS-R) can observe the Earth’s surface with high temporal and spatial resolutions, it is expected to provide a new solution to the problem of flood hazards. Here, using the Cyclone Global Navigation Satellite System (CYGNSS) L1 data, we first counted various signal-to-noise ratios and the corresponding reflectivity to surface features in Henan Province. Subsequently, we analyzed changes in the delay-Doppler map of CYGNSS when the observed area was submerged and not submerged. Finally, we determined the submerged area affected by extreme precipitation using the threshold detection method. The results demonstrated that the flood range retrieved by CYGNSS agreed with that retrieved by the Soil Moisture Active Passive (SMAP) mission and the precipitation data retrieved and measured by the Global Precipitation Measurement mission and meteorological stations. Compared with the SMAP results, those obtained by CYGNSS have a higher spatial resolution and can monitor changes in the areas affected by the floods over a shorter period. Full article
(This article belongs to the Special Issue Recent Advances in GNSS Reflectometry)
Show Figures

Graphical abstract

14 pages, 7173 KiB  
Technical Note
Tropospheric Attenuation in GeoSurf Satellite Constellations
by Emilio Matricciani, Carlo Riva and Lorenzo Luini
Remote Sens. 2021, 13(24), 5180; https://doi.org/10.3390/rs13245180 - 20 Dec 2021
Cited by 5 | Viewed by 2312
Abstract
In GeoSurf satellite constellations, any transmitter/receiver, wherever it is located, is linked to a satellite with zenith paths. We have studied the tropospheric attenuation predicted for some reference sites (Canberra, Holmdel, Pasadena, Robledo, and Spino d’Adda), which also set the meridian along which [...] Read more.
In GeoSurf satellite constellations, any transmitter/receiver, wherever it is located, is linked to a satellite with zenith paths. We have studied the tropospheric attenuation predicted for some reference sites (Canberra, Holmdel, Pasadena, Robledo, and Spino d’Adda), which also set the meridian along which we have considered sites with latitudes ranging between 60° N and 60° S. At the annual probability of 1% of an average year, in the latitude between 30° N and 30° S, there are no significant differences between GEO slant paths and GeoSurf zenith paths. On the contrary, at 0.1% and 0.01% annual probabilities, large differences are found for latitudes greater than 30° N or 30° S. For comparing the tropospheric attenuation in GeoSurf paths with that expected in LEO highly variable slant paths, we have considered, as reference, a LEO satellite constellation orbiting in circular at 817 km. GeoSurf zenith paths “gain” several dBs compared to LEO slant paths. The more static total clear-sky attenuation (water vapor, oxygen, and clouds) in both GEO and LEO slant paths shows larger values than GeoSurf zenith paths. Both for rain and clear-sky attenuations, Northern and Southern Hemispheres show significant differences. Full article
Show Figures

Figure 1

16 pages, 2326 KiB  
Article
Susceptibility of East Asian Marine Warm Clouds to Aerosols in Winter and Spring from Co-Located A-Train Satellite Observations
by Chiao-Wei Chang, Wei-Ting Chen and Yi-Chun Chen
Remote Sens. 2021, 13(24), 5179; https://doi.org/10.3390/rs13245179 - 20 Dec 2021
Cited by 1 | Viewed by 2576
Abstract
We constructed the A-Train co-located aerosol and marine warm cloud data from 2006 to 2010 winter and spring over East Asia and investigated the sensitivities of single-layer warm cloud properties to aerosols under different precipitation statuses and environmental regimes. The near-surface stability (NSS), [...] Read more.
We constructed the A-Train co-located aerosol and marine warm cloud data from 2006 to 2010 winter and spring over East Asia and investigated the sensitivities of single-layer warm cloud properties to aerosols under different precipitation statuses and environmental regimes. The near-surface stability (NSS), modulated by cold air on top of a warm surface, and the estimated inversion strength (EIS) controlled by the subsidence are critical environmental parameters affecting the marine warm cloud structure over East Asia and, thus, the aerosols–cloud interactions. Based on our analysis, precipitating clouds revealed higher cloud susceptibility to aerosols as compared to non-precipitating clouds. The cloud liquid water path (LWP) increased with aerosols for precipitating clouds, yet decreased with aerosols for non-precipitating clouds, consistent with previous studies. For precipitating clouds, the cloud LWP and albedo increased more under higher NSS as unstable air promotes more moisture flux from the ocean. Under stronger EIS, the cloud albedo response to aerosols was lower than that under weaker EIS, indicating that stronger subsidence weakens the cloud susceptibility due to more entrainment drying. Our study suggests that the critical environmental factors governing the aerosol–cloud interactions may vary for different oceanic regions, depending on the thermodynamic conditions. Full article
(This article belongs to the Section Atmospheric Remote Sensing)
Show Figures

Figure 1

16 pages, 28707 KiB  
Article
Electromagnetic Scattering of Near-Field Turbulent Wake Generated by Accelerated Propeller
by Yuxin Deng, Min Zhang, Wangqiang Jiang and Letian Wang
Remote Sens. 2021, 13(24), 5178; https://doi.org/10.3390/rs13245178 - 20 Dec 2021
Cited by 3 | Viewed by 2701
Abstract
The electromagnetic scattering study of the turbulent wake of a moving ship has important application value in target recognition and tracking. However, to date, there has been insufficient research into the electromagnetic characteristics of near-field propeller turbulence. This study presents a new procedure [...] Read more.
The electromagnetic scattering study of the turbulent wake of a moving ship has important application value in target recognition and tracking. However, to date, there has been insufficient research into the electromagnetic characteristics of near-field propeller turbulence. This study presents a new procedure for evaluating the electromagnetic scattering coefficient and imaging characteristics of turbulent wakes in the near field. By controlling the different values of the net momenta, a turbulent wake was generated using the large-eddy simulation method. The results show that the net momentum transferred to the background flow field determines the development of the turbulent wake, which explains the formation mechanism of the turbulence. Combined with the turbulent energy attenuation spectrum, the electromagnetic scattering characteristics of the turbulent wake were calculated using the two-scale facet mode. Using this method, the impact of different parameters on the scattering coefficient and the electromagnetic image of the turbulence wake were investigated, to explain the modulation mechanism and electromagnetic imaging characteristics of the near-field turbulent wake. Moreover, an application for estimating a ship’s heading is proposed based on the electromagnetic imaging characteristics of the turbulent wake. Full article
Show Figures

Figure 1

18 pages, 807 KiB  
Article
Mapping Large-Scale Forest Disturbance Types with Multi-Temporal CNN Framework
by Xi Chen, Wenzhi Zhao, Jiage Chen, Yang Qu, Dinghui Wu and Xuehong Chen
Remote Sens. 2021, 13(24), 5177; https://doi.org/10.3390/rs13245177 - 20 Dec 2021
Cited by 10 | Viewed by 3363
Abstract
Forests play a vital role in combating gradual developmental deficiencies and balancing regional ecosystems, yet they are constantly disturbed by man-made or natural events. Therefore, developing a timely and accurate forest disturbance detection strategy is urgently needed. The accuracy of traditional detection algorithms [...] Read more.
Forests play a vital role in combating gradual developmental deficiencies and balancing regional ecosystems, yet they are constantly disturbed by man-made or natural events. Therefore, developing a timely and accurate forest disturbance detection strategy is urgently needed. The accuracy of traditional detection algorithms depends on the selection of thresholds or the formulation of complete rules, which inevitably reduces the accuracy and automation level of detection. In this paper, we propose a new multitemporal convolutional network framework (MT-CNN). It is an integrated method that can realize long-term, large-scale forest interference detection and distinguish the types (forest fire and harvest/deforestation) of disturbances without human intervention. Firstly, it uses the sliding window technique to calculate an adaptive threshold to identify potential interference points, and then a multitemporal CNN network is designed to render the disturbance types with various disturbance duration periods. To illustrate the detection accuracy of MT-CNN, we conducted experiments in a large-scale forest area (about 990 km2) on the west coast of the United States (including northwest California and west Oregon) with long time-series Landsat data from 1986 to 2020. Based on the manually annotated labels, the evaluation results show that the overall accuracies of disturbance point detection and disturbance type recognition reach 90%. Also, this method is able to detect multiple disturbances that continuously occurred in the same pixel. Moreover, we found that forest disturbances that caused forest fire repeatedly appear without a significant coupling effect with annual temporal and precipitation variations. Potentially, our method is able to provide large-scale forest disturbance mapping with detailed disturbance information to support forest inventory management and sustainable development. Full article
Show Figures

Figure 1

20 pages, 5183 KiB  
Article
Monitoring Small Water Bodies Using High Spatial and Temporal Resolution Analysis Ready Datasets
by Vinicius Perin, Samapriya Roy, Joe Kington, Thomas Harris, Mirela G. Tulbure, Noah Stone, Torben Barsballe, Michele Reba and Mary A. Yaeger
Remote Sens. 2021, 13(24), 5176; https://doi.org/10.3390/rs13245176 - 20 Dec 2021
Cited by 7 | Viewed by 3962
Abstract
Basemap and Planet Fusion—derived from PlanetScope imagery—represent the next generation of analysis ready datasets that minimize the effects of the presence of clouds. These datasets have high spatial (3 m) and temporal (daily) resolution, which provides an unprecedented opportunity to improve the monitoring [...] Read more.
Basemap and Planet Fusion—derived from PlanetScope imagery—represent the next generation of analysis ready datasets that minimize the effects of the presence of clouds. These datasets have high spatial (3 m) and temporal (daily) resolution, which provides an unprecedented opportunity to improve the monitoring of on-farm reservoirs (OFRs)—small water bodies that store freshwater and play important role in surface hydrology and global irrigation activities. In this study, we assessed the usefulness of both datasets to monitor sub-weekly surface area changes of 340 OFRs in eastern Arkansas, USA, and we evaluated the datasets main differences when used to monitor OFRs. When comparing the OFRs surface area derived from Basemap and Planet Fusion to an independent validation dataset, both datasets had high agreement (r2 ≥ 0.87), and small uncertainties, with a mean absolute percent error (MAPE) between 7.05% and 10.08%. Pairwise surface area comparisons between the two datasets and the PlanetScope imagery showed that 61% of the OFRs had r2 ≥ 0.55, and 70% of the OFRs had MAPE <5%. In general, both datasets can be employed to monitor OFRs sub-weekly surface area changes, and Basemap had higher surface area variability and was more susceptible to the presence of cloud shadows and haze when compared to Planet Fusion, which had a smoother time series with less variability and fewer abrupt changes throughout the year. The uncertainties in surface area classification decreased as the OFRs increased in size. In addition, the surface area time series can have high variability, depending on the OFR environmental conditions (e.g., presence of vegetation inside the OFR). Our findings suggest that both datasets can be used to monitor OFRs sub-weekly, seasonal, and inter-annual surface area changes; therefore, these datasets can help improve freshwater management by allowing better assessment and management of the OFRs. Full article
(This article belongs to the Topic Water Management in the Era of Climatic Change)
Show Figures

Graphical abstract

19 pages, 5547 KiB  
Article
Statistical Study of Ionospheric Equivalent Slab Thickness at Guam Magnetic Equatorial Location
by Yuqiang Zhang, Zhensen Wu, Jian Feng, Tong Xu, Zhongxin Deng, Ming Ou, Wen Xiong and Weimin Zhen
Remote Sens. 2021, 13(24), 5175; https://doi.org/10.3390/rs13245175 - 20 Dec 2021
Cited by 5 | Viewed by 2832
Abstract
The ionospheric equivalent slab thickness (τ) is defined as the ratio of the total electron content (TEC) to the F2-layer peak electron density (NmF2), and it is a significant parameter representative of the ionosphere. In this paper, a comprehensive statistical analysis [...] Read more.
The ionospheric equivalent slab thickness (τ) is defined as the ratio of the total electron content (TEC) to the F2-layer peak electron density (NmF2), and it is a significant parameter representative of the ionosphere. In this paper, a comprehensive statistical analysis of the diurnal, seasonal, solar, and magnetic activity variations in the τ at Guam (144.86°E, 13.62°N, 5.54°N dip lat), which is located near the magnetic equator, is presented using the GPS-TEC and ionosonde NmF2 data during the years 2012–2017. It is found that, for geomagnetically quiet days, the τ reaches its maximum value in the noontime, and the peak value in winter and at the equinox are larger than that in summer. Moreover, there is a post-sunset peak observed in the winter and equinox, and the τ during the post-midnight period is smallest in equinox. The mainly diurnal and seasonal variation of τ can be explained within the framework of relative variation of TEC and NmF2 during different seasonal local time. The dependence of τ on the solar activity shows positive correlation during the daytime, and the opposite situation applies for the nighttime. Specifically, the disturbance index (DI), which can visually assess the relationship between instantaneous τ values and the median, is introduced in the paper to quantitatively describe the overall pattern of the geomagnetic storm effect on the τ variation. The results show that the geomagnetic storm seems to have positive effect on the τ during most of the storm-time period at Guam. An example, on the 1 June 2013, is also presented to analyze the physical mechanism. During the positive storms, the penetration electric field, along with storm time equator-ward neutral wind, tends to increase upward drift and uplift F region, causing the large increase in TEC, accompanied by a relatively small increase in NmF2. On the other hand, an enhanced equatorward wind tends to push more plasma, at low latitudes, into the topside ionosphere in the equatorial region, resulting in the TEC not undergoing severe depletion, as with NmF2, during the negative storms. The results would complement the analysis of τ behavior during quiet and disturbed conditions at equatorial latitudes in East Asia. Full article
(This article belongs to the Special Issue Ionosphere Monitoring with Remote Sensing)
Show Figures

Figure 1

24 pages, 84000 KiB  
Article
Real-Time Tephra Detection and Dispersal Forecasting by a Ground-Based Weather Radar
by Magfira Syarifuddin, Susanna F. Jenkins, Ratih Indri Hapsari, Qingyuan Yang, Benoit Taisne, Andika Bayu Aji, Nurnaning Aisyah, Hanggar Ganara Mawandha and Djoko Legono
Remote Sens. 2021, 13(24), 5174; https://doi.org/10.3390/rs13245174 - 20 Dec 2021
Cited by 1 | Viewed by 3111
Abstract
Tephra plumes can cause a significant hazard for surrounding towns, infrastructure, and air traffic. The current work presents the use of a small and compact X-band multi-parameter (X-MP) radar for the remote tephra detection and tracking of two eruptive events at Merapi Volcano, [...] Read more.
Tephra plumes can cause a significant hazard for surrounding towns, infrastructure, and air traffic. The current work presents the use of a small and compact X-band multi-parameter (X-MP) radar for the remote tephra detection and tracking of two eruptive events at Merapi Volcano, Indonesia, in May and June 2018. Tephra detection was performed by analysing the multiple parameters of radar: copolar correlation and reflectivity intensity factor. These parameters were used to cancel unwanted clutter and retrieve tephra properties, which are grain size and concentration. Real-time spatial and temporal forecasting of tephra dispersal was performed by applying an advection scheme (nowcasting) in the manner of an ensemble prediction system (EPS). Cross-validation was performed using field-survey data, radar observations, and Himawari-8 imageries. The nowcasting model computed both the displacement and growth and decaying rate of the plume based on the temporal changes in two-dimensional movement and tephra concentration, respectively. Our results are in agreement with ground-based data, where the radar-based estimated grain size distribution falls within the range of in situ grain size. The uncertainty of real-time forecasted tephra plume depends on the initial condition, which affects the growth and decaying rate estimation. The EPS improves the predictability rate by reducing the number of missed and false forecasted events. Our findings and the method presented here are suitable for early warning of tephra fall hazard at the local scale. Full article
Show Figures

Graphical abstract

21 pages, 9352 KiB  
Article
A Comparison of UAV RGB and Multispectral Imaging in Phenotyping for Stay Green of Wheat Population
by Xiaofeng Cao, Yulin Liu, Rui Yu, Dejun Han and Baofeng Su
Remote Sens. 2021, 13(24), 5173; https://doi.org/10.3390/rs13245173 - 20 Dec 2021
Cited by 16 | Viewed by 4256
Abstract
High throughput phenotyping (HTP) for wheat (Triticum aestivum L.) stay green (SG) is expected in field breeding as SG is a beneficial phenotype for wheat high yield and environment adaptability. The RGB and multispectral imaging based on the unmanned aerial vehicle (UAV) [...] Read more.
High throughput phenotyping (HTP) for wheat (Triticum aestivum L.) stay green (SG) is expected in field breeding as SG is a beneficial phenotype for wheat high yield and environment adaptability. The RGB and multispectral imaging based on the unmanned aerial vehicle (UAV) are widely popular multi-purpose HTP platforms for crops in the field. The purpose of this study was to compare the potential of UAV RGB and multispectral images (MSI) in SG phenotyping of diversified wheat germplasm. The multi-temporal images of 450 samples (406 wheat genotypes) were obtained and the color indices (CIs) from RGB and MSI and spectral indices (SIs) from MSI were extracted, respectively. The four indices (CIs in RGB, CIs in MSI, SIs in MSI, and CIs + SIs in MSI) were used to detect four SG stages, respectively, by machine learning classifiers. Then, all indices’ dynamics were analyzed and the indices that varied monotonously and significantly were chosen to calculate wheat temporal stay green rates (SGR) to quantify the SG in diverse genotypes. The correlations between indices’ SGR and wheat yield were assessed and the dynamics of some indices’ SGR with different yield correlations were tracked in three visual observed SG grades samples. In SG stage detection, classifiers best average accuracy reached 93.20–98.60% and 93.80–98.80% in train and test set, respectively, and the SIs containing red edge or near-infrared band were more effective than the CIs calculated only by visible bands. Indices’ temporal SGR could quantify SG changes on a population level, but showed some differences in the correlation with yield and in tracking visual SG grades samples. In SIs, the SGR of Normalized Difference Red-edge Index (NDRE), Red-edge Chlorophyll Index (CIRE), and Normalized Difference Vegetation Index (NDVI) in MSI showed high correlations with yield and could track visual SG grades at an earlier stage of grain filling. In CIs, the SGR of Normalized Green Red Difference Index (NGRDI), the Green Leaf Index (GLI) in RGB and MSI showed low correlations with yield and could only track visual SG grades at late grain filling stage and that of Norm Red (NormR) in RGB images failed to track visual SG grades. This study preliminarily confirms the MSI is more available and reliable than RGB in phenotyping for wheat SG. The index-based SGR in this study could act as HTP reference solutions for SG in diversified wheat genotypes. Full article
(This article belongs to the Section Remote Sensing in Agriculture and Vegetation)
Show Figures

Figure 1

16 pages, 3704 KiB  
Article
A Four-Step Method for Estimating Suspended Particle Size Based on In Situ Comprehensive Observations in the Pearl River Estuary in China
by Zuomin Wang, Shuibo Hu, Qingquan Li, Huizeng Liu, Xiaomei Liao and Guofeng Wu
Remote Sens. 2021, 13(24), 5172; https://doi.org/10.3390/rs13245172 - 20 Dec 2021
Cited by 6 | Viewed by 3048
Abstract
The suspended particle size has great impacts on marine biology environments and biogeochemical processes, such as the settling rates of particles and sunlight transmission in marine water. However, the spatial–temporal variations in particle sizes in coastal waters are rarely reported due to the [...] Read more.
The suspended particle size has great impacts on marine biology environments and biogeochemical processes, such as the settling rates of particles and sunlight transmission in marine water. However, the spatial–temporal variations in particle sizes in coastal waters are rarely reported due to the paucity of appropriate observations and the limitations of particle size retrieval methods, especially in areas with complex optical properties. This study proposed a remote sensing-based method for estimating the median particle size Dv50 (calculated with a size range of 2.05–297 μm) that correlates Dv50 with the inherent optical properties (IOPs) retrieved from in situ remote sensing reflectance above the water’s surface (Rrs(λ)) in the Pearl River estuary (PRE) in China. Rrs(λ) was resampled to simulate the Multispectral Instrument (MSI) onboard Sentinel-2A/B, and the wavebands in 490, 560, and 705 nm were utilized for the retrieval of the IOPs. The results of this method had a statistical performance of 0.86, 18.52, 21.28%, and −1.85 for the R2, RMSE, MAPE, and bias values, respectively, in validation, which indicated that Dv50 could be estimated by Rrs(λ) with the proposed four-step method. Then, the proposed method was applied to Sentinel-2 MSI imagery, and a clear difference in Dv50 distribution which was retrieved from a different time could be seen. The proposed method holds great potential for monitoring the suspended particle size of coastal waters. Full article
(This article belongs to the Special Issue Remote Sensing Monitoring of Ocean and Coastal Biogeochemistry)
Show Figures

Figure 1

19 pages, 19674 KiB  
Article
Protection Effect and Vacancy of the Ecological Protection Redline: A Case Study in Guangdong–Hong Kong–Macao Greater Bay Area, China
by Xiuming Wang, Youyue Wen, Xucheng Liu, Ding Wen, Yingxian Long, Peng Zhao, Piao Liu and Jenny Zhong
Remote Sens. 2021, 13(24), 5171; https://doi.org/10.3390/rs13245171 - 20 Dec 2021
Cited by 18 | Viewed by 3991
Abstract
The Ecological Protection Redline (EPR) is an innovative measure implemented in China to maintain the structural stability and functional security of the ecosystem. By prohibiting large-scale urban and industrial construction activities, EPR is regarded as the “lifeline” to ensure national ecological security. It [...] Read more.
The Ecological Protection Redline (EPR) is an innovative measure implemented in China to maintain the structural stability and functional security of the ecosystem. By prohibiting large-scale urban and industrial construction activities, EPR is regarded as the “lifeline” to ensure national ecological security. It is of great practical significance to scientifically evaluate the protection effect of EPR and identify the protection vacancies. However, current research has focused only on the protection effects of the EPR on ecosystem services (ESs), and the protection effect of the EPR on ecological connectivity remains poorly understood. Based on an evaluation of ES importance, the circuit model, and hotspot analysis, this paper identified the ecological security pattern in Guangdong–Hong Kong–Macao Greater Bay Area (GBA), analyzed the role of EPR in maintaining ES and ecological connectivity, and identified protection gaps. The results were as follows: (1) The ecological sources were mainly distributed in mountainous areas of the GBA. The ecological sources and ecological corridors constitute a circular ecological shelter surrounding the urban agglomeration of the GBA. (2) The EPR effectively protected water conservation, soil conservation, and biodiversity maintenance services, but the protection efficiency of carbon sequestration service and ecological connectivity were low. In particularly, EPR failed to continuously protect regional large-scale ecological corridors and some important stepping stones. (3) The protection gaps of carbon sequestration service and ecological connectivity in the study area reached 1099.80 km2 and 2175.77 km2, respectively, mainly distributed in Qingyuan, Yunfu, and Huizhou. In future EPR adjustments, important areas for carbon sequestration service and ecological connectivity maintenance should be included. This study provides a comprehensive understanding of the protection effects of EPR on ecological structure and function, and it has produced significant insights into improvements of the EPR policy. In addition, this paper proposes that the scope of resistance surface should be extended, which would improve the rationality of the ecological corridor simulation. Full article
Show Figures

Figure 1

26 pages, 2191 KiB  
Article
Estimating Stand and Fire-Related Surface and Canopy Fuel Variables in Pine Stands Using Low-Density Airborne and Single-Scan Terrestrial Laser Scanning Data
by Cecilia Alonso-Rego, Stéfano Arellano-Pérez, Juan Guerra-Hernández, Juan Alberto Molina-Valero, Adela Martínez-Calvo, César Pérez-Cruzado, Fernando Castedo-Dorado, Eduardo González-Ferreiro, Juan Gabriel Álvarez-González and Ana Daría Ruiz-González
Remote Sens. 2021, 13(24), 5170; https://doi.org/10.3390/rs13245170 - 20 Dec 2021
Cited by 21 | Viewed by 3570
Abstract
In this study, we used data from a thinning trial conducted on 34 different sites and 102 sample plots established in pure and even-aged Pinus radiata and Pinus pinaster stands, to test the potential use of low-density airborne laser scanning (ALS) metrics and [...] Read more.
In this study, we used data from a thinning trial conducted on 34 different sites and 102 sample plots established in pure and even-aged Pinus radiata and Pinus pinaster stands, to test the potential use of low-density airborne laser scanning (ALS) metrics and terrestrial laser scanning (TLS) metrics to provide accurate estimates of variables related to surface and canopy fires. An exhaustive field inventory was carried out in each plot to estimate the main stand variables and the main variables related to fire hazard: surface fuel loads by layers, fuel strata gap, surface fuel height, stand mean height, canopy base height, canopy fuel load and canopy bulk density. In addition, the point clouds from low-density ALS and single-scan TLS of each sample plot were used to calculate metrics related to the vertical and horizontal distribution of forest fuels. The comparative performance of the following three non-parametric machine learning techniques used to estimate the main stand- and fire-related variables from those metrics was evaluated: (i) multivariate adaptive regression splines (MARS), (ii) support vector machine (SVM), and (iii) random forest (RF). The selection of the best modeling approach was based on a comparison of the root mean square error (RMSE), obtained by optimizing the parameters of each technique and performing cross-validation. Overall, the best results were obtained with the MARS techniques for data from both sensors. The TLS data provided the best results for variables associated with the internal characteristics of canopy structure and understory fuel but were less reliable for estimating variables associated with the upper canopy, due to occlusion by mid-canopy foliage. The combination of ALS and TLS metrics improved the accuracy of estimates for all variables analyzed, except the height and the biomass of the understory shrubs. The variability demonstrated by the combined use of both types of metrics ranged from 43.11% for the biomass of duff litter layers to 94.25% for dominant height. The results suggest that the combination of machine learning techniques and metrics derived from low-density ALS data, drawn from a single-scan TLS or a combination of both metrics, may represent a promising alternative to traditional field inventories for obtaining valuable information about surface and canopy fuel variables at large scales. Full article
(This article belongs to the Special Issue 3D Point Clouds in Forest Remote Sensing II)
Show Figures

Figure 1

11 pages, 2946 KiB  
Technical Note
Statistical Analysis for Tidal Flat Classification and Topography Using Multitemporal SAR Backscattering Coefficients
by Keunyong Kim, Hahn Chul Jung, Jong-Kuk Choi and Joo-Hyung Ryu
Remote Sens. 2021, 13(24), 5169; https://doi.org/10.3390/rs13245169 - 20 Dec 2021
Cited by 5 | Viewed by 3575
Abstract
Coastal zones are very dynamic natural systems that experience short-term and long-term morphological changes. Their highly dynamic behavior requires frequent monitoring. Tidal flat topography for a large spatial coverage has been generated mainly by the waterline extraction method from multitemporal remote sensing observations. [...] Read more.
Coastal zones are very dynamic natural systems that experience short-term and long-term morphological changes. Their highly dynamic behavior requires frequent monitoring. Tidal flat topography for a large spatial coverage has been generated mainly by the waterline extraction method from multitemporal remote sensing observations. Despite the efficiency and robustness of the waterline extraction method, the waterline-based digital elevation model (DEM) is limited to representing small scale topographic features, such as localized tidal tributaries. Tidal flats show a rapid increase in SAR backscattering coefficients when the tide height is lower than the tidal flat topography compared to when the tidal flat is covered by water. This leads to a tidal flat with a distinct statistical behavior on the temporal variability of our multitemporal SAR backscattering coefficients. Therefore, this study aims to suggest a new method that can overcome the constraints of the waterline-based method by using a pixel-based DEM generation algorithm. Jenks Natural Break (JNB) optimization was applied to distinguish the tidal flat from land and ocean using multitemporal Senitnel-1 SAR data for the years 2014–2020. We also implemented a logistic model to characterize the temporal evolution of the SAR backscattering coefficients along with the tide heights and estimated intertidal topography. The Sentinel-1 DEM from the JNB classification and logistic function was evaluated by an airborne Lidar DEM. Our pixel-based DEM outperformed the waterline-based Landsat DEM. This study demonstrates that our statistical approach to intertidal classification and topography serves to monitor the near real-time spatiotemporal distribution changes of tidal flats through continuous and stable SAR data collection on local and regional scales. Full article
(This article belongs to the Special Issue Advances in Spaceborne SAR – Technology and Applications)
Show Figures

Figure 1

14 pages, 5840 KiB  
Article
Investigation of Vegetation Changes in Different Mining Areas in Liaoning Province, China, Using Multisource Remote Sensing Data
by Baodong Ma, Xiangru Yang, Yajiao Yu, Yang Shu and Defu Che
Remote Sens. 2021, 13(24), 5168; https://doi.org/10.3390/rs13245168 - 20 Dec 2021
Cited by 11 | Viewed by 3508
Abstract
Mining can provide necessary mineral resources for humans. However, mining activities may cause damage to the surrounding ecology and environment. Vegetation change analysis is a key tool for evaluating damage to ecology and the environment. Liaoning is one of the major mining provinces [...] Read more.
Mining can provide necessary mineral resources for humans. However, mining activities may cause damage to the surrounding ecology and environment. Vegetation change analysis is a key tool for evaluating damage to ecology and the environment. Liaoning is one of the major mining provinces in China, with rich mineral resources and long-term, high-intensity mining activities. Taking Liaoning Province as an example, vegetation change in six mining areas was investigated using multisource remote sensing data to evaluate ecological and environmental changes. Based on MODIS NDVI series data from 2000 to 2019, change trends of vegetation were evaluated using linear regression. According to the results, there are large highly degraded vegetation areas in the Anshan, Benxi, and Yingkou mining areas, which indicates that mining activities have seriously damaged the vegetation in these areas. In contrast, there are considerable areas with improved vegetation in the Anshan, Fushun, and Fuxin mining areas, which indicates that ecological reclamation has played a positive role in these areas. Based on Sentinel-2A data, leaf chlorophyll content was inferred by using the vegetation index MERIS Terrestrial Chlorophyll Index (MTCI) after measurement of leaf spectra and chlorophyll content were carried out on the ground to validate the performance of MTCI. According to the results, the leaf chlorophyll content in the mines is generally lower than in adjacent areas in these mining areas with individual differences. In the Yingkou mining area, the chlorophyll content in adjacent areas is close to the magnesite mines, which means the spillover effect of environmental pollution in mines should be considerable. In the Anshan, Benxi, and Diaobingshan mining areas, the environmental stress on adjacent areas is slight. All in all, iron and magnesite open-pit mines should be monitored closely for vegetation destruction and stress due to the high intensity of mining activities and serious pollution. In contrast, the disturbance to vegetation is limited in resource-exhausted open-pit coal mines and underground coal mines. It is suggested that land reclamation should be enhanced to improve the vegetation in active open-pit mining areas, such as the Anshan, Benxi, and Yingkou mining areas. Additionally, environmental protection measures should be enhanced to relieve vegetation stress in the Yingkou mining area. Full article
Show Figures

Figure 1

27 pages, 10840 KiB  
Article
Estimating Actual Evapotranspiration over Croplands Using Vegetation Index Methods and Dynamic Harvested Area
by Neda Abbasi, Hamideh Nouri, Kamel Didan, Armando Barreto-Muñoz, Sattar Chavoshi Borujeni, Hamidreza Salemi, Christian Opp, Stefan Siebert and Pamela Nagler
Remote Sens. 2021, 13(24), 5167; https://doi.org/10.3390/rs13245167 - 20 Dec 2021
Cited by 20 | Viewed by 4932
Abstract
Advances in estimating actual evapotranspiration (ETa) with remote sensing (RS) have contributed to improving hydrological, agricultural, and climatological studies. In this study, we evaluated the applicability of Vegetation-Index (VI) -based ETa (ET-VI) for mapping and monitoring drought in arid agricultural systems in a [...] Read more.
Advances in estimating actual evapotranspiration (ETa) with remote sensing (RS) have contributed to improving hydrological, agricultural, and climatological studies. In this study, we evaluated the applicability of Vegetation-Index (VI) -based ETa (ET-VI) for mapping and monitoring drought in arid agricultural systems in a region where a lack of ground data hampers ETa work. To map ETa (2000–2019), ET-VIs were translated and localized using Landsat-derived 3- and 2-band Enhanced Vegetation Indices (EVI and EVI2) over croplands in the Zayandehrud River Basin (ZRB) in Iran. Since EVI and EVI2 were optimized for the MODerate Imaging Spectroradiometer (MODIS), using these VIs with Landsat sensors required a cross-sensor transformation to allow for their use in the ET-VI algorithm. The before- and after- impact of applying these empirical translation methods on the ETa estimations was examined. We also compared the effect of cropping patterns’ interannual change on the annual ETa rate using the maximum Normalized Difference Vegetation Index (NDVI) time series. The performance of the different ET-VIs products was then evaluated. Our results show that ETa estimates agreed well with each other and are all suitable to monitor ETa in the ZRB. Compared to ETc values, ETa estimations from MODIS-based continuity corrected Landsat-EVI (EVI2) (EVIMccL and EVI2MccL) performed slightly better across croplands than those of Landsat-EVI (EVI2) without transformation. The analysis of harvested areas and ET-VIs anomalies revealed a decline in the extent of cultivated areas and a loss of corresponding water resources downstream. The findings show the importance of continuity correction across sensors when using empirical algorithms designed and optimized for specific sensors. Our comprehensive ETa estimation of agricultural water use at 30 m spatial resolution provides an inexpensive monitoring tool for cropping areas and their water consumption. Full article
Show Figures

Figure 1

19 pages, 3000 KiB  
Article
UAV- and Machine Learning-Based Retrieval of Wheat SPAD Values at the Overwintering Stage for Variety Screening
by Jianjun Wang, Qi Zhou, Jiali Shang, Chang Liu, Tingxuan Zhuang, Junjie Ding, Yunyu Xian, Lingtian Zhao, Weiling Wang, Guisheng Zhou, Changwei Tan and Zhongyang Huo
Remote Sens. 2021, 13(24), 5166; https://doi.org/10.3390/rs13245166 - 20 Dec 2021
Cited by 39 | Viewed by 3902
Abstract
In recent years, the delay in sowing has become a major obstacle to high wheat yield in Jiangsu Province, one of the major wheat producing areas in China; hence, it is necessary to screen wheat varieties are resilient for late sowing. This study [...] Read more.
In recent years, the delay in sowing has become a major obstacle to high wheat yield in Jiangsu Province, one of the major wheat producing areas in China; hence, it is necessary to screen wheat varieties are resilient for late sowing. This study aimed to provide an effective, fast, and non-destructive monitoring method of soil plant analysis development (SPAD) values, which can represent leaf chlorophyll contents, for late-sown winter wheat variety screening. This study acquired multispectral images using an unmanned aerial vehicle (UAV) at the overwintering stage of winter wheat growth, and further processed these images to extract reflectance of five single spectral bands and calculated 26 spectral vegetation indices. Based on these 31 variables, this study combined three variable selection methods (i.e., recursive feature elimination (RFE), random forest (RF), and Pearson correlation coefficient (r)) with four machine learning algorithms (i.e., random forest regression (RFR), linear kernel-based support vector regression (SVR), radial basis function (RBF) kernel-based SVR, and sigmoid kernel-based SVR), resulted in seven SVR models (i.e., RFE-SVR_linear, RF-SVR_linear, RF-SVR_RBF, RF-SVR_sigmoid, r-SVR_linear, r-SVR_RBF, and r-SVR_sigmoid) and three RFR models (i.e., RFE-RFR, RF-RFR, and r-RFR). The performances of the 10 machine learning models were evaluated and compared with each other according to the achieved coefficient of determination (R2), residual prediction deviation (RPD), root mean square error (RMSE), and relative RMSE (RRMSE) in SPAD estimation. Of the 10 models, the best one was the RF-SVR_sigmoid model, which was the combination of the RF variable selection method and the sigmoid kernel-based SVR algorithm. It achieved high accuracy in estimating SPAD values of the wheat canopy (R2 = 0.754, RPD = 2.017, RMSE = 1.716 and RRMSE = 4.504%). The newly developed UAV- and machine learning-based model provided a promising and real time method to monitor chlorophyll contents at the overwintering stage, which can benefit late-sown winter wheat variety screening. Full article
Show Figures

Graphical abstract

17 pages, 6881 KiB  
Article
Towards the Sea Wind Measurement with the Airborne Scatterometer Having the Rotating-Beam Antenna Mounted over Fuselage
by Alexey Nekrasov and Alena Khachaturian
Remote Sens. 2021, 13(24), 5165; https://doi.org/10.3390/rs13245165 - 20 Dec 2021
Cited by 5 | Viewed by 2756
Abstract
Extension of the existing airborne radars’ applicability is a perspective approach to the remote sensing of the environment. Here we investigate the capability of the rotating-beam radar installed over the fuselage for the sea surface wind measurement based on the comparison of the [...] Read more.
Extension of the existing airborne radars’ applicability is a perspective approach to the remote sensing of the environment. Here we investigate the capability of the rotating-beam radar installed over the fuselage for the sea surface wind measurement based on the comparison of the backscatter with the respective geophysical model function (GMF). We also consider the robustness of the proposed approach to the partial shading of the underlying water surface by the aircraft nose, tail, and wings. The wind retrieval algorithms have been developed and evaluated using Monte-Carlo simulations. We find our results promising both for the development of new remote sensing systems as well as the functional enhancement of existing airborne radars. Full article
(This article belongs to the Special Issue Remote Sensing of Ocean Surface Winds)
Show Figures

Figure 1

32 pages, 19467 KiB  
Article
A New Method (MINDED-BA) for Automatic Detection of Burned Areas Using Remote Sensing
by Eduardo R. Oliveira, Leonardo Disperati and Fátima L. Alves
Remote Sens. 2021, 13(24), 5164; https://doi.org/10.3390/rs13245164 - 20 Dec 2021
Cited by 6 | Viewed by 3273
Abstract
This work presents a change detection method (MINDED-BA) for determining burned extents from multispectral remote sensing imagery. It consists of a development of a previous model (MINDED), originally created to estimate flood extents, combining a multi-index image-differencing approach and the analysis of magnitudes [...] Read more.
This work presents a change detection method (MINDED-BA) for determining burned extents from multispectral remote sensing imagery. It consists of a development of a previous model (MINDED), originally created to estimate flood extents, combining a multi-index image-differencing approach and the analysis of magnitudes of the image-differencing statistics. The method was implemented, using Landsat and Sentinel-2 data, to estimate yearly burn extents within a study area located in northwest central Portugal, from 2000–2019. The modelling workflow includes several innovations, such as preprocessing steps to address some of the most important sources of error mentioned in the literature, and an optimal bin number selection procedure, the latter being the basis for the threshold selection for the classification of burn-related changes. The results of the model have been compared to an official yearly-burn-extent database and allow verifying the significant improvements introduced by both the pre-processing procedures and the multi-index approach. The high overall accuracies of the model (ca. 97%) and its levels of automatization (through open-source software) indicate potential for being a reliable method for systematic unsupervised classification of burned areas. Full article
Show Figures

Graphical abstract

19 pages, 5189 KiB  
Article
A scSE-LinkNet Deep Learning Model for Daytime Sea Fog Detection
by Xiaofei Guo, Jianhua Wan, Shanwei Liu, Mingming Xu, Hui Sheng and Muhammad Yasir
Remote Sens. 2021, 13(24), 5163; https://doi.org/10.3390/rs13245163 - 20 Dec 2021
Cited by 11 | Viewed by 3544
Abstract
Sea fog is a precarious weather disaster affecting transportation on the sea. The accuracy of the threshold method for sea fog detection is limited by time and region. In comparison, the deep learning method learns features of objects through different network layers and [...] Read more.
Sea fog is a precarious weather disaster affecting transportation on the sea. The accuracy of the threshold method for sea fog detection is limited by time and region. In comparison, the deep learning method learns features of objects through different network layers and can therefore accurately extract fog data and is less affected by temporal and spatial factors. This study proposes a scSE-LinkNet model for daytime sea fog detection that leverages residual blocks to encoder feature maps and attention module to learn the features of sea fog data by considering spectral and spatial information of nodes. With the help of satellite radar data from Cloud-Aerosol Lidar with Orthogonal Polarization (CALIOP), a ground sample database was extracted from Moderate Resolution Imaging Spectroradiometer (MODIS) L1B data. The scSE-LinkNet was trained on the training set, and quantitative evaluation was performed on the test set. Results showed the probability of detection (POD), false alarm rate (FAR), critical success index (CSI), and Heidke skill scores (HSS) were 0.924, 0.143, 0.800, and 0.864, respectively. Compared with other neural networks (FCN, U-Net, and LinkNet), the CSI of scSE-LinkNet was improved, with a maximum increase of nearly 8%. Moreover, the sea fog detection results were consistent with the measured data and CALIOP products. Full article
Show Figures

Graphical abstract

15 pages, 16223 KiB  
Article
A Complete Environmental Intelligence System for LiDAR-Based Vegetation Management in Power-Line Corridors
by Domen Mongus, Matej Brumen, Danijel Žlaus, Štefan Kohek, Roman Tomažič, Uroš Kerin and Simon Kolmanič
Remote Sens. 2021, 13(24), 5159; https://doi.org/10.3390/rs13245159 - 20 Dec 2021
Cited by 7 | Viewed by 3803
Abstract
This paper presents the first complete approach to achieving environmental intelligence support in the management of vegetation within electrical power transmission corridors. Contrary to the related studies that focused on the mapping of power lines, together with encroaching vegetation risk assessment, we realised [...] Read more.
This paper presents the first complete approach to achieving environmental intelligence support in the management of vegetation within electrical power transmission corridors. Contrary to the related studies that focused on the mapping of power lines, together with encroaching vegetation risk assessment, we realised predictive analytics with vegetation growth simulation. This was achieved by following the JDL/DFIG data fusion model for complementary feature extraction from Light Detection and Ranging (LiDAR) derived data products and auxiliary thematic maps that feed an ensemble regression model. The results indicate that improved vegetation growth prediction accuracy is obtained by segmenting training samples according to their contextual similarities that relate to their ecological niches. Furthermore, efficient situation assessment was then performed using a rasterised parametrically defined funnel-shaped volumetric filter. In this way, RMSE1 m was measured when considering tree growth simulation, while a 0.37 m error was estimated in encroaching vegetation detection, demonstrating significant improvements over the field observations. Full article
Show Figures

Figure 1

22 pages, 3585 KiB  
Article
Mapping Soil Organic Matter and Analyzing the Prediction Accuracy of Typical Cropland Soil Types on the Northern Songnen Plain
by Meiwei Zhang, Huanjun Liu, Meinan Zhang, Haoxuan Yang, Yuanliang Jin, Yu Han, Haitao Tang, Xiaohan Zhang and Xinle Zhang
Remote Sens. 2021, 13(24), 5162; https://doi.org/10.3390/rs13245162 - 19 Dec 2021
Cited by 14 | Viewed by 3433
Abstract
Soil organic matter (SOM) plays a critical role in agroecosystems and the terrestrial carbon cycle. Thus, accurately mapping SOM promotes sustainable agriculture and estimations of soil carbon pools. However, few studies have analyzed the changing trends in multi-period SOM prediction accuracies for single [...] Read more.
Soil organic matter (SOM) plays a critical role in agroecosystems and the terrestrial carbon cycle. Thus, accurately mapping SOM promotes sustainable agriculture and estimations of soil carbon pools. However, few studies have analyzed the changing trends in multi-period SOM prediction accuracies for single cropland soil types and mapped their spatial SOM patterns. Using time series 7 MOD09A1 images during the bare soil period, we combined the pixel dates of training samples and precipitation data to explore the variation in SOM accuracy for two typical cropland soil types. The advantage of using single soil type data versus the total dataset was evaluated, and SOM maps were drawn for the northern Songnen Plain. When almost no precipitation occurred on or near the optimal pixel date, the accuracies increased, and vice versa. SOM models of the two soil types achieved a lower root mean squared error (RMSE = 0.55%, 0.79%) and mean absolute error (MAE = 0.39%, 0.58%) and a higher coefficient of determination (R2 = 0.65, 0.75) than the model using the total dataset and resulted in a mean relative improvement (RI) of 30.21%. The SOM decreased from northeast to southwest. The results provide reference data for the accurate management of cultivated soil and determining carbon sequestration. Full article
Show Figures

Graphical abstract

14 pages, 2758 KiB  
Article
Radiative Transfer Model Simulations for Ground-Based Microwave Radiometers in North China
by Wenying He, Yunchu Cheng, Rongshi Zou, Pucai Wang, Hongbin Chen, Jun Li and Xiangao Xia
Remote Sens. 2021, 13(24), 5161; https://doi.org/10.3390/rs13245161 - 19 Dec 2021
Cited by 3 | Viewed by 2666
Abstract
Ground-based microwave radiometer profilers (MWRPs) are widely used to provide high-temporal resolution atmospheric temperature and humidity profiles. The quality of the observed brightness temperature (TB) from MWRPs is key for retrieving accurate atmospheric profiles. In this study, TB simulations derived from a radiative [...] Read more.
Ground-based microwave radiometer profilers (MWRPs) are widely used to provide high-temporal resolution atmospheric temperature and humidity profiles. The quality of the observed brightness temperature (TB) from MWRPs is key for retrieving accurate atmospheric profiles. In this study, TB simulations derived from a radiative transfer model (RTM) were used to assess the quality of TB observations. Two types of atmospheric profile data (conventional radiosonde and ERA5 reanalysis) were combined with the RTM to obtain TB simulations, then compared with corresponding observations from three MWRPs located in different places in North China to investigate the influence of input atmospheric profiles on TB simulations and evaluate the quality of TB observations from the three MWRPs. The comparisons of the matching samples under clear-sky conditions showed that TB simulations derived from both radiosonde and ERA5 profiles were very close to the TB observations from most of the MWRP channels; however, the correlation was lower and the bias was obvious at 51.26 GHz and 52.28 GHz, which indicates that the oxygen absorption component in the RTM needs to be improved for lower-frequency temperature channels. The difference in location of the radiosonde and MWRP sites affected the TB simulations for the water vapor channels, but had little impact on temperature channels that are insensitive to humidity. Comparisons of both simulations (ERA5 and Radiosonde) and the corresponding TB observations from the three sites indicated that the water vapor channels observation quality for the MWRP located in southern Beijing needs improvement. For the two types of profile data, ERA5 profiles have a more positive effect on TB simulations in the water vapor channels, such as enhanced consistence, reduced bias and standard deviation between simulations and observations for those MWRPs located away from the radiosonde station. Therefore, hourly ERA5 data are an optimal option in terms of compensating for limited radiosonde measurements and enhancing the monitoring quality of MWRP observations within 24 h. Full article
(This article belongs to the Special Issue Feature Papers of Section Atmosphere Remote Sensing)
Show Figures

Figure 1

18 pages, 4998 KiB  
Article
Assessing Post-Fire Effects on Soil Loss Combining Burn Severity and Advanced Erosion Modeling in Malesina, Central Greece
by Ioanna Tselka, Pavlos Krassakis, Alkiviadis Rentzelos, Nikolaos Koukouzas and Issaak Parcharidis
Remote Sens. 2021, 13(24), 5160; https://doi.org/10.3390/rs13245160 - 19 Dec 2021
Cited by 10 | Viewed by 4532
Abstract
Earth’s ecosystems are extremely valuable to humanity, playing a key role ecologically, economically, and socially. Wildfires constitute a significant threat to the environment, especially in vulnerable ecosystems, such as those that are commonly found in the Mediterranean. Due to their strong impact on [...] Read more.
Earth’s ecosystems are extremely valuable to humanity, playing a key role ecologically, economically, and socially. Wildfires constitute a significant threat to the environment, especially in vulnerable ecosystems, such as those that are commonly found in the Mediterranean. Due to their strong impact on the environment, they provide a crucial factor in managing ecosystems behavior, causing dramatic modifications to land surface processes dynamics leading to land degradation. The soil erosion phenomenon downgrades soil quality in ecosystems and reduces land productivity. Thus, it is imperative to implement advanced erosion prediction models to assess fire effects on soil characteristics. This study focuses on examining the wildfire case that burned 30 km2 in Malesina of Central Greece in 2014. The added value of remote sensing today, such as the high accuracy of satellite data, has contributed to visualizing the burned area concerning the severity of the event. Additional data from local weather stations were used to quantify soil loss on a seasonal basis using RUSLE modeling before and after the wildfire. Results of this study revealed that there is a remarkable variety of high soil loss values, especially in winter periods. More particularly, there was a 30% soil loss rise one year after the wildfire, while five years after the event, an almost double reduction was observed. In specific areas with high soil erosion values, infrastructure works were carried out validating the applied methodology. The approach adopted in this study underlines the significance of using remote sensing and geoinformation techniques to assess the post-fire effects of identifying vulnerable areas based on soil erosion parameters on a local scale. Full article
Show Figures

Graphical abstract

18 pages, 5772 KiB  
Article
Retrieval of Daily Mean VIIRS SST Products in China Seas
by Qianmei Li, Qingyou He and Chuqun Chen
Remote Sens. 2021, 13(24), 5158; https://doi.org/10.3390/rs13245158 - 19 Dec 2021
Cited by 1 | Viewed by 2506
Abstract
Sea surface temperature (SST) is one of the most important factors in regulating air-sea heat flux and, thus, climate change. Most of current global daily SST products are derived from one or two transient measurements of polar-orbiting satellites, which are not the same [...] Read more.
Sea surface temperature (SST) is one of the most important factors in regulating air-sea heat flux and, thus, climate change. Most of current global daily SST products are derived from one or two transient measurements of polar-orbiting satellites, which are not the same to daily mean SST values. In this study, high-temporal-resolution SST measurements (32–40 snapshots per day) from a geostationary satellite, FengYun-4A (FY–4A), are used to analyze the diurnal variation of SST in China seas. The results present a sinusoidal pattern of the diurnal variability in SST, with the maximum value at 13:00–15:00 CST and the minimum at 06:00–08:00 CST. Based on the diurnal variation of SST, a retrieval method for daily mean SST products from polar-orbiting satellites is established and applied to 7716 visible infrared imaging radiometer (VIIRS) data in China seas. The results suggest that it is feasible and practical for the retrieval of daily mean SST with an average RMSE of 0.133 °C. This retrieval method can also be utilized to other polar-orbiting satellites and obtain more daily mean satellite SST products, which will contribute to more accurate estimation and prediction between atmosphere and ocean in the future. Full article
(This article belongs to the Special Issue VIIRS 2011–2021: Ten Years of Success in Earth Observations)
Show Figures

Graphical abstract

22 pages, 14289 KiB  
Article
Feasibility of Ground-Based Sky-Camera HDR Imagery to Determine Solar Irradiance and Sky Radiance over Different Geometries and Sky Conditions
by Pedro C. Valdelomar, José L. Gómez-Amo, Caterina Peris-Ferrús, Francesco Scarlatti and María Pilar Utrillas
Remote Sens. 2021, 13(24), 5157; https://doi.org/10.3390/rs13245157 - 19 Dec 2021
Cited by 12 | Viewed by 3607
Abstract
We propose a methodological approach to provide the accurate and calibrated measurements of sky radiance and broadband solar irradiance using the High Dynamic Range (HDR) images of a sky-camera. This approach is based on a detailed instrumental characterization of a SONA sky-camera in [...] Read more.
We propose a methodological approach to provide the accurate and calibrated measurements of sky radiance and broadband solar irradiance using the High Dynamic Range (HDR) images of a sky-camera. This approach is based on a detailed instrumental characterization of a SONA sky-camera in terms of image acquisition and processing, as well as geometric and radiometric calibrations. As a result, a 1 min time resolution database of geometrically and radiometrically calibrated HDR images has been created and has been available since February 2020, with daily updates. An extensive validation of our radiometric retrievals has been performed in all sky conditions. Our results show a very good agreement with the independent measurements of the AERONET almucantar for sky radiance and pyranometers for broadband retrievals. The SONA sky radiance shows a difference of an RMBD < 10% while the broadband diffuse radiation shows differences of 2% and 5% over a horizontal plane and arbitrarily oriented surfaces, respectively. These results support the developed methodology and allow us to glimpse the great potential of sky-cameras to carry out accurate measurements of sky radiance and solar radiation components. Thus, the remote sensing techniques described here will undoubtedly be of great help for solar and atmospheric research. Full article
Show Figures

Graphical abstract

21 pages, 13759 KiB  
Article
Artificial Neural Network-Based Microwave Satellite Soil Moisture Reconstruction over the Qinghai–Tibet Plateau, China
by Jie Wang and Duanyang Xu
Remote Sens. 2021, 13(24), 5156; https://doi.org/10.3390/rs13245156 - 19 Dec 2021
Cited by 5 | Viewed by 2890
Abstract
Soil moisture is a key parameter for land-atmosphere interaction system; however, fewer existing spatial-temporally continuous and high-quality observation records impose great limitations on the application of soil moisture on long term climate change monitoring and predicting. Therefore, this study selected the Qinghai–Tibet Plateau [...] Read more.
Soil moisture is a key parameter for land-atmosphere interaction system; however, fewer existing spatial-temporally continuous and high-quality observation records impose great limitations on the application of soil moisture on long term climate change monitoring and predicting. Therefore, this study selected the Qinghai–Tibet Plateau (QTP) of China as research region, and explored the feasibility of using Artificial Neural Network (ANN) to reconstruct soil moisture product based on AMSR-2/AMSR-E brightness temperature and SMAP satellite data by introducing auxiliary variables, specifically considering the sensitivity of different combination of input variables, number of neurons in hidden layer, sample ratio, and precipitation threshold in model building. The results showed that the ANN model had the highest accuracy when all variables were used as inputs, it had a network containing 12 neurons in a hidden layer, it had a sample ratio 80%-10%-10% (training-validation-testing), and had a precipitation threshold of 8.75 mm, respectively. Furthermore, validation of the reconstructed soil moisture product (named ANN-SM) in other period were conducted by comparing with SMAP (April 2019 to July 2021) for all grid cells and in situ soil moisture sites (August 2010 to March 2015) of QTP, which achieved an ideal accuracy. In general, the proposed method is capable of rebuilding soil moisture products by adopting different satellite data and our soil moisture product is promising for serving the studies of long-term global and regional dynamics in water cycle and climate. Full article
(This article belongs to the Special Issue Data Science and Machine Learning for Geodetic Earth Observation)
Show Figures

Graphical abstract

18 pages, 4492 KiB  
Article
Modeling Influence of Soil Properties in Different Gradients of Soil Moisture: The Case of the Valencia Anchor Station Validation Site, Spain
by Ester Carbó, Pablo Juan, Carlos Añó, Somnath Chaudhuri, Carlos Diaz-Avalos and Ernesto López-Baeza
Remote Sens. 2021, 13(24), 5155; https://doi.org/10.3390/rs13245155 - 19 Dec 2021
Cited by 3 | Viewed by 3213
Abstract
The prediction of spatial and temporal variation of soil water content brings numerous benefits in the studies of soil. However, it requires a considerable number of covariates to be included in the study, complicating the analysis. Integrated nested Laplace approximations (INLA) with stochastic [...] Read more.
The prediction of spatial and temporal variation of soil water content brings numerous benefits in the studies of soil. However, it requires a considerable number of covariates to be included in the study, complicating the analysis. Integrated nested Laplace approximations (INLA) with stochastic partial differential equation (SPDE) methodology is a possible approach that allows the inclusion of covariates in an easy way. The current study has been conducted using INLA-SPDE to study soil moisture in the area of the Valencia Anchor Station (VAS), soil moisture validation site for the European Space Agency SMOS (Soil Moisture and Ocean Salinity). The data used were collected in a typical ecosystem of the semiarid Mediterranean conditions, subdivided into physio-hydrological units (SMOS units) which presents a certain degree of internal uniformity with respect to hydrological parameters and capture the spatial and temporal variation of soil moisture at the local fine scale. The paper advances the knowledge of the influence of hydrodynamic properties on VAS soil moisture (texture, porosity/bulk density and soil organic matter and land use). With the goal of understanding the factors that affect the variability of soil moisture in the SMOS pixel (50 km × 50 km), five states of soil moisture are proposed. We observed that the model with all covariates and spatial effect has the lowest DIC value. In addition, the correlation coefficient was close to 1 for the relationship between observed and predicted values. The methodology applied presents the possibility to analyze the significance of different covariates having spatial and temporal effects. This process is substantially faster and more effective than traditional kriging. The findings of this study demonstrate an advancement in that framework, demonstrating that it is faster than previous methodologies, provides significance of individual covariates, is reproducible, and is easy to compare with models. Full article
(This article belongs to the Special Issue Earth Observation in Support of Sustainable Soils Development)
Show Figures

Graphical abstract

31 pages, 13635 KiB  
Article
Flood Risk Assessment of Metro System Using Improved Trapezoidal Fuzzy AHP: A Case Study of Guangzhou
by Guangpeng Wang, Lianyou Liu, Peijun Shi, Guoming Zhang and Jifu Liu
Remote Sens. 2021, 13(24), 5154; https://doi.org/10.3390/rs13245154 - 18 Dec 2021
Cited by 29 | Viewed by 5236
Abstract
Metro systems have become high-risk entities due to the increased frequency and severity of urban flooding. Therefore, understanding the flood risk of metro systems is a prerequisite for mega-cities’ flood protection and risk management. This study proposes a method for accurately assessing the [...] Read more.
Metro systems have become high-risk entities due to the increased frequency and severity of urban flooding. Therefore, understanding the flood risk of metro systems is a prerequisite for mega-cities’ flood protection and risk management. This study proposes a method for accurately assessing the flood risk of metro systems based on an improved trapezoidal fuzzy analytic hierarchy process (AHP). We applied this method to assess the flood risk of 14 lines and 268 stations of the Guangzhou Metro. The risk results validation showed that the accuracy of the improved trapezoidal fuzzy AHP (90% match) outperformed the traditional trapezoidal AHP (70% match). The distribution of different flood risk levels in Guangzhou metro lines exhibited a polarization signature. About 69% (155 km2) of very high and high risk zones were concentrated in central urban areas (Yuexiu, Liwan, Tianhe, and Haizhu); the three metro lines with the highest overall risk level were lines 3, 6, and 5; and the metro stations at very high risk were mainly located on metro lines 6, 3, 5, 1, and 2. Based on fieldwork, we suggest raising exits, installing watertight doors, and using early warning strategies to resist metro floods. This study can provide scientific data for decision-makers to reasonably allocate flood prevention resources, which is significant in reducing flood losses and promoting Guangzhou’s sustainable development. Full article
(This article belongs to the Special Issue Remote Sensing in Urban Natural Hazards Monitoring)
Show Figures

Graphical abstract

Previous Issue
Back to TopTop