Next Issue
Volume 8, August
Previous Issue
Volume 8, June
 
 
remotesensing-logo

Journal Browser

Journal Browser

Remote Sens., Volume 8, Issue 7 (July 2016) – 83 articles

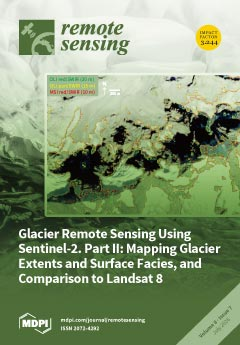
Cover Story (view full-size image): The cover image shows a close-up view of a Sentinel 2 (S2) scene (32TMS) acquired on 29 August 2015 over the European Alps with the debris-covered Breithornglacier in the Lau-terbrunnen Valley (Switzerland) to the left. The S2 image with its 10-m resolution resolves the issue of glacier crevasses, thus depicting glaciers much more realistically. Paul et al. (2016) have, among other glacier mapping analyses, investigated how automated glacier mapping with S2 performs compared to Landsat 8 when using the band ratio method. The glacier outlines resulting from the three band combinations are shown in the cover image. The study revealed that (a) the 15-m Landsat 8 pan band can also be used for glacier map-ping, providing outlines with a two times higher resolution than with the red band; (b) all methods provide similar glacier extents, but (c) the 30-m red/SWIR ratio gives slightly larger (5%) extents. View [...] Read more.
  • Issues are regarded as officially published after their release is announced to the table of contents alert mailing list.
  • You may sign up for e-mail alerts to receive table of contents of newly released issues.
  • PDF is the official format for papers published in both, html and pdf forms. To view the papers in pdf format, click on the "PDF Full-text" link, and use the free Adobe Reader to open them.
Order results
Result details
Section
Select all
Export citation of selected articles as:
3556 KiB  
Article
Prediction of Common Surface Soil Properties Based on Vis-NIR Airborne and Simulated EnMAP Imaging Spectroscopy Data: Prediction Accuracy and Influence of Spatial Resolution
by Andreas Steinberg, Sabine Chabrillat, Antoine Stevens, Karl Segl and Saskia Foerster
Remote Sens. 2016, 8(7), 613; https://doi.org/10.3390/rs8070613 - 22 Jul 2016
Cited by 78 | Viewed by 8682
Abstract
With the upcoming availability of the next generation of high quality orbiting hyperspectral sensors, a major step toward improved regional soil mapping and monitoring and delivery of quantitative soil maps is expected. This study focuses on the determination of the prediction accuracy of [...] Read more.
With the upcoming availability of the next generation of high quality orbiting hyperspectral sensors, a major step toward improved regional soil mapping and monitoring and delivery of quantitative soil maps is expected. This study focuses on the determination of the prediction accuracy of spectral models for the mapping of common soil properties based on upcoming EnMAP (Environmental Mapping and Analysis Program) satellite data using semi-operational soil models. Iron oxide (Fed), clay, and soil organic carbon (SOC) content are predicted in test areas in Spain and Luxembourg based on a semi-automatic Partial-Least-Square (PLS) regression approach using airborne hyperspectral, simulated EnMAP, and soil chemical datasets. A variance contribution analysis, accounting for errors in the dependent variables, is used alongside classical error measurements. Results show that EnMAP allows predicting iron oxide, clay, and SOC with an R2 between 0.53 and 0.67 compared to Hyperspectral Mapper (HyMap)/Airborne Hyperspectral System (AHS) imagery with an R2 between 0.64 and 0.74. Although a slight decrease in soil prediction accuracy is observed at the spaceborne scale compared to the airborne scale, the decrease in accuracy is still reasonable. Furthermore, spatial distribution is coherent between the HyMap/AHS mapping and simulated EnMAP mapping as shown with a spatial structure analysis with a systematically lower semivariance at the EnMAP scale. Full article
(This article belongs to the Special Issue Remote Sensing Applied to Soils: From Ground to Space)
Show Figures

Graphical abstract

6942 KiB  
Article
Deriving Ice Motion Patterns in Mountainous Regions by Integrating the Intensity-Based Pixel-Tracking and Phase-Based D-InSAR and MAI Approaches: A Case Study of the Chongce Glacier
by Shiyong Yan, Zhixing Ruan, Guang Liu, Kazhong Deng, Mingyang Lv and Zbigniew Perski
Remote Sens. 2016, 8(7), 611; https://doi.org/10.3390/rs8070611 - 22 Jul 2016
Cited by 18 | Viewed by 5736
Abstract
As a sensitive indicator of climate change, mountain glacier dynamics are of great concern, but the ice motion pattern of an entire glacier surface cannot be accurately and efficiently generated by the use of only phase-based or intensity-based methods with synthetic aperture radar [...] Read more.
As a sensitive indicator of climate change, mountain glacier dynamics are of great concern, but the ice motion pattern of an entire glacier surface cannot be accurately and efficiently generated by the use of only phase-based or intensity-based methods with synthetic aperture radar (SAR) imagery. To derive the ice movement of the whole glacier surface with a high accuracy, an integrated approach combining differential interferometric SAR (D-InSAR), multi-aperture interferometry (MAI), and a pixel-tracking (PT) method is proposed, which could fully exploit the phase and intensity information recorded by the SAR sensor. The Chongce Glacier surface flow field is estimated with the proposed integrated approach. Compared with the traditional SAR-based methods, the proposed approach can determine the ice motion over a widely varying range of ice velocities with a relatively high accuracy. Its capability is proved by the detailed ice displacement pattern with the average accuracy of 0.2 m covering the entire Chongce Glacier surface, which shows a maximum ice movement of 4.9 m over 46 days. Furthermore, it is shown that the ice is in a quiescent state in the downstream part of the glacier. Therefore, the integrated approach presented in this paper could present us with a novel way to comprehensively and accurately understand glacier dynamics by overcoming the incoherence phenomenon, and has great potential for glaciology study. Full article
(This article belongs to the Special Issue Remote Sensing in Tibet and Siberia)
Show Figures

Graphical abstract

10432 KiB  
Article
Radiometric Cross-Calibration of the Chilean Satellite FASat-C Using RapidEye and EO-1 Hyperion Data and a Simultaneous Nadir Overpass Approach
by Carolina Barrientos, Cristian Mattar, Theodoros Nakos and Waldo Perez
Remote Sens. 2016, 8(7), 612; https://doi.org/10.3390/rs8070612 - 21 Jul 2016
Cited by 10 | Viewed by 8936
Abstract
The absolute radiometric calibration of a satellite sensor is the critical factor that ensures the usefulness of the acquired data for quantitative applications on remote sensing. This work presents the results of the first cross-calibration of the sensor on board the Sistema Satelital [...] Read more.
The absolute radiometric calibration of a satellite sensor is the critical factor that ensures the usefulness of the acquired data for quantitative applications on remote sensing. This work presents the results of the first cross-calibration of the sensor on board the Sistema Satelital de Observación de la Tierra (SSOT) Chilean satellite or Air Force Satellite FASat-C. RapidEye-MSI was chosen as the reference sensor, and a simultaneous Nadir Overpass Approach (SNO) was applied. The biases caused by differences in the spectral responses of both instruments were compensated through an adjustment factor derived from EO-1 Hyperion data. Through this method, the variations affecting the radiometric response of New AstroSat Optical Modular Instrument (NAOMI-1), have been corrected based on collections over the Frenchman Flat calibration site. The results of a preliminary evaluation of the pre-flight and updated coefficients have shown a significant improvement in the accuracy of at-sensor radiances and TOA reflectances: an average agreement of 2.63% (RMSE) was achieved for the multispectral bands of both instruments. This research will provide a basis for the continuity of calibration and validation tasks of future Chilean space missions. Full article
Show Figures

Graphical abstract

4016 KiB  
Article
Hydrological Utility and Uncertainty of Multi-Satellite Precipitation Products in the Mountainous Region of South Korea
by Jong Pil Kim, Il Won Jung, Kyung Won Park, Sun Kwon Yoon and Donghee Lee
Remote Sens. 2016, 8(7), 608; https://doi.org/10.3390/rs8070608 - 21 Jul 2016
Cited by 41 | Viewed by 7066
Abstract
Satellite-derived precipitation can be a potential source of forcing data for assessing water availability and managing water supply in mountainous regions of East Asia. This study investigates the hydrological utility of satellite-derived precipitation and uncertainties attributed to error propagation of satellite products in [...] Read more.
Satellite-derived precipitation can be a potential source of forcing data for assessing water availability and managing water supply in mountainous regions of East Asia. This study investigates the hydrological utility of satellite-derived precipitation and uncertainties attributed to error propagation of satellite products in hydrological modeling. To this end, four satellite precipitation products (tropical rainfall measuring mission (TRMM) multi-satellite precipitation analysis (TMPA) version 6 (TMPAv6) and version 7 (TMPAv7), the global satellite mapping of precipitation (GSMaP), and the climate prediction center (CPC) morphing technique (CMORPH)) were integrated into a physically-based hydrologic model for the mountainous region of South Korea. The satellite precipitation products displayed different levels of accuracy when compared to the intra- and inter-annual variations of ground-gauged precipitation. As compared to the GSMaP and CMORPH products, superior performances were seen when the TMPA products were used within streamflow simulations. Significant dry (negative) biases in the GSMaP and CMORPH products led to large underestimates of streamflow during wet-summer seasons. Although the TMPA products displayed a good level of performance for hydrologic modeling, there were some over/underestimates of precipitation by satellites during the winter season that were induced by snow accumulation and snowmelt processes. These differences resulted in streamflow simulation uncertainties during the winter and spring seasons. This study highlights the crucial need to understand hydrological uncertainties from satellite-derived precipitation for improved water resource management and planning in mountainous basins. Furthermore, it is suggested that a reliable snowfall detection algorithm is necessary for the new global precipitation measurement (GPM) mission. Full article
Show Figures

Graphical abstract

4944 KiB  
Article
Particle Filter Approach for Real-Time Estimation of Crop Phenological States Using Time Series of NDVI Images
by Caleb De Bernardis, Fernando Vicente-Guijalba, Tomas Martinez-Marin and Juan M. Lopez-Sanchez
Remote Sens. 2016, 8(7), 610; https://doi.org/10.3390/rs8070610 - 20 Jul 2016
Cited by 23 | Viewed by 7299
Abstract
Knowing the current phenological state of an agricultural crop is a powerful tool for precision farming applications. In the past, it has been estimated with remote sensing data by exploiting time series of Normalised Difference Vegetation Index (NDVI), but always at the end [...] Read more.
Knowing the current phenological state of an agricultural crop is a powerful tool for precision farming applications. In the past, it has been estimated with remote sensing data by exploiting time series of Normalised Difference Vegetation Index (NDVI), but always at the end of the campaign and only providing results for some key states. In this work, a new dynamical framework is proposed to provide real-time estimates in a continuous range of states, for which NDVI images are combined with a prediction model in an optimal way using a particle filter. The methodology is tested over a set of 8 to 13 rice parcels during 2008–2013, achieving a high determination factor R 2 = 0.93 ( n = 379 ) for the complete phenological range. This method is also used to predict the end of season date, obtaining a high accuracy with an anticipation of around 40–60 days. Among the key advantages of this approach, phenology is estimated each time a new observation is available, hence enabling the potential detection of anomalies in real-time during the cultivation. In addition, the estimation procedure is robust in the case of noisy observations, and it is not limited to a few phenological stages. Full article
(This article belongs to the Special Issue Remote Sensing of Vegetation Structure and Dynamics)
Show Figures

Graphical abstract

3595 KiB  
Article
Airborne S-Band SAR for Forest Biophysical Retrieval in Temperate Mixed Forests of the UK
by Ramesh K. Ningthoujam, Heiko Balzter, Kevin Tansey, Keith Morrison, Sarah C.M. Johnson, France Gerard, Charles George, Yadvinder Malhi, Geoff Burbidge, Sam Doody, Nick Veck, Gary M. Llewellyn, Thomas Blythe, Pedro Rodriguez-Veiga, Sybrand Van Beijma, Bernard Spies, Chloe Barnes, Marc Padilla-Parellada, James E.M. Wheeler, Valentin Louis, Tom Potter, Alexander Edwards-Smith and Jaime Polo Bermejoadd Show full author list remove Hide full author list
Remote Sens. 2016, 8(7), 609; https://doi.org/10.3390/rs8070609 - 20 Jul 2016
Cited by 32 | Viewed by 11619
Abstract
Radar backscatter from forest canopies is related to forest cover, canopy structure and aboveground biomass (AGB). The S-band frequency (3.1–3.3 GHz) lies between the longer L-band (1–2 GHz) and the shorter C-band (5–6 GHz) and has been insufficiently studied for forest applications due [...] Read more.
Radar backscatter from forest canopies is related to forest cover, canopy structure and aboveground biomass (AGB). The S-band frequency (3.1–3.3 GHz) lies between the longer L-band (1–2 GHz) and the shorter C-band (5–6 GHz) and has been insufficiently studied for forest applications due to limited data availability. In anticipation of the British built NovaSAR-S satellite mission, this study evaluates the benefits of polarimetric S-band SAR for forest biophysical properties. To understand the scattering mechanisms in forest canopies at S-band the Michigan Microwave Canopy Scattering (MIMICS-I) radiative transfer model was used. S-band backscatter was found to have high sensitivity to the forest canopy characteristics across all polarisations and incidence angles. This sensitivity originates from ground/trunk interaction as the dominant scattering mechanism related to broadleaved species for co-polarised mode and specific incidence angles. The study was carried out in the temperate mixed forest at Savernake Forest and Wytham Woods in southern England, where airborne S-band SAR imagery and field data are available from the recent AirSAR campaign. Field data from the test sites revealed wide ranges of forest parameters, including average canopy height (6–23 m), diameter at breast-height (7–42 cm), basal area (0.2–56 m2/ha), stem density (20–350 trees/ha) and woody biomass density (31–520 t/ha). S-band backscatter-biomass relationships suggest increasing backscatter sensitivity to forest AGB with least error between 90.63 and 99.39 t/ha and coefficient of determination (r2) between 0.42 and 0.47 for the co-polarised channel at 0.25 ha resolution. The conclusion is that S-band SAR data such as from NovaSAR-S is suitable for monitoring forest aboveground biomass less than 100 t/ha at 25 m resolution in low to medium incidence angle range. Full article
(This article belongs to the Special Issue Remote Sensing of Vegetation Structure and Dynamics)
Show Figures

Graphical abstract

11219 KiB  
Article
A Novel Successive Cancellation Method to Retrieve Sea Wave Components from Spatio-Temporal Remote Sensing Image Sequences
by Yanbo Wei, Jian-Kang Zhang and Zhizhong Lu
Remote Sens. 2016, 8(7), 607; https://doi.org/10.3390/rs8070607 - 20 Jul 2016
Cited by 18 | Viewed by 4924
Abstract
In this paper, we consider retrieving individual wave components in a multi-directional sea wave model. To solve this problem, a currently and commonly used method is three-dimensional discrete Fourier transform (3D DFT) on the radar image sequence. However, the uniform frequency and the [...] Read more.
In this paper, we consider retrieving individual wave components in a multi-directional sea wave model. To solve this problem, a currently and commonly used method is three-dimensional discrete Fourier transform (3D DFT) on the radar image sequence. However, the uniform frequency and the uniform wavenumber in a wavenumber frequency domain can not always strictly satisfy the dispersion relation, and the spectral leakage in both temporal and spatial domains exists due to the limited analysis area selected from an image sequence. As a result, the DFT method incurs undesirable error performance in retrieving directional wave components. By deeply investigating the data structure of the multi-directional sea wave model, we obtain a new and decomposable matrix representation for processing the wave components. Then, a novel successive cancellation method is proposed to efficiently and effectively extract individual wave components, whose frequency and wavenumber rigorously satisfy the liner dispersion relation. Thus, it avoids spectral leakage in the spatial domain. The algorithm is evaluated by using linear synthetic wave image sequences. The validity of the proposed novel algorithm is verified by comparing the retrieved parameters of amplitude, phase, and direction of the individual wave components with the simulated parameters as well as those obtained by using the 3D DFT method. In addition, the reconstructed sea field using the retrieved wave components is also compared with the simulated remote sensing images as well as those attained using the inverse 3D DFT method. All the simulation results demonstrate that our proposed algorithm is more effective and has better performance for retrieving individual wave components from the spatio-temporal remote sensing image sequences than the 3D DFT method. Full article
Show Figures

Graphical abstract

46461 KiB  
Article
Monitoring Urban Areas with Sentinel-2A Data: Application to the Update of the Copernicus High Resolution Layer Imperviousness Degree
by Antoine Lefebvre, Christophe Sannier and Thomas Corpetti
Remote Sens. 2016, 8(7), 606; https://doi.org/10.3390/rs8070606 - 19 Jul 2016
Cited by 125 | Viewed by 20225
Abstract
Monitoring with high resolution land cover and especially of urban areas is a key task that is more and more required in a number of applications (urban planning, health monitoring, ecology, etc.). At the moment, some operational products, such as the “Copernicus High [...] Read more.
Monitoring with high resolution land cover and especially of urban areas is a key task that is more and more required in a number of applications (urban planning, health monitoring, ecology, etc.). At the moment, some operational products, such as the “Copernicus High Resolution Imperviousness Layer”, are available to assess this information, but the frequency of updates is still limited despite the fact that more and more very high resolution data are acquired. In particular, the recent launch of the Sentinel-2A satellite in June 2015 makes available data with a minimum spatial resolution of 10 m, 13 spectral bands, wide acquisition coverage and short time revisits, which opens a large scale of new applications. In this work, we propose to exploit the benefit of Sentinel-2 images to monitor urban areas and to update Copernicus Land services, in particular the High Resolution Layer imperviousness. The approach relies on independent image classification (using already available Landsat images and new Sentinel-2 images) that are fused using the Dempster–Shafer theory. Experiments are performed on two urban areas: a large European city, Prague, in the Czech Republic, and a mid-sized one, Rennes, in France. Results, validated with a Kappa index over 0.9, illustrate the great interest of Sentinel-2 in operational projects, such as Copernicus products, and since such an approach can be conducted on very large areas, such as the European or global scale. Though classification and data fusion are not new, our process is original in the way it optimally combines uncertainties issued from classifications to generate more confident and precise imperviousness maps. The choice of imperviousness comes from the fact that it is a typical application where research meets the needs of an operational production. Moreover, the methodology presented in this paper can be used in any other land cover classification task using regular acquisitions issued, for example, from Sentinel-2. Full article
Show Figures

Graphical abstract

4219 KiB  
Article
Active Optical Sensing of Spring Maize for In-Season Diagnosis of Nitrogen Status Based on Nitrogen Nutrition Index
by Tingting Xia, Yuxin Miao, Dali Wu, Hui Shao, Rajiv Khosla and Guohua Mi
Remote Sens. 2016, 8(7), 605; https://doi.org/10.3390/rs8070605 - 19 Jul 2016
Cited by 92 | Viewed by 9343
Abstract
The nitrogen (N) nutrition index (NNI) is a reliable indicator of crop N status and there is an urgent need to develop efficient technologies for non-destructive estimation of NNI to support the practical applications of precision N management strategies. The objectives of this [...] Read more.
The nitrogen (N) nutrition index (NNI) is a reliable indicator of crop N status and there is an urgent need to develop efficient technologies for non-destructive estimation of NNI to support the practical applications of precision N management strategies. The objectives of this study were to: (i) validate a newly established critical N dilution curve for spring maize in Northeast China; (ii) determine the potential of using the GreenSeeker active optical sensor to non-destructively estimate NNI; and (iii) evaluate the performance of different N status diagnostic approaches based on estimated NNI via the GreenSeeker sensor measurements. Four field experiments involving six N rates (0, 60, 120,180, 240, and 300 kg·ha−1) were conducted in 2014 and 2015 in Lishu County, Jilin Province in Northeast China. The results indicated that the newly established critical N dilution curve was suitable for spring maize N status diagnosis in the study region. Across site-years and growth stages (V5–V10), GreenSeeker sensor-based vegetation indices (VIs) explained 87%–90%, 87%–89% and 83%–84% variability of leaf area index (LAI), aboveground biomass (AGB) and plant N uptake (PNU), respectively. However, normalized difference vegetation index (NDVI) became saturated when LAI > 2 m2·m−2, AGB > 3 t·ha−1 or PNU > 80 kg·ha−1. The GreenSeeker-based VIs performed better for estimating LAI, AGB and PNU at V5–V6 and V7–V8 than the V9–V10 growth stages, but were very weakly related to plant N concentration. The response index calculated with GreenSeeker NDVI (RI–NDVI) and ratio vegetation index (R2 = 0.56–0.68) performed consistently better than the original VIs (R2 = 0.33–0.55) for estimating NNI. The N status diagnosis accuracy rate using RI–NDVI was 81% and 71% at V7–V8 and V9–V10 growth stages, respectively. We conclude that the response indices calculated with the GreenSeeker-based vegetation indices can be used to estimate spring maize NNI non-destructively and for in-season N status diagnosis between V7 and V10 growth stages under experimental conditions with variable N supplies. More studies are needed to further evaluate different approaches under diverse on-farm conditions and develop side-dressing N recommendation algorithms. Full article
(This article belongs to the Special Issue Remote Sensing in Precision Agriculture)
Show Figures

Graphical abstract

13833 KiB  
Article
Flood Damage Analysis: First Floor Elevation Uncertainty Resulting from LiDAR-Derived Digital Surface Models
by José María Bodoque, Carolina Guardiola-Albert, Estefanía Aroca-Jiménez, Miguel Ángel Eguibar and María Lorena Martínez-Chenoll
Remote Sens. 2016, 8(7), 604; https://doi.org/10.3390/rs8070604 - 19 Jul 2016
Cited by 30 | Viewed by 8513
Abstract
The use of high resolution ground-based light detection and ranging (LiDAR) datasets provides spatial density and vertical precision for obtaining highly accurate Digital Surface Models (DSMs). As a result, the reliability of flood damage analysis has improved significantly, owing to the increased accuracy [...] Read more.
The use of high resolution ground-based light detection and ranging (LiDAR) datasets provides spatial density and vertical precision for obtaining highly accurate Digital Surface Models (DSMs). As a result, the reliability of flood damage analysis has improved significantly, owing to the increased accuracy of hydrodynamic models. In addition, considerable error reduction has been achieved in the estimation of first floor elevation, which is a critical parameter for determining structural and content damages in buildings. However, as with any discrete measurement technique, LiDAR data contain object space ambiguities, especially in urban areas where the presence of buildings and the floodplain gives rise to a highly complex landscape that is largely corrected by using ancillary information based on the addition of breaklines to a triangulated irregular network (TIN). The present study provides a methodological approach for assessing uncertainty regarding first floor elevation. This is based on: (i) generation an urban TIN from LiDAR data with a density of 0.5 points·m−2, complemented with the river bathymetry obtained from a field survey with a density of 0.3 points·m−2. The TIN was subsequently improved by adding breaklines and was finally transformed to a raster with a spatial resolution of 2 m; (ii) implementation of a two-dimensional (2D) hydrodynamic model based on the 500-year flood return period. The high resolution DSM obtained in the previous step, facilitated addressing the modelling, since it represented suitable urban features influencing hydraulics (e.g., streets and buildings); and (iii) determination of first floor elevation uncertainty within the 500-year flood zone by performing Monte Carlo simulations based on geostatistics and 1997 control elevation points in order to assess error. Deviations in first floor elevation (average: 0.56 m and standard deviation: 0.33 m) show that this parameter has to be neatly characterized in order to obtain reliable assessments of flood damage assessments and implement realistic risk management. Full article
(This article belongs to the Special Issue Uncertainties in Remote Sensing)
Show Figures

Graphical abstract

7946 KiB  
Article
Land Degradation States and Trends in the Northwestern Maghreb Drylands, 1998–2008
by Gabriel Del Barrio, Maria E. Sanjuan, Azziz Hirche, Mohamed Yassin, Alberto Ruiz, Mohamed Ouessar, Jaime Martinez Valderrama, Bouajila Essifi and Juan Puigdefabregas
Remote Sens. 2016, 8(7), 603; https://doi.org/10.3390/rs8070603 - 19 Jul 2016
Cited by 28 | Viewed by 7691
Abstract
States of ecological maturity and temporal trends of drylands in Morocco, Algeria and Tunisia north of 28°N are reported for 1998–2008. The input data were Normalized Difference Vegetation Index databases and corresponding climate fields, at a spatial resolution of 1 km and a [...] Read more.
States of ecological maturity and temporal trends of drylands in Morocco, Algeria and Tunisia north of 28°N are reported for 1998–2008. The input data were Normalized Difference Vegetation Index databases and corresponding climate fields, at a spatial resolution of 1 km and a temporal resolution of one month. States convey opposing dynamics of human exploitation and ecological succession. They were identified synchronically for the full period by comparing each location to all other locations in the study area under equivalent aridity. Rain Use Efficiency (RUE) at two temporal scales was used to estimate proxies for biomass and turnover rate. Biomass trends were determined for every location by stepwise regression using time and aridity as predictors. This enabled human-induced degradation to be separated from simple responses to interannual climate variation. Some relevant findings include large areas of degraded land, albeit improving over time or fluctuating with climate, but rarely degrading further; smaller, but significant areas of mature and reference vegetation in most climate zones; very low overall active degradation rates throughout the area during the decade observed; biomass accumulation over time exceeding depletion in most zones; and negative feedback between land states and trends suggesting overall landscape persistence. Semiarid zones were found to be the most vulnerable. Those results can be disaggregated by country or province. The combination with existing land cover maps and national forest inventories leads to the information required by the two progress indicators associated with the United Nations Convention to Combat Desertification strategic objective to improve the conditions of ecosystems and with the Sustainable Development Goal Target 15.3 to achieve land degradation neutrality. Beyond that, the results are also useful as a basis for land management and restoration. Full article
Show Figures

Graphical abstract

3600 KiB  
Article
The Use of Aerial RGB Imagery and LIDAR in Comparing Ecological Habitats and Geomorphic Features on a Natural versus Man-Made Barrier Island
by Carlton P. Anderson, Gregory A. Carter and William R. Funderburk
Remote Sens. 2016, 8(7), 602; https://doi.org/10.3390/rs8070602 - 16 Jul 2016
Cited by 19 | Viewed by 8040
Abstract
The Mississippi (MS) barrier island chain along the northern Gulf of Mexico coastline is subject to rapid changes in habitat, geomorphology and elevation by natural and anthropogenic disturbances. The purpose of this study was to compare habitat type coverage with respective elevation, geomorphic [...] Read more.
The Mississippi (MS) barrier island chain along the northern Gulf of Mexico coastline is subject to rapid changes in habitat, geomorphology and elevation by natural and anthropogenic disturbances. The purpose of this study was to compare habitat type coverage with respective elevation, geomorphic features and short-term change between the naturally-formed East Ship Island and the man-made Sand Island. Ground surveys, multi-year remotely-sensed data, habitat classifications and digital elevation models were used to quantify short-term habitat and geomorphic change, as well as to examine the relationships between habitat types and micro-elevation. Habitat types and species composition were the same on both islands with the exception of the algal flat existing on the lower elevated spits of East Ship. Both islands displayed common patterns of vegetation succession and ranges of existence in elevation. Additionally, both islands showed similar geomorphic features, such as fore and back dunes and ponds. Storm impacts had the most profound effects on vegetation and geomorphic features throughout the study period. Although vastly different in age, these two islands show remarkable commonalities among the traits investigated. In comparison to East Ship, Sand Island exhibits key characteristics of a natural barrier island in terms of its vegetated habitats, geomorphic features and response to storm impacts, although it was established anthropogenically only decades ago. Full article
(This article belongs to the Special Issue Remote Sensing in Coastal Environments)
Show Figures

Graphical abstract

2826 KiB  
Article
Kernel Supervised Ensemble Classifier for the Classification of Hyperspectral Data Using Few Labeled Samples
by Jike Chen, Junshi Xia, Peijun Du, Jocelyn Chanussot, Zhaohui Xue and Xiangjian Xie
Remote Sens. 2016, 8(7), 601; https://doi.org/10.3390/rs8070601 - 15 Jul 2016
Cited by 16 | Viewed by 6231
Abstract
Kernel-based methods and ensemble learning are two important paradigms for the classification of hyperspectral remote sensing images. However, they were developed in parallel with different principles. In this paper, we aim to combine the advantages of kernel and ensemble methods by proposing a [...] Read more.
Kernel-based methods and ensemble learning are two important paradigms for the classification of hyperspectral remote sensing images. However, they were developed in parallel with different principles. In this paper, we aim to combine the advantages of kernel and ensemble methods by proposing a kernel supervised ensemble classification method. In particular, the proposed method, namely RoF-KOPLS, combines the merits of ensemble feature learning (i.e., Rotation Forest (RoF)) and kernel supervised learning (i.e., Kernel Orthonormalized Partial Least Square (KOPLS)). In particular, the feature space is randomly split into K disjoint subspace and KOPLS is applied to each subspace to produce the new features set for the training of decision tree classifier. The final classification result is assigned to the corresponding class by the majority voting rule. Experimental results on two hyperspectral airborne images demonstrated that RoF-KOPLS with radial basis function (RBF) kernel yields the best classification accuracies due to the ability of improving the accuracies of base classifiers and the diversity within the ensemble, especially for the very limited training set. Furthermore, our proposed method is insensitive to the number of subsets. Full article
Show Figures

Graphical abstract

3297 KiB  
Article
Quantifying the Impacts of Environmental Factors on Vegetation Dynamics over Climatic and Management Gradients of Central Asia
by Olena Dubovyk, Tobias Landmann, Andreas Dietz and Gunter Menz
Remote Sens. 2016, 8(7), 600; https://doi.org/10.3390/rs8070600 - 15 Jul 2016
Cited by 39 | Viewed by 7897
Abstract
Currently there is a lack of quantitative information regarding the driving factors of vegetation dynamics in post-Soviet Central Asia. Insufficient knowledge also exists concerning vegetation variability across sub-humid to arid climatic gradients as well as vegetation response to different land uses, from natural [...] Read more.
Currently there is a lack of quantitative information regarding the driving factors of vegetation dynamics in post-Soviet Central Asia. Insufficient knowledge also exists concerning vegetation variability across sub-humid to arid climatic gradients as well as vegetation response to different land uses, from natural rangelands to intensively irrigated croplands. In this study, we analyzed the environmental drivers of vegetation dynamics in five Central Asian countries by coupling key vegetation parameter “overall greenness” derived from Moderate Resolution Imaging Spectroradiometer (MODIS) Normalized Difference Vegetation Index (NDVI time series data, with its possible factors across various management and climatic gradients. We developed nine generalized least-squares random effect (GLS-RE) models to analyze the relative impact of environmental factors on vegetation dynamics. The obtained results quantitatively indicated the extensive control of climatic factors on managed and unmanaged vegetation cover across Central Asia. The most diverse vegetation dynamics response to climatic variables was observed for “intensively managed irrigated croplands”. Almost no differences in response to these variables were detected for managed non-irrigated vegetation and unmanaged (natural) vegetation across all countries. Natural vegetation and rainfed non-irrigated crop dynamics were principally associated with temperature and precipitation parameters. Variables related to temperature had the greatest relative effect on irrigated croplands and on vegetation cover within the mountainous zone. Further research should focus on incorporating the socio-economic factors discussed here in a similar analysis. Full article
(This article belongs to the Special Issue Monitoring of Land Changes)
Show Figures

Graphical abstract

3780 KiB  
Article
A Merging Framework for Rainfall Estimation at High Spatiotemporal Resolution for Distributed Hydrological Modeling in a Data-Scarce Area
by Yinping Long, Yaonan Zhang and Qimin Ma
Remote Sens. 2016, 8(7), 599; https://doi.org/10.3390/rs8070599 - 15 Jul 2016
Cited by 35 | Viewed by 7066
Abstract
Merging satellite and rain gauge data by combining accurate quantitative rainfall from stations with spatial continuous information from remote sensing observations provides a practical method of estimating rainfall. However, generating high spatiotemporal rainfall fields for catchment-distributed hydrological modeling is a problem when only [...] Read more.
Merging satellite and rain gauge data by combining accurate quantitative rainfall from stations with spatial continuous information from remote sensing observations provides a practical method of estimating rainfall. However, generating high spatiotemporal rainfall fields for catchment-distributed hydrological modeling is a problem when only a sparse rain gauge network and coarse spatial resolution of satellite data are available. The objective of the study is to present a satellite and rain gauge data-merging framework adapting for coarse resolution and data-sparse designs. In the framework, a statistical spatial downscaling method based on the relationships among precipitation, topographical features, and weather conditions was used to downscale the 0.25° daily rainfall field derived from the Tropical Rainfall Measuring Mission (TRMM) Multisatellite Precipitation Analysis (TMPA) precipitation product version 7. The nonparametric merging technique of double kernel smoothing, adapting for data-sparse design, was combined with the global optimization method of shuffled complex evolution, to merge the downscaled TRMM and gauged rainfall with minimum cross-validation error. An indicator field representing the presence and absence of rainfall was generated using the indicator kriging technique and applied to the previously merged result to consider the spatial intermittency of daily rainfall. The framework was applied to estimate daily precipitation at a 1 km resolution in the Qinghai Lake Basin, a data-scarce area in the northeast of the Qinghai-Tibet Plateau. The final estimates not only captured the spatial pattern of daily and annual precipitation with a relatively small estimation error, but also performed very well in stream flow simulation when applied to force the geomorphology-based hydrological model (GBHM). The proposed framework thus appears feasible for rainfall estimation at high spatiotemporal resolution in data-scarce areas. Full article
Show Figures

Graphical abstract

21980 KiB  
Article
Glacier Remote Sensing Using Sentinel-2. Part I: Radiometric and Geometric Performance, and Application to Ice Velocity
by Andreas Kääb, Solveig H. Winsvold, Bas Altena, Christopher Nuth, Thomas Nagler and Jan Wuite
Remote Sens. 2016, 8(7), 598; https://doi.org/10.3390/rs8070598 - 15 Jul 2016
Cited by 135 | Viewed by 19448
Abstract
With its temporal resolution of 10 days (five days with two satellites, and significantly more at high latitudes), its swath width of 290 km, and its 10 m and 20 m spatial resolution bands from the visible to the shortwave infrared, the European [...] Read more.
With its temporal resolution of 10 days (five days with two satellites, and significantly more at high latitudes), its swath width of 290 km, and its 10 m and 20 m spatial resolution bands from the visible to the shortwave infrared, the European Sentinel-2 satellites have significant potential for glacier remote sensing, in particular mapping of glacier outlines and facies, and velocity measurements. Testing Level 1C commissioning and ramp-up phase data for initial sensor quality experiences, we find a high radiometric performance, but with slight striping effects under certain conditions. Through co-registration of repeat Sentinal-2 data we also find lateral offset patterns and noise on the order of a few metres. Neither of these issues will complicate most typical glaciological applications. Absolute geo-location of the data investigated was on the order of one pixel at the time of writing. The most severe geometric problem stems from vertical errors of the DEM used for ortho-rectifying Sentinel-2 data. These errors propagate into locally varying lateral offsets in the images, up to several pixels with respect to other georeferenced data, or between Sentinel-2 data from different orbits. Finally, we characterize the potential and limitations of tracking glacier flow from repeat Sentinel-2 data using a set of typical glaciers in different environments: Aletsch Glacier, Swiss Alps; Fox Glacier, New Zealand; Jakobshavn Isbree, Greenland; Antarctic Peninsula at the Larsen C ice shelf. Full article
Show Figures

Graphical abstract

3852 KiB  
Article
How Universal Is the Relationship between Remotely Sensed Vegetation Indices and Crop Leaf Area Index? A Global Assessment
by Yanghui Kang, Mutlu Özdoğan, Samuel C. Zipper, Miguel O. Román, Jeff Walker, Suk Young Hong, Michael Marshall, Vincenzo Magliulo, José Moreno, Luis Alonso, Akira Miyata, Bruce Kimball and Steven P. Loheide
Remote Sens. 2016, 8(7), 597; https://doi.org/10.3390/rs8070597 - 15 Jul 2016
Cited by 96 | Viewed by 12877
Abstract
Leaf Area Index (LAI) is a key variable that bridges remote sensing observations to the quantification of agroecosystem processes. In this study, we assessed the universality of the relationships between crop LAI and remotely sensed Vegetation Indices (VIs). We first compiled a global [...] Read more.
Leaf Area Index (LAI) is a key variable that bridges remote sensing observations to the quantification of agroecosystem processes. In this study, we assessed the universality of the relationships between crop LAI and remotely sensed Vegetation Indices (VIs). We first compiled a global dataset of 1459 in situ quality-controlled crop LAI measurements and collected Landsat satellite images to derive five different VIs including Simple Ratio (SR), Normalized Difference Vegetation Index (NDVI), two versions of the Enhanced Vegetation Index (EVI and EVI2), and Green Chlorophyll Index (CIGreen). Based on this dataset, we developed global LAI-VI relationships for each crop type and VI using symbolic regression and Theil-Sen (TS) robust estimator. Results suggest that the global LAI-VI relationships are statistically significant, crop-specific, and mostly non-linear. These relationships explain more than half of the total variance in ground LAI observations (R2 > 0.5), and provide LAI estimates with RMSE below 1.2 m2/m2. Among the five VIs, EVI/EVI2 are the most effective, and the crop-specific LAI-EVI and LAI-EVI2 relationships constructed by TS, are robust when tested by three independent validation datasets of varied spatial scales. While the heterogeneity of agricultural landscapes leads to a diverse set of local LAI-VI relationships, the relationships provided here represent global universality on an average basis, allowing the generation of large-scale spatial-explicit LAI maps. This study contributes to the operationalization of large-area crop modeling and, by extension, has relevance to both fundamental and applied agroecosystem research. Full article
Show Figures

Graphical abstract

5557 KiB  
Article
Potential of ENVISAT Radar Altimetry for Water Level Monitoring in the Pantanal Wetland
by Denise Dettmering, Christian Schwatke, Eva Boergens and Florian Seitz
Remote Sens. 2016, 8(7), 596; https://doi.org/10.3390/rs8070596 - 14 Jul 2016
Cited by 25 | Viewed by 8714
Abstract
Wetlands are important ecosystems playing an essential role for continental water regulation and the hydrologic cycle. Moreover, they are sensitive to climate changes as well as anthropogenic influences, such as land-use or dams. However, the monitoring of these regions is challenging as they [...] Read more.
Wetlands are important ecosystems playing an essential role for continental water regulation and the hydrologic cycle. Moreover, they are sensitive to climate changes as well as anthropogenic influences, such as land-use or dams. However, the monitoring of these regions is challenging as they are normally located in remote areas without in situ measurement stations. Radar altimetry provides important measurements for monitoring and analyzing water level variations in wetlands and flooded areas. Using the example of the Pantanal region in South America, this study demonstrates the capability and limitations of ENVISAT radar altimeter for monitoring water levels in inundation areas. By applying an innovative processing method consisting of a rigorous data screening by means of radar echo classification as well as an optimized waveform retracking, water level time series with respect to a global reference and with a temporal resolution of about one month are derived. A comparison between altimetry-derived height variations and six in situ time series reveals accuracies of 30 to 50 cm RMS. The derived water level time series document seasonal height variations of up to 1.5 m amplitude with maximum water levels between January and June. Large scale geographical pattern of water heights are visible within the wetland. However, some regions of the Pantanal show water level variations less than a few decimeter, which is below the accuracies of the method. These areas cannot be reliably monitored by ENVISAT. Full article
(This article belongs to the Special Issue What can Remote Sensing Do for the Conservation of Wetlands?)
Show Figures

Graphical abstract

28604 KiB  
Article
Pansharpening by Convolutional Neural Networks
by Giuseppe Masi, Davide Cozzolino, Luisa Verdoliva and Giuseppe Scarpa
Remote Sens. 2016, 8(7), 594; https://doi.org/10.3390/rs8070594 - 14 Jul 2016
Cited by 874 | Viewed by 24965
Abstract
A new pansharpening method is proposed, based on convolutional neural networks. We adapt a simple and effective three-layer architecture recently proposed for super-resolution to the pansharpening problem. Moreover, to improve performance without increasing complexity, we augment the input by including several maps of [...] Read more.
A new pansharpening method is proposed, based on convolutional neural networks. We adapt a simple and effective three-layer architecture recently proposed for super-resolution to the pansharpening problem. Moreover, to improve performance without increasing complexity, we augment the input by including several maps of nonlinear radiometric indices typical of remote sensing. Experiments on three representative datasets show the proposed method to provide very promising results, largely competitive with the current state of the art in terms of both full-reference and no-reference metrics, and also at a visual inspection. Full article
Show Figures

Graphical abstract

7265 KiB  
Article
Early Detection of Summer Crops Using High Spatial Resolution Optical Image Time Series
by Claire Marais Sicre, Jordi Inglada, Rémy Fieuzal, Frédéric Baup, Silvia Valero, Jérôme Cros, Mireille Huc and Valérie Demarez
Remote Sens. 2016, 8(7), 591; https://doi.org/10.3390/rs8070591 - 14 Jul 2016
Cited by 32 | Viewed by 8100
Abstract
In the context of climate change, agricultural managers have the imperative to combine sufficient productivity with durability of the resources. Many studies have shown the interest of recent satellite missions as suitable tools for agricultural surveys. Nevertheless, they are not predictive methods. A [...] Read more.
In the context of climate change, agricultural managers have the imperative to combine sufficient productivity with durability of the resources. Many studies have shown the interest of recent satellite missions as suitable tools for agricultural surveys. Nevertheless, they are not predictive methods. A system able to detect summer crops as early as possible is important in order to obtain valuable information for a better water management strategy. The detection of summer crops before the beginning of the irrigation period is therefore our objective. The study area is located near Toulouse (southwestern France), and is a region of mixed farming with a wide variety of irrigated and non-irrigated crops. Using the reference data for the years concerned, a set of fixed thresholds are applied to a vegetation index (the Normalized Difference Vegetation Index, NDVI) for each agricultural season of multi-spectral satellite optical imagery acquired at decametric spatial resolutions from 2006 to 2013. The performance (i.e., accuracy) is contrasted according to the agricultural practices, the development states of the different crops and the number of acquisition dates (one to three in the results presented here). The detection of summer crops reaches 64% to 88% with a single date, 80% to 88% with two dates and 90% to 99% with three dates. The robustness of this method is tested for several years (showing an impact of meteorological conditions on the actual choice of images), several sensors and several resolutions. Full article
Show Figures

Graphical abstract

8984 KiB  
Article
Quantifying Live Aboveground Biomass and Forest Disturbance of Mountainous Natural and Plantation Forests in Northern Guangdong, China, Based on Multi-Temporal Landsat, PALSAR and Field Plot Data
by Wenjuan Shen, Mingshi Li, Chengquan Huang and Anshi Wei
Remote Sens. 2016, 8(7), 595; https://doi.org/10.3390/rs8070595 - 13 Jul 2016
Cited by 40 | Viewed by 8058
Abstract
Spatially explicit knowledge of aboveground biomass (AGB) in large areas is important for accurate carbon accounting and quantifying the effect of forest disturbance on the terrestrial carbon cycle. We estimated AGB from 1990 to 2011 in northern Guangdong, China, based on a spatially [...] Read more.
Spatially explicit knowledge of aboveground biomass (AGB) in large areas is important for accurate carbon accounting and quantifying the effect of forest disturbance on the terrestrial carbon cycle. We estimated AGB from 1990 to 2011 in northern Guangdong, China, based on a spatially explicit dataset derived from six years of national forest inventory (NFI) plots, Landsat time series imagery (1986–2011) and Advanced Land Observing Satellite (ALOS) Phased Array L-band Synthetic Aperture Radars (PALSAR) 25 m mosaic data (2007–2010). Four types of variables were derived for modeling and assessment. The random forest approach was used to seek the optimal variables for mapping and validation. The root mean square error (RMSE) of plot-level validation was between 6.44 and 39.49 (t/ha), the normalized root-mean-square error (NRMSE) was between 7.49% and 19.01% and mean absolute error (MAE) was between 5.06 and 23.84 t/ha. The highest coefficient of determination R2 of 0.8 and the lowest NRMSE of 7.49% were reported in 2006. A clear increasing trend of mean AGB from the lowest value of 13.58 t/ha to the highest value of 66.25 t/ha was witnessed between 1988 and 2000, while after 2000 there was a fluctuating ascending change, with a peak mean AGB of 67.13 t/ha in 2004. By integrating AGB change with forest disturbance, the trend in disturbance area closely corresponded with the trend in AGB decrease. To determine the driving forces of these changes, the correlation analysis was adopted and exploratory factor analysis (EFA) method was used to find a factor rotation that maximizes this variance and represents the dominant factors of nine climate elements and nine human activities elements affecting the AGB dynamics. Overall, human activities contributed more to short-term AGB dynamics than climate data. Harvesting and human-induced fire in combination with rock desertification and global warming made a strong contribution to AGB changes. This study provides valuable information for the relationships between forest AGB and climate as well as forest disturbance in subtropical zones. Full article
(This article belongs to the Special Issue Remote Sensing of Vegetation Structure and Dynamics)
Show Figures

Graphical abstract

3102 KiB  
Article
An Operational Framework for Land Cover Classification in the Context of REDD+ Mechanisms. A Case Study from Costa Rica
by Alfredo Fernández-Landa, Nur Algeet-Abarquero, Jesús Fernández-Moya, María Luz Guillén-Climent, Lucio Pedroni, Felipe García, Andrés Espejo, Juan Felipe Villegas, Miguel Marchamalo, Javier Bonatti, Iñigo Escamochero, Pablo Rodríguez-Noriega, Stavros Papageorgiou and Erick Fernandes
Remote Sens. 2016, 8(7), 593; https://doi.org/10.3390/rs8070593 - 13 Jul 2016
Cited by 9 | Viewed by 8494
Abstract
REDD+ implementation requires robust, consistent, accurate and transparent national land cover historical data and monitoring systems. Satellite imagery is the only data source with enough periodicity to provide consistent land cover information in a cost-effective way. The main aim of this paper is [...] Read more.
REDD+ implementation requires robust, consistent, accurate and transparent national land cover historical data and monitoring systems. Satellite imagery is the only data source with enough periodicity to provide consistent land cover information in a cost-effective way. The main aim of this paper is the creation of an operational framework for monitoring land cover dynamics based on Landsat imagery and open-source software. The methodology integrates the entire land cover and land cover change mapping processes to produce a consistent series of Land Cover maps. The consistency of the time series is achieved through the application of a single trained machine learning algorithm to radiometrically normalized imagery using iteratively re-weighted multivariate alteration detection (IR-MAD) across all dates of the historical period. As a result, seven individual Land Cover maps of Costa Rica were produced from 1985/1986 to 2013/2014. Post-classification land cover change detection was performed to evaluate the land cover dynamics in Costa Rica. The validation of the land cover maps showed an overall accuracy of 87% for the 2013/2014 map, 93% for the 2000/2001 map and 89% for the 1985/1986 map. Land cover changes between forest and non-forest classes were validated for the period between 2001 and 2011, obtaining an overall accuracy of 86%. Forest age-classes were generated through a multi-temporal analysis of the maps. By linking deforestation dynamics with forest age, a more accurate discussion of the carbon emissions along the time series can be presented. Full article
Show Figures

Graphical abstract

2514 KiB  
Article
Tower-Based Validation and Improvement of MODIS Gross Primary Production in an Alpine Swamp Meadow on the Tibetan Plateau
by Ben Niu, Yongtao He, Xianzhou Zhang, Gang Fu, Peili Shi, Mingyuan Du, Yangjian Zhang and Ning Zong
Remote Sens. 2016, 8(7), 592; https://doi.org/10.3390/rs8070592 - 13 Jul 2016
Cited by 27 | Viewed by 6155
Abstract
Alpine swamp meadow on the Tibetan Plateau is among the most sensitive areas to climate change. Accurate quantification of the GPP in alpine swamp meadow can benefit our understanding of the global carbon cycle. The 8-day MODerate resolution Imaging Spectroradiometer (MODIS) gross primary [...] Read more.
Alpine swamp meadow on the Tibetan Plateau is among the most sensitive areas to climate change. Accurate quantification of the GPP in alpine swamp meadow can benefit our understanding of the global carbon cycle. The 8-day MODerate resolution Imaging Spectroradiometer (MODIS) gross primary production (GPP) products (GPP_MOD) provide a pathway to estimate GPP in this remote ecosystem. However, the accuracy of the GPP_MOD estimation in this representative alpine swamp meadow is still unknown. Here five years GPP_MOD was validated using GPP derived from the eddy covariance flux measurements (GPP_EC) from 2009 to 2013. Our results indicated that the GPP_EC was strongly underestimated by GPP_MOD with a daily mean less than 40% of EC measurements. To reduce this error, the ground meteorological and vegetation leaf area index (LAIG) measurements were used to revise the key inputs, the maximum light use efficiency (εmax) and the fractional photosynthetically active radiation (FPARM) in the MOD17 algorithm. Using two approaches to determine the site-specific εmax value, we suggested that the suitable εmax was about 1.61 g C MJ−1 for this alpine swamp meadow which was considerably larger than the default 0.68 g C MJ−1 for grassland. The FPARM underestimated 22.2% of the actual FPAR (FPARG) simulated from the LAIG during the whole study period. Model comparisons showed that the large inaccuracies of GPP_MOD were mainly caused by the underestimation of the εmax and followed by that of the undervalued FPAR. However, the DAO meteorology data in the MOD17 algorithm did not exert a significant affection in the MODIS GPP underestimations. Therefore, site-specific optimized parameters inputs, especially the εmax and FPARG, are necessary to improve the performance of the MOD17 algorithm in GPP estimation, in which the calibrated MOD17A2 algorithm (GPP_MODR3) could explain 91.6% of GPP_EC variance for the alpine swamp meadow. Full article
Show Figures

Graphical abstract

11262 KiB  
Article
Analysis and Mapping of the Spectral Characteristics of Fractional Green Cover in Saline Wetlands (NE Spain) Using Field and Remote Sensing Data
by Manuela Domínguez-Beisiegel, Carmen Castañeda, Bernard Mougenot and Juan Herrero
Remote Sens. 2016, 8(7), 590; https://doi.org/10.3390/rs8070590 - 13 Jul 2016
Cited by 16 | Viewed by 7876
Abstract
Inland saline wetlands are complex systems undergoing continuous changes in moisture and salinity and are especially vulnerable to human pressures. Remote sensing is helpful to identify vegetation change in semi-arid wetlands and to assess wetland degradation. Remote sensing-based monitoring requires identification of the [...] Read more.
Inland saline wetlands are complex systems undergoing continuous changes in moisture and salinity and are especially vulnerable to human pressures. Remote sensing is helpful to identify vegetation change in semi-arid wetlands and to assess wetland degradation. Remote sensing-based monitoring requires identification of the spectral characteristics of soils and vegetation and their correspondence with the vegetation cover and soil conditions. We studied the spectral characteristics of soils and vegetation of saline wetlands in Monegros, NE Spain, through field and satellite images. Radiometric and complementary field measurements in two field surveys in 2007 and 2008 were collected in selected sites deemed as representative of different soil moisture, soil color, type of vegetation, and density. Despite the high local variability, we identified good relationships between field spectral data and Quickbird images. A methodology was established for mapping the fraction of vegetation cover in Monegros and other semi-arid areas. Estimating vegetation cover in arid wetlands is conditioned by the soil background and by the occurrence of dry and senescent vegetation accompanying the green component of perennial salt-tolerant plants. Normalized Difference Vegetation Index (NDVI) was appropriate to map the distribution of the vegetation cover if the green and yellow-green parts of the plants are considered. Full article
(This article belongs to the Special Issue What can Remote Sensing Do for the Conservation of Wetlands?)
Show Figures

Graphical abstract

10015 KiB  
Article
Impact of Initial Soil Temperature Derived from Remote Sensing and Numerical Weather Prediction Datasets on the Simulation of Extreme Heat Events
by Igor Gómez, Vicente Caselles, María José Estrela and Raquel Niclòs
Remote Sens. 2016, 8(7), 589; https://doi.org/10.3390/rs8070589 - 13 Jul 2016
Cited by 12 | Viewed by 5915
Abstract
Extreme heat weather events have received increasing attention and has become of special importance as they can remarkably affect sectors as diverse as public health, energy consumption, water resources, natural biodiversity and agricultural production. In this regard, summer temperatures have become a parameter [...] Read more.
Extreme heat weather events have received increasing attention and has become of special importance as they can remarkably affect sectors as diverse as public health, energy consumption, water resources, natural biodiversity and agricultural production. In this regard, summer temperatures have become a parameter of essential interest under a framework of a hypothetical increase in the number of intense-heat conditions. Thus, their forecast is a crucial aspect bearing in mind a mitigation of the effects and impacts that these intense-heat situations could produce. The current work tries to reach a better understanding of these sorts of situations that are really common over the Western Mediterranean coast. An extreme heat episode that took place in the Valencia Region in July 2009 is analysed, based on the simulations performed with the Regional Atmospheric Modeling System (RAMS). This event recorded maximum temperatures exceeding 40 °C amply extended over the region besides reaching minimum temperatures up to 25.92 °C. We examine the role of improved skin and soil temperature (ST) initial conditions in the forecast results by means of different modelling and satellite-derived products. The influence of incorporating the Land Surface Temperature (LST) into RAMS is not found to produce a meaningful impact on the simulation results, independently of the resolution of the dataset used in the initial conditions of the model. In contrast, the introduction of the ST in lower levels, not only the skin temperature, has a more marked decisive effect in the simulation. Additionally, we have evaluated the influence of increasing the number of soil levels to spread deeper underground. This sensitivity experiment has revealed that more soil levels do not produce any meaningful impact on the simulation compared to the original one. In any case, RAMS is able to properly capture the observed patterns in those cases where a Western advection is widely extended over the area of study. This region’s variability in orography and in distances to the sea promotes the development of sea-breeze circulations, thus producing a convergence of two opposite wind flows, a Western synoptic advection and a sea-breeze circulation. As a result, the RAMS skill in those cases where a sea breeze is well developed depends on the proper location of the boundary and convergence lines of these two flows. Full article
Show Figures

Graphical abstract

5491 KiB  
Article
Automated Subpixel Surface Water Mapping from Heterogeneous Urban Environments Using Landsat 8 OLI Imagery
by Huan Xie, Xin Luo, Xiong Xu, Haiyan Pan and Xiaohua Tong
Remote Sens. 2016, 8(7), 584; https://doi.org/10.3390/rs8070584 - 12 Jul 2016
Cited by 87 | Viewed by 8229
Abstract
Water bodies are a fundamental element of urban ecosystems, and water mapping is critical for urban and landscape planning and management. Remote sensing has increasingly been used for water mapping in rural areas; however, when applied to urban areas, this spatially- explicit approach [...] Read more.
Water bodies are a fundamental element of urban ecosystems, and water mapping is critical for urban and landscape planning and management. Remote sensing has increasingly been used for water mapping in rural areas; however, when applied to urban areas, this spatially- explicit approach is a challenging task due to the fact that the water bodies are often of a small size and spectral confusion is common between water and the complex features in the urban environment. Water indexes are the most common method of water extraction at the pixel level. More recently, spectral mixture analysis (SMA) has been widely employed in analyzing the urban environment at the subpixel level. The objective of this study is to develop an automatic subpixel water mapping method (ASWM) which can achieve a high accuracy in urban areas. Specifically, we first apply a water index for the automatic extraction of mixed land-water pixels, and the pure water pixels that are generated in this process are exported as the final result. Secondly, the SMA technique is applied to the mixed land-water pixels for water abundance estimation. As for obtaining the most representative endmembers, we propose an adaptive iterative endmember selection method based on the spatial similarity of adjacent ground surfaces. One classical water index method (the modified normalized difference water index (MNDWI)), a pixel-level target detection method (constrained energy minimization (CEM)), and two widely used SMA methods (fully constrained least squares (FCLS) and multiple endmember spectral mixture analysis (MESMA)) were chosen for the water mapping comparison in the experiments. The results indicate that the proposed ASWM was able to detect water pixels more efficiency than other unsupervised water extraction methods, and the water fractions estimated by the proposed ASWM method correspond closely to the reference fractions with the slopes of 0.97, 1.02, 1.04, and 0.98 and the R-squared values of 0.9454, 0.9486, 0.9665, and 0.9607 in regression analysis corresponding to different test regions. In the quantitative accuracy assessment, the ASWM method shows the best performance in water mapping with the mean kappa coefficient of 0.862, mean producer’s accuracy of 82.8%, and mean user’s accuracy of 91.8% for test regions. Full article
Show Figures

Graphical abstract

952 KiB  
Article
Hyperspectral Unmixing with Robust Collaborative Sparse Regression
by Chang Li, Yong Ma, Xiaoguang Mei, Chengyin Liu and Jiayi Ma
Remote Sens. 2016, 8(7), 588; https://doi.org/10.3390/rs8070588 - 11 Jul 2016
Cited by 39 | Viewed by 5548
Abstract
Recently, sparse unmixing (SU) of hyperspectral data has received particular attention for analyzing remote sensing images. However, most SU methods are based on the commonly admitted linear mixing model (LMM), which ignores the possible nonlinear effects (i.e., nonlinearity). In this paper, we propose [...] Read more.
Recently, sparse unmixing (SU) of hyperspectral data has received particular attention for analyzing remote sensing images. However, most SU methods are based on the commonly admitted linear mixing model (LMM), which ignores the possible nonlinear effects (i.e., nonlinearity). In this paper, we propose a new method named robust collaborative sparse regression (RCSR) based on the robust LMM (rLMM) for hyperspectral unmixing. The rLMM takes the nonlinearity into consideration, and the nonlinearity is merely treated as outlier, which has the underlying sparse property. The RCSR simultaneously takes the collaborative sparse property of the abundance and sparsely distributed additive property of the outlier into consideration, which can be formed as a robust joint sparse regression problem. The inexact augmented Lagrangian method (IALM) is used to optimize the proposed RCSR. The qualitative and quantitative experiments on synthetic datasets and real hyperspectral images demonstrate that the proposed RCSR is efficient for solving the hyperspectral SU problem compared with the other four state-of-the-art algorithms. Full article
Show Figures

Graphical abstract

4775 KiB  
Article
Multi-Temporal Evaluation of Soil Moisture and Land Surface Temperature Dynamics Using in Situ and Satellite Observations
by Miriam Pablos, José Martínez-Fernández, María Piles, Nilda Sánchez, Mercè Vall-llossera and Adriano Camps
Remote Sens. 2016, 8(7), 587; https://doi.org/10.3390/rs8070587 - 11 Jul 2016
Cited by 54 | Viewed by 8744
Abstract
Soil moisture (SM) is an important component of the Earth’s surface water balance and by extension the energy balance, regulating the land surface temperature (LST) and evapotranspiration (ET). Nowadays, there are two missions dedicated to monitoring the Earth’s surface SM using L-band radiometers: [...] Read more.
Soil moisture (SM) is an important component of the Earth’s surface water balance and by extension the energy balance, regulating the land surface temperature (LST) and evapotranspiration (ET). Nowadays, there are two missions dedicated to monitoring the Earth’s surface SM using L-band radiometers: ESA’s Soil Moisture and Ocean Salinity (SMOS) and NASA’s Soil Moisture Active Passive (SMAP). LST is remotely sensed using thermal infrared (TIR) sensors on-board satellites, such as NASA’s Terra/Aqua MODIS or ESA & EUMETSAT’s MSG SEVIRI. This study provides an assessment of SM and LST dynamics at daily and seasonal scales, using 4 years (2011–2014) of in situ and satellite observations over the central part of the river Duero basin in Spain. Specifically, the agreement of instantaneous SM with a variety of LST-derived parameters is analyzed to better understand the fundamental link of the SM–LST relationship through ET and thermal inertia. Ground-based SM and LST measurements from the REMEDHUS network are compared to SMOS SM and MODIS LST spaceborne observations. ET is obtained from the HidroMORE regional hydrological model. At the daily scale, a strong anticorrelation is observed between in situ SM and maximum LST (R 0.6 to −0.8), and between SMOS SM and MODIS LST Terra/Aqua day (R 0.7). At the seasonal scale, results show a stronger anticorrelation in autumn, spring and summer (in situ R 0.5 to −0.7; satellite R 0.4 to −0.7) indicating SM–LST coupling, than in winter (in situ R ≈ +0.3; satellite R 0.3) indicating SM–LST decoupling. These different behaviors evidence changes from water-limited to energy-limited moisture flux across seasons, which are confirmed by the observed ET evolution. In water-limited periods, SM is extracted from the soil through ET until critical SM is reached. A method to estimate the soil critical SM is proposed. For REMEDHUS, the critical SM is estimated to be ∼0.12 m 3 /m 3 , stable over the study period and consistent between in situ and satellite observations. A better understanding of the SM–LST link could not only help improving the representation of LST in current hydrological and climate prediction models, but also refining SM retrieval or microwave-optical disaggregation algorithms, related to ET and vegetation status. Full article
(This article belongs to the Special Issue Remote Sensing Applied to Soils: From Ground to Space)
Show Figures

Graphical abstract

3361 KiB  
Article
Downscaling Meteosat Land Surface Temperature over a Heterogeneous Landscape Using a Data Assimilation Approach
by Rihab Mechri, Catherine Ottlé, Olivier Pannekoucke, Abdelaziz Kallel, Fabienne Maignan, Dominique Courault and Isabel F. Trigo
Remote Sens. 2016, 8(7), 586; https://doi.org/10.3390/rs8070586 - 11 Jul 2016
Cited by 8 | Viewed by 5806
Abstract
A wide range of environmental applications require the monitoring of land surface temperature (LST) at frequent intervals and fine spatial resolutions, but these conditions are not offered nowadays by the available space sensors. To overcome these shortcomings, LST downscaling methods have been developed [...] Read more.
A wide range of environmental applications require the monitoring of land surface temperature (LST) at frequent intervals and fine spatial resolutions, but these conditions are not offered nowadays by the available space sensors. To overcome these shortcomings, LST downscaling methods have been developed to derive higher resolution LST from the available satellite data. This research concerns the application of a data assimilation (DA) downscaling approach, the genetic particle smoother (GPS), to disaggregate Meteosat 8 LST time series (3 km × 5 km) at finer spatial resolutions. The methodology was applied over the Crau-Camargue region in Southeastern France for seven months in 2009. The evaluation of the downscaled LSTs has been performed at a moderate resolution using a set of coincident clear-sky MODIS LST images from Aqua and Terra platforms (1 km × 1 km) and at a higher resolution using Landsat 7 data (60 m × 60 m). The performance of the downscaling has been assessed in terms of reduction of the biases and the root mean square errors (RMSE) compared to prior model-simulated LSTs. The results showed that GPS allows downscaling the Meteosat LST product from 3 × 5 km2 to 1 × 1 km2 scales with a RMSE less than 2.7 K. Finer scale downscaling at Landsat 7 resolution showed larger errors (RMSE around 5 K) explained by land cover errors and inter-calibration issues between sensors. Further methodology improvements are finally suggested. Full article
Show Figures

Graphical abstract

3194 KiB  
Article
Crop Area Mapping Using 100-m Proba-V Time Series
by Yetkin Özüm Durgun, Anne Gobin, Ruben Van De Kerchove and Bernard Tychon
Remote Sens. 2016, 8(7), 585; https://doi.org/10.3390/rs8070585 - 11 Jul 2016
Cited by 26 | Viewed by 7197
Abstract
A method was developed for crop area mapping inspired by spectral matching techniques (SMTs) and based on phenological characteristics of different crop types applied using 100-m Proba-V NDVI data for the season 2014–2015. Ten-daily maximum value NDVI composites were created and smoothed in [...] Read more.
A method was developed for crop area mapping inspired by spectral matching techniques (SMTs) and based on phenological characteristics of different crop types applied using 100-m Proba-V NDVI data for the season 2014–2015. Ten-daily maximum value NDVI composites were created and smoothed in SPIRITS (spirits.jrc.ec.europa.eu). The study sites were globally spread agricultural areas located in Flanders (Belgium), Sria (Russia), Kyiv (Ukraine) and Sao Paulo (Brazil). For each pure pixel within the field, the NDVI profile of the crop type for its growing season was matched with the reference NDVI profile based on the training set extracted from the study site where the crop type originated. Three temporal windows were tested within the growing season: green-up to senescence, green-up to dormancy and minimum NDVI at the beginning of the growing season to minimum NDVI at the end of the growing season. Post classification rules were applied to the results to aggregate the crop type at the plot level. The overall accuracy (%) ranged between 65 and 86, and the kappa coefficient changed from 0.43–0.84 according to the site and the temporal window. In order of importance, the crop phenological development period, parcel size, shorter time window, number of ground-truth parcels and crop calendar similarity were the main reasons behind the differences between the results. The methodology described in this study demonstrated that 100-m Proba-V has the potential to be used in crop area mapping across different regions in the world. Full article
Show Figures

Graphical abstract

Previous Issue
Next Issue
Back to TopTop