Article

Removal of Thin Cirrus Scattering Effects in Landsat 8 OLI Images Using the Cirrus Detecting Channel

1
Remote Sensing Division, Code 7232, Naval Research Lab, Washington, DC 20375, USA
2
Remote Sensing Division, Code 7234, Naval Research Lab, Washington, DC 20375, USA
*
Author to whom correspondence should be addressed.
Remote Sens. 2017, 9(8), 834; https://doi.org/10.3390/rs9080834
Submission received: 12 July 2017 / Revised: 24 July 2017 / Accepted: 10 August 2017 / Published: 12 August 2017
(This article belongs to the Special Issue Atmospheric Correction of Remote Sensing Data)

Abstract

:
Thin cirrus clouds frequently contaminate images acquired with either Landsat 7 ETM+ or the earlier generation of Landsat series satellite instruments. The situation has changed since the launch of the Landsat 8 Operational Land Imager (OLI) into space in 2013. OLI implemented a cirrus detecting channel (Band 9) centered within a strong atmospheric water vapor absorption band near 1.375 μm with a width of 30 nm. The specifications for this channel were the same as those specified for the NASA Moderate Resolution Imaging Spectroradiometer (MODIS) in the early 1990s. The OLI Band 9 has been proven to be very effective in detecting and masking thin cirrus-contaminated pixels at the high spatial resolution of 30 m. However, this channel has not yet been routinely used for the correction of thin cirrus effects in other OLI band images. In this article, we describe an empirical technique for the removal of thin cirrus scattering effects in OLI visible near infrared (IR) and shortwave IR (SWIR) spectral regions. We present results from applications of the technique to three OLI data sets. We also discuss issues associated with parallax anomalies in OLI data.

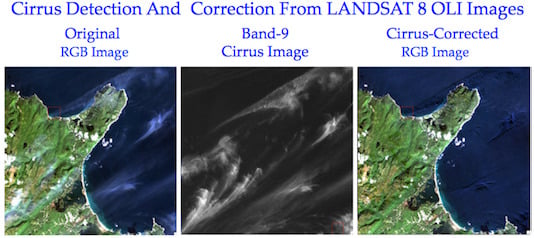
Graphical Abstract

1. Introduction

Thin cirrus clouds used to be difficult to detect, particularly over land, in images taken from satellite platforms prior to the year 2000. Through analysis of hyperspectral imaging data acquired by the NASA/JPL Airborne Visible/Infrared Imaging Spectrometer (AVIRIS) [1,2] from an ER-2 aircraft at an altitude of 20 km, we observed that images of narrow channels located near the centers of the 1.38- and 1.88-μm strong water vapor band absorption regions were very sensitive to the presence of thin cirrus clouds over both land and water surfaces [3]. The detection makes use of the fact that cirrus clouds are located above almost all of the atmospheric water vapor. Due to the strong water vapor absorption in the lower atmosphere, AVIRIS channels near 1.38 µm receive little scattered solar radiance from the surface or low-level clouds. When cirrus clouds are present, however, these channels receive large amounts of scattered solar radiance from the cirrus clouds. Based on observations from AVIRIS data, we proposed a channel centered at 1.375 μm with a width of 30 nm for the Moderate Resolution Imaging Spectroradiometer (MODIS) [4,5] for the remote sensing of cirrus clouds from space. With strong support from the MODIS Science Team and from NASA Goddard Space Flight Center management, the proposed channel was implemented on both the Terra and Aqua MODIS instruments. Similar cirrus detecting channels have been implemented in other satellite instruments, including the VIIRS (Visible Infrared Imaging Radiometer Suite) [6] on board the Suomi NPP (National Polar-orbiting Partnership) satellite, the MSI (MultiSpectral Instrument) on board the European Sentinel-2 spacecraft [7], and the Operational Land Imager (OLI) on board the Landsat 8 satellite [8]. The designers of OLI Band 9, which is officially referred as the "cirrus band" by the Landsat Project, adopted approximately the same specifications in band position, width, and saturation radiance as those specified by us for MODIS in late 1992 [9].
It has been proven that the OLI Band 9 is very effective in detecting thin cirrus clouds. Figure 1a shows a portion of an OLI true color RGB (red, green, and blue) image. The data was acquired over Cape Breton Island in eastern Canada (northeast of Halifax) on 16 September 2014. The center of the scene is located at a latitude of approximately 46.8° N and a longitude of 60.5° W. Thin cirrus clouds are seen over both land and water surfaces. Figure 1b shows the Band 9 image, where only the upper level thin cirrus clouds are seen. The land and water surface features in Figure 1a are not seen in Figure 1b. This demonstrates clearly that the OLI Band 9 is very effective for thin cirrus detection.
So far, the OLI Band 9 has been used operationally for the generation of cloud masks [10]. A few researchers reported the use of Band 9 for the correction of thin cirrus effects in other OLI bands [11,12]. For example, Xu et al. [11] described two methods from an imaging processing perspective on using Band 9 for the removal of thin cirrus effects in other OLI bands. Shen et al. [12] described a cloud removal technique based on independent component analysis. However, thin cirrus corrections have not been operationally made using these published cirrus correction techniques in OLI land and ocean surface reflectance data products. In order to make accurate studies of land and water properties, thin cirrus effects must be removed from the OLI surface reflectance data products. In this article, we describe an empirical technique that can potentially be used for the operational removal of thin cirrus scattering effects in OLI visible near infrared (IR) and shortwave IR (SWIR) spectral regions. The technique is an extension of our previously developed method using the 1.38-μm and 0.66-μm band images for the operational generation of MODIS cirrus reflectance data product in the 0.4−1.0 μm wavelength range [13]. We will demonstrate that it is now possible to derive cirrus reflectances for OLI SWIR channels. We will present results from applications of the technique to three OLI data sets.

2. Materials and Methods

The Landsat 8 OLI instrument has nine bands. Their names, positions, and widths are listed in Table 1 and shown in Figure 2. We use hyperspectral imaging data acquired with the NASA/JPL AVIRIS instrument to illustrate the cirrus reflectance properties relevant to the OLI bands. In Figure 2, we also show examples of thick and thin cirrus "apparent reflectance" spectra acquired with AVIRIS over Monterey Bay, California on 4 September 1992. The apparent reflectance is defined in the following way. Omitting for convenience the wavelength (λ) dependency, we denote the apparent reflectance ρ* at a satellite (or a high altitude aircraft) as
ρ * = π L μ 0 E 0
where L is the radiance measured by the satellite, μ0 is the cosine of solar zenith angle, and E0 is the extra-terrestrial solar flux. Since ocean waters are strongly absorbing at 0.7 µm and longer wavelengths, the surface contributions to the AVIRIS-measured apparent reflectances above 0.7 µm are essentially zero, and the measured apparent reflectances are approximately equal to the cirrus reflectances multiplied by the Sun-cirrus-sensor L-shaped two-way atmospheric gas transmittances. In the Figure 2 spectra, water vapor absorption features centered near 0.94, 1.14, 1.38, and 1.88 µm are largely due to absorption by water vapor molecules located above and within cirrus clouds. Ice absorption bands, for example those centered near 1.5 and 2.0 µm, are also seen in the Figure 2 spectra. For each of the AVIRIS spectra, the cirrus reflectances in the 0.45–1.0 µm spectral region are nearly constant with wavelength, because ice particles within cirrus are much larger than the wavelength and non-absorbing in the spectral region. The larger apparent reflectances in the 0.45–0.6 µm region are due to atmospheric Rayleigh scattering. Although the OLI SWIR1 and SWIR2 bands are not located near the centers of the two ice absorption bands, they are affected by ice absorption over the band passes, as seen in Figure 2. The measured reflectances at 1.375 µm are smaller than those in the 0.4–1.0 µm region, mainly because of absorption by water vapor above and within cirrus. The upper-level water vapor absorption effects need to be accounted for in order to use the 1.375-µm channel for the quantitative removal of cirrus effects in the 0.4–1.0 µm region, as described previously [13].
It is practically difficult to quantitatively derive both the upper-level water vapor transmittance factor and the cirrus reflectance on a pixel-by-pixel basis from the one-band 1.375-µm cirrus image, i.e., it is not possible to retrieve two unknowns from one measurement. In view of this situation, we have decided to obtain the correlation between a given band image and the 1.375-µm cirrus image [13,14]. We then use the correlation and the 1.375-µm cirrus image to obtain the cirrus reflectance image of a given band. Below, we use two AVIRIS data sets, one acquired over dark ocean waters where there were no bottom reflection contributions, and the other over the land/water boundary areas where the bottom surface reflection effects were not negligible, to illustrate our empirical technique for the retrieval of cirrus reflectances on a pixel-by-pixel basis.

2.1. A Dark Ocean Scene

Figure 3a is the 0.86-µm AVIRIS image acquired over Monterey Bay, California, as described in Figure 2. Figure 3b is a scatter plot of ρ*(1.38 µm) versus ρ*(0.86 µm) for all pixels in the scene. The data points are approximately linearly related. The slope is essentially the 1.38-µm band's water vapor transmittance factor. The small offset, ρR(0.86 µm), in the horizontal axis is due to the weak atmospheric Rayleigh scattering effect at the 0.86-µm band. The Rayleigh scattering effect at the 1.38-µm band is practically negligible. Since the water leaving reflectance contributions at 0.86 µm for the water scene is zero, ρ*(0.86 µm) for the atmospheric window band is equal to the sum of and the cirrus reflectance, i.e.,
ρ * ( 0.86 μ m ) = ρ C ( 0.86 μ m ) + ρ R ( 0.86 μ m )
In view of the scatter plot in Figure 3b, we have
ρ * ( 1.38 μ m ) = S 0.86 × ( ρ * ( 0.86 μ m ) ρ R ( 0.86 μ m ) ) = S 0.86 × ρ C ( 0.86 μ m )
where S0.86 is the slope, which can be estimated from this scatter plot with, for example, the technique described by Gao et al. [13]. The derivation of the factor S0.86 this way makes use of both the spectral information (the 0.86-µm band and the 1.38-µm band within a pixel) and the spatial information (all pixels in the Figure 3a image). It should be pointed out that only one value of S0.86 per scene is derived, and S0.86 is not a pixel-by-pixel quantity. After obtaining S0.86, ρc(0.86 µm) can be calculated according to Equation (3).
Figure 3c is similar to Figure 3b, except that the scatter plot is for ρ*(1.38 µm) versus ρ*(1.61 µm). The data points in Figure 3c are approximately linearly related with a slope (S1.61) of 0.93. The slope value S1.61 is larger than that of S0.86 mainly because the 1.61-µm band is less reflecting, and ice has an absorption effect at the wavelength (see Figure 2). With similar reasoning to that described above, we have
ρ * ( 1.38 μ m ) = S 1.61 × ρ C ( 1.61 μ m )
ρc(1.61 µm) can be obtained from ρ*(1.38 µm) if the slope, S1.61, is estimated from the Figure 3c scatter plot. The main point we try to make here is that both the 0.86-µm and the 1.61-µm cirrus reflectances are linearly related to the 1.375-µm "apparent reflectances". After deriving S0.86 and S1.61 from the scatter plots, we can calculate the 0.86-µm and the 1.61-µm band cirrus reflectances using Equations (3) and (4), respectively.

2.2. A Mixed Ocean and Land Scene

Figure 4a is the 1.61-µm image of another AVIRIS scene acquired over Monterey Bay, California on 4 September 1992. It covered both land and water surfaces. Figure 4b is the 1.38-µm image of the same scene. Only the upper level cirrus clouds are visible. Figure 4c is the scatter plot of ρ*(1.38 µm) versus ρ*(1.61 µm) for all pixels in the scene. Dark surface pixels affected by cirrus clouds are clustered on the left side along a straight line of the scatter plot. The brighter surface pixels affected by cirrus are located in the lower right portion of the scatter plot. Using a numerical procedure, such as the one described by Gao et al. [13], a slope (S1.61) value of 0.95 with an error of approximately 2% was derived. Only those pixels located on the left edge portions of the scatter plot were used in the estimation of S1.61. The bright pixels affected by surface reflection in the 1.61-µm image were automatically excluded during the fitting process. The cirrus-introduced reflectances, ρc(1.61 µm), to the 1.61-µm band image are equal to ρ*(1.38 µm)/S1.61. Figure 4d is the cirrus-corrected 1.61-µm image (ρ*(1.61 µm) − ρ*(1.38 µm)/S1.61). The obvious cirrus features seen in Figure 4a are not present in Figure 4d, which demonstrates that the thin cirrus scattering effects are properly removed. It should be pointed out that, if a scene does not contain waters, the darker 1.61-µm pixels with varying cirrus contaminations will also cluster around a straight line on the left side of the scatter plot of ρ*(1.38 µm) versus ρ*(1.61 µm) band image (see Figure 4c), and the slope S1.61 can still be derived from the scatter plot.

2.3. A Summary of the Empirical Cirrus Correction Procedures

Section 2.1 and Section 2.2 provided specific examples to illustrate cirrus reflectance properties, correlations between bands, and cirrus corrections. Below is a summary of the procedures for removing cirrus scattering effects of a given band (B) using the information contained in the 1.38-µm (cirrus band):
  • converting the measured radiances (L) into apparent reflectances (ρ*) using Equation (1);
  • making the scatter plot of ρ*(cirrus) versus ρ*(B) (e.g., Figure 4c);
  • estimating the slope, SB, from the scatter plot (also see Figure 4c);
  • calculating the cirrus reflectance of the given band, ρc(B), which is equal to ρ*(cirrus)/SB;
  • subtracting out the cirrus reflectance, ρc(B), from the measured apparent reflectance, ρ*(B), for removing the cirrus scattering effect in band B.
It should be pointed out that the procedures described above are applicable for the correction of cirrus scattering effects of any given band in the 0.4–2.5 µm solar spectral range, regardless of whether the band has the ice absorption effect or not. Our previously reported techniques [13,14] were mainly for the removal of cirrus scattering effects for bands located in the 0.4–1.0 µm, where the ice absorption effect is negligible.

3. Results

The cirrus correction methodology described in Section 2 has been used for cirrus removals from a number of Landsat 8 OLI data sets. The results from three case studies are presented below.

3.1. Eastern Canada

As shown in Figure 1a,b, a set of OLI data acquired over Cape Breton Island in eastern Canada (northeast to Halifax) on 16 September 2014 was contaminated by thin cirrus clouds over both land and water surfaces. We have made cirrus corrections to the RGB image using the technique described in Section 2. Figure 1c shows the resulting cirrus-corrected RGB image. By comparing Figure 1c with Figure 1a, it is seen that most cirrus features seen in Figure 1a are not seen in Figure 1c, which demonstrates the success of our technique for the cirrus corrections of OLI visible bands. Figure 5 shows our cirrus correction for the SWIR1 band image of the same scene. Figure 5a is a single SWIR1 band image. Figure 5b is the scatter plot of 1.375-μm band versus SWIR1 band. Thin cirrus pixels are clustered around a straight line with a slope of 0.93. Figure 5c is the corresponding cirrus-removed SWIR1 band image. Figure 6a–c are similar to Figure 5a–c, respectively, except for the SWIR2 band. Figure 5c and Figure 6c shows that thin cirrus effects can be removed with the technique described in Section 2.

3.2. Eastern U.S.

An OLI scene acquired over the southeastern part of the State of Delaware in the eastern United States on 17 April 2014 was also contaminated by thin cirrus clouds. Figure 7a is the RGB image centered approximately at a latitude of 37.7° N and a longitude of 75.6° W. Since land surfaces are bright, cirrus features over land are difficult to see. Figure 7b is the corresponding Band 9 image. Most areas over both land and water were affected by thin cirrus. Figure 7c is the cirrus-corrected RGB image. The spatial patterns of water features over deep blue waters (lower right part) and the shallow coastal waters in the land/water boundary areas are seen much better in this cirrus-corrected image. Figure 8 shows the cirrus correction for the SWIR2 band image of the scene. Figure 8a is a single SWIR2 band image. Figure 8b is the scatter plot of the 1.375-μm band versus the SWIR2 band. Many thin cirrus pixels are clustered around a straight line. These pixels are used in the estimation of the slope of the line. The bright pixels with large SWIR2 band reflectances that were located on the far right hand side of the line are excluded in the slope estimation. Figure 8c is the cirrus-corrected SWIR2 band image. Cirrus features seen in Figure 8a, particularly over water pixels, are no longer seen in the Figure 8c image, which indicates the proper removal of thin cirrus effects in the SWIR2 band image with the technique described in Section 2.

3.3. Baltic Sea

Figure 9 presents our third case study of cirrus corrections for OLI data. Figure 9a is a portion of an RGB image acquired over the Baltic Sea on 11 August 2015 during a peak chlorophyll bloom. The scene center is located approximately at 59.1° N and 21.2° E. The spatially diffuse thin cirrus clouds and an aircraft induced linear-shaped contrail cirrus are seen. Figure 9b is the Band 9 (cirrus) image. The diffuse thin cirrus features are seen more obviously in this image. It is noted that the aircraft-induced contrail cirrus is broken in the left portion of the contrail. This is due to the parallax effect associated with the OLI focal plane designs [8]. Figure 9c is the cirrus-corrected RGB image. By comparing Figure 9c with Figure 9a, it is seen that the diffuse thin cirrus features in the right half of the scene are removed in the Figure 9c image. However, the aircraft-induced linear-shaped contrail cirrus clouds remain to be seen in the Figure 9c image. This is because the contrail cirrus in Figure 9b is relatively shifted in the satellite along-track direction in comparison with that in Figure 9a. The subtraction of the scaled Figure 9b image from the Figure 9a image does not permit a complete removal of the contrail cirrus in the Figure 9a image.

4. Discussion

The spatial misregistration of elevated cloud features, such as the contrail cirrus in Figure 9b, is resulted from the intrinsic design of the OLI focal plane [8], which contains 14 separate focal plane modules (FPMs) to cover the 185+ km swath width in the satellite cross track direction [15]. Due to the push-broom architecture of the OLI instrument, different spectral bands within one FPM are distributed in the along-track direction and image common ground targets at slightly different times and different viewing angles. Such viewing geometry leads to band-specific horizontal displacements that are a function of the target height, which is the effect of terrain parallax. The OLI sensor architecture does not provide inherent registration between spectral bands as the data are collected. The raw OLI images of different bands are spatially registered based on, in part, a surface elevation model. For elevated water clouds and high altitude cirrus clouds, they are not well registered in the spatial domain in the publicly available terrain-corrected Level 1 (L1T) data sets. We have observed that, when we move through a sequence of OLI band images on a computer screen, the surface features remain stationary, but the water clouds and cirrus clouds jump around. From Figure 9c, it is seen that the spatial misregistration of diffuse thin cirrus clouds does not pose a problem in using our empirical technique for cirrus corrections. However, it does pose a problem in removing sharp-edged contrail cirrus.
At present, the surface reflectance data products are operationally retrieved from Landsat 8 OLI data by correcting for the spectrally varying scattering and absorbing effects of atmospheric gases and aerosols using the algorithm developed by Vermote et al. [16]. No operational correction has been made of the thin cirrus scattering effects in OLI data. When the thin cirrus scattering effects are present in the retrieved surface reflectance data products, the calculated NDVI (Normalized Difference Vegetation Index) values using the surface reflectance data products will be smaller in comparison with the true NDVI values [17]. This is because thin cirrus clouds introduce a spectrally constant offset for all the OLI bands below 1 μm, including the Red and Near Infrared (NIR) bands (see Table 1) commonly used for the NDVI calculations. In order to obtain accurate NDVI values from remotely sensed data, it is necessary to remove the thin cirrus scattering effects from Red and NIR bands [17].

5. Conclusions

The Landsat 8 OLI instrument has implemented a channel (Band 9) centered near 1.375 μm. This channel has been proven to be very effective in detecting and masking thin cirrus-contaminated OLI pixels at the high spatial resolution of 30 m. However, this channel has not yet been routinely used for the correction of thin cirrus effects in other OLI band images. Using hyperspectral imaging data collected with the NASA/JPL AVIRIS instrument from an ER-2 aircraft at an altitude of 20 km, we have developed an empirical technique for the removal of thin cirrus scattering effects in the 0.4−2.5 μm region. The results from the application of the technique to three sets of OLI data for the removal of cirrus scattering effects in OLI visible, near-IR, and shortwave IR (SWIR) spectral regions have been presented. The spatially diffuse thin cirrus clouds are removed quite well. We would like to suggest that the thin cirrus scattering effects in OLI data should be removed, using for example the empirical technique described here, prior to the correction for the absorption and scattering of atmospheric gases and aerosols when retrieving surface reflectances from OLI data. Due to the misregistration of cloud features in different OLI images, which resulted from the intrinsic design of the OLI focal plane, aircraft-induced contrail cirrus clouds are not well removed.

Acknowledgments

The authors are grateful to R. O. Green of Jet Propulsion Laboratory for providing AVIRIS data used in this study. This research is partially supported by the US Office of Naval Research.

Author Contributions

Bo-Cai Gao developed cirrus correction algorithm and draft the manuscript. Rong-Rong Li carried out the data analysis.

Conflicts of Interest

The authors declare no conflict of interest.

References

  1. Green, R.O.; Eastwood, M.L.; Sarture, C.M.; Chrien, T.G.; Aronsson, M.; Chippendale, B.J.; Faust, J.A.; Parvi, B.E.; Chovit, C.J.; Solis, M.; et al. Imaging Spectrometry and the Airborne Visible/Infrared Imaging Spectrometer (AVIRIS). Remote Sens. Environ. 1998, 65, 227–248. [Google Scholar] [CrossRef]
  2. Vane, G.; Green, R.O.; Chrien, T.G.; Enmark, H.T.; Hansen, E.G.; Porter, W.M. The Airborne Visible Infrared Imaging Spectrometer. Remote Sens. Environ. 1993, 44, 127–143. [Google Scholar] [CrossRef]
  3. Gao, B.-C.; Goetz, A.F.H.; Wiscombe, W.J. Cirrus Cloud Detection from Airborne Imaging Spectrometer Data Using the 1.38 µm Water Vapor Band. Geophys. Res. Lett. 1993, 20, 301–304. [Google Scholar] [CrossRef]
  4. Salomonson, V.V.; Barnes, W.L.; Maymon, P.W.; Montgomery, H.E.; Ostrow, H. MODIS: Advanced Facility Instrument for Studies of the Earth as a System. IEEE Trans. Geosci. Remote Sens. 1989, 27, 145–153. [Google Scholar] [CrossRef]
  5. King, M.D.; Menzel, W.P.; Kaufman, Y.J.; Tanré, D.; Gao, B.-C.; Platnick, S.; Ackerman, S.A.; Remer, L.A.; Pincus, R.; Hubanks, P.A. Cloud and Aerosol Properties, Precipitable Water, and Profiles of Temperature and Humidity from MODIS. IEEE Trans. Geosci. Remote Sens. 2003, 41, 442–458. [Google Scholar] [CrossRef]
  6. Murphy, R.; Guenther, B.; Ip, J.; Jackson, J.; Olenijczak, D.; Iisager, B.; Hutchison, K. Update on the Algorithmic Basis and Predicted Performance of Selected VIIRS Environmental Data Records. In Proceedings of the 2006 IEEE International Geoscience and Remote Sensing Symposium (IGARSS), Denver, Colorado, USA, 31 July–4 August 2006; pp. 266–269. [Google Scholar]
  7. Drusch, M.; Del Bello, U.; Carlier, S.; Colin, O.; Fernandez, V.; Gascon, F.; Hoerschb, B.; Isolaa, C.; Laberintia, P.; Martimort, P.; et al. Sentinel-2: ESA’s Optical High-Resolution Mission for GMES Operational Services. Remote Sens. Environ. 2012, 120, 25–36. [Google Scholar] [CrossRef]
  8. Storey, J.; Choate, M.; Lee, K. Landsat 8 Operational Land Imager on-orbit Geometric Calibration and Performance. Remote Sens. 2014, 6, 11127–11152. [Google Scholar] [CrossRef]
  9. Gao, B.-C.; Kaufman, Y.J. Selection of the 1.375-µm MODIS Channel for Remote Sensing of Cirrus Clouds and Stratospheric Aerosols from Space. J. Atm. Sci. 1995, 52, 4231–4237. [Google Scholar] [CrossRef]
  10. Zhu, Z.; Wang, S.; Woodcock, C.E. Improvement and Expansion of the Fmask Algorithm: Cloud, Cloud Shadow, and Snow Detection for Landsats 4-7, 8, and Sentinel 2 Images. Remote Sens. Environ. 2015, 159, 269–277. [Google Scholar] [CrossRef]
  11. Xu, M.; Jia, X.; Pickering, M. Automatic Cloud Removal for Landsat 8 OLI Images Using Cirrus Band. In Proceedings of the 2014 IEEE International Geoscience and Remote Sensing Symposium (IGARSS 2014), Quebec City, Quebec, Canada, 13–18 July 2014; pp. 2511–2514. [Google Scholar]
  12. Shen, Y.; Wang, Y.; Lv, H.; Qian, J. Removal of Thin Clouds in Landsat-8 OLI Data with Independent Component Analysis. Remote Sens. 2015, 7, 11481–11500. [Google Scholar] [CrossRef]
  13. Gao, B.-C.; Yang, P.; Han, W.; Li, R.-R.; Wiscombe, W.J. An Algorithm Using Visible and 1.38-micron Channels to Retrieve Cirrus Cloud Reflectances from Aircraft and Satellite Data. IEEE Trans. Geosci. Remote Sens. 2002, 40, 1659–1668. [Google Scholar]
  14. Gao, B.-C.; Kaufman, Y.J.; Han, W.; Wiscombe, W.J. Correction of Thin Cirrus Path Radiance in the 0.4–1.0 µm Spectral Region Using the Sensitive 1.375-µm Cirrus Detecting Channel. J. Geophys. Res. 1998, 103, 32169–32176. [Google Scholar] [CrossRef]
  15. Knight, E.J.; Kvaran, G. Landsat-8 Operational Land Imager Design, Characterization and Performance. Remote Sens. 2014, 6, 10286–10305. [Google Scholar] [CrossRef]
  16. Vermote, E.; Justice, C.; Claverie, M.; Franch, N. Preliminary Analysis of the Performance of the Landsat 8/OLI Land Surface Reflectance Product. Remote Sens. Environ. 2016, 185, 46–56. [Google Scholar] [CrossRef]
  17. Gao, B.-C.; Li, R.-R. Quantitative Improvement in the Estimates of NDVI Values from Remotely Sensed Data by Correcting Thin Cirrus Scattering Effects. Remote Sens. Environ. 2000, 74, 494–502. [Google Scholar] [CrossRef]
Figure 1. (a) A Landsat 8 Operational Land Imager (OLI) RGB image acquired over Cape Breton Island in eastern Canada (northeast to Halifax) on 16 September 2014; (b) The corresponding Band 9 (cirrus band) image; and (c) The cirrus-corrected RGB image.
Remotesensing 09 00834 g001
Figure 2. An illustration of Landsat 8 OLI bands and examples of Airborne Visible/Infrared Imaging Spectrometer (AVIRIS) spectra acquired over thick and thin cirrus clouds.
Remotesensing 09 00834 g002
Figure 3. (a) An AVIRIS 0.86-µm band image acquired over water surfaces; (b) Scatter plot of 1.38-µm band apparent reflectance image versus the 0.86-µm band image; (c) Scatter plot of 1.38-µm band apparent reflectance image versus the 1.61-µm band image.
Remotesensing 09 00834 g003
Figure 4. (a) An AVIRIS 1.61-µm band image acquired over land and water surfaces; (b) The 1.38-µm cirrus band image; (c) Scatter plot of 1.38-µm band apparent reflectance image versus the 1.61-µm band image; (d) Cirrus scattering effect removed 1.61-µm band image.
Remotesensing 09 00834 g004
Figure 5. (a) A Landsat 8 OLI SWIR1 image acquired over Cape Breton Island in eastern Canada (northeast to Halifax) on 16 September 2014; (b) The scatter plot of Band 9 (cirrus) versus SWIR1 band; (c) The cirrus-corrected SWIR1 image.
Remotesensing 09 00834 g005
Figure 6. (a) A Landsat 8 OLI SWIR2 image acquired over Cape Breton Island in eastern Canada (northeast to Halifax) on 16 September 2014; (b) The scatter plot of Band 9 (cirrus) versus SWIR2 band; (c) The cirrus-corrected SWIR2 image.
Remotesensing 09 00834 g006
Figure 7. (a) A Landsat 8 OLI RGB image acquired over Delaware in the eastern United States on 17 April 2014; (b) The Band 9 (cirrus) image; (c) The cirrus-corrected RGB image.
Remotesensing 09 00834 g007
Figure 8. (a) A Landsat 8 OLI SWIR2 band image acquired over Delaware in the eastern United States on 17 April 2014; (b) The scatter plot of Band 9 (cirrus) versus SWIR2 band; (c) The cirrus-corrected SWIR2 image.
Remotesensing 09 00834 g008
Figure 9. (a) A Landsat 8 OLI RGB image acquired over Baltic Sea on 11 August 2015 during a chlorophyll bloom; (b) The Band 9 (cirrus) image; (c) The cirrus-corrected RGB image.
Remotesensing 09 00834 g009
Table 1. Landsat 8 OLI band names, widths, and spatial resolution (m).
BandsWavelength (μm)Resolution (m)
Band 1–Ultra Blue0.43–0.4530
Band 2–Blue0.45–0.5130
Band 3–Green0.53–0.5930
Band 4–Red0.64–0.6730
Band 5–Near Infrared (NIR)0.85–0.8830
Band 6–Shortwave Infrared (SWIR) 11.57–1.6530
Band 7–Shortwave Infrared (SWIR) 22.11–2.2930
Band 8–Panchromatic0.50–0.6830
Band 9–Cirrus1.36–1.3930