Next Issue
Volume 11, August
Previous Issue
Volume 11, June


Land, Volume 11, Issue 7 (July 2022) – 167 articles

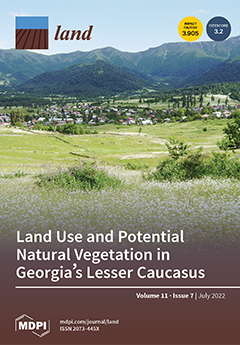
Cover Story (view full-size image): Followed by the grassland around the villages, forests are the main land cover in the high-mountain landscape of the Bakuriani–Tsikhisjvari basin in Georgia’s Lesser Caucasus. Covering an area from the middle-montane belt to the alpine belt, the local agriculture is traditionally managed, and the forests are in a near-natural condition. Alongside both land covers, widespread wooded grasslands represent the transition between agriculture and forestry. This agroforestry use is common in the local forests. Overall, this high-mountain land-use system results in valuable biodiversity in the region. The aim of this study is to map, quantify, and classify the Lesser Caucasian land-cover and land-use pattern to explain the diverse landscape structure along topographical gradients as well as compare the forests with the potential natural vegetation. View this paper
  • Issues are regarded as officially published after their release is announced to the table of contents alert mailing list.
  • You may sign up for e-mail alerts to receive table of contents of newly released issues.
  • PDF is the official format for papers published in both, html and pdf forms. To view the papers in pdf format, click on the "PDF Full-text" link, and use the free Adobe Reader to open them.
Order results
Result details
Section
Select all
Export citation of selected articles as:
17 pages, 81692 KiB  
Article
The Shaping of Daqing: Borderless Interactions between Oil and Urban Areas
by Stephan J. Hauser and Penglin Zhu
Land 2022, 11(7), 1120; https://doi.org/10.3390/land11071120 - 21 Jul 2022
Viewed by 3621
Abstract
Since the development of the oil industry in the 1860s, petroleum products became increasingly important in economies and shaped the urban form. The impact of oil exploration, exploitation, and transformation led to the creation of districts and cities entirely dedicated to the oil [...] Read more.
Since the development of the oil industry in the 1860s, petroleum products became increasingly important in economies and shaped the urban form. The impact of oil exploration, exploitation, and transformation led to the creation of districts and cities entirely dedicated to the oil industry. This dynamic relationship between economic activity and urbanization was presented in the shaping of cities and their borders. Although important, the notion of borders and its consequences on the uses of land as well as on the life of inhabitants are often ignored. This paper first conceptualizes the term borders in understanding the interlinkages between oil and other areas closely related, either geographically or for the functioning of the oil industry; it then illustrates the intertwined borders of all these spaces from the contemporary example of the city of Daqing, in Northeast China. The paper answers the question of how past borders designed during the development of Daqing in the 1960s are impacting future planning strategies and the health of local inhabitants? By mapping the current land-use of the city, this paper elaborates on the need to consider borders beyond two-dimensional perspectives by revealing how spatial planning practices in oil-dependent cities can be an environmental issue today and in the future. The objective is to demonstrate the influence of past planning decisions linked to industrial activities on contemporary urban spaces. Full article
(This article belongs to the Section Urban Contexts and Urban-Rural Interactions)
Show Figures

Figure 1

21 pages, 777 KiB  
Article
Measurement of the Threatened Biodiversity Existence Value Output: Application of the Refined System of Environmental-Economic Accounting in the Pinus pinea Forests of Andalusia, Spain
by Pablo Campos, José L. Oviedo, Alejandro Álvarez and Bruno Mesa
Land 2022, 11(7), 1119; https://doi.org/10.3390/land11071119 - 21 Jul 2022
Cited by 1 | Viewed by 1834
Abstract
Are we able to determine the existence value output generated for society through the preservation of wild species threatened with extinction? In this article we defend the theory that the service of preserving threatened species with risk of extinction is an existence value [...] Read more.
Are we able to determine the existence value output generated for society through the preservation of wild species threatened with extinction? In this article we defend the theory that the service of preserving threatened species with risk of extinction is an existence value output with a hidden transaction price if it can be established that there are consumer or state willingness to pay an additional tax above the government total cost to avoid an increase in one threatened species in relation to the number recorded at the opening of the accounting period. This output is estimated by adding the total cost and the additional consumer tax which the consumers state that they are willing to pay through a choice experiment survey. Our refined monetary System of Environmental-Economic Accounting (rSEEA) extends the existence value output concept and valuation principles recommended by the United Nations. In this paper, this rSEEA was applied to Pinus pinea forests in protected as well as non-protected areas of Andalusia, Spain in 2010. The results show that the net value added from protected areas is 40% higher than that from non-protected areas. It is incidental that the environmental benefits in both areas coincide. Full article
Show Figures

Figure 1

14 pages, 4176 KiB  
Article
How to Price Ecosystem Water Yield Service and Determine the Amount of Compensation?—The Wei River Basin in China as an Example
by Yuanyuan Li, Zhenmin Ding, Shunbo Yao, Caixia Xue, Yuanjie Deng, Lei Jia, Chaoqing Chai and Xiao Zhang
Land 2022, 11(7), 1118; https://doi.org/10.3390/land11071118 - 21 Jul 2022
Cited by 1 | Viewed by 1761
Abstract
Determining the price of water yield service is the core of watershed compensation. This is necessary to establish a reasonable and scientific compensation mechanism and achieve the efficient management of water. Unlike previous studies, this study establishes a theoretical model of pricing and [...] Read more.
Determining the price of water yield service is the core of watershed compensation. This is necessary to establish a reasonable and scientific compensation mechanism and achieve the efficient management of water. Unlike previous studies, this study establishes a theoretical model of pricing and a compensation mechanism for achieving a balance between the supply and demand of water yield service. A panel threshold model is used to estimate the production elasticity of water for pricing water yield service. Then, we analyze the spatial and temporal changes of the price and the compensation amounts of water yield service in the Wei River basin, China. The results show that: (1) The water marginal contribution to regional GDP meets the law of diminishing marginal return in the form of the threshold effect. When water input amounts (logarithm) are on both sides of 9.449, the marginal contribution is significantly different. (2) The price of water yield service shows an increasing trend. It was CNY 47.27/m3 in 2015, increasing by 472.94% compared with 2000 (CNY 8.24/m3). The spatial distribution was “high in the southeast and low in the northwest”. (3) Total payment amounts increased from CNY 33.1955 billion in 2000 to CNY 227.1302 billion in 2015 and were mainly distributed in relatively developed areas. The acceptance areas were concentrated in relatively undeveloped areas. Total acceptance amounts increased from CNY 2922.2 million in 2000 to CNY 16,398.6 million in 2015. This study can provide scientific basis for ecological compensation practices and promote high-quality development of the socio-economy of the watershed. Full article
(This article belongs to the Special Issue Water Resources and Land Use Planning)
Show Figures

Figure 1

19 pages, 2054 KiB  
Review
Riverine Plastic Pollution in Asia: Results from a Bibliometric Assessment
by Walter Leal Filho, Cagdas Dedeoglu, Maria Alzira Pimenta Dinis, Amanda Lange Salvia, Jelena Barbir, Viktoria Voronova, Ismaila Rimi Abubakar, Arvo Iital, Karin Pachel, Fredrik Huthoff, Ayyoob Sharifi, Peter J. Yang, Maris Klavins and Victoria Omeche Emanche
Land 2022, 11(7), 1117; https://doi.org/10.3390/land11071117 - 21 Jul 2022
Cited by 11 | Viewed by 6974
Abstract
Rivers are important ecosystems, vital to the livelihoods of hundreds of millions of humans and other species. Despite their environmental, social, and economic importance, current use of rivers is unsustainable, due to a combination of solid waste and high levels of pollutants. Plastic [...] Read more.
Rivers are important ecosystems, vital to the livelihoods of hundreds of millions of humans and other species. Despite their environmental, social, and economic importance, current use of rivers is unsustainable, due to a combination of solid waste and high levels of pollutants. Plastic materials are among the most predominant of such pollutants. Based on the need for additional research in this area, this study examines pressures put to rivers and explores trends related to riverine plastic pollution, with a focus on Asia. Apart from the bibliometric analysis, and relying on the collected information, examples describing the drivers of riverine plastic pollution in a sample of Asian countries are described, outlining the specific problem and its scope. Among some of the results obtained from it, mention can be made to the fact that much of the literature focuses on plastic pollution as a whole and less on one of its most significant ramifications, namely microplastics. Additionally, there is a need related to data availability on riverine plastic data and improving the understanding of transport mechanisms in relation to riverine plastic emission into the ocean. The results from this study illustrate the significance of the problems posed by plastic waste to Asian rivers and point out the fact that there are still significant gaps in respect of regulations and standards, which prevent improvements that are highlighted in this study. Based on the results of this bibliometric assessment, specific measures via which levels of riverine plastic pollution may be reduced are presented, bringing relevant new insights on this topic beyond the existing reviews. Full article
(This article belongs to the Special Issue Hydrological Processes in Urban Environments)
Show Figures

Figure 1

18 pages, 526 KiB  
Article
The Impact of Transport Infrastructure on Rural Industrial Integration: Spatial Spillover Effects and Spatio-Temporal Heterogeneity
by Han Zhang and Dongli Wu
Land 2022, 11(7), 1116; https://doi.org/10.3390/land11071116 - 21 Jul 2022
Cited by 19 | Viewed by 3141
Abstract
Industry convergence is the future trend of industrial development in rural areas and is conducive to high-quality agriculture development. To explore the development dynamics of industry convergence. This paper selects data from 31 provincial administrative regions in China from 2009 to 2019. It [...] Read more.
Industry convergence is the future trend of industrial development in rural areas and is conducive to high-quality agriculture development. To explore the development dynamics of industry convergence. This paper selects data from 31 provincial administrative regions in China from 2009 to 2019. It uses the entropy power method to measure the development quality of rural industrial integration in China and empirically studies the impact of transportation infrastructure on rural industrial integration using a spatial panel autoregressive model. The study found that: (1) from 2009–2019, the development quality of rural industrial integration is on the rise, but the development is uneven between regions; (2) transport infrastructure strongly promotes the development of rural industrial integration; (3) with the help of transport infrastructure, rural industrial integration in this region will improve the quality of rural industrial integration in the surrounding areas; and (4) the impact of transportation facilities varies in different regions and at different stages of development of rural industrial integration. The results of this paper are beneficial to improving transportation infrastructure planning and exploring the driving force of high-quality agriculture development, enriching the research of spatial land use, and providing valuable insights for developing industry convergence in other countries and regions. Full article
(This article belongs to the Special Issue Territory Spatial Planning toward High-Quality Development in China)
Show Figures

Figure 1

17 pages, 6965 KiB  
Article
Evaluating Ecosystem Services and Trade-Offs Based on Land-Use Simulation: A Case Study in the Farming–Pastoral Ecotone of Northern China
by Shuting Bai, Jiuchun Yang, Yubo Zhang, Fengqin Yan, Lingxue Yu and Shuwen Zhang
Land 2022, 11(7), 1115; https://doi.org/10.3390/land11071115 - 20 Jul 2022
Cited by 1 | Viewed by 2141
Abstract
Evaluating the impacts of land-use change (LUC) on ecosystem services (ESs) is necessary for regional sustainable development, especially for the farming–pastoral ecotone of northern China (FPENC), an ecologically sensitive and fragile region. This study aimed to assess the impacts of LUC on the [...] Read more.
Evaluating the impacts of land-use change (LUC) on ecosystem services (ESs) is necessary for regional sustainable development, especially for the farming–pastoral ecotone of northern China (FPENC), an ecologically sensitive and fragile region. This study aimed to assess the impacts of LUC on the ESs and provide valuable information for regional planning and management in the FPENC. To accomplish this, we assessed LUC in the FPENC from 2010 to 2020 and simulated land-use patterns in 2030 under three plausible scenarios: the business as usual scenario (BAUS), economic development scenario (EDS), and ecological protection scenario (EPS). Then, we quantified five ESs (including crop production, water yield, soil retention, water purification, and carbon storage) for 2020–2030 and analyzed the trade-offs and synergies among ESs in all scenarios. The results show that FPENC experienced expanding farming land and built-up land throughout 2010–2020. Under the BAUS and EDS from 2000 to 2030, especially EDS, the increase in farming land and built-up land will continue. As a result, crop production and water yield will increase, while soil retention, water purification, and carbon storage will decrease. In contrast, EPS will increase soil retention, water purification, and carbon storage at the cost of a decline in crop production and water yield. These results can provide effective reference information for future regional planning and management in the farming–pastoral ecotone. Full article
(This article belongs to the Special Issue Ecosystem-Based Regional Planning)
Show Figures

Figure 1

20 pages, 3765 KiB  
Article
Perspectives of Post-Industrial Towns and Landscape in Eastern Slovakia—Case Study Strážske
by Romana Hajduková and Alžbeta Sopirová
Land 2022, 11(7), 1114; https://doi.org/10.3390/land11071114 - 20 Jul 2022
Cited by 5 | Viewed by 3289
Abstract
This study examines the impact of socialist industrialisation from the 1950s to 1989 and deindustrialisation from 1989 on urban development and landscape transformation in Strážske—the former centre of the chemical industry in Eastern Slovakia. We focus on contemporary challenges: the emergence of brownfields, [...] Read more.
This study examines the impact of socialist industrialisation from the 1950s to 1989 and deindustrialisation from 1989 on urban development and landscape transformation in Strážske—the former centre of the chemical industry in Eastern Slovakia. We focus on contemporary challenges: the emergence of brownfields, environmental burdens, and urban shrinkage, to propose strategies for creating a sustainable and resilient shrinking town of Strážske. We have divided the methods and results into two sections: the first is the mapping of urban and landscape development, brownfields, and environmental burdens, and the second is the proposal of perspective strategies for brownfield redevelopment. The study combines morphological research, field survey, data analysis and literature review. The results confirmed that socialist industrialisation was a determining factor in urban growth and landscape transformation, as well as the negative impact of chemical production on the environment and the emergence of brownfields. In the second stage of results, four proposed scenarios are portraying the possible strategies for brownfield redevelopment regarding sustainability and resilience. The results can serve as a non-binding spatial planning document for the local government of Strážske. However, especially for shrinking cities, it is necessary to create a systematic legislative and financial support system from the state, as well as a change in spatial planning legislative and methodology. Full article
Show Figures

Graphical abstract

19 pages, 1955 KiB  
Review
Cellular Automata in Modeling and Predicting Urban Densification: Revisiting the Literature since 1971
by Anasua Chakraborty, Sujit Sikder, Hichem Omrani and Jacques Teller
Land 2022, 11(7), 1113; https://doi.org/10.3390/land11071113 - 20 Jul 2022
Cited by 14 | Viewed by 5460
Abstract
The creation of an accurate simulation of future urban growth is considered to be one of the most important challenges of the last five decades that involves spatial modeling within a GIS environment. Even though built-up densification processes, or transitions from low to [...] Read more.
The creation of an accurate simulation of future urban growth is considered to be one of the most important challenges of the last five decades that involves spatial modeling within a GIS environment. Even though built-up densification processes, or transitions from low to high density, are critical for policymakers concerned with limiting sprawl, the literature on models for urban study reveals that most of them focus solely on the expansion process. Although the majority of these models have similar goals, they differ in terms of implementation and theoretical assumptions. Cellular automata (CA) models have been proven to be successful at simulating urban growth dynamics and projecting future scenarios at multiple scales. This paper aims to revisit urban CA models to determine the various approaches for a realistic simulation and prediction of urban densification. The general characteristics of CA models are described with respect to analysis of various driving factors that influence urban scenarios. This paper also critically analyzes various hybrid models based on CA such as the Markov chain, artificial neural network (ANN), and logistic regression (LR). Limitation and uncertainties of CA models, namely, neighborhood cell size, may be minimized when integrated with empirical and statistical models. The result of this review suggests that it is useful to use CA models with multinomial logistic regression (MLR) in order to analyze and model the effects of various driving factors related to urban densification. Realistic simulations can be achieved when multidensity class labels are integrated in the modeling process. Full article
(This article belongs to the Special Issue Big Data Analytics, Spatial Optimization for Land Use Planning)
Show Figures

Figure 1

21 pages, 2674 KiB  
Article
Climate Smart Agriculture Implementation on Coffee Smallholders in Indonesia and Strategy to Accelerate
by Fadjry Djufry, Suci Wulandari and Renato Villano
Land 2022, 11(7), 1112; https://doi.org/10.3390/land11071112 - 20 Jul 2022
Cited by 9 | Viewed by 5522
Abstract
Sustainable coffee production is significantly threatened by climate change. While implementing CSA practices offers numerous benefits, adoption rates remain low. Coffee plantations are dominated by smallholders and located in rural areas, making them more complex and requiring a comprehensive analysis and intervention. This [...] Read more.
Sustainable coffee production is significantly threatened by climate change. While implementing CSA practices offers numerous benefits, adoption rates remain low. Coffee plantations are dominated by smallholders and located in rural areas, making them more complex and requiring a comprehensive analysis and intervention. This study used an exploratory approach to assess farmers’ preferences for CSA practices, identify barriers to implement, and design a support system model. The investigation focused on Arabica and Robusta farmers, with case studies from two Indonesian production centres. Preferences assessment used conjoint analysis, barriers evaluation used Mann–Whitney analysis, model development used synthetic approaches, and priority analysis used the Analytical Hierarchy Process. The study revealed that diversification is more desirable than cultivation, soil management, and water management. Arabica farmers preferred intercropping with annual crops, whereas Robusta farmers preferred perennials crops. Robusta farmers assessed that agricultural inputs, such as labor, capital, climatic data, and farm equipment and machinery, existed as barriers. However, these represent a lesser issue for Arabica farmers. We proposed agricultural innovation support system, consisting of innovation support facilities and services, as a comprehensive support system model to accelerate CSA implementation. Further analysis showed that the priority strategy for Arabica farmers is support services that focus on network development, while for Robusta farmers is support facilities that focus on climate information system development. Full article
(This article belongs to the Special Issue Climate-Smart Agriculture and Rural Sustainability)
Show Figures

Graphical abstract

22 pages, 1050 KiB  
Article
How Regional High-Quality Co-Ordinated Development Influences Green Technology Choices: Evidence from 284 Cities in China
by Dameng Hu, Changbiao Zhong, Haoran Ge, Yawen Zou and Chong Li
Land 2022, 11(7), 1111; https://doi.org/10.3390/land11071111 - 19 Jul 2022
Cited by 1 | Viewed by 2024
Abstract
High-quality development (HQD) is a fundamental requirement for current and future macroeconomic regulation in China. This study measured the high-quality co-ordinated development (HQCD) index of 284 cities in China from 2010 to 2019 using the entropy weighted TOPSIS method and coupled co-ordination model, [...] Read more.
High-quality development (HQD) is a fundamental requirement for current and future macroeconomic regulation in China. This study measured the high-quality co-ordinated development (HQCD) index of 284 cities in China from 2010 to 2019 using the entropy weighted TOPSIS method and coupled co-ordination model, and examined the impact of regional HQCD on enterprises’ green technology choices by combining data from Chinese listed companies. The results show the following: (1) Regional HQCD significantly promotes enterprises’ green technology choices, but does not substantially change the direction of their green technology progress. Specifically, co-ordinated regional economic–ecological system development promotes the enterprises’ technological progress toward green practices. Moreover, co-ordinated urban development has a self-reinforcing effect on the preference for green technology choices. (2) Regional HQCD enhances the screening effect of enterprises on green technology by alleviating financial constraints and increasing the awareness of social responsibility. (3) Regional HQCD has a more pronounced promotional effect on green technologies in the categories of transportation; energy conservation; and administration, regulation, or design. Private enterprises and cities with a high-administrative rank responded to the green technology selection effect of regional HQCD. This study enriches the theory and literature on the influence of government policies on firm behavior, and also provides a reference for the international community. Full article
(This article belongs to the Section Land Socio-Economic and Political Issues)
Show Figures

Figure A1

20 pages, 3569 KiB  
Article
Landscape Pattern Vulnerability of the Eastern Hengduan Mountains, China and Response to Elevation and Artificial Disturbance
by Jiarui Sun, Lu Zhou and Hua Zong
Land 2022, 11(7), 1110; https://doi.org/10.3390/land11071110 - 19 Jul 2022
Cited by 7 | Viewed by 2267
Abstract
The eastern Hengduan Mountains are located in the transition zone between the Qinghai-Tibet Plateau and the Sichuan Basin and are important for global biodiversity and water conservation in China. However, their landscape pattern vulnerability index (LVI) and its influencing factors have not been [...] Read more.
The eastern Hengduan Mountains are located in the transition zone between the Qinghai-Tibet Plateau and the Sichuan Basin and are important for global biodiversity and water conservation in China. However, their landscape pattern vulnerability index (LVI) and its influencing factors have not been systematically studied. Therefore, the spatial distribution patterns, LVI, and the landscape artificial disturbance intensity (LHAI) of Ganzi Prefecture were analyzed using ArcGIS software based on landscape data and Digital Elevation Model (DEM) digital elevation data. Then, the LVI response to LHAI and elevation was discussed. The results showed that Ganzi Prefecture was dominated by low- and middle-LVI areas, together accounting for 56.45% of the total area. LVI values were highest in the northern regions, followed by the southern and eastern regions. Batang and Derong counties had the highest LVI values. Most areas in Ganzi Prefecture had very low- or low-LHAI values, accounting for 81.48% of the total area, whereas high-LHAI areas accounted for 2.32% of the total area. Both the LVI and LHAI of Ganzi Prefecture had clustered distributions. Spearman analysis indicated that when elevation exceeded 4500 m, it was the most important factor affecting LVI and LHAI. In the range of 4500–5400 m, the relationship between elevation and LVI shifted from a weak positive correlation to a negative correlation, whereas LHAI was positively correlated with elevation. In addition, LVI also responded significantly to LHAI. However, the relationship kept changing as elevation increased. Hence, the ecological vulnerability of high elevation areas above 4500 m deserves greater attention. In addition, pasture areas in the upstream reaches of the Yalong River in the northern region, the coastal area in the downstream reaches of the Jinsha River in the southern region, and the eastern mining area, should be prioritized for protection and restoration. This research provides a basis for appropriate environmental planning mechanisms and policy protections at the landscape level. Full article
(This article belongs to the Topic Climate Change and Environmental Sustainability)
Show Figures

Figure 1

23 pages, 9909 KiB  
Article
Knowledge Mapping on Nepal’s Protected Areas Using CiteSpace and VOSviewer
by Liang Chang, Teiji Watanabe, Hanlin Xu and Jiho Han
Land 2022, 11(7), 1109; https://doi.org/10.3390/land11071109 - 19 Jul 2022
Cited by 10 | Viewed by 3679
Abstract
Protected areas (PAs) play a vital role in environmental conservation, particularly in Asian countries. Numerous studies were conducted on PAs in Nepal. We analyzed 864 papers from the Web of Science database using two visualization tools: VOSviewer and CiteSpace. This study identified the [...] Read more.
Protected areas (PAs) play a vital role in environmental conservation, particularly in Asian countries. Numerous studies were conducted on PAs in Nepal. We analyzed 864 papers from the Web of Science database using two visualization tools: VOSviewer and CiteSpace. This study identified the most influential journals, institutions, countries, and regions. In addition, we investigated the changing trend of research hotspots on PAs in Nepal. Keyword mapping was conducted for each type of PA and their differences were compared. We found that the research hotspots are changing with the shifting of conservation policies in Nepal. We suggest conducting more predictive studies on the future development of PAs. Currently, PA research is mainly conducted in traditional disciplines, but with the impact of climate change and the consequent increase in its negative impacts, academic contributions from other disciplines are expected to increase much more. We found that there was a shift in research power in countries and regions. We also detected an imbalanced distribution in which “protected areas” and “national parks” have been studied the most. Only 12 publications were about the hunting reserve, despite its importance to snow leopard conservation and economic significance to the buffer zone communities. Full article
(This article belongs to the Special Issue National Parks and Protected Areas)
Show Figures

Figure 1

13 pages, 2148 KiB  
Article
Species Composition Affects the Accuracy of Stand-Level Biomass Models in Hemiboreal Forests
by Jānis Liepiņš, Andis Lazdiņš, Santa Kalēja and Kaspars Liepiņš
Land 2022, 11(7), 1108; https://doi.org/10.3390/land11071108 - 19 Jul 2022
Cited by 4 | Viewed by 1964
Abstract
Various tree species contribute differently to total biomass stock, making the development of species-specific stand-level equations critical for better estimation of forest biomass and quantification of carbon stocks. Previously derived dry weight biomass models did not assess the effect of dominant species composition [...] Read more.
Various tree species contribute differently to total biomass stock, making the development of species-specific stand-level equations critical for better estimation of forest biomass and quantification of carbon stocks. Previously derived dry weight biomass models did not assess the effect of dominant species composition according to stand growing stock. Growing stock definitions and forest species composition differ by country, justifying the need for national stand-level biomass equations. We explored the relationship between growing stock volume and stand biomass density of above- and below-ground components in six common forest categories in Latvia using plot-level data from the National Forest Inventory from 2016 to 2020. Additionally, we explored model dependence on region, forest type, and species composition index. Models that considered growing stock and dominant species composition index performed better than models with growing stock as the only variable, especially for heterogeneous deciduous forests with greater species diversity. The elaborated models are a useful alternative to individual-level assessment for estimating forest biomass stocks in circumstances where individual tree data are not available. Full article
Show Figures

Figure 1

19 pages, 5331 KiB  
Article
Geographical Data and Metadata on Land Administration in Spain
by Gaspar Mora-Navarro, Carmen Femenia-Ribera, Joan Manuel Velilla Torres and Jose Martinez-Llario
Land 2022, 11(7), 1107; https://doi.org/10.3390/land11071107 - 19 Jul 2022
Cited by 4 | Viewed by 3105
Abstract
Spain has a tax-oriented cadastre with legal data about properties (ownership, rights, liens, charges, and restrictions) recorded in a separate property rights registry (henceforth called land registry). This paper describes the Spanish cadastre and land registry by focusing on the new coordination system [...] Read more.
Spain has a tax-oriented cadastre with legal data about properties (ownership, rights, liens, charges, and restrictions) recorded in a separate property rights registry (henceforth called land registry). This paper describes the Spanish cadastre and land registry by focusing on the new coordination system set by Law 13/2015. Since Law 13/2015 came into force in Spain, cadastral cartography is the basis for knowing where land registry units are located. The new coordination system sets a procedure to update the cadastral parcel boundary of a property when it does not match with reality. In these cases, the free-profession land surveyor sends the new property boundary through the Internet in order to update the corresponding cadastral parcel boundary. Currently, neither the cadastre nor the land registry has considered storing geographical metadata for each property boundary in a standardised way. As boundaries show the limits of individual properties, boundary metadata denote the accuracy with which such ownership rights are indicated. We propose that, for these boundary update cases, the Spanish cadastre also allows the upload of qualitative and quantitative instances of the data quality class of the Spanish Metadata Core standard, and this information be available for users, for example in an XML file. These metadata provide justified information about how the boundary has been obtained and its accuracy. Software has been developed to manage this metadata of each property boundary, in order to allow us to evaluate whether or not this information is useful. We present the conclusions about some real-life tests of property delimitations. Full article
Show Figures

Figure 1

25 pages, 22177 KiB  
Article
Geomorphological and Structural Assessment of the Coastal Area of Capo Faro Promontory, NE Salina (Aeolian Islands, Italy)
by Mauro Bonasera, Ciro Cerrone, Fabiola Caso, Stefania Lanza, Giandomenico Fubelli and Giovanni Randazzo
Land 2022, 11(7), 1106; https://doi.org/10.3390/land11071106 - 19 Jul 2022
Cited by 9 | Viewed by 2679
Abstract
Capo Faro Promontory, located in Salina (Aeolian Islands, southern Italy), is a popular summer destination due to its volcanic morphologies, seaside, and enogastronomy. A flat area, right behind the scarp edge of a coastal cliff, hosts the Capo Faro Estate, one of the [...] Read more.
Capo Faro Promontory, located in Salina (Aeolian Islands, southern Italy), is a popular summer destination due to its volcanic morphologies, seaside, and enogastronomy. A flat area, right behind the scarp edge of a coastal cliff, hosts the Capo Faro Estate, one of the most renowned vineyards and residences on Salina Island. The promontory has been characterised in terms of geomorphological features. Remote sensing analysis, after nadir and off–nadir UAV flights, supports the field activities to explore the hazard to which the area is subjected. In particular, the coastal cliff turns out to be affected by a rapid retreat inducing landslides. Therefore, the cliff area has been investigated through a detailed stratigraphic and structural field survey. Using the generated high–resolution Digital Elevation Model, bathymetric–topographic profiles were extracted along the coastline facing the cliff. The thickness of volcanic deposits was evaluated to obtain a geological model of it. The main rock mass discontinuities have been characterised to define the structural features affecting the stability of the rock wall. The obtained results prove the contribution of such research fundamental in planning risk mitigation measures. Full article
(This article belongs to the Special Issue Land Modifications and Impacts on Coastal Areas)
Show Figures

Figure 1

19 pages, 5968 KiB  
Article
Landscape and Vegetation Patterns Zoning Is a Methodological Tool for Management Costs Implications Due to Xylella fastidiosa Invasion
by Francesco Bozzo, Michel Frem, Vincenzo Fucilli, Gianluigi Cardone, Paolo Francesco Garofoli, Stefania Geronimo and Alessandro Petrontino
Land 2022, 11(7), 1105; https://doi.org/10.3390/land11071105 - 19 Jul 2022
Cited by 8 | Viewed by 2659
Abstract
Philaenus spumarius (Linnaeus 1758, hereafter Ps) is considered one of the main insect vectors responsible for the spread of an alien biota, Xylella fastidiosa (Wells 1987, hereafter Xf), in the Salento area, Apulia region (Southern Italy). Effective management of this biological [...] Read more.
Philaenus spumarius (Linnaeus 1758, hereafter Ps) is considered one of the main insect vectors responsible for the spread of an alien biota, Xylella fastidiosa (Wells 1987, hereafter Xf), in the Salento area, Apulia region (Southern Italy). Effective management of this biological invader depends on the continuous surveillance and monitoring of its insect vector. As such, this research elicits the invasion drivers (i.e., landscape and vegetation indicators) that influence the abundance and the dynamics of this vector and, consequently, the spatial spread of this bacterium in this Italian region. For this purpose, a spatial pattern clustering methodological approach is considered. The results reveal that spatial variation and territorial differentiation may differ from zone to zone in the same invaded area, for which effective management and monitoring planning should be addressed. Further, six agro-ecosystems zones have been identified with respect to five indicators: (i) vegetation index, (ii) intensity of cultivation, (iii) cultural diversity, (iv) density of agricultural landscape elements, and (v) altitude. This paper has public implications and contributes to an understanding of how zoning of an infected area, by an alien biota, into homogenous zones may impact its effective management costs. This approach could also be applied in other countries affected or potentially affected by the phenomenon of Xf invasion. Full article
(This article belongs to the Special Issue Landscape and Vegetation: Methodological Aspects)
Show Figures

Figure 1

20 pages, 7142 KiB  
Article
Spatiotemporal Variation of Land Surface Temperature in Henan Province of China from 2003 to 2021
by Shifeng Li, Zhihao Qin, Shuhe Zhao, Maofang Gao, Shilei Li, Qianyu Liao and Wenhui Du
Land 2022, 11(7), 1104; https://doi.org/10.3390/land11071104 - 19 Jul 2022
Cited by 8 | Viewed by 2208
Abstract
Land surface temperature (LST) is a key parameter closely related to various land surface processes and surface-atmosphere interactions. Analysis of spatiotemporal variation of time-series LST may provide useful information to understand eco-climatic characteristics. In this study, the spatiotemporal pattern of LST and its [...] Read more.
Land surface temperature (LST) is a key parameter closely related to various land surface processes and surface-atmosphere interactions. Analysis of spatiotemporal variation of time-series LST may provide useful information to understand eco-climatic characteristics. In this study, the spatiotemporal pattern of LST and its trend characteristics in Henan Province were examined based on MODIS LST products from 2003 to 2021. In addition, the influences of land cover types, Nighttime Light data (NTL) and Normalized Difference Moisture Index (NDMI) on LST variation were analyzed. The results indicated that: (i) The LST showed slight and rapid decreasing trend for 2004–2010 and 2018–2020, respectively, whereas an obvious increasing and slight increasing trend occurred for 2010–2013 and 2014–2018. In terms of spatial pattern, high-temperature, and sub-high-temperature were mainly distributed in the central part of the province with higher level of industrialization and urbanization at the annual, spring, summer, and daytime scales. While in fall, winter, and the nighttime, the spatial distribution of LST exhibited decreased trend from the southern part to the northern part of the province, the largest Standard Deviation (STD) was observed in summer. (ii) The interannual variation rate of LST was 0.08 °C/Y. The increasing trend mainly occurred in urban and built-up areas. At the seasonal scales, the rising rate decreased sequentially in the order of fall, winter, spring, and summer. In addition, the rising rate in the daytime was higher than that in the nighttime. (iii) LST increased along with the expansion of urban and built-up lands, except in winter. At the annual scales, 84.69% of areas with NTL data exhibited a positive correlation with LST, and NDMI in the western part with high elevation presented a significantly positive correlation to LST, while a significantly negative correlation occurred in urban and built-up areas. The cooling effect of NDMI on LST in the daytime was greater than that in the nighttime. In cropland areas, LST showed a non-significant correlation with NDMI at the annual scale, and a significantly negative correlation with NDMI in spring, summer, and fall. The influence mechanism of cropland on the variation of LST at different timescales needs to be further explored. These findings might provide some hints to understand climate change and its causes in the province. Full article
(This article belongs to the Special Issue Feature Papers for Land–Climate Interactions Section)
Show Figures

Figure 1

27 pages, 13306 KiB  
Article
Functional Tradeoffs and Feature Recognition of Rural Production–Living–Ecological Spaces
by Tianyi Zhao, Yuning Cheng, Yiyang Fan and Xiangnan Fan
Land 2022, 11(7), 1103; https://doi.org/10.3390/land11071103 - 19 Jul 2022
Cited by 19 | Viewed by 2058
Abstract
Recently, the spatial contradiction in rural construction has intensified. Production–living–ecological (PLE) spaces, as important load-bearing spatial patterns of rural revitalization, have become a research focus of territorial space planning. Because of the lack of studies on the scale and accuracy at the township [...] Read more.
Recently, the spatial contradiction in rural construction has intensified. Production–living–ecological (PLE) spaces, as important load-bearing spatial patterns of rural revitalization, have become a research focus of territorial space planning. Because of the lack of studies on the scale and accuracy at the township level in rural PLE spaces, the objective of this study is to quantify the subfunctional and functional areas of PLE spaces, weigh the relationship between PLE functions, and conduct feature identification and strategy formulation of the PLE synergistic functional areas. Combined with multitype measurement methods, the study constructed a township-level PLE space evaluation system composed of 12 subfunctional indicators. Taking Guli Street in Nanjing city as an example, Spearman correlation analysis, spatial local autocorrelation analysis, and cold/hot spot identification were used to analyze the synergies and tradeoffs between PLE functions. On this basis, the evaluation model of the PLE synergies area was constructed. The results showed that the production function showed a fragmented distribution pattern. The proportion of high-intensity living function areas was very small. The ecological function area had good patch integrity. In the PLE functions, obvious synergies exist between any two functions, and the tradeoff between the third one and any of the two functions. The seven types of PLE synergistic potential areas were dominated by the dual-function high synergistic zone (DF-H-Z). The zoning scheme and governance strategy proposed in this paper have important practical value for solving the contradiction of sustainable and coordinated development of township-scale spatial resources. Full article
(This article belongs to the Special Issue Feature Papers for Land, Biodiversity, and Human Wellbeing Section)
Show Figures

Figure 1

21 pages, 11483 KiB  
Article
Modeling the Temperature Field in Frozen Soil under Buildings in the City of Salekhard Taking into Account Temperature Monitoring
by Mikhail Yu. Filimonov, Yaroslav K. Kamnev, Aleksandr N. Shein and Nataliia A. Vaganova
Land 2022, 11(7), 1102; https://doi.org/10.3390/land11071102 - 19 Jul 2022
Cited by 7 | Viewed by 2128
Abstract
Most residential buildings and capital structures in the permafrost zone are constructed on the principle of maintaining the frozen state of the foundation soils. The changing climate and the increasing anthropogenic impact on the environment lead to changes in the boundaries of permafrost. [...] Read more.
Most residential buildings and capital structures in the permafrost zone are constructed on the principle of maintaining the frozen state of the foundation soils. The changing climate and the increasing anthropogenic impact on the environment lead to changes in the boundaries of permafrost. These changes are especially relevant in the areas of piling foundations of residential buildings and other engineering structures located in the northern regions since they can lead to serious accidents caused by the degradation of permafrost and decrease the bearing capacity of the soil in such areas. Therefore, organization of temperature monitoring and forecasting of temperature changes in the soil under the buildings is an actual problem. To solve this problem, we use computer simulation methods of three-dimensional nonstationary thermal fields in the soil in combination with real-time monitoring of the temperature of the soil in thermometric wells. The developed approach is verified by using the temperature monitoring data for a specific residential building in the city of Salekhard. Comparison of the results of numerical calculations with experimental data showed good agreement. Using the developed computer software, nonstationary temperature fields under this building are obtained and, on this basis, the bearing capacities of all piles are calculated and a forecast of their changes in the future is given. To avoid decreasing the bearing capacity of piles it is necessary to prevent the degradation of permafrost and to supply the thermal stabilization of the soil. The proposed approach, based on a combination of the soil temperature monitoring and computer modeling methods, can be used to improve geotechnical monitoring methods. Full article
Show Figures

Figure 1

18 pages, 2415 KiB  
Article
Spatiotemporal Patterns in and Key Influences on Cultivated-Land Multi-Functionality in Northeast China’s Black-Soil Region
by Heyang Gong, Zhibo Zhao, Lei Chang, Guanghui Li, Ying Li and Yuefen Li
Land 2022, 11(7), 1101; https://doi.org/10.3390/land11071101 - 19 Jul 2022
Cited by 10 | Viewed by 2370
Abstract
Cultivated-land multi-functionality has become an important way to achieve sustainable cultivated-land protection, and it has become a hot spot in the field of land-management policy. Taking the cultivated black soils in the grain-producing area of Jilin Province, Northeast China, as a case study, [...] Read more.
Cultivated-land multi-functionality has become an important way to achieve sustainable cultivated-land protection, and it has become a hot spot in the field of land-management policy. Taking the cultivated black soils in the grain-producing area of Jilin Province, Northeast China, as a case study, this paper assessed the multi-functions of cultivated land over the past 30 years by applying the improved TOPSIS model. Furthermore, the key limiting factors and influencing factors of the multi-functions of cultivated land were identified through the obstacle-degree model and the Geo-detector. The results show that the level of multi-functionality rose from 1990 to 2020, but an increase in both economic and social functions hindered improvements in the ecological function of cultivated land. There were obvious spatial differences in the functions of cultivated land in different counties, with ecological functions showing the highest degree of differentiation, followed by social and economic functions. The per capita agricultural output, the degree of agricultural mechanization, the average output from cultivated land, and the agricultural-labor productivity had the most restrictive effects on the functions of cultivated land, with barrier-degree values of 15.90, 13.90, 11.76, and 10.30, respectively. Coupling–coordination in the multi-functions and sub-functions of cultivated land showed an upward trend, from “low coupling coordination–antagonistic coupling coordination” to “high coupling coordination-optimal coupling coordination”. The government should include the level of multi-functional utilization in future policies for the management and utilization of cultivated land and take measures to reduce the differences in the functions of cultivated land among regions. Quantifying the multi-functional value of cultivated land and subsidizing land cultivation should encourage farmers to protect the land and help to strengthen multi-functional planning and functional design, improve ecological utilization, and promote the sustainable use of cultivated land. Full article
(This article belongs to the Special Issue Rethinking the Man-Land Relations in China)
Show Figures

Figure 1

16 pages, 1115 KiB  
Article
Territorial Prospective to Sustainability: Strategies for Future Successful of Water Resource Management on Andean Basins
by Christian Mera-Parra, Priscilla Massa-Sánchez, Fernando Oñate-Valdivieso and Pablo Ochoa-Cueva
Land 2022, 11(7), 1100; https://doi.org/10.3390/land11071100 - 18 Jul 2022
Cited by 2 | Viewed by 2604
Abstract
In Latin America, water resource management in some areas is difficult when all parts of a system are not considered (including its dynamism). Therefore, it becomes necessary to prepare instruments that facilitate management using a comprehensive approach. This study aimed to develop a [...] Read more.
In Latin America, water resource management in some areas is difficult when all parts of a system are not considered (including its dynamism). Therefore, it becomes necessary to prepare instruments that facilitate management using a comprehensive approach. This study aimed to develop a methodology that allows one to conduct a prospective analysis of water management over delimited territories. The Zamora Huayco basin was chosen as the study area. This work included a survey of physical-natural, socioeconomic, and political-institutional variables, as well as a system structural analysis. Also, the generation of future scenarios and the strategic and tactical orientation for the integrated management of water resources. The results show that, of the 23 variables used, 19 were classified as key system variables. Most of the variables had strong impacts on each other, but at the same time these were highly receptive to changes. The behavior of change, proposed for the different uses and land cover in the basin for 2029, was considered as the objective scenario, highlighting the gain in forest areas and shrub vegetation. The strategic plans proposed in this methodology consider the structuring and collecting information in a single repository, creating communication channels between stakeholders and decision-makers. Full article
Show Figures

Figure 1

14 pages, 1018 KiB  
Article
The Effect of Innovation City Construction on Carbon Emissions in China
by Cong Wei and Jiayang Kong
Land 2022, 11(7), 1099; https://doi.org/10.3390/land11071099 - 18 Jul 2022
Cited by 5 | Viewed by 1754
Abstract
Innovation, as a driving force to economic growth, has been referred to as an important development strategy by the central government of China. In order to improve the innovative capability of cities, Chinese officials started to construct innovation cities in 2008. Previous studies [...] Read more.
Innovation, as a driving force to economic growth, has been referred to as an important development strategy by the central government of China. In order to improve the innovative capability of cities, Chinese officials started to construct innovation cities in 2008. Previous studies have investigated the ecological and economic effects of innovation city construction; however, the environmental effect of the project remains unclear. In this study, we constructed an annual panel of 285 cities in China, from 2007 to 2015, to assess the effect of innovation city construction on carbon emissions. Our baseline results are obtained from a difference-in-differences estimator, comparing cities with and without introducing innovation city construction, whose results show that innovation city construction reduces carbon emissions by about 2% on average. We found a similar effect of innovation city construction on carbon emissions when we controlled for the estimated propensity of a city to launch the innovation city construction based on a series of urban characteristics, such as gross regional product and population. We obtained comparable estimates when we used the propensity score as weights to balance urban characteristics between cities with and without launching the innovation city construction. Our results also show that innovation city construction has a larger effect on carbon emissions in western, poorer, and fewer population cities than in those with opposite characteristics. We found suggested the persistence of the effect that innovation city construction had on carbon emissions, implying that the Chinese government should encourage innovation to reduce carbon emissions. Besides, we performed a series of robustness tests, including the leave-one-city-out test, the bootstrapping test, and the permutation test, to illustrate the robustness of our results. Full article
Show Figures

Figure 1

20 pages, 3701 KiB  
Article
Evaluation and Improvement Measures of the Runoff Coefficient of Urban Parks for Sustainable Water Balance
by Jinkwan Son and Taegeun Kwon
Land 2022, 11(7), 1098; https://doi.org/10.3390/land11071098 - 18 Jul 2022
Cited by 5 | Viewed by 3701
Abstract
As the impermeable sidewalk area increases in urban areas, diverse problems related to water occur. The purposes of this research were to increase the rainwater infiltration rate through water balance analysis and estimate the runoff coefficient according to land cover types in urban [...] Read more.
As the impermeable sidewalk area increases in urban areas, diverse problems related to water occur. The purposes of this research were to increase the rainwater infiltration rate through water balance analysis and estimate the runoff coefficient according to land cover types in urban parks. The regression equations and runoff coefficients relative to the rainwater infiltration rate were estimated according to the land cover types and applied to eight urban parks. In the results of the experiment, the runoff coefficient was 0.245 for vegetation areas, 0.583 for permeable sidewalks, 0.963 for sidewalk blocks, and 1.000 for impervious sidewalks, which had 100% outflow. The results show that the vegetation area in urban parks is significantly related to rainfall–runoff, infiltration, and evapotranspiration. The average of eight urban parks was 126.52 mm, indicating that 11.80% of the rainfall was recharged into groundwater. Additionally, the average runoff rate was 498.56 mm, indicating that 46.52% was leaked externally. Therefore, it is suggested to decrease the impermeable sidewalk areas in urban parks. Additionally, extending the waterway, swamp, and gravel sidewalk areas is suggested. Urban parks should be developed in order to contribute to hydrological control through the water balance in urban land use. Full article
(This article belongs to the Special Issue Hydrological Processes in Urban Environments)
Show Figures

Figure 1

13 pages, 1650 KiB  
Article
Decoupling the Economic Development from Resource Consumption: Implications and Challenges in Assessing the Evolution of Forest Area in Romania
by Carmen Valentina Rădulescu, Florina Bran, Alexandru Liviu Ciuvăț, Dumitru Alexandru Bodislav, Ovidiu Cristian Buzoianu, Mihaela Ștefănescu and Sorin Burlacu
Land 2022, 11(7), 1097; https://doi.org/10.3390/land11071097 - 18 Jul 2022
Cited by 6 | Viewed by 1829
Abstract
The paper proposes an insight into the relation existing between economic development and resource consumption and the associated implications and challenges for forested areas in Romania. In accordance with this purpose, the methods used are both qualitative and quantitative by using a relevant [...] Read more.
The paper proposes an insight into the relation existing between economic development and resource consumption and the associated implications and challenges for forested areas in Romania. In accordance with this purpose, the methods used are both qualitative and quantitative by using a relevant literature review, including international and national reports. In the 1950s and 1960s, Simon Kuznets introduced to modern economic theory the idea that there are certain market forces directly correlated with economic development. After almost two decades of a market economy in Romania, we are witnessing a relative decoupling process between economic development and social inequality. Moreover, the country strives to make the transition to a circular economy by involving all relevant stakeholders and by attracting the necessary financial support. Sustainable development offers the perspective of reaching an equilibrium between economic, social, and environmental aspects. Finding the right tools to assess multiple impacts has always been challenging as regards decoupling the economic development from natural resource consumption. Although there are multiple interpretations of the outcomes of a decoupling process, this paper aims at assessing the evolution of forested areas through econometric research using the Environmental curve of Simon Kuznets. As our main results, we have observed a decoupling process in the GDP growth that will not lead to a decrease in wooded areas in our country, mainly due to rural–urban migration, shifts in consumption patterns (from firewood toward natural gases, etc.) and improvement in the legislative framework in the case of forestry products. Among the weaknesses of the model used are the limited data availability and the reduced number of observations with annual frequency (data were taken only for 22 years), the use of a square pattern instead of a cubic one (it is possible for the results to differ and consequently another form of this curve, either N or N-inverted) or the use of data with a low accuracy related to the total forest areas in Romania. Among the conclusions of the papers, the decoupling process is not a single action process. Our research focused on forest area and the need to connect it with other policy actions related to mainstreaming sustainability, promoting a circular economy or bioeconomy, or developing innovative public policies and instruments. Full article
Show Figures

Figure 1

18 pages, 10472 KiB  
Article
Erosion Map Reliability Using a Geographic Information System (GIS) and Erosion Potential Method (EPM): A Comparison of Mapping Methods, BELGRADE Peri-Urban Area, Serbia
by Nataša Veličković, Mirjana Todosijević and Desanaka Šulić
Land 2022, 11(7), 1096; https://doi.org/10.3390/land11071096 - 18 Jul 2022
Cited by 3 | Viewed by 2646
Abstract
Soil erosion is a product of natural and anthropogenic factors and, at the same time, an economic and environmental concern. One of the methods applied to calculate the intensity of erosion is the erosion potential method (EPM), with two possible procedures for determining [...] Read more.
Soil erosion is a product of natural and anthropogenic factors and, at the same time, an economic and environmental concern. One of the methods applied to calculate the intensity of erosion is the erosion potential method (EPM), with two possible procedures for determining the average erosion coefficient of an area: analytical and graphical. Using GIS and EPM methods, without field observations of erosion, based on cartographic materials and satellite images, erosion maps were created for 1970 and 2018, for part of the peri-urban area of Belgrade. Based on the created erosion maps, the values of the mean coefficients of erosion, as well as the arithmetic means for the study area, were determined for the settlements. The aim of the study is to assess the reliability of the mean coefficient of soil erosion, obtained from the erosion map created from the cartographic materials and satellite images, without field observations of erosion. Thus, the obtained values of the mean erosion coefficient were compared with the values obtained from the erosion map with field observation and the values obtained by the analytical procedure. Statistical analysis (F test) for 1970 and for 2018 determined a high degree of reliability (p < 0.05) of the mean erosion coefficients of the area obtained from erosion maps that were created from cartographic materials and satellite images without field observation. Regardless of the procedure for determining the mean erosion coefficient, a significant decrease in soil losses was observed, from 10.64 to 5.97 t ha−1year−1 (average annual specific production of sediments, year 1970 and 2018, respectively). Full article
Show Figures

Figure 1

16 pages, 3306 KiB  
Article
Spatial Heterogeneity of Public Service Facilities in the Living Circle and Its Influence on Housing Prices: A Case Study of Central Urban Dalian, China
by Jinlian Hao and Haitao Ma
Land 2022, 11(7), 1095; https://doi.org/10.3390/land11071095 - 18 Jul 2022
Cited by 8 | Viewed by 3387
Abstract
The spatial layout of public service facilities (PSFs) markedly influences residents’ quality of life. Based on Baidu map data, spatial information on 27,552 PSFs across eight categories was collected for urban Dalian, China, and analyzed using the nearest neighbor index and nuclear density. [...] Read more.
The spatial layout of public service facilities (PSFs) markedly influences residents’ quality of life. Based on Baidu map data, spatial information on 27,552 PSFs across eight categories was collected for urban Dalian, China, and analyzed using the nearest neighbor index and nuclear density. Then, PSF accessibility across eight dimensions of residential quarters was calculated based on the cumulative opportunity method, and its impact on housing prices was analyzed. The results revealed the following: (1) The degree of spatial agglomeration for PSFs varied, with that of business facilities being higher than that of other public welfare facilities. The distribution of business facilities was characterized by a dense center and sparse periphery, whereas public welfare facilities were laid out in a relatively balanced “multi-center” distribution across the study area. (2) Significant spatial differences in the number and types of accessible resident facilities were identified. The number of accessible PSFs in the core area of central urban regions was large and the types were relatively complete, whereas the accessible PSFs in the western and northern marginal areas were limited in number, few in type, and lacking across certain categories, such as educational facilities and life services. (3) The spatial distribution of PSF accessibility was unbalanced. The accessibility of various PSFs in the Shahekou District was the highest, followed by that in the Zhongshan, Xigang, and Ganjingzi Districts. (4) The accessibility of educational, sport, and cultural facilities, and the total accessibility and greening rate of residential areas were the most significantly positively correlated with housing prices; however, the number of households in residential areas and the distances between residential areas and large shopping centers were significantly negatively correlated. Our findings will expand the research perspective of PSFs, provide a basis for meeting residents’ needs and a rational allocation of PSFs, and provide references for people’s decisions to buy houses. Full article
(This article belongs to the Topic Climate Change and Environmental Sustainability)
Show Figures

Figure 1

30 pages, 13817 KiB  
Article
The Determination of Priority Areas for the Restoration of Degraded Tropical Peatland Using Hydrological, Topographical, and Remote Sensing Approaches
by Bambang Kun Cahyono, Trias Aditya and Istarno
Land 2022, 11(7), 1094; https://doi.org/10.3390/land11071094 - 18 Jul 2022
Cited by 2 | Viewed by 2594
Abstract
Degraded peatland is caused by forest clearing and the construction of artificial water networks. When water management is not implemented across land uses in the entire peatland landscape, then it will be a big issue that causes a water deficit and leads to [...] Read more.
Degraded peatland is caused by forest clearing and the construction of artificial water networks. When water management is not implemented across land uses in the entire peatland landscape, then it will be a big issue that causes a water deficit and leads to increasing droughts and fires. Effective restoration must first identify the part of Peatland Hydrological system Units (PHUs) with insufficient water storage and resources. This study used intercorrelated factors of water balance, deficit months, NDMI-NDVI indices, dry periods, recurrent fires, peat depth, and water loss conditions, as the evaluation parameters, within individual sub-PHUs to determine the most degraded areas that require intervention and restoration. Sub-PHU was determined based on the peat hydrological unity concept by identifying streamline, outlet channels, peat-depth, slopes, and network connectivity. Global hydrological data using TerraClimate and CHIRPS, combined with field observations, were used to validate and calculate each sub-PHU’s water balance and dry periods. Soil moisture (NDMI), vegetation density (NDVI), and fire frequency were extracted from multispectral satellite images (e.g., Landsat 8, MODIS-Terra, and MODIS-Aqua). Each parameter was ranked by the score for each sub-PHU. The parameters that can be ranked are only the ordinal type of number. The lowest ranks indicated the most degraded sub-PHUs requiring peat rewetting interventions. Full article
(This article belongs to the Special Issue Peatland Restoration – towards an Integrated Approach)
Show Figures

Figure 1

21 pages, 3562 KiB  
Article
A GIS Plugin for Susceptibility Modeling: Case Study of Wildfires in Vila Nova de Foz Côa
by André Padrão, Lia Duarte and Ana Cláudia Teodoro
Land 2022, 11(7), 1093; https://doi.org/10.3390/land11071093 - 17 Jul 2022
Cited by 2 | Viewed by 2360
Abstract
Risk mapping is a crucial part of spatial planning, as it optimizes the allocation of resources in its management. It is, therefore, of great interest to build tools that enhance its production. This work focuses on the implementation of a susceptibility model for [...] Read more.
Risk mapping is a crucial part of spatial planning, as it optimizes the allocation of resources in its management. It is, therefore, of great interest to build tools that enhance its production. This work focuses on the implementation of a susceptibility model for different types of spatially distributed risk in a geographic information systems (GIS) Python plugin. As an example, the susceptibility model was applied to study the occurrence of wildfires in the municipality of Vila Nova de Foz Côa, Portugal. The plugin was developed to simplify the production and evaluation of susceptibility maps regarding the available geographical information. Regarding our case study, the data used corresponds to three training areas, ten years of burned areas and nine environmental variables. The model is applied to different combinations of these factors. The validation, performed with receiver operating characteristic (ROC) curves, resulted in an area under the curve (AUC) of 74% for a fire susceptibility model, calculated with the same environmental factors used in official Portuguese cartography (land use and slope) and with the optimal training area, years of information on burned area and level of land use classification. After experimenting with four variable combinations, a maximum AUC of 77% was achieved. This study confirms the suitability of the variables chosen for the production of official fire susceptibility models but leaves out the comparison between the official methodology and the methodology proposed in this work. Full article
(This article belongs to the Special Issue Land: 10th Anniversary)
Show Figures

Figure 1

14 pages, 4479 KiB  
Article
Revealing the Land Use Volatility Process in Northern Southeast Asia
by Yongheng Rao and Jianjun Zhang
Land 2022, 11(7), 1092; https://doi.org/10.3390/land11071092 - 17 Jul 2022
Cited by 2 | Viewed by 1766
Abstract
Frequent land use change has generally been considered as a consequence of human activities. Here, we revealed the land use volatility process in northern Southeast Asia (including parts of Myanmar, Thailand, Laos, Vietnam, and China) from 2000 to 2018 with LandTrendr in the [...] Read more.
Frequent land use change has generally been considered as a consequence of human activities. Here, we revealed the land use volatility process in northern Southeast Asia (including parts of Myanmar, Thailand, Laos, Vietnam, and China) from 2000 to 2018 with LandTrendr in the Google Earth Engine (GEE) platform based on the Normalized Burning Index (NBR). The result showed that land use volatility with similar degrees had very obvious aggregation characteristics in time and space in the study area, and the time for the occurrence of land use volatility in adjacent areas was often relatively close. This trend will become more obvious with the intensity of land use volatility. At the same time, land use volatility also has obvious spillover effects, and strong land use volatility will drive changes in the surrounding land. If combined with the land use/cover types, which are closely related to human activities that could have more severe land use volatility, and with the increase of the volatility intensity, the proportion of the land use type with strong land use volatility will gradually increase. Revealing the land use volatility process has a possibility to deepen the understanding of land use change and to help formulate land use policy. Full article
Show Figures

Figure 1

15 pages, 6461 KiB  
Article
Analysis of Meandering River Morphodynamics Using Satellite Remote Sensing Data—An Application in the Lower Deduru Oya (River), Sri Lanka
by Vindhya Basnayaka, Jayanga T. Samarasinghe, Miyuru B. Gunathilake, Nitin Muttil, Dileepa C. Hettiarachchi, Amila Abeynayaka and Upaka Rathnayake
Land 2022, 11(7), 1091; https://doi.org/10.3390/land11071091 - 16 Jul 2022
Cited by 10 | Viewed by 4010
Abstract
River meandering and anabranching have become major problems in many large rivers that carry significant amounts of sediment worldwide. The morphodynamics of these rivers are complex due to the temporal variation of flows. However, the availability of remote sensing data and geographic information [...] Read more.
River meandering and anabranching have become major problems in many large rivers that carry significant amounts of sediment worldwide. The morphodynamics of these rivers are complex due to the temporal variation of flows. However, the availability of remote sensing data and geographic information systems (GISs) provides the opportunity to analyze the morphological changes in river systems both quantitatively and qualitatively. The present study investigated the temporal changes in the river morphology of the Deduru Oya (river) in Sri Lanka, which is a meandering river. The study covered a period of 32 years (1989 to 2021), using Landsat satellite data and the QGIS platform. Cloud-free Landsat 5 and Landsat 8 satellite images were extracted and processed to extract the river mask. The centerline of the river was generated using the extracted river mask, with the support of semi-automated digitizing software (WebPlotDigitizer). Freely available QGIS was used to investigate the temporal variation of river migration. The results of the study demonstrated that, over the past three decades, both the bend curvatures and the river migration rates of the meandering bends have generally increased with time. In addition, it was found that a higher number of meandering bends could be observed in the lower (most downstream) and the middle parts of the selected river segment. The current analysis indicates that the Deduru Oya has undergone considerable changes in its curvature and migration rates. Full article
Show Figures

Figure 1

Previous Issue
Next Issue
Back to TopTop