Next Issue
Volume 9, April
Previous Issue
Volume 9, February


Geosciences, Volume 9, Issue 3 (March 2019) – 43 articles

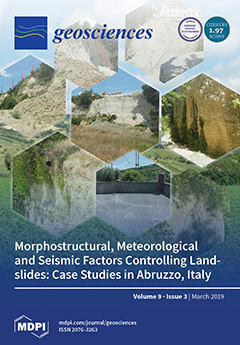
Cover Story (view full-size image): In February 2017, after a heavy snowfall and moderate seismicity, several landslides affected the NE-Abruzzo. This paper describes the investigations on the Ponzano (translational/complex) landslide and the Castelnuovo (topple/fall) landslide. These cases were studied by means of field geological/geomorphological mapping, borehole analysis, and geostructural analysis, supported by pre/post-landslide air photo interpretation and FLAC3D numerical modelling. Through this integrated analysis, the role of the morphostructural setting and seismic and meteorological factors in the landslides of the Abruzzo Apennines piedmont was investigated. View this paper
  • Issues are regarded as officially published after their release is announced to the table of contents alert mailing list.
  • You may sign up for e-mail alerts to receive table of contents of newly released issues.
  • PDF is the official format for papers published in both, html and pdf forms. To view the papers in pdf format, click on the "PDF Full-text" link, and use the free Adobe Reader to open them.
Order results
Result details
Section
Select all
Export citation of selected articles as:
28 pages, 2895 KiB  
Article
Finite Element Simulations of an Elasto-Viscoplastic Model for Clay
by Mohammad N. Islam, Carthigesu T. Gnanendran and Mehrdad Massoudi
Geosciences 2019, 9(3), 145; https://doi.org/10.3390/geosciences9030145 - 26 Mar 2019
Cited by 5 | Viewed by 4725
Abstract
In this paper, we develop an elasto-viscoplastic (EVP) model for clay using the non-associated flow rule. This is accomplished by using a modified form of the Perzyna’s overstressed EVP theory, the critical state soil mechanics, and the multi-surface theory. The new model includes [...] Read more.
In this paper, we develop an elasto-viscoplastic (EVP) model for clay using the non-associated flow rule. This is accomplished by using a modified form of the Perzyna’s overstressed EVP theory, the critical state soil mechanics, and the multi-surface theory. The new model includes six parameters, five of which are identical to those in the critical state soil mechanics model. The other parameter is the generalized nonlinear secondary compression index. The EVP model was implemented in a nonlinear coupled consolidated code using a finite-element numerical algorithm (AFENA). We then tested the model for different clays, such as the Osaka clay, the San Francisco Bay Mud clay, the Kaolin clay, and the Hong Kong Marine Deposit clay. The numerical results show good agreement with the experimental data. Full article
(This article belongs to the Special Issue Micromechanics of Reservoir and Cap Rocks)
Show Figures

Figure 1

15 pages, 4561 KiB  
Article
Performance of Remotely Sensed Soil Moisture for Temporal and Spatial Analysis of Rainfall over São Francisco River Basin, Brazil
by Jefferson Souto, Norma Beltrão and Ana Teodoro
Geosciences 2019, 9(3), 144; https://doi.org/10.3390/geosciences9030144 - 26 Mar 2019
Cited by 12 | Viewed by 3361
Abstract
Variability in precipitation patterns in the northeast and southeast regions of Brazil are complex, and the combined effects of the Tropical Atlantic, Pacific Niños, and local characteristics influence the precipitation rates. This study assesses the performance of multi-satellite precipitation product SM2RAIN-Climate Change Initiative [...] Read more.
Variability in precipitation patterns in the northeast and southeast regions of Brazil are complex, and the combined effects of the Tropical Atlantic, Pacific Niños, and local characteristics influence the precipitation rates. This study assesses the performance of multi-satellite precipitation product SM2RAIN-Climate Change Initiative (SM2RAIN-CCI) for the period of 1998–2015 at monthly scale. To accomplish this aim, various statistical analyses and comparison of multi-satellite precipitation analysis products with rain gauge stations are carried out. In addition, we used three values corresponding to extreme events: The total daily precipitation (PRCPTOT) and the number of consecutive dry/wet days (CDD/CWD). Results reveal that monthly rainfall data from SM2RAIN-CCI are compatible with surface observations, showing a seasonal pattern typical of the region. Data correlate well with observations for the selected stations (r ≥ 0.85) but tend to overestimate high rainfall values (>80 mm/month) in the rainy area. There is a significant decrease in rainfall to the indices, especially in PRCPTOT during the occurrence of tropical ocean–atmosphere interactions, reflecting CWD and CDD values. Moreover, our findings also indicate a relationship, at interannual timescales, between the state of El Niño Southern-Oscillation (ENSO) and Tropical Atlantic (TA) annual precipitation variability from 1998 to 2015. The SM2RAIN-CCI could be a useful alternative for rain-gauge precipitation data in the São Francisco River basin. Full article
(This article belongs to the Special Issue Remote Sensing used in Environmental Hydrology)
Show Figures

Figure 1

14 pages, 2394 KiB  
Article
Estimating Residential Property Values on the Basis of Clustering and Geostatistics
by Beata Calka
Geosciences 2019, 9(3), 143; https://doi.org/10.3390/geosciences9030143 - 24 Mar 2019
Cited by 22 | Viewed by 4618
Abstract
The article presents a two-stage model for estimating the value of residential property. The research is based on the application of a sequence of known methods in the process of developing property value maps. The market is divided into local submarkets using data [...] Read more.
The article presents a two-stage model for estimating the value of residential property. The research is based on the application of a sequence of known methods in the process of developing property value maps. The market is divided into local submarkets using data mining, and, in particular, data clustering. This process takes into account only a property’s non-spatial (structural) attributes. This is the first stage of the model, which isolates local property markets where properties have similar structural attributes. To estimate the impact of the spatial factor (location) on property value, the second stage involves performing an interpolation for each cluster separately using ordinary kriging. In this stage, the model is based on Tobler’s first law of geography. The model results in property value maps, drawn up separately for each of the clusters. Experimental research carried out using the example of Siedlce, a city in eastern Poland, proves that the estimation error for a property’s value using the proposed method, evaluated using the mean absolute percentage error, does not exceed 10%. The model that has been developed is universal and can be used to estimate the value of land, property, and buildings. Full article
(This article belongs to the Special Issue Geodesy and Geomatics Engineering)
Show Figures

Figure 1

24 pages, 14343 KiB  
Article
Seafloor Classification in a Sand Wave Environment on the Dutch Continental Shelf Using Multibeam Echosounder Backscatter Data
by Leo Koop, Alireza Amiri-Simkooei, Karin J. van der Reijden, Sarah O’Flynn, Mirjam Snellen and Dick G. Simons
Geosciences 2019, 9(3), 142; https://doi.org/10.3390/geosciences9030142 - 23 Mar 2019
Cited by 21 | Viewed by 5510
Abstract
High resolution maps of sandy seafloors are valuable to understand seafloor dynamics, plan engineering projects, and create detailed benthic habitat maps. This paper presents multibeam echosounder backscatter classification results of the Brown Bank area of the North Sea. We apply the Bayesian classification [...] Read more.
High resolution maps of sandy seafloors are valuable to understand seafloor dynamics, plan engineering projects, and create detailed benthic habitat maps. This paper presents multibeam echosounder backscatter classification results of the Brown Bank area of the North Sea. We apply the Bayesian classification method in a megaripple and sand wave area with significant slopes. Prior to the classification, corrections are implemented to account for the slopes. This includes corrections on the backscatter value and its corresponding incident angle. A trade-off in classification resolutions is found. A higher geo-acoustic resolution is obtained at the price of losing spatial resolution, however, the Bayesian classification method remains robust with respect to these trade-off decisions. The classification results are compared to grab sample particle size analysis and classified video footage. In non-distinctive sedimentary environments, the acoustic classes are not attributed to only the mean grain size of the grab samples but to the full spectrum of the grain sizes. Finally, we show the Bayesian classification results can be used to characterize the sedimentary composition of megaripples. Coarser sediments were found in the troughs and on the crests, finer sediments on the stoss slopes and a mixture of sediments on the lee slopes. Full article
(This article belongs to the Special Issue Geological Seafloor Mapping)
Show Figures

Figure 1

38 pages, 9583 KiB  
Article
Techniques for Classifying Seabed Morphology and Composition on a Subtropical-Temperate Continental Shelf
by Michelle Linklater, Timothy C. Ingleton, Michael A. Kinsela, Bradley D. Morris, Katie M. Allen, Michael D. Sutherland and David J. Hanslow
Geosciences 2019, 9(3), 141; https://doi.org/10.3390/geosciences9030141 - 22 Mar 2019
Cited by 27 | Viewed by 8942
Abstract
In 2017, the New South Wales (NSW) Office of Environment and Heritage (OEH) initiated a state-wide mapping program, SeaBed NSW, which systematically acquires high-resolution (2–5 m cell size) multibeam echosounder (MBES) and marine LiDAR data along more than 2000 km of the subtropical-to-temperate [...] Read more.
In 2017, the New South Wales (NSW) Office of Environment and Heritage (OEH) initiated a state-wide mapping program, SeaBed NSW, which systematically acquires high-resolution (2–5 m cell size) multibeam echosounder (MBES) and marine LiDAR data along more than 2000 km of the subtropical-to-temperate southeast Australian continental shelf. This program considerably expands upon existing efforts by OEH to date, which have mapped approximately 15% of NSW waters with these technologies. The delivery of high volumes of new data, together with the vast repository of existing data, highlights the need for a standardised, automated approach to classify seabed data. Here we present a methodological approach with new procedures to semi-automate the classification of high-resolution bathymetry and intensity (backscatter and reflectivity) data into a suite of data products including classifications of seabed morphology (landforms) and composition (substrates, habitats, geomorphology). These methodologies are applied to two case study areas representing newer (Wollongong, NSW) and older (South Solitary Islands, NSW) MBES datasets to assess the transferability of classification techniques across input data of varied quality. The suite of seabed classifications produced by this study provide fundamental baseline data on seabed shape, complexity, and composition which will inform regional risk assessments and provide insights into biodiversity and geodiversity. Full article
(This article belongs to the Special Issue Geological Seafloor Mapping)
Show Figures

Figure 1

17 pages, 7451 KiB  
Article
A Numerical Investigation on Tidally Induced Sediment Transport and Morphological Changes with Changing Sea Level in South-East England
by Nicoletta Leonardi, Xiaorong Li and Iacopo Carnacina
Geosciences 2019, 9(3), 140; https://doi.org/10.3390/geosciences9030140 - 22 Mar 2019
Cited by 3 | Viewed by 3816
Abstract
The impact of tide-induced morphological changes and water level variations on the sediment transport in a tidally dominated system has been investigated using the numerical model Delft3D and South-East England as a test case. The goal of this manuscript is to explore the [...] Read more.
The impact of tide-induced morphological changes and water level variations on the sediment transport in a tidally dominated system has been investigated using the numerical model Delft3D and South-East England as a test case. The goal of this manuscript is to explore the long-term changes in morphology due to sea level rise and the large-scale morphodynamic equilibrium of the South-East England. Our results suggest that the long term (century scale) tidally-induced morphological evolution of the seabed slows down in time and promotes a vanishing net transport across the large scale system. Century-scale morphologically updated simulations show that both morphological changes and net transport values tend to decrease in time as the system attains a dynamic equilibrium configuration. Results further suggest that the presence of a gradual increase in mean sea level accelerates the initial morphological evolution of the system whose morphological rate of change gradually attains, however, same plateau values as in the absence of sea level rise. Given the same base morphology, increasing water levels enhance residual currents and the net transport near the coastline; and vice-versa, decreasing sea levels minimize both residuals and net transport near the coastline. The areas that are more affected by, water level and morphological changes, are the ones where the net transport is the highest. This manuscript explores and allows extending the idea of morphodynamic equilibrium at a regional scale, larger than the one for which this concept has been generally explored i.e., estuarine scale. Full article
Show Figures

Figure 1

30 pages, 4635 KiB  
Article
Subsampling of Regional-Scale Database for improving Multivariate Analysis Interpretation of Groundwater Chemical Evolution and Ion Sources
by Julien Walter, Romain Chesnaux, Damien Gaboury and Vincent Cloutier
Geosciences 2019, 9(3), 139; https://doi.org/10.3390/geosciences9030139 - 21 Mar 2019
Cited by 12 | Viewed by 3767
Abstract
Multivariate statistics are widely and routinely used in the field of hydrogeochemistry. Trace elements, for which numerous samples show concentrations below the detection limit (censored data from a truncated dataset), are removed from the dataset in the multivariate treatment. This study now proposes [...] Read more.
Multivariate statistics are widely and routinely used in the field of hydrogeochemistry. Trace elements, for which numerous samples show concentrations below the detection limit (censored data from a truncated dataset), are removed from the dataset in the multivariate treatment. This study now proposes an approach that consists of avoiding the truncation of the dataset of some critical elements, such as those recognized as sensitive elements regarding human health (fluoride, iron, and manganese). The method aims to reduce the dataset to increase the statistical representativeness of critical elements. This method allows a robust statistical comparison between a regional comprehensive dataset and a subset of this regional database. The results from hierarchical Cluster analysis (HCA) and principal component analysis (PCA) were generated and compared with results from the whole dataset. The proposed approach allowed for improvement in the understanding of the chemical evolution pathways of groundwater. Samples from the subset belong to the same flow line from a statistical point of view, and other samples from the database can then be compared with the samples of the subset and discussed according to their stage of evolution. The results obtained after the introduction of fluoride in the multivariate treatment suggest that dissolved fluoride can be gained either from the interaction of groundwater with marine clays or from the interaction of groundwater with Precambrian bedrock aquifers. The results partly explain why the groundwater chemical background of the region is relatively high in fluoride contents, resulting in frequent excess in regards to drinking water standards. Full article
(This article belongs to the Special Issue Hydrogeochemistry and Groundwater Management)
Show Figures

Figure 1

17 pages, 4298 KiB  
Article
Bench-Scale Experiments on Effects of Pipe Flow and Entrapped Air in Soil Layer on Hillslope Landslides
by Yasutaka Tanaka, Taro Uchida, Hitoshi Nagai and Hikaru Todate
Geosciences 2019, 9(3), 138; https://doi.org/10.3390/geosciences9030138 - 21 Mar 2019
Cited by 3 | Viewed by 3648
Abstract
Soil pipes are commonly found in landslide scarps, and it has been suggested that build-up of pore water pressure due to clogged soil pipes influences landslide initiation. Several researchers have also suggested that entrapped air in the soil layer increases the pore water [...] Read more.
Soil pipes are commonly found in landslide scarps, and it has been suggested that build-up of pore water pressure due to clogged soil pipes influences landslide initiation. Several researchers have also suggested that entrapped air in the soil layer increases the pore water pressure. We carried out bench-scale model experiments to investigate the influence of soil pipes and entrapped air on the build-up of pore water pressure. We installed a water supply system consisting of an artificial rainfall simulator, and used a water supply tank to supply water to the model slope and artificial pipe. We used two types of artificial pipe: A straight pipe, and a confluence of three pipes. Furthermore, we placed a layer of silica sand on top of the model slope to investigate the effect of entrapped air in the soil layer on the build-up of pore water pressure. Silica sand is finer than the sand that we used for the bulk of the model slope. Our results indicate that, although artificial pipes decrease the pore water pressure when the amount of water supplied was smaller than the pipe drainage capacity, the pore water pressure increased when the water supply was too large for the artificial pipe to drain. In particular, the confluence of pipes increased the pore water pressure because the water supply exceeded the drainage capacity. The results also indicate that entrapped air increases the pore water pressure in the area with relatively low drainage capacity, too. Based on these results, we found that although soil pipes can drain a certain amount of water from a soil layer, they can also increase the pore water pressure, and destabilize slopes. Furthermore, entrapped air enhances the trend that the pore water pressure can increase in the area with relatively low drainage capacity, as pore water pressure increases when too much water is supplied, and the artificial pipe cannot drain all of it. Full article
(This article belongs to the Special Issue Mountain Landslides: Monitoring, Modeling, and Mitigation)
Show Figures

Figure 1

20 pages, 4280 KiB  
Article
Appraisal of Temporal Transferability of Cold Region Winter Weather Traffic Models for Major Highway Segments in Alberta Canada
by Hyuk-Jae Roh, Furqan A. Bhat, Prasanta K. Sahu, Satish Sharma, Babak Mehran, Ata M. Khan and Orlando Rodriguez
Geosciences 2019, 9(3), 137; https://doi.org/10.3390/geosciences9030137 - 21 Mar 2019
Cited by 3 | Viewed by 4204
Abstract
This paper evaluates the effect of inclement weather conditions on the travel demand for three classes of vehicles for a primary highway in the province of Alberta, Canada. The demand variables are passenger cars, trucks, and total traffic. It is well known from [...] Read more.
This paper evaluates the effect of inclement weather conditions on the travel demand for three classes of vehicles for a primary highway in the province of Alberta, Canada. The demand variables are passenger cars, trucks, and total traffic. It is well known from previous studies that adverse weather conditions such as low temperatures and heavy snowfall cause variation in traffic flow patterns. A winter weather model, based on the dummy variable regression model, was developed to quantify the variations in traffic volume due to snowfall and temperature changes. To establish the relationships, vehicular data was collected from six weigh-in-motion (WIM) sites, and the weather data associated with the WIM sites was collected from nearby weather stations. The study revealed that the variation in truck traffic, due to inclement weather conditions, was insignificant compared to variation in passenger car traffic. This study also investigated the temporal transferability of the developed winter weather model to test if a model can be applied irrespective of the time when it was developed. In addition, an attempt was made to check if the model coefficients could be optimized differently for different classes of traffic for estimating correct traffic variations. To evaluate transferability, the performance of both dummy variable regression and naive (without dummy variables) models was investigated. The results revealed that the dummy variable regression models show better performance for passenger car traffic and total traffic and naive winter weather models give better results for truck traffic. Full article
(This article belongs to the Special Issue Cryosphere II)
Show Figures

Figure 1

15 pages, 3566 KiB  
Article
Determinants of Flooding and Strategies for Mitigation: Two-Year Case Study of Benin City
by Giuseppe T. Cirella, Felix O. Iyalomhe and Paul O. Adekola
Geosciences 2019, 9(3), 136; https://doi.org/10.3390/geosciences9030136 - 21 Mar 2019
Cited by 17 | Viewed by 8113
Abstract
Recent flood disasters in Benin City, Nigeria have claimed a number of lives, damaged property, and threatened the overall livelihood of residents. The economic burden of such events has forced a vast reallocation of monetary resources for clean-up and recovery, as well as [...] Read more.
Recent flood disasters in Benin City, Nigeria have claimed a number of lives, damaged property, and threatened the overall livelihood of residents. The economic burden of such events has forced a vast reallocation of monetary resources for clean-up and recovery, as well as forcibly altered and suspended internal trade via devastated transportation routes. Secondary trends include inflation and migration concerns. As a result, the aim has been to prioritize mitigation by examining easily read, rapidly accessible flood hazard maps, as well as assess and identify areas within the city prone to flooding. We used a number of data sources and conducted a questionnaire surveying three of the local government areas of Benin City over a two-year period. Findings indicate excessive unsustainable land use and land cover change and a flat and high water table area with close proximity to the Atlantic Ocean make the city susceptible to flood risk. Heavy rainfall and drainage system blockage are leading causes of flooding which have destroyed property and houses—two major side effects. A number of mitigation and disaster risk reduction measures were, hereafter, recommended to reduce flooding occurrence in Benin City or lessen its effects on inhabitants. Full article
(This article belongs to the Section Natural Hazards)
Show Figures

Figure 1

23 pages, 6990 KiB  
Article
Northern Hemisphere Snow-Cover Trends (1967–2018): A Comparison between Climate Models and Observations
by Ronan Connolly, Michael Connolly, Willie Soon, David R. Legates, Rodolfo Gustavo Cionco and Víctor. M. Velasco Herrera
Geosciences 2019, 9(3), 135; https://doi.org/10.3390/geosciences9030135 - 20 Mar 2019
Cited by 28 | Viewed by 14551
Abstract
Observed changes in Northern Hemisphere snow cover from satellite records were compared to those predicted by all available Coupled Model Intercomparison Project Phase 5 (“CMIP5”) climate models over the duration of the satellite’s records, i.e., 1967–2018. A total of 196 climate model runs [...] Read more.
Observed changes in Northern Hemisphere snow cover from satellite records were compared to those predicted by all available Coupled Model Intercomparison Project Phase 5 (“CMIP5”) climate models over the duration of the satellite’s records, i.e., 1967–2018. A total of 196 climate model runs were analyzed (taken from 24 climate models). Separate analyses were conducted for the annual averages and for each of the seasons (winter, spring, summer, and autumn/fall). A longer record (1922–2018) for the spring season which combines ground-based measurements with satellite measurements was also compared to the model outputs. The climate models were found to poorly explain the observed trends. While the models suggest snow cover should have steadily decreased for all four seasons, only spring and summer exhibited a long-term decrease, and the pattern of the observed decreases for these seasons was quite different from the modelled predictions. Moreover, the observed trends for autumn and winter suggest a long-term increase, although these trends were not statistically significant. Possible explanations for the poor performance of the climate models are discussed. Full article
(This article belongs to the Special Issue Cryosphere II)
Show Figures

Figure 1

17 pages, 8178 KiB  
Article
Evidences for Paleo-Gas Hydrate Occurrence: What We Can Infer for the Miocene of the Northern Apennines (Italy)
by Claudio Argentino, Stefano Conti, Chiara Fioroni and Daniela Fontana
Geosciences 2019, 9(3), 134; https://doi.org/10.3390/geosciences9030134 - 20 Mar 2019
Cited by 19 | Viewed by 3984
Abstract
The occurrence of seep-carbonates associated with shallow gas hydrates is increasingly documented in modern continental margins but in fossil sediments the recognition of gas hydrates is still challenging for the lack of unequivocal proxies. Here, we combined multiple field and geochemical indicators for [...] Read more.
The occurrence of seep-carbonates associated with shallow gas hydrates is increasingly documented in modern continental margins but in fossil sediments the recognition of gas hydrates is still challenging for the lack of unequivocal proxies. Here, we combined multiple field and geochemical indicators for paleo-gas hydrate occurrence based on present-day analogues to investigate fossil seeps located in the northern Apennines. We recognized clathrite-like structures such as thin-layered, spongy and vuggy textures and microbreccias. Non-gravitational cementation fabrics and pinch-out terminations in cavities within the seep-carbonate deposits are ascribed to irregularly oriented dissociation of gas hydrates. Additional evidences for paleo-gas hydrates are provided by the large dimensions of seep-carbonate masses and by the association with sedimentary instability in the host sediments. We report heavy oxygen isotopic values in the examined seep-carbonates up to +6‰ that are indicative of a contribution of isotopically heavier fluids released by gas hydrate decomposition. The calculation of the stability field of methane hydrates for the northern Apennine wedge-foredeep system during the Miocene indicated the potential occurrence of shallow gas hydrates in the upper few tens of meters of sedimentary column. Full article
(This article belongs to the Special Issue Gas Hydrate: Environmental and Climate Impacts)
Show Figures

Figure 1

7 pages, 1758 KiB  
Article
Modelling External Magnetic Fields of Magnetite Particles: From Micro- to Macro-Scale
by Jiangang Ku, Miguel A. Valdez-Grijalva, Rongdong Deng, Weiran Zuo, Qidi Chen, Hua Lin and Adrian R. Muxworthy
Geosciences 2019, 9(3), 133; https://doi.org/10.3390/geosciences9030133 - 19 Mar 2019
Cited by 3 | Viewed by 3103
Abstract
We determine the role of particle shape in the type of magnetic extraction processes used in mining. We use a micromagnetic finite element method (FEM) to analyze the effect of external magnetic fields on the magnetic structures of sub-micron magnetite particles. In non-saturating [...] Read more.
We determine the role of particle shape in the type of magnetic extraction processes used in mining. We use a micromagnetic finite element method (FEM) to analyze the effect of external magnetic fields on the magnetic structures of sub-micron magnetite particles. In non-saturating fields, the magnetite particles contain multiple possible non-uniform magnetization states. The non-uniformity was found to gradually disappear with increasing applied field strength; at 100 mT the domain structure became near uniform; at 300 mT the magnetic structure saturates and the magnetization direction aligned with the field. In magnetic separation techniques, we suggest that 100 mT is the optimal field for magnetite to maximize the magnetic field with the lowest energy transfer; larger particles, i.e., >1 µm, will likely saturate in smaller fields than this. We also examined the effect of external magnetic fields on a much larger irregular particle (L × W × H = 179.5 × 113 × 103 μm) that was too large to be examined using micromagnetics. To do this we used COMSOL. The results show the relative difference between the magnitude of magnetic flux density of the particle and that of a corresponding sphere of the same volume is <5% when the distance to the particle geometry center is more than five times the sphere radius. The ideas developed in this paper have the potential to improve magnetic mineral extraction yield. Full article
Show Figures

Figure 1

23 pages, 12583 KiB  
Article
GPR Imaging for Deeply Buried Objects: A Comparative Study Based on Compositing of Scanning Frequencies and a Chirp Excitation Function
by Roger Tilley, Hamid R. Sadjadpour and Farid Dowla
Geosciences 2019, 9(3), 132; https://doi.org/10.3390/geosciences9030132 - 18 Mar 2019
Cited by 1 | Viewed by 3755
Abstract
Compositing of ground penetrating radar (GPR) scans of differing frequencies have been found to produce cleaner images at depth using the Gaussian mixture model (GMM) feature of the expectation-maximization (EM) algorithm. GPR scans at various heights (“Stand Off”), as well as ground-based scans, [...] Read more.
Compositing of ground penetrating radar (GPR) scans of differing frequencies have been found to produce cleaner images at depth using the Gaussian mixture model (GMM) feature of the expectation-maximization (EM) algorithm. GPR scans at various heights (“Stand Off”), as well as ground-based scans, have been studied. In this paper, we compare the GPR response from a chirp excitation function-based radar with the response from the EM GMM algorithm compositing process, using the same mix of frequencies. A chirp excitation pulse was found to be effective in delineating the defined buried object, but the resulting image is less sharp than the GMM EM method. Full article
(This article belongs to the Special Issue Advances in Ground Penetrating Radar Research)
Show Figures

Figure 1

11 pages, 3708 KiB  
Article
Tropical Cyclone-Induced Hazards Caused by Storm Surges and Large Waves on the Coast of China
by Zai-Jin You
Geosciences 2019, 9(3), 131; https://doi.org/10.3390/geosciences9030131 - 18 Mar 2019
Cited by 7 | Viewed by 5031
Abstract
The mainland coast of China is about 18,000 km long and houses about 70% of China’s largest cities and 50% of its population. For the last few decades, the rapid growth of the Chinese economy has resulted in extensive development of the coastal [...] Read more.
The mainland coast of China is about 18,000 km long and houses about 70% of China’s largest cities and 50% of its population. For the last few decades, the rapid growth of the Chinese economy has resulted in extensive development of the coastal infrastructure and property, large-scale expansion of coastal ports, excessive reclamation of coastal land, and a significant increase in the coastal population. Previous studies have indicated that tropical cyclones (TCs) have struck the coast of China at a higher frequency and intensity, and TC-induced coastal hazards have resulted in heavy human losses and huge losses to the Chinese coastal economy. In analyzing the long-term and most recent coastal hazard data collected on the coast of China, this study has found that TC-induced storm surges are responsible for 88% of the direct coastal economic losses, while TC-induced large coastal waves have caused heavy loss of human lives, and that the hazard-caused losses are shown to increase spatially from the north to south, peak in the southern coastal sector, and well correlate to storm wave energy flux. The frequency and intensity of coastal hazards on the coast of China are expected to increase in response to future changing TC conditions and rising sea levels. A simple two-parameter conceptual model is also presented for the assessment of coastal inundation and erosion hazards on the coast of China. Full article
(This article belongs to the Special Issue Marine Geohazards: New Insights and Perspectives)
Show Figures

Figure 1

20 pages, 5787 KiB  
Article
Geoscience Methods in Real Estate Market Analyses Subjectivity Decrease
by Malgorzata Renigier-Bilozor, Artur Janowski and Marek Walacik
Geosciences 2019, 9(3), 130; https://doi.org/10.3390/geosciences9030130 - 16 Mar 2019
Cited by 29 | Viewed by 5405
Abstract
Real estate management, including real estate market analysis, is part of a so-called geosystem. In recent years, the popularity of creating various types of systems and automatic solutions in real estate management, including those related to property classification and valuation, has been growing [...] Read more.
Real estate management, including real estate market analysis, is part of a so-called geosystem. In recent years, the popularity of creating various types of systems and automatic solutions in real estate management, including those related to property classification and valuation, has been growing in the world, mainly to reduce the impact of human subjectivity, to increase the scope of analyses and reduce research time. A very important fact that should be underlined is that properties are strongly related to geolocation (space) and strongly determine it. Authors proposed in the paper solutions that highlight implementation of geoscience and “geo-approach” combined with fuzzy logic methods that allow to decrease subjectivity in property analyses and diminish uncertainty in decision making process. The proposed methodology involves three main problematic components of decision support system in property investment analyses development with the use of geo-technologies such as: determination of the database model; elaboration geo-property-zones with geoprocessing activities; identification of homogeneous group of properties transactions. The influence of spatial decision factor determined in the study lead to objective and precise calculation of value differentiation from 22 to 43% depending on the property’s remoteness to the sea. Full article
(This article belongs to the Special Issue Geodesy and Geomatics Engineering)
Show Figures

Figure 1

30 pages, 21766 KiB  
Article
Cross-Country Assessment of H-SAF Snow Products by Sentinel-2 Imagery Validated against In-Situ Observations and Webcam Photography
by Gaia Piazzi, Cemal Melih Tanis, Semih Kuter, Burak Simsek, Silvia Puca, Alexander Toniazzo, Matias Takala, Zuhal Akyürek, Simone Gabellani and Ali Nadir Arslan
Geosciences 2019, 9(3), 129; https://doi.org/10.3390/geosciences9030129 - 15 Mar 2019
Cited by 19 | Viewed by 5240
Abstract
Information on snow properties is of critical relevance for a wide range of scientific studies and operational applications, mainly for hydrological purposes. However, the ground-based monitoring of snow dynamics is a challenging task, especially over complex topography and under harsh environmental conditions. Remote [...] Read more.
Information on snow properties is of critical relevance for a wide range of scientific studies and operational applications, mainly for hydrological purposes. However, the ground-based monitoring of snow dynamics is a challenging task, especially over complex topography and under harsh environmental conditions. Remote sensing is a powerful resource providing snow observations at a large scale. This study addresses the potential of using Sentinel-2 high-resolution imagery to assess moderate-resolution snow products, namely H10—Snow detection (SN-OBS-1) and H12—Effective snow cover (SN-OBS-3) supplied by the Satellite Application Facility on Support to Operational Hydrology and Water Management (H-SAF) project of the European Organisation for the Exploitation of Meteorological Satellites (EUMETSAT). With the aim of investigating the reliability of reference data, the consistency of Sentinel-2 observations is evaluated against both in-situ snow measurements and webcam digital imagery. The study area encompasses three different regions, located in Finland, the Italian Alps and Turkey, to comprehensively analyze the selected satellite products over both mountainous and flat areas having different snow seasonality. The results over the winter seasons 2016/17 and 2017/18 show a satisfying agreement between Sentinel-2 data and ground-based observations, both in terms of snow extent and fractional snow cover. H-SAF products prove to be consistent with the high-resolution imagery, especially over flat areas. Indeed, while vegetation only slightly affects the detection of snow cover, the complex topography more strongly impacts product performances. Full article
(This article belongs to the Special Issue Remote Sensing of Snow and Its Applications)
Show Figures

Figure 1

18 pages, 6054 KiB  
Article
Carbonate Neoformations on Modern Buildings and Engineering Structures in Tyumen City, Russia: Structural Features and Development Factors
by Andrey Novoselov, Alexandr Konstantinov, Lyubov Leonova, Bulat Soktoev and Sergey Morgalev
Geosciences 2019, 9(3), 128; https://doi.org/10.3390/geosciences9030128 - 14 Mar 2019
Cited by 5 | Viewed by 3215
Abstract
The paper presents the results of studying the development of calcite neoformations on the surfaces of modern buildings within the city of Tyumen. The objects of the study were carbonate crusts and stalactite-like bodies formed on the surfaces of five representative buildings in [...] Read more.
The paper presents the results of studying the development of calcite neoformations on the surfaces of modern buildings within the city of Tyumen. The objects of the study were carbonate crusts and stalactite-like bodies formed on the surfaces of five representative buildings in the city center. Research methods included visual diagnostics, optical microscopy, scanning electron microscopy with energy dispersive X-ray spectroscopy, confocal laser scanning microscopy and semi-quantitative determination of the mineral composition by X-ray diffraction analysis. The results of the study show that calcite is the main component of all carbonate crusts, while other minerals were found in small quantities. The microscopic studies revealed the differences in morphology of crusts developing on horizontal and vertical surfaces. The mycelium of fungi (presumably of the Penicillium group), represented by filamentous and often hollow hyphae covered with calcite, as well as relics of bacterial colonies were found in all studied samples. It was noted that the mycelium forms the structural frame of carbonate crusts and stalactites. Studies have shown that the prokaryotic–eukaryotic communities are responsible for the high rate of the urban speleothem growth and play the main role in calcite precipitation at the initial stages of their development. Full article
(This article belongs to the Special Issue Geoscience of the Built Environment 2019 Edition)
Show Figures

Figure 1

22 pages, 5982 KiB  
Concept Paper
Risk-Based Early Warning System for Pluvial Flash Floods: Approaches and Foundations
by Julian Hofmann and Holger Schüttrumpf
Geosciences 2019, 9(3), 127; https://doi.org/10.3390/geosciences9030127 - 14 Mar 2019
Cited by 39 | Viewed by 14374
Abstract
In times of increasing weather extremes and expanding vulnerable cities, a significant risk to civilian security is posed by heavy rainfall induced flash floods. In contrast to river floods, pluvial flash floods can occur anytime, anywhere and vary enormously due to both terrain [...] Read more.
In times of increasing weather extremes and expanding vulnerable cities, a significant risk to civilian security is posed by heavy rainfall induced flash floods. In contrast to river floods, pluvial flash floods can occur anytime, anywhere and vary enormously due to both terrain and climate factors. Current early warning systems (EWS) are based largely on measuring rainfall intensity or monitoring water levels, whereby the real danger due to urban torrential floods is just as insufficiently considered as the vulnerability of the physical infrastructure. For this reason, this article presents a concept for a risk-based EWS as one integral component of a multi-functional pluvial flood information system (MPFIS). Taking both the pluvial flood hazard as well as the damage potential into account, the EWS identifies the urban areas particularly affected by a forecasted heavy rainfall event and issues object-precise warnings in real-time. Further, the MPFIS performs a georeferenced documentation of occurred events as well as a systematic risk analysis, which at the same time forms the foundation of the proposed EWS. Based on a case study in the German city of Aachen and the event of 29 May 2018, the operation principle of the integrated information system is illustrated. Full article
(This article belongs to the Special Issue River, Urban, and Coastal Flood Risk)
Show Figures

Figure 1

19 pages, 8012 KiB  
Article
Multispectral Multibeam Echo Sounder Backscatter as a Tool for Improved Seafloor Characterization
by Craig J. Brown, Jonathan Beaudoin, Mike Brissette and Vicki Gazzola
Geosciences 2019, 9(3), 126; https://doi.org/10.3390/geosciences9030126 - 12 Mar 2019
Cited by 73 | Viewed by 13732
Abstract
The establishment of multibeam echosounders (MBES), as a mainstream tool in ocean mapping, has facilitated integrative approaches towards nautical charting, benthic habitat mapping, and seafloor geotechnical surveys. The combined acoustic response of the seabed and the subsurface can vary with MBES operating frequency. [...] Read more.
The establishment of multibeam echosounders (MBES), as a mainstream tool in ocean mapping, has facilitated integrative approaches towards nautical charting, benthic habitat mapping, and seafloor geotechnical surveys. The combined acoustic response of the seabed and the subsurface can vary with MBES operating frequency. At worst, this can make for difficulties in merging the results from different mapping systems or mapping campaigns. However, at best, having observations of the same seafloor at different acoustic wavelengths allows for increased discriminatory power in seabed classification and characterization efforts. Here, we present the results from trials of a multispectral multibeam system (R2Sonic 2026 MBES, manufactured by R2Sonic, LLC, Austin, TX, USA) in the Bedford Basin, Nova Scotia. In this system, the frequency can be modified on a ping-by-ping basis, which can provide multi-spectral acoustic measurements with a single pass of the survey platform. The surveys were conducted at three operating frequencies (100, 200, and 400 kHz), and the resulting backscatter mosaics revealed differences in parts of the survey area between the frequencies. Ground validation surveys using a combination of underwater video transects and benthic grab and core sampling confirmed that these differences were due to coarse, dredge spoil material underlying a surface cover of mud. These innovations offer tremendous potential for application in the area of seafloor geological and benthic habitat mapping. Full article
(This article belongs to the Special Issue Geological Seafloor Mapping)
Show Figures

Figure 1

16 pages, 5787 KiB  
Article
Numerical Simulation of Morphological Changes due to the 2004 Tsunami Wave around Banda Aceh, Indonesia
by Teuku Muhammad Rasyif, Shigeru Kato, Syamsidik and Takumi Okabe
Geosciences 2019, 9(3), 125; https://doi.org/10.3390/geosciences9030125 - 12 Mar 2019
Cited by 13 | Viewed by 5977
Abstract
The 2004 Indian Ocean tsunami caused massive morphological changes around the coast of Sumatra, Indonesia. This research investigates the coastal morphological changes in the Banda Aceh area via coupling a hydrodynamic model with a sediment transport module. The Cornell Multigrid Coupled Tsunami Model [...] Read more.
The 2004 Indian Ocean tsunami caused massive morphological changes around the coast of Sumatra, Indonesia. This research investigates the coastal morphological changes in the Banda Aceh area via coupling a hydrodynamic model with a sediment transport module. The Cornell Multigrid Coupled Tsunami Model (COMCOT) was coupled with the XBeach Model to simultaneously simulate sediment transport and the hydrodynamic process during the tsunami. The coupled model is known as COMCOT-SED. Field bathymetric data measured in 2006 were used to validate the coupled model. This study reveals that the tsunami’s impact was more severe on the eastern part of the coast, where it hit directly. Meanwhile, the western part of the coast suffered a lower impact because of the sheltering effects from a series of small islands and a headland to the north. This study has shown that the model results from COMCOT-SED are consistent with field data and show where the tsunami waves caused offshore erosion. Full article
(This article belongs to the Special Issue Interdisciplinary Geosciences Perspectives of Tsunami Volume 2)
Show Figures

Figure 1

32 pages, 14760 KiB  
Article
Sentinel-1 for Monitoring Land Subsidence of Coastal Cities in Africa Using PSInSAR: A Methodology Based on the Integration of SNAP and StaMPS
by Fabio Cian, José Manuel Delgado Blasco and Lorenzo Carrera
Geosciences 2019, 9(3), 124; https://doi.org/10.3390/geosciences9030124 - 12 Mar 2019
Cited by 66 | Viewed by 12892
Abstract
The sub-Saharan African coast is experiencing fast-growing urbanization, particularly around major cities. This threatens the equilibrium of the socio-ecosystems where they are located and on which they depend: underground water resources are exploited with a disregard for sustainability; land is reclaimed from wetlands [...] Read more.
The sub-Saharan African coast is experiencing fast-growing urbanization, particularly around major cities. This threatens the equilibrium of the socio-ecosystems where they are located and on which they depend: underground water resources are exploited with a disregard for sustainability; land is reclaimed from wetlands or lagoons; built-up areas, both formal and informal, grow without adequate urban planning. Together, all these forces can result in land surface deformation, subsidence or even uplift, which can increase risk within these already fragile socio-ecosystems. In particular, in the case of land subsidence, the risk of urban flooding can increase significantly, also considering the contribution of sea level rise driven by climate change. Monitoring such fast-changing environments is crucial to be able to identify key risks and plan adaptation responses to mitigate current and future flood risks. Persistent scatterer interferometry (PSI) with synthetic aperture radar (SAR) is a powerful tool to monitor land deformation with high precision using relatively low-cost technology, also thanks to the open access data of Sentinel-1, which provides global observations every 6 days at 20-m ground resolution. In this paper, we demonstrate how it is possible to monitor land subsidence in urban coastal areas by means of permanent scatterer interferometry and Sentinel-1, exploiting an automatic procedure based on an integration of the Sentinel Application Platform (SNAP) and the Stanford Method for Persistent Scatterers (StaMPS). We present the results of PSI analysis over the cities of Banjul (the Gambia) and Lagos (Nigeria) showing a comparison of results obtained with TerraSAR-X, Constellation of Small Satellites for the Mediterranean Basin Observation (COSMO-SkyMed) and Environmental Satellite advanced synthetic aperture radar (Envisat-ASAR) data. The methodology allows us to highlight areas of high land deformation, information that is useful for urban development, disaster risk management and climate adaptation planning. Full article
(This article belongs to the Special Issue River, Urban, and Coastal Flood Risk)
Show Figures

Figure 1

20 pages, 33857 KiB  
Article
High Resolution Satellite Images for Instantaneous Shoreline Extraction Using New Enhancement Algorithms
by Donatella Dominici, Sara Zollini, Maria Alicandro, Francesca Della Torre, Paolo Massimo Buscema and Valerio Baiocchi
Geosciences 2019, 9(3), 123; https://doi.org/10.3390/geosciences9030123 - 11 Mar 2019
Cited by 29 | Viewed by 6396
Abstract
Knowledge of a territory is an essential element in any future planning action and in appropriate territorial and environmental requalification action planning. The current large-scale availability of satellite data, thanks to very high resolution images, provides professional users in the environmental, urban planning, [...] Read more.
Knowledge of a territory is an essential element in any future planning action and in appropriate territorial and environmental requalification action planning. The current large-scale availability of satellite data, thanks to very high resolution images, provides professional users in the environmental, urban planning, engineering, and territorial government sectors, in general, with large amounts of useful data with which to monitor the territory and cultural heritage. Italy is experiencing environmental emergencies, and coastal erosion is one of the greatest threats, not only to the Italian heritage and economy, but also to human life. The aim of this paper is to find a rapid way of identifying the instantaneous shoreline. This possibility could help government institutions such as regions, civil protection, etc., to analyze large areas of land quickly. The focus is on instantaneous shoreline extraction in Ortona (CH, Italy), without considering tides, using WorldView-2 satellite images (50-cm resolution in panchromatic and 2 m in multispectral). In particular, the main purpose of this paper is to compare commercial software and ACM filters to test their effectiveness. Full article
Show Figures

Figure 1

31 pages, 37496 KiB  
Article
Morphostructural, Meteorological and Seismic Factors Controlling Landslides in Weak Rocks: The Case Studies of Castelnuovo and Ponzano (North East Abruzzo, Central Italy)
by Monia Calista, Enrico Miccadei, Tommaso Piacentini and Nicola Sciarra
Geosciences 2019, 9(3), 122; https://doi.org/10.3390/geosciences9030122 - 9 Mar 2019
Cited by 29 | Viewed by 7061
Abstract
We investigated the role of the morphostructural setting and seismic and meteorological factors in the development of landslides in the piedmont of the Abruzzo Apennines. In February 2017, following a heavy snow precipitation event and a moderate seismic sequence (at the end of [...] Read more.
We investigated the role of the morphostructural setting and seismic and meteorological factors in the development of landslides in the piedmont of the Abruzzo Apennines. In February 2017, following a heavy snow precipitation event and a moderate seismic sequence (at the end of the Central Italy 2016–2017 seismic crisis), several landslides affected the NE-Abruzzo chain and piedmont area. This work is focused on the Ponzano landslide (Civitella del Tronto, Teramo) and the Castelnuovo landslide (Campli, Teramo) in the NE Abruzzo hilly piedmont. These landslides consist of: (1) a large translational slide-complex landslide, affecting the Miocene–Pliocene sandstone clay bedrock sequence of the piedmont hilly sector; and (2) a complex (topple/fall-slide) landslide, which occurred along a high and steep scarp on conglomerate rocks pertaining to terraced alluvial fan deposits of the Pleistocene superficial deposits. Both of the landslides are typical of the Abruzzo hilly piedmont and both of them largely affected houses and villages located on top of the scarp or within the slope. The landslides were studied by means of field geological and geomorphological mapping, borehole investigations, geostructural analysis and photogeological analysis. For the Ponzano landslide, a detail pre-post-landslide air photo interpretation allowed for defining the deformation pattern occurred on the slope. For the Castelnuovo landslide, the triggering factors and the stability of the slope were evaluated with FLAC3D numerical modelling, in pre- and post-landslide conditions. Through this integrated analysis, the triggering factors, the landslide mechanism and the stability conditions of the landslides and the characterization of two main types of landslides affecting the piedmont hilly area of the Abruzzo region were investigated. Full article
(This article belongs to the Special Issue Mountain Landslides: Monitoring, Modeling, and Mitigation)
Show Figures

Figure 1

28 pages, 7211 KiB  
Article
Nanoscale Observations Support the Importance of Chemical Processes in Rock Decay and Rock Coating Development in Cold Climates
by Ronald I. Dorn and David H. Krinsley
Geosciences 2019, 9(3), 121; https://doi.org/10.3390/geosciences9030121 - 9 Mar 2019
Cited by 10 | Viewed by 3895
Abstract
Conventional scholarship long held that rock fracturing from physical processes dominates over chemical rock decay processes in cold climates. The paradigm of the supremacy of cold-climate shattering was questioned by Rapp’s discovery (1960) that the flux of dissolved solids leaving a Kärkevagge, Swedish [...] Read more.
Conventional scholarship long held that rock fracturing from physical processes dominates over chemical rock decay processes in cold climates. The paradigm of the supremacy of cold-climate shattering was questioned by Rapp’s discovery (1960) that the flux of dissolved solids leaving a Kärkevagge, Swedish Lapland, watershed exceeded physical denudation processes. Many others since have gone on to document the importance of chemical rock decay in all cold climate landscapes, using a wide variety of analytical approaches. This burgeoning scholarship, however, has only generated a few nanoscale studies. Thus, this paper’s purpose rests in an exploration of the potential for nanoscale research to better understand chemical processes operating on rock surfaces in cold climates. Samples from several Antarctica locations, Greenland, the Tibetan Plateau, and high altitude tropical and mid-latitude mountains all illustrate ubiquitous evidence of chemical decay at the nanoscale, even though the surficial appearance of each landscape is dominated by “bare fresh rock.” With the growing abundance of focused ion beam (FIB) instruments facilitating sample preparation, the hope is that that future rock decay researchers studying cold climates will add nanoscale microscopy to their bag of tools. Full article
Show Figures

Figure 1

21 pages, 5215 KiB  
Article
Simulating 10,000 Years of Erosion to Assess Nuclear Waste Repository Performance
by Adam L. Atchley, Kay H. Birdsell, Kelly Crowell, Richard S. Middleton and Philip H. Stauffer
Geosciences 2019, 9(3), 120; https://doi.org/10.3390/geosciences9030120 - 8 Mar 2019
Cited by 2 | Viewed by 3987
Abstract
Long-term environmental performance assessments of natural processes, including erosion, are critically important for waste repository site evaluation. However, assessing a site’s ability to continuously function is challenging due to parameter uncertainty and compounding nonlinear processes. In lieu of unavailable site data for model [...] Read more.
Long-term environmental performance assessments of natural processes, including erosion, are critically important for waste repository site evaluation. However, assessing a site’s ability to continuously function is challenging due to parameter uncertainty and compounding nonlinear processes. In lieu of unavailable site data for model calibration, we present a workflow to include multiple sources of surrogate data and reduced-order models to validate parameters for a long-term erosion assessment of a low-level radioactive nuclear waste repository. We apply this new workflow to a low-level waste repository on mesas in Los Alamos National Laboratory in New Mexico. To account for parameter uncertainty, we simulate high-, moderate-, and low-erosion cases. The assessment extends to 10,000 years, which results in large erosion uncertainties, but is necessary given the nature of the interred waste. Our long-term erosion analysis shows that high-erosion scenarios produce rounded mesa tops and partially filled canyons, diverging from the moderate-erosion case that results in gullies and sharp mesa rims. Our novel model parameterization workflow and modeling exercise demonstrates the utility of long-term assessments, identifies sources of erosion forecast uncertainty, and demonstrates the utility of landscape evolution model development. We conclude with a discussion on methods to reduce assessment uncertainty and increase model confidence. Full article
(This article belongs to the Special Issue Soil Hydrology and Erosion)
Show Figures

Figure 1

21 pages, 6199 KiB  
Review
Oceanic Impact on European Climate Changes during the Quaternary
by Gloria M. Martin-Garcia
Geosciences 2019, 9(3), 119; https://doi.org/10.3390/geosciences9030119 - 8 Mar 2019
Cited by 7 | Viewed by 6620
Abstract
Integrative studies on paleoclimate variations over oceanic and continental regions are scarce. Though it is known that Earth’s climate is strongly affected by sea-air exchanges of heat and moisture, the role of oceans in climate variations over land remains relatively unexplored. With the [...] Read more.
Integrative studies on paleoclimate variations over oceanic and continental regions are scarce. Though it is known that Earth’s climate is strongly affected by sea-air exchanges of heat and moisture, the role of oceans in climate variations over land remains relatively unexplored. With the aim to unveil this influence, the present work studies major climate oscillations in the North Atlantic region and Europe during the Quaternary, focusing on the oceanic mechanisms that were related to them. During this period, the European climate experienced long-term and wide-amplitude glacial-interglacial oscillations. A covariance between the North Atlantic sea surface temperature and climate signals over the continent is especially observed in Southern Europe. The most severe and drastic climate changes occurred in association to deglaciations, as a consequence of major oceanographic reorganizations that affected atmospheric circulation and ocean-atmosphere heat-flow, which led to variation of temperature and precipitation inland. Most deglaciations began when Northern Hemisphere summer insolation was maximal. Increased heating facilitated the rapid ice-sheet collapse and the massive release of fresh water into the Northern Atlantic, which triggered the weakening or even the shutdown of the North Atlantic Deep Water (NADW) formation. Though the extension of ice-sheets determined the high-latitude European climate, the climate was more influenced by rapid variations of ice volume, deep-water formation rate, and oceanic and atmospheric circulation in middle and subtropical latitudes. In consequence, the coldest stadials in the mid-latitude North Atlantic and Europe since the early Pleistocene coincided with Terminations (glacial/interglacial transitions) and lesser ice-sheet depletions. They were related with decreases in the NADW formation rate that occurred at these times and the subsequent advection of subpolar waters along the western European margin. In Southern Europe, steppe communities substituted temperate forests. Once the freshwater perturbation stopped and the overturning circulation resumed, very rapid and wide-amplitude warming episodes occurred (interstadials). On the continent, raised temperature and precipitations allowed the rapid expansion of moisture-requiring vegetation. Full article
(This article belongs to the Special Issue Ocean-Atmosphere Interaction)
Show Figures

Figure 1

19 pages, 6081 KiB  
Article
Geophysical and Sedimentological Investigations of Peatlands for the Assessment of Lithology and Subsurface Water Pathways
by Julian Trappe and Christof Kneisel
Geosciences 2019, 9(3), 118; https://doi.org/10.3390/geosciences9030118 - 8 Mar 2019
Cited by 11 | Viewed by 4134
Abstract
Peatlands located on slopes (herein called slope bogs) are typical landscape units in the Hunsrueck, a low mountain range in Southwestern Germany. The pathways of the water feeding the slope bogs have not yet been documented and analyzed. The identification of the different [...] Read more.
Peatlands located on slopes (herein called slope bogs) are typical landscape units in the Hunsrueck, a low mountain range in Southwestern Germany. The pathways of the water feeding the slope bogs have not yet been documented and analyzed. The identification of the different mechanisms allowing these peatlands to originate and survive requires a better understanding of the subsurface lithology and hydrogeology. Hence, we applied a multi-method approach to two case study sites in order to characterize the subsurface lithology and to image the variable spatio-temporal hydrological conditions. The combination of Electrical Resistivity Tomography (ERT) and an ERT-Monitoring and Ground Penetrating Radar (GPR), in conjunction with direct methods and data (borehole drilling and meteorological data), allowed us to gain deeper insights into the subsurface characteristics and dynamics of the peatlands and their catchment area. The precipitation influences the hydrology of the peatlands as well as the interflow in the subsurface. Especially, the geoelectrical monitoring data, in combination with the precipitation and temperature data, indicate that there are several forces driving the hydrology and hydrogeology of the peatlands. While the water content of the uppermost layers changes with the weather conditions, the bottom layer seems to be more stable and changes to a lesser extent. At the selected case study sites, small differences in subsurface properties can have a huge impact on the subsurface hydrogeology and the water paths. Based on the collected data, conceptual models have been deduced for the two case study sites. Full article
Show Figures

Figure 1

19 pages, 20913 KiB  
Article
Identification of Micro-Scale Landforms of Landslides Using Precise Digital Elevation Models
by František Chudý, Martina Slámová, Julián Tomaštík, Roberta Prokešová and Martin Mokroš
Geosciences 2019, 9(3), 117; https://doi.org/10.3390/geosciences9030117 - 7 Mar 2019
Cited by 23 | Viewed by 5850
Abstract
An active gully-related landslide system is located in a deep valley under forest canopy cover. Generally, point clouds from forested areas have a lack of data connectivity, and optical parameters of scanning cameras lead to different densities of point clouds. Data noise or [...] Read more.
An active gully-related landslide system is located in a deep valley under forest canopy cover. Generally, point clouds from forested areas have a lack of data connectivity, and optical parameters of scanning cameras lead to different densities of point clouds. Data noise or systematic errors (missing data) make the automatic identification of landforms under tree canopy problematic or impossible. We processed, analyzed, and interpreted data from a large-scale landslide survey, which were acquired by the light detection and ranging (LiDAR) technology, remotely piloted aircraft system (RPAS), and close-range photogrammetry (CRP) using the ‘Structure-from-Motion’ (SfM) method. LAStools is a highly efficient Geographic Information System (GIS) tool for point clouds pre-processing and creating precise digital elevation models (DEMs). The main landslide body and its landforms indicating the landslide activity were detected and delineated in DEM-derivatives. Identification of micro-scale landforms in precise DEMs at large scales allow the monitoring and the assessment of these active parts of landslides that are invisible in digital terrain models at smaller scales (obtained from aerial LiDAR or from RPAS) due to insufficient data density or the presence of many data gaps. Full article
(This article belongs to the Special Issue Mountain Landslides: Monitoring, Modeling, and Mitigation)
Show Figures

Figure 1

15 pages, 4493 KiB  
Article
Prospectivity Mapping for Epithermal Deposits of Western Milos Using a Fuzzy Multi Criteria Evaluation Approach Parameterized by Airborne Hyperspectral Remote Sensing Data
by Graham Ferrier, Athanassios Ganas, Richard Pope and A. Jo Miles
Geosciences 2019, 9(3), 116; https://doi.org/10.3390/geosciences9030116 - 7 Mar 2019
Cited by 3 | Viewed by 5020
Abstract
A Mineral prospectivity mapping (MPM) approach using a GIS-based weighted linear combination implementation of a Multi-Criteria Evaluation approach utilising a fuzzy Analytical Hierarchy Process to elucidate expert knowledge has been implemented to analyse the spatial distribution of epithermal deposits on the Island of [...] Read more.
A Mineral prospectivity mapping (MPM) approach using a GIS-based weighted linear combination implementation of a Multi-Criteria Evaluation approach utilising a fuzzy Analytical Hierarchy Process to elucidate expert knowledge has been implemented to analyse the spatial distribution of epithermal deposits on the Island of Milos, Greece and model their association with exploration evidence data with the aim of providing insights into the controls on ore deposition. An integrated field and Digital Airborne Imaging Spectrometer (DAIS) hyperspectral and thermal multispectral airborne remote sensing dataset supported by field mapping and laboratory analyses, has been utilised to resolve hydrothermal alteration and parameterise the MPM. This study has highlighted the intimate spatial relationship between topographic highs and locations with high grade silicified alteration at a number of locations. The ability of high spatial resolution multispectral Thermal InfraRed (TIR) remote sensing imagery, integrated with topographic data, to resolve these silicified topographic highs provides an additional tool in the exploration of epithermal deposits. The spatial relationships between silicified lithocaps, high-grade altered rocks, faulting and topographic highs were utilised in the development of the MPM model. A close association between the modelled results and the hydrothermal alteration mapped in the field supports the accuracy of this MPM approach. Full article
(This article belongs to the Special Issue Magmatic-Hydrothermal Ore Deposits)
Show Figures

Figure 1

Previous Issue
Next Issue
Back to TopTop