Article

Enhancement Effects of the Terahertz Near-Field Microscopy

1
Chongqing Key Laboratory of Multi-scale Manufacturing Technology, Chongqing Institute of Green and Intelligent Technology, Chinese Academy of Sciences, Chongqing 400714, China
2
College of Instrumentation Science and Electrical Engineering, Jilin University, Changchun 130061, China
*
Authors to whom correspondence should be addressed.
These authors contributed equally to this work.
Appl. Sci. 2015, 5(4), 1745-1755; https://doi.org/10.3390/app5041745
Submission received: 12 October 2015 / Revised: 3 December 2015 / Accepted: 8 December 2015 / Published: 11 December 2015
(This article belongs to the Special Issue Frontiers in Terahertz Science and Technology)

Abstract

:
Terahertz near-field detection based and imaging on a nanotip has drawn wide attention following extensive applications of terahertz imaging technologies. Through the local enhanced electric field created by a terahertz nanotip in the near field, it is very likely to attain superior detection sensitivity and higher spatial resolution. This paper simulates the local enhancement effects of the terahertz near-field microscopy using a two-dimension finite difference time domain (2D-FDTD) method. Factors that influence the enhancement effects are investigated and analyzed in detail. Simulation results show that the size of the nanotip apex, the apex-substrate distance, dielectric properties of the substrate and the detected sample, etc., have significant impacts on the electric field enhancement and spatial resolution of the terahertz near-field nanotip, which can be explained from the effective polarizability of the nanotip-sample/substrate system.

Graphical Abstract

1. Introduction

Since the photon energy of terahertz (THz) radiation (1 THz ~ 4 meV) largely coincides with that of the biomolecular low-frequency motions including vibration, rotation and translation of the molecular skeleton and that of the weak intermolecular interactions including hydrogen-bond and van der Waals attraction, etc., THz technology has its unique advantages in spectroscopy detection and spectral imaging of biological systems, semiconductors, composite materials, etc. [1]. Due to the diffraction limit, however, the spatial resolution of conventional THz imaging is limited to about λ/2, where λ is the wavelength of THz wave, with λ 300 μm at 1 THz, which limited THz imaging of micro/nano-scale objects such as semiconductor devices, cells and biomacromolecules, etc.
Recently, scanning near-field optical microscopy has been widely used in high-resolution imaging, spectroscopy detection and nanotechnology [2,3]. There are modalities of two scanning near-field microscopy based on this goal: transmission-type and scattering-type [4]. The transmission-type microscopy uses a sub-wavelength aperture to restrict the size of the light source or to receive evanescent wave signals of the sample in a distance far less than the excitation wavelength, either of which may realize sub-wavelength resolution. Unfortunately, it failed in effectively recognizing the microscopic characteristics of materials since its low transmission and low frequency filtering properties limit the optical resolution to about λ/10 [5,6,7]. While the scattering-type scanning near-field optical microscopy (S-SNOM) which is based on a metal nanotip to confine free-space propagating light into the enhanced electric field around the apex of the nanotip, and to simultaneously scatter the near-field signal of sample to the far-field, has obtained fingerprint characteristics of molecules in a nanometer spatial resolution [8,9].
The spatial resolution and detection sensitivity of the S-SNOM is mainly determined by the shape, geometric size, dielectric properties of the nanotip and substrate materials. The relevant factors of the nanotip-substrate system on S-SNOM operated in visible and infrared regions were investigated in-depth both experimentally and theoretically [10,11]. With the development of effective THz sources and THz detectors, the first S-SNOM setup for the THz region was built in 2003 and a spatial resolution of 150 nm was achieved [12]. Wächter et al. [13] applied a tapered photoconductive nanotip to obtain a 10 μm resolution for imaging the metallic ring resonator at 2.0 THz. Huber et al. [3] performed the THz near-field spectral imaging of a semiconductor transistor which precisely distinguished the interior nano-scale parts in a single semiconductor transistor such as the drain, source and grid electrodes with an imaging resolution of 40 nm, and found the S-SNOM in THz region was more sensitivity for detecting mobile carriers in a semiconductor than that in the infrared region. About the enhancement mechanism of the THz near-field microscopy, Masson et al. [14] used the aperture-based THz near-field microscopy to study the interaction between the probe and a sample under the THz radiation and found there were two near field regions in which the sample had different effects on the probe. Kurihara et al. [15] found the high dielectric constant sintered bariumferrite (BaFe12O19) ceramic probe had approximately same scattering efficiency and field enhancement and faster temporal response comparing to the metal probe.
Although great efforts have been made for the THz near-field microscopy, the imaging of low refraction index materials like organic molecules and biomolecules is still a challenge. Moreover, the wavelength of THz waves is much longer than those of visible and infrared waves, which means the nanotip will scatter lower near-field signals in THz region in line with the scattering theory. Furthermore, since the surface plasma frequencies of most metals are in the visible or infrared region but not in the THz region, it remains unclear whether this will bring different enhancement effects in THz region when a metal substrate is used in the THz near-field setup. Thus, it is important to figure out the enhanced mechanism of the nanotip-substrate/sample system in the THz region and find out optimal experimental conditions for the THz S-SNOM experiment setup in order to obtain super spatial resolution and high detection sensitivity.
In this paper, using a two-dimension finite difference time domain (2D-FDTD) method, we systematically investigated factors that influence the enhancement effects including geometry of the nanotip, distance between the nanotip apex and the substrate, and dielectric properties of the substrate and detected sample, etc. Influences of these factors on the enhancement effects were analyzed in detail. In particular, different enhancement effects of metal and semiconductor substrates in the THz region were compared and discussed.

2. Simulation Methods

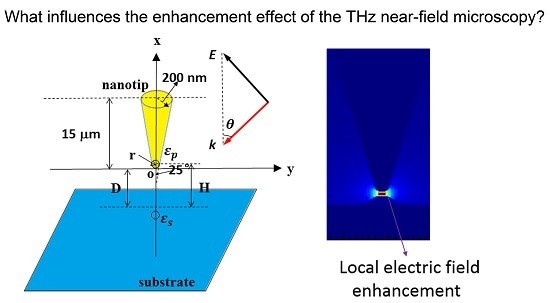
A typical THz near-field model composed of a nanotip and a substrate under the THz plane wave radiation was built and shown in Figure 1. Since the THz near-field model has a planar symmetry and previous 3D simulation in visible and infrared regions had confirmed that the shape of the nanometer light spot generated by the nanotip was spherical [16,17], we performed 2D-FDTD simulations to investigate the enhancement effects of the THz near-field microscopy. The conical nanotip has a radius of 200 nm, a length of 15 μm, and a taper angle of 25°. The substrate has a size of 60 × 120 μm2. The radius of the nanotip apex is r and the distance between the apex and the substrate is D. The p-polarized incident THz plane wave with a frequency of 1.0 THz and an amplitude of E0 (1 V/m) radiates along the nanotip axis with an incident angle of θ = 45° (θ is the angle between the wave vector k and the x-axis). A fine grid size of 2 nm is selected for simulations in a region centered at the center of the nanotip apex with an area of 400 × 400 nm2 to guarantee convergence while conserving computer memory and processing time. Beyond the said region, the grid size is automatically generated.
A tip-sample dipole model proposed by Heilmann et al. [18,19] was widely used for near-field interaction between the sample and the metal nanotip in the visible and infrared frequency bands. The nanotip apex can be assumed to be a polarized sphere (radius r, polarizability α). When an electric field E is implemented, the nanotip will be polarized and a dipole moment will be generated. If the detected sample is a substrate, the polarized nanotip will induce charges on the surface of the substrate and the dipole moment generated by the induced charges can be derived from the image theory. The total electric field of the nanotip-substrate system is a superposition of the incident electric field and the image dipole electric field. Therefore, the effective polarizability of the nanotip-substrate system is derived as:
α eff = α ( 1 + β ) 1 αβ 16 π H 3
Here, H is the distance between the center of the nanotip apex and the substrate with H = D + r. α is the polarizability of the nanotip with:
α = 4 π r 3 ( ε p 1 ) ( ε p + 2 )
and β is the dielectric response function of the substrate with:
β = (εs − 1)/(εs + 1)
where εs, εp are the dielectric constants of the substrate and the nanotip, respectively.
From Equations (1)–(3), we can see that αeff depends on the dielectric constants of the substrate and the nanotip (εs and εp), the radius of the apex of the nanotip, r, and the distance between the apex and the substrate, D.
Figure 1. Model of a terahertz (THz) near-field microscopy composed of a nanotip and a substrate under the THz radiation.
Applsci 05 01745 g001

3. Results and Discussion

3.1. Effect of the Radius of the Apex of the Nanotip

To look into the effect of the radius of the apex on the local electric field around the apex, for the sake of simplicity, the simulation model is a typical model shown in Figure 1 without the substrate. Considering the electrochemical corrosion and focused ion beam etching processes in experiment which can fabricate a tip with a minimum radius of ~10 nm, the radius of the apex in simulation is set from 10 to 50 nm to figure out the influence of the geometry of the nanotip on the detection sensitivity and the electric field distribution character around the apex. A Drude model with εlattice = 9.1, plasma frequency ωp = 1.2 × 10¹⁶ rad/s, scattering rate γ = 1.2 × 10¹⁴ rad/s is used to represent the frequency-dependent dielectric constant of the Au nanotip in terahertz range [20]. First, the distribution of the electric field near the apex of the Au nanotip with a radius of 10 nm is shown in Figure 2a. About 25-fold local electric field enhancement around the apex is observed from Figure 2a. When the radius of the apex increases from 10 to 50 nm, the corresponding maximum electric field amplitude E decreases from 24.9 to 14.3 V/m as seen in Figure 2b. This is consistent with the lightning rod effect that was reported elsewhere [16,21]. As shown in Figure 2c, with the increase of the distance away from the nanotip apex, the electric field amplitude along the x-axis decays rapidly and a good reciprocal square law relation can well fitted the trend. The rapid decrease indicates that the enhanced region of the effective electric field is small and is confined to a region under the apex of the nanotip, only within a nm-scale distance from the tip can the local electric field be effectively enhanced. The electric field distribution along the y-axis (Figure 2d) shows that the full width at half maximum (FWHM) of the nano-scale enhanced THz field focused by the Au nanotip in air increases from 18 to 72 nm when the radius of nanotip increases from 10 to 50 nm. Therefore, the FWHM of nano-scale enhanced terahertz electric field generated by Au nanotip follows closely with the radius of the apex, in marked departure from conventional wisdom based on the optical diffraction limit, where the FWHM is dictated by the wavelength of the radiation.
Figure 2. (a) Electric field distribution on the Au nanotip with a radius of 10 nm; (b) The maximum electric field amplitude E as a function of the radius r of the tip; (c) The electric field distribution along the x-axis and the red line is a reciprocal square law fitting; (d) The electric field distribution along the y-axis and the full width at half maximum (FWHM) is marked with a dash line.
Applsci 05 01745 g002

3.2. Effect of the Metal Substrate

When adding an Au substrate with a size of 60 × 120 μm2 (nearly infinite) under the Au nanotip, the electric field distribution near the nanotip with a substrate is shown in Figure 3a. The relation between E and the apex-substrate distance D is presented in Figure 3b. It can be seen that E rapidly decreases from 715 to 125 V/m when D increases from 4 to 100 nm. At D > 100 nm, E decreases slowly and eventually approximates the case without the substrate. The maximum electric field of the nanotip-substrate model is about 28 times larger than that of the model with only the nanotip. At x = −2 nm, the electric field distribution along the y-axis is shown in Figure 3c. Compared with the case without the substrate, the electric field enhancement has been greatly improved. With the presence of a substrate, the FWHM of electric field along the y-axis improves from 18 nm to 12 nm, which indicates an obviously strong electric field coupling and a better local field enhancement effect. What we can conclude is that the metal substrate will enhance the electric field amplitude and the enhanced electric field decreases with the increase of the apex-substrate distance. The electric filed amplitude of the Au nanotip-Au substrate depends on the incident angle of the THz waves. In our simulations, the maximum electric field amplitude between the substrate and nanotip first increases with the incident angle increasing from 10° to 45°, and then decreases for the incident angle varying from 45° to 80° (see Figure 3d). This result is similar to that observed in TERS study that the total field is the interference of the reflect field and the incident field when a substrate exists [17].
Figure 3. (a) The electric field distribution of Au nanotip-Au substrate; (b) Relation between the maximum electric field amplitude E and the nanotip-substrate distance D. The solid line is for the guide of eyes; (c) The electric field distribution along the y-axis for the Au nanotip-Au substrate system and the FWHM is marked with a dash line; (d) The maximum electric field amplitude E as a function of incident angle θ.
Applsci 05 01745 g003

3.3. Effect of the Dielectric Properties of the Nanotip and Substrate

The enhancement effect depends on the dielectric properties of the nanotip and the substrate according to Equations (1)–(3). Metallic nano/microstructures have long been applied in local plasma resonance enhancement studies in the visible and near-infrared wave bands to promote light-matter interaction, but do not always succeed in the THz wave band, owing to a mismatch of the plasma frequency of the metal and the THz radiation. However, the plasma resonance frequency of semiconductor materials happens to be localized in the THz wave band. The plasma property of semiconductor material makes the electromagnetic coupling with metal tips much stronger [20]. Hence, from the perspective of the tip and substrate materials, metal (Au) and semiconductor (InSb) are introduced in our simulations to observe the signal intensity and compare the spatial resolution.
Two substrate materials are selected in our simulations: Au and InSb, for InSb material εlattice = 15.6, ωp = 46 × 1012 rad/s, scattering ratio γ = 0.3 × 10¹² rad/s [20]. Other parameters are set as follows: r = 10 nm, D = 6 nm. Figure 4a shows the maximum electric field distribution along the x-axis for different nanotip-substrate combinations using different materials. From Figure 4a, we can see that there is a maximum enhancement effect for the InSb nanotip above the InSb substrate, while a minimum enhancement effect for the Au nanotip above the Au substrate. The variation is shown clearly in the inset with a double-logarithmic plot.
The dielectric properties of the nanotip and substrate affect not only the electric field enhancement effect, but also the resonant excitation frequency. From Figure 4b, when Au is used for the nanotip, there is a strong frequency-dependent electric field enhancement observed for Au nanotip above the InSb substrate (black curve in Figure 4b) compared with Au nanotip above an Au substrate (red curve in Figure 4b) at the incident THz wave frequency range from 0.8 to 2.4 THz. The maximum electric field enhancement for Au nanotip above InSb substrate is observed at 1.6 THz. From Equations (1)–(3), the near-field signal will only depend on the dielectric constant of the substrate when the radius of the nanotip apex, the dielectric constant of nanotip and the apex-substrate distance are given. β is the polarization intensity of the substrate and gets its maximum when Re[εs (ω)] = −1. This can be satisfied for InSb substrate at ω = 1.7 THz according to the Drude model, which is in very good agreement with our simulation result of 1.6 THz from Figure 4b, but cannot be satisfied for Au substrate in the entire THz frequency range considered here. Therefore, there is a strong resonance enhancement for Au nanotip above InSb substrate and no resonance enhancement for Au nanotip above the Au substrate. The resonance enhancement stems from the interaction between the THz wave and the substrate, in that the semiconductor InSb supports strongly confined surface plasmons (SPs) in the THz frequency range, and these SPs tend to enhance the requisite light-matter interaction [20].
Figure 4. (a) Relation between the maximum electric field amplitude E and the nanotip-substrate distance D when using Au, InSb as nanotip and substrate materials; (b) Relation between the maximum electric field amplitude and the incident frequency for Au nanotip above an Au and InSb substrates, respectively, at 0.8–2.4 THz.
Applsci 05 01745 g004

3.4. Effect of the Detected Sample

When a sample is placed on the substrate under the THz near-field nanotip, the electric field enhancement effect is also investigated. The simulation parameters are set as follows: the sample is modeled as a dielectric hemisphere with a radius of 20 nm and the center of the hemisphere is on the substrate, the material of nanotip is Au, the incident THz wave frequency is 1.0 THz, the distance between centers of the apex and the hemisphere is 6 nm. Two different substrate materials of Si and Au are tested. The electric field distribution of apex-sample-substrate system is shown in Figure 5. The detected samples are modeled with different materials including air (ε = 1.0), high-resistivity silicon (ε = 11.7), Au (ε = −1.0 × 10⁵ + 1.9 × 10⁵i at 1.0 THz according the above parameters and the Drude model), perfect electrical conductor (PEC) (ε = −∞) and InSb (ε = −37.9 + 2.6i). Table 1 presents the maximum electric field for different dielectric hemispheres on the Au or Si substrates under the Au nanotip. From the table, it is seen that the maximum electric field increases with the increase of dielectric constant from air to PEC materials, which is in agreement with theoretical derivation of the effective polarizability. However, for the InSb material, since there is a plasmon enhancement between the Au apex and the InSb sample as discussed above, the simulated maximum electric field is largest among the five materials. Furthermore, as shown in Table 1, the local electric field of an Au hemisphere with a certain radius “pancaked” on the Au substrate is larger than that of the flat Au substrate, indicating geometry-depend electric field coupling between the sample and the nanotip. In addition, the field enhancement values with Si substrate are lower than the counterparts with Au substrate, which also confirms that the difference of field enhancement can be caused by choosing different dielectric materials as the substrate.
Figure 5. The electric field distribution of apex (Au)-Sample (hemisphere of InSb)-substrate (Au) system.
Applsci 05 01745 g005
Table 1. Maximum electric field amplitude for different detected sample composed of different materials on the Au or Si substrate under the Au nanotip.
SubstrateE (V/m)
AirSiAuPECInSb
Au275.8632.2740.9759.6800.7
Si189.4365.2415.0416.0437. 7

4. Conclusions

By 2D-FDTD simulations, we attempted to explore the influences of the size of the nanotip apex, the apex-substrate distance, the substrate and its dielectric constant, and the dielectric constant of the detected sample, etc., on the electric field enhancement and spatial resolution of THz near-field microscopy. Results showed that the radius of the nanotip apex and the distance between the apex and the substrate can prominently affect the electric field around the apex of the nanotip. With the presence of a substrate, the electric field amplitude around the apex have several tenfold increase compared to that without a substrate. The dielectric properties of the nanotip and the substrate not only have a significant influence on the enhancement effect, but also affect the resonant excitation frequency. The InSb substrate can generate a resonant enhancement at 1.6 THz, while the Au substrate cannot over the whole THz frequency range considered. Furthermore, with the increase of dielectric constant of the target sample, the maximum electric field around the apex of the nanotip increases for sample materials from air to the perfect electrical conductor. For detected sample composed of InSb material, the maximum electric field is the largest among all the five simulated materials, attesting to the light-matter interaction enhancement due to the existence of confined surface plasmons supported by InSb. All of the above results will help to understand the enhancement mechanism of the THz near-field microscopy and should provide guidance to our effort in setting up a THz near-field microscopy for biomolecular imaging.

Acknowledgments

This work is partially supported by National 973 Program of China (No. 2015CB755401), Fundamental & Advanced Research Project of Chongqing, China (cstc2013jcyjC00001), National Natural Science Foundation of China (No. 31400625 and No. 21407145) and Scientific Equipment Research Project of Chinese Academy of Sciences (Development of THz imaging spectrometer for biomacromolecules).

Author Contributions

J.H. and Z.Y. performed the simulations; H.-L.C. and C.D. designed the simulations and analyzed the data; D.W. analyzed the data and wrote the paper.

Conflicts of Interest

The authors declare no conflict of interest.

References

  1. Xie, L.J.; Yao, Y.; Ying, Y.B. The application of terahertz spectroscopy to protein detection: A review. Appl. Spectrosc. Rev. 2014, 49, 448–461. [Google Scholar] [CrossRef]
  2. Eifert, A.; Kranz, C. Hyphenating atomic force microscopy. Anal. Chem. 2014, 86, 5190–5200. [Google Scholar] [CrossRef] [PubMed]
  3. Huber, A.J.; Keilmann, F.; Wittborn, J.; Aizpurua, J.; Hillenbrand, R. Terahertz near-field nanoscopy of mobile carriers in single semiconductor nanodevices. Nano Lett. 2008, 8, 3766–3770. [Google Scholar] [CrossRef] [PubMed]
  4. Adam, A.J.L. Review of near-field terahertz measurement methods and their applications how to achieve sub-wavelength resolution at their frequencies. J. Infrared Millimeter Terahertz Waves 2011, 32, 976–1019. [Google Scholar] [CrossRef]
  5. Ishihara, K.; Ohashi, K.; Ikari, T.; Minamide, H.; Yokoyama, H.; Shikata, J.-I.; Ito, H. Terahertz-wave near-field imaging with subwavelength resolution using surface-wave-assisted bow-tie aperture. Appl. Phys. Lett. 2006, 89, 201120. [Google Scholar] [CrossRef]
  6. Pohl, D.W.; Denk, W.; Lanz, M. Optical stethoscopy: Image recording with resolution lambda/20. Appl. Phys. Lett. 1984, 44, 651–653. [Google Scholar] [CrossRef]
  7. Michaels, C.A.; Stranick, S.J.; Richter, L.J.; Cavanagh, R.R. Scanning near-field infrared microscopy and spectroscopy with a broadband laser source. J. Appl. Phys. 2000, 88, 4832–4839. [Google Scholar] [CrossRef]
  8. Zhang, R.; Zhang, Y.; Dong, Z.C.; Jiang, S.; Zhang, C.; Chen, L.G.; Zhang, L.; Liao, Y.; Aizpurua, J.; Luo, Y.; et al. Chemical mapping of a single molecule by plasmon-enhanced raman scattering. Nature 2013, 498, 82–86. [Google Scholar] [CrossRef] [PubMed]
  9. Huth, F.; Govyadinov, A.; Amarie, S.; Nuansing, W.; Keilmann, F.; Hilenbrand, R. Nano-FTIR absorption spectroscopy of molecular fingerprints at 20 nm spatial resolution. Nano Lett. 2012, 12, 3973–3978. [Google Scholar] [CrossRef] [PubMed]
  10. Mauser, N.; Hartschuh, A. Tip-enhanced near-field optical microscopy. Chem. Soc. Rev. 2014, 43, 1248–1262. [Google Scholar] [CrossRef] [PubMed]
  11. McLeod, A.S.; Kelly, P.; Goldflam, M.D.; Gainsforth, Z.; Westphal, A.J.; Dominguez, G.; Thiemens, M.H.; Fogler, M.M.; Basov, D.N. Model for quantitative tip-enhanced spectroscopy and the extraction of nanoscale-resolved optical constants. Phys. Rev. B 2014, 90, 085136. [Google Scholar] [CrossRef]
  12. Chen, H.T.; Kersting, R.; Cho, G.C. Terahertz imaging with nanometer resolution. Appl. Phys. Lett. 2003, 83, 3009–3011. [Google Scholar] [CrossRef]
  13. Wächter, M.; Nagel, M.; Kurz, H. Tapered photoconductive terahertz field probe tip with subwavelength spatial resolution. Appl. Phys. Lett. 2009, 95, 041112. [Google Scholar] [CrossRef]
  14. Masson, J.B.; Gallot, G. True near field versus contrast near field imaging. Opt. Express 2006, 14, 11566–11574. [Google Scholar] [CrossRef] [PubMed]
  15. Kurihara, T.; Yamaguchi, K.; Watanabe, H.; Nakajima, M.; Suemoto, T. Dielectric probe for scattering-type terahertz scanning near-field optical microscopy. Appl. Phys. Lett. 2013, 103, 151105. [Google Scholar] [CrossRef]
  16. Notingher, I.; Elfick, A. Effect of sample and substrate electric properties on the electric field enhancement at the apex of SPM nanotips. J. Phys. Chem. B 2005, 109, 15699–15706. [Google Scholar] [CrossRef] [PubMed]
  17. Yang, Z.; Aizpurua, J.; Xu, H. Electromagnetic field enhancement in TERS configurations. J. Raman Spectrosc. 2009, 40, 1343–1348. [Google Scholar] [CrossRef]
  18. Knoll, B.; Keilmann, F. Near-field probing of vibrational absorption for chemical microscopy. Nature 1999, 399, 134–137. [Google Scholar] [CrossRef]
  19. Knoll, B.; Keilmann, F. Enhanced dielectric contrast in scattering-type scanning near-field optical microscopy. Opt. Commun. 2000, 182, 321–328. [Google Scholar] [CrossRef]
  20. Isaac, T.H.; Barnes, W.L.; Hendry, E. Determining the terahertz optical properties of subwavelength films using semiconductor surface plasmons. Appl. Phys. Lett. 2008, 93, 241115. [Google Scholar] [CrossRef]
  21. Duo, T.B.; Huang, J.; Chen, J.; Wei, D.S.; Pan, W.; Du, C.L.; Cui, H.L. Interaction between metal nanotip and substrate under terahertz wave radiation. J. Mod. Opt. 2015, 62, 644–648. [Google Scholar] [CrossRef]