Article

Effect of Post-Annealing on the Microstructure and Microwave Dielectric Properties of Ba(Co0.7Zn0.3)1/3Nb2/3O3 Ceramics

1
Laboratoire Universitaire des Sciences Appliquées de Cherbourg (LUSAC), Université de Caen Basse-Normandie (UCBN), EA 4253, Site Universitaire-60 rue Max Pol Fouchet, CS 20082, Cherbourg-Octeville 50130, France
2
Institut Charles Gerhardt, Equipe Agrégats, Interfaces et Matériaux pour l’Energie, Unité Mixte de Recherche (UMR 5253), Centre National de la Recherche Scientifique (CNRS), Université Montpellier II, Cedex 5, Montpellier 34095, France
*
Author to whom correspondence should be addressed.
Appl. Sci. 2016, 6(1), 2; https://doi.org/10.3390/app6010002
Submission received: 29 October 2015 / Revised: 28 November 2015 / Accepted: 3 December 2015 / Published: 22 December 2015
(This article belongs to the Special Issue Ferroelectric Ceramics)

Abstract

:
The effects of post-annealing on the crystal structure, microstructure, and microwave dielectric properties for Ba(Co0.7Zn0.3)1/3Nb2/3O3 ceramics were investigated. The as-prepared materials were characterized by X-ray diffraction, scanning electron microscopy and energy dispersive spectroscopy. The microwave dielectric properties are measured at 6 GHz using a network analyzer. Ba5Nb4O15 and/or Ba8(Co,Zn)1Nb6O24 secondary phases were found on the surface according to sintering conditions due to volatilization of some Zn and Co elements. The experimental results show that the beneficial effect of the annealing steps to improved the microwave dielectric properties. Excellent microwave dielectric properties were achieved for the coarse-grained microstructures by a higher sintering temperature and with a shorter holding time followed by annealing steps at lower temperatures with a longer holding time. This improvement can be attributed to 1:2 cation ordering within the crystal, which is taking place during annealing process. The Ba(Co0.7Zn0.3)1/3Nb2/3O3 ceramic could be used successfully for realization of dielectric microwave resonators, since it has a high quality factor Qf value of 123,700 GHz, a high dielectric constant εr value of 34.5 and a temperature coefficient of the resonant frequency τf of 0 ppm/°C.

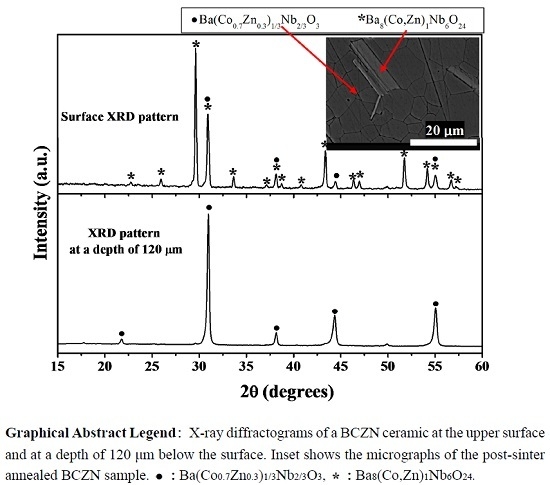
Graphical Abstract

1. Introduction

Compounds with perovskite structure with a general formula ABO3 have been of continuous importance for many years [1]. The properties of perovskites depend critically on the nature of the metal atoms in the A and B sites. As a consequence, substitutions on the A and/or B sites allow varying their properties over wide ranges, which makes them adaptable to various technical requirements. Perovskites have numerous applications such as dielectric resonators, filters and antennas in a vast field of domains like wireless communication devices, radar, direct broadcasting satellites and global positioning systems [2,3,4]. Tantalum-based ceramics such as Ba3ZnTa2O9 (BZT) and Ba3MgTa2O9 (BMT) are frequently used as materials for dielectric resonators, despite the elevated tantalum price. As a consequence, a considerable amount of research is nowadays focused on the search for alternative ceramic materials providing comparable dielectric proprieties at lower costs. Applications as dielectric resonators require materials with a high quality factor at the resonance frequency (Qf), a high dielectric constant (εr) and a near-zero temperature coefficient of the resonance frequency (τf) [2,5]. In this context, Ba(Co0.7Zn0.3)1/3Nb2/3O3 (BCZN) ranks among the best oxide materials with regard to applications such as dielectric resonators in the range of microwave frequencies due to its high Qf value (~56,000–85,000 GHz), its high εr (~34.5) and its small τf (~0) [6,7]. BCZN-based ceramics have therefore been suggested as a promising alternative to tantalum-based ceramics for applications in the microwave range. However, the dielectric properties of these ceramic materials are dependent on their density [8]. In addition, it is well known that BCZN-based ceramics are difficult to densify below 1450 °C [9]. In order to improve the sinterability of BCZN ceramics, we have successfully used the aqueous mixing technique-assisted solid-state method for the preparation of Ba(Co0.7Zn0.3)1/3Nb2/3O3 powders, which were sintered at 1350 °C for 30 h in air [10]. As a continuation of our previous work, the present paper describes improvements of the microwave dielectric proprieties of BCZN ceramics achieved by a supplementary annealing process, which is added to the synthesis procedure described previously. In this article, we study the effect of this additional annealing step on the structure, microstructure, and microwave dielectric properties of BCZN ceramics and compare the results with those obtained without this annealing. It will be shown that this second annealing step leads to a ~28% increase of the Qf value. The improvement is explained by cation ordering within the crystal, as revealed by X-ray diffraction (XRD). The relationship between the heat treatment and the BCZN characteristics will be discussed in detail.

2. Experimental Section

The Ba(Co0.7Zn0.3)1/3Nb2/3O3 (BCZN) ceramics (LUSAC, Cherbourg, France) were prepared using the aqueous mixing technique-assisted solid-state method at 1000 °C for 2 h in air. The synthesis method is described in [10]. Pellets of a diameter of 10 mm and a thickness of 5 mm were formed by uniaxial (Carver, Wabash, IN, USA) pressing with 200 MPa. The ceramics were then sintered at two different temperatures and durations (1450 °C for 2 h and 1350 °C for 30 h). These samples are denoted hereafter as S1 and S2, respectively. These sintered ceramics S1 and S2 were then submitted to an additional annealing step at 1300 °C for 30 h in air to study the effect of such an annealing on their structure and microstructure and on their microwave dielectric properties. Samples S1 and S2 having undergone this additional annealing procedure will be denoted hereafter as S1a and S2a, respectively. Thermodilatometric analysis was performed in air up to 1500 °C with a Seteram TMA92, using a heating/cooling rate of 150 °C·h−1. The measurement was performed on cylindrical compacts having a height of 10 mm and a diameter of 5 mm, obtained by pressing the powders isostatically at 196 MPa. The sintered and annealed specimens were cooled inside the furnace under air atmosphere. All samples were heated and cooled at a rate of 200 °C·h−1. X-ray diffraction was carried out at room temperature for the sintered and annealed samples by using a Inel Equinox 3000 diffractometer (Inel, Artenay, France) in air, employing CuKα radiation (λ = 1.540562 Å) over the range of 2θ = 15–60°. A microstructural examination of the specimen was performed in a scanning electron microscope (SEM, Hitachi S3400, Tokyo, Japan) combined with an energy dispersive spectrometer (EDS, ThermoNoran Middleton, WI, USA). In addition, the experimental densities of the sintered pellets were measured on a Micromiretics accupyc 1330 helium pycnometer (Micromeritics, Norcross, GA, USA). Surfaces of the densified ceramics were polished successively using various grades of silicon carbide papers and 1.0 μm diamond paste was used for the final polishing. Afterwards the polished pellets were treated thermally at 1100 °C for 20 min. The purpose of this thermal etching consists in revealing the BCZN grain boundaries in a pre-polished sample by the formation of grooves in the intersections of BCZN grain boundaries. Finally, the dielectric properties were measured at 6 GHz resonance frequency using an Agilent 8722ES vector network analyzer (Agilent, Santa-Clara, CA, USA).

3. Results and Discussion

3.1. Thermodilatometry

Figure 1 shows the thermodilatometric measurements up to 1500 °C under air for calcined powders of BCZN ceramic materials. This experiment was performed in order to optimize the sintering temperature. As can be seen on the graph, shrinkage was observed to start at ~1090 °C. In addition, the derivative curve indicates a high densification rate (−1.7% min−1) at 1350 °C and the maximum densification of BCZN is achieved at 1450 °C. Thus, two temperatures 1350 and 1450 °C, have been chosen to sinter the pellets with a heating and cooling rate of 200 °C·h−1 under air atmosphere. Regarding the durations, two sintering times were studied: 2 h and 30 h at 1350 °C and also at 1450 °C. It turned out that the best results are achieved by using a high temperature (1450 °C) during a short time (2 h) or by using a longer treatment (30 h) at a lower temperature (1350 °C). Taking into account these results and in order to study the effect of the heat treatment on the dielectric properties of the BCZN ceramics, we decided to describe here the sintering processes that provided the best dielectrics proprieties. Therefore, we chose to present the sintered pellets at 1350 °C for 30 h and at 1450 °C for 2 h under air atmosphere with a heating and cooling rate of 200 °C·h−1.
Figure 1. Shrinkage curve of a BCZN sample as a function of temperature.
Applsci 06 00002 g001

3.2. Structural Characterization

Figure 2 and Figure 3 show X-ray diffraction patterns of the Ba(Co0.7Zn0.3)1/3Nb2/3O3 (BCZN) ceramics after sintering at 1450 °C for 2 h (sample S1) and after annealing at 1300 °C (sample S1a) for 30 h. In order to identify the surface composition, the analyses were carried out at the upper surface for both specimens and at depths of 90 and 120 µm for sintered and annealed ceramics, respectively. It can be seen that the surface XRD pattern (Figure 2a) can be interpreted as a mixture of Ba(Co0.7Zn0.3)1/3Nb2/3O3 (BCZN) and Ba8(Co,Zn)1Nb6O24 phases. The complex perovskite ceramic Ba8(Co,Zn)1Nb6O24 is isostructural with Ba8Ni1Nb6O24 and Ba8Zn1Nb6O24 [11]. The Co:Zn ratio in Ba8(Co,Zn)1Nb6O24 may be variable.
At a depth of 90 µm below the surface (Figure 2b), all reflections can be attributed to the cubic structure of Ba(Co0.7Zn0.3)1/3Nb2/3O3, whereas no peaks attributable to Ba8(Co,Zn)1Nb6O24 were observed. These results clearly show that the Ba8(Co,Zn)1Nb6O24 phase is only formed on the surface of the BCZN ceramics and that it represents a secondary phase. The appearance of this phase is probably due to the volatilization of some Zn and Co elements during the sintering steps [12]. For annealed ceramics (Figure 3), all diffraction peaks in Figure 3a (on the surface) can be attributed to the Ba(Co0.7Zn0.3)1/3Nb2/3O3 and Ba8(Co,Zn)1Nb6O24 phases. However, the relative intensities of the main peaks of the two phases are reversed as compared to those observed for the sintered materials, suggesting that the amount of Ba8(Co,Zn)1Nb6O24 increased on the surface of the BCZN ceramic after the annealing process. On the other hand, the patterns obtained at a depth of 120 microns below the surface (Figure 3b), are similar to those obtained at a depth of 90 µm after sintering (Figure 2b). The latter findings are consistent with previous works indicating that the core of the specimens consists only of the Ba(Co0.7Zn0.3)1/3Nb2/3O3 phase and that it transforms into Ba8(Co,Zn)1Nb6O24 at a high temperature on the surface [10]. The X-ray patterns also show a superlattice peak at 2θ = 17.74° (marked by an open circle), as shown in the small insert in Figure 3b. This reflection highlights the 1:2 cation ordering within the crystal [7]. The effect of the cation ordering on the dielectric proprieties of BCZN will be discussed in the following section in paragraph 3.4. The insert shows also the reflection peak at 2θ = 29.59° (marked by a sold star) arising from the Ba8(Co,Zn)1Nb6O24 phase. This indicates that the secondary phase of Ba8(Co,Zn)1Nb6O24 is located at a depths of over 120 µm.
Figure 2. X-ray diffractograms of a BCZN ceramic (S1): (a) at the upper surface and (b) at a depth of 90 µm below the surface. •: Ba(Co0.7Zn0.3)1/3Nb2/3O3; *: Ba8(Co,Zn)1Nb6O24.
Applsci 06 00002 g002
Figure 3. X-ray diffractograms of a BCZN ceramic (S1a): (a) at the upper surface and (b) at a depth of 120 µm below the surface. •: Ba(Co0.7Zn0.3)1/3Nb2/3O3; *: Ba8(Co,Zn)1Nb6O24. Inset: The region limited between 15° and 35° 2θ shows a superlattice peak for 1:2 ordering which is denoted by an open circle.
Applsci 06 00002 g003
Figure 4 and Figure 5 show X-ray diffraction patterns of the Ba(Co0.7Zn0.3)1/3Nb2/3O3 (BCZN) ceramics after sintering at 1350 °C for 30 h (sample S2) and after annealing at 1300 °C for 30 h (sample S2a). The analyses were carried out at the upper surface for both specimens and at depths of 120 and 140 µm for sintered and annealed ceramics, respectively. It can be seen that the surface XRD pattern (Figure 4a) can be interpreted as a mixture of three phases Ba(Co0.7Zn0.3)1/3Nb2/3O3 (BCZN), Ba5Nb4O15 and Ba8(Co,Zn)1Nb6O24. At a depth of 120 µm below the surface (Figure 4b), all reflections can be attributed to the cubic structure of Ba(Co0.7Zn0.3)1/3Nb2/3O3 (BCZN), whereas no peaks attributable to Ba8(Co,Zn)1Nb6O24 or Ba5Nb4O15 were observed. These results clearly show that the Ba8(Co,Zn)1Nb6O24 and Ba5Nb4O15 phases are only formed on the surface of the BCZN ceramics and that they represent secondary phases. The origin of these phases is probably due to the volatilization of some Zn and Co elements during the sintering steps [12]. For post-sinter annealed ceramics it can be seen from Figure 5a that the XRD pattern confirms the presence of three phases on the surface of the ceramics: Ba(Co0.7Zn0.3)1/3Nb2/3O3 (BCZN), Ba5Nb4O15 and Ba8(Co,Zn)1Nb6O24. In addition, the relative intensities of the Ba5Nb4O15 and Ba8(Co,Zn)1Nb6O24 peaks increase, while those of the BCZN peaks decrease, suggesting that the amounts of the secondary phases of Ba8(Co,Zn)1Nb6O24 and Ba5Nb4O15 increased on the surface of the BCZN ceramic after annealing. From the XRD pattern collected at the depth of 140 µm below the surface (Figure 5b), we can see that all peaks can be attributed to the Ba(Co0.7Zn0.3)1/3Nb2/3O3 phase. However, data analyses show some crystal diffraction peaks at 2θ = 17.72° (marked by an open circle), which reflects the 1:2 cation ordering within the crystal already observed in previous work [7].
Figure 4. X-ray diffractograms of a BCZN ceramic (S2): (a) at the upper surface and (b) at a depth of 120 µm below the surface. •: Ba(Co0.7Zn0.3)1/3Nb2/3O3; *: Ba8(Co,Zn)1Nb6O24; ♦: Ba5Nb4O15.
Applsci 06 00002 g004
Figure 5. X-ray diffractograms of a BCZN ceramic (S2a): (a) at the upper surface and (b) at a depth of 140 µm below the surface. •: Ba(Co0.7Zn0.3)1/3Nb2/3O3; *: Ba8(Co,Zn)1Nb6O24; ♦: Ba5Nb4O15. Inset: The region limited between 15° and 35° 2θ shows a superlattice peak for 1:2 ordering denoted by an open circle.
Applsci 06 00002 g005

3.3. Microstructural Investigations

Figure 6 and Figure 7 show SEM micrographs of the Ba(Co0.7Zn0.3)1/3Nb2/3O3 (BCZN) ceramics of samples S1 and S1a, respectively. The SEM images were recorded (Figure 6a and Figure 7a) on the surface; (Figure 6b and Figure 7b) a fractured surface; (Figure 6c and Figure 7c) on grain boundaries; (Figure 6d and Figure 7d) and on longitudinally polished sections for these two cases just described. From Figure 6a it can be seen that the micrograph confirms the presence of two phases on the surface of the ceramics, needle-shaped grains and plate-shaped grains. Based on previous work, the needle-shaped grains are identified as Ba8(Co,Zn)1Nb6O24, while the plate-shaped grains consist of Ba(Co0.7Zn0.3)1/3Nb2/3O3 [10]. This result is in agreement with the XRD data (Figure 2a). The SEM image of the fractured surface (Figure 6b) reveals that the specimens consist of a single and homogeneous phase. Figure 6c shows a micrograph highlighting a grain boundary with a typical grain size of approximately 14 microns. In addition, the large amounts of residual pores were mainly located along the grain boundaries. This porosity is observed also in the fractured surface (Figure 6b) and in longitudinally polished sections (Figure 6d). Figure 6d is a backscattered SEM image of a longitudinally polished section of a BCZN ceramic. It can be seen that the surface clearly consists of two different domains, appearing as a light grey area (marked by 1) and a dark grey area (marked by 2) on the micrograph. In order to get a better insight into the chemical composition of these phases, EDS data were collected in these two areas.
Figure 6. SEM micrographs of BCZN ceramics (S1): (a) of a surface; (b) of a fractured surface; (c) of a grain boundary; and (d) of a longitudinally polished section.
Applsci 06 00002 g006
Figure 7. SEM micrographs of BCZN ceramics (S1a): (a) of a surface; (b) of a fractured surface; (c) of a grain boundary; and (d) of a longitudinally polished section.
Applsci 06 00002 g007
The atomic percentages derived from the EDS spectra are given in Table 1. The atomic percentages of the light grey area (zone 1) are close to the theoretical values expected for Ba8(Co,Zn)1Nb6O24, while the percentages of the dark grey area (zone 2) agree quite well with those of Ba(Co0.7Zn0.3)1/3Nb2/3O3. Those two compounds were also identified by XRD at the surface of the specimen (Figure 2a).
Figure 7 shows the micrographs of the post-sinter annealed BCZN sample (S1a). The microstructure morphology observed after the annealing step was similar to that of the sintered sample (S1), while significant changes are identified in terms of density and surface composition of the specimen. Figure 7c reveals a persistent secondary phase in the surface of the specimens (needle-shaped grains). These results are also in agreement with the XRD analyses (Figure 3a). It is interesting to note that the annealing step at 1300 °C for 30 h has no effect on the grain growth. In contrast, secondary phase formation is very marked. The EDS analysis (Figure 7d), reveals a light grey area (zone 1) and a dark grey area (zone 2) comparable to the surface of the sintered ceramic (Figure 6d) as shown in Table 1.
Table 1. Atomic percentages obtained from EDS analyses on areas of interest by moving the analyzing spot. Zones 1 and 2 correspond to light grey and dark grey areas, respectively, mentioned in Figure 6d, Figure 7d, Figure 8d and Figure 9d. These figures were performed on the samples S1, S1a, S2 and S2a, respectively.
Investigated Area in the SEM Image%O%Ba%Co%Zn%NbAttribution
Figure 6d (S1)zone 161.3 ± 0.8
(61.53) *
19.5 ± 0.2
(20.51)
1.7 ± 0.2
(1.86)
0.62 ± 0.2
(0.67)
17.9 ± 0.2
(15.38)
Ba8(Co0.73Zn0.27)1Nb6O24
zone 259.6 ± 2.1
(60)
20.3 ± 0.2
(20)
4.9 ± 03
(4.66)
1.8 ± 0.3
(2)
13.3 ± 0.3
(13.33)
Ba(Co0.7Zn0.3)1/3Nb2/3O3
Figure 7d (S1a)zone 159.1 ± 0.819.8 ± 0.21.6 ± 0.20.7 ± 0.218.6 ± 0.2Ba8(Co0.73Zn0.27)1Nb6O24
zone 259.6 ± 1.419.1 ± 0.24.5 ± 0.21.9 ± 0.214.9 ± 0.2Ba(Co0.7Zn0.3)1/3Nb2/3O3
Figure 8d (S2)zone 162.1 ± 1.119.3 ± 0.21.7 ± 0.20.6 ± 0.116.2 ± 0.1Ba8(Co0.73Zn0.27)1Nb6O24
zone 260.9 ± 1.018.9 ± 0.14.2 ± 0.11.4 ± 0.214.6 ± 0.1Ba(Co0.7Zn0.3)1/3Nb2/3O3
Figure 9d (S2a)zone 156.7 ± 0.719.5 ± 0.21.7 ± 0.20.49 ± 0.117.9 ± 0.1Ba8(Co0.73Zn0.27)1Nb6O24
zone 259.8 ± 1.619.4 ± 0.24.4 ± 0.21.8 ± 0.214.6 ± 0.2Ba(Co0.7Zn0.3)1/3Nb2/3O3
* Values in italics are those theoretically expected in the case of isolated particles. Deviations are in agreement with the presence of interfaces between phases detected by XRD. Zone 1: light grey area, zone 2: dark grey area.
Figure 8 and Figure 9 show SEM micrographs of the BCZN ceramics after sintering and annealing steps. The SEM images were acquired under the same conditions as described above. Figure 8a–d shows the microstructures of sample S2. A significant change in microstructure was observed on these samples with a 0.6–2.3 µm fine grained microstructure developed at this sintering temperature, with very few residual pores mainly located along grain boundaries (Figure 8c).
Figure 9a–d shows the microstructures of the post-sinter annealed BCZN sample (S2a). No significant difference is found in the microstructure after the annealing process. However, increasing grain sizes were observed with increasing annealing time at 1300 °C, with a typical grain size of 0.9–4 micron (Figure 9c). These results demonstrate that the sintering condition has a significant effect on the structure and microstructure of the BCZN specimen. The grain size increases at sintering temperatures above 1300 °C, whereas the secondary phase remains on the specimen surface even after sintering for a longer time.
The results obtained by EDS analysis (Figure 8 and Figure 9) for the light grey area (zone 1) and the dark grey area (zone 2) are also given in Table 1. The light grey area consists essentially of Ba8(Co,Zn)1Nb6O24 and the dark grey area of Ba(Co0.7Zn0.3)1/3Nb2/3O3. Those two compounds were also identified by XRD (Figure 4a and Figure 5a). However, we note the absence of the characteristic signal of Ba5Nb4O15. This can be explained by a fine layer of Ba5Nb4O15, located on the upper surface, while Ba8(Co,Zn)1Nb6O24 is located below the surface. Thus, according to the sintering condition, the surface of the BCZN ceramics consists in a mixture of two or three phases. Ba(Co0.7Zn0.3)1/3Nb2/3O3, Ba8(Co,Zn)1Nb6O24 and Ba5Nb4O15 for the specimen (S1) sintered at 1450 °C for 2 h and only Ba(Co0.7Zn0.3)1/3Nb2/3O3 and Ba8(Co,Zn)1Nb6O24 for the specimen (S2) sintered at 1350 °C for 30 h. In contrast, the core of the specimens is only composed of the Ba(Co0.7Zn0.3)1/3Nb2/3O3 matrix, whatever the sintering and annealing conditions were. The black spots observed in the SEM image (Figure 8d and Figure 9d) represent a residual porosity.
Figure 8. SEM micrographs of BCZN ceramics (S2): (a) of a surface; (b) of a fractured surface; (c) of a grain boundary; and (d) of a longitudinally polished section.
Applsci 06 00002 g008
Figure 9. SEM micrographs of BCZN ceramics (S2a): (a) of a surface; (b) of a fractured surface; (c) of a grain boundary; and (d) of a longitudinally polished section.
Applsci 06 00002 g009

3.4. Microwave Dielectric Properties

The microwave dielectric properties of the Ba(Co0.7Zn0.3)1/3Nb2/3O3 ceramics were investigated for specimens S1, S2, S1a and S2a. The measurements were recorded from polished and unpolished samples. No significant differences in dielectric properties were observed before and after polishing. This is due to their good microwave dielectric properties [9]. This observation suggests that the secondary phases of Ba8(Co,Zn)1Nb6O24 and of Ba5Nb4O15 seem to have no effect on the dielectric properties. The results of the dielectric measurements at about 6 GHz are gathered in Table 2.
As displayed in Table 2, the sintering and annealing steps seem to have little effect on the dielectric constant εr and on the temperature coefficient of the resonant frequency τf, whereas the quality factor Qf at 6 GHz is significantly affected. Thus, a high quality factor Qf of 96,132 GHz, a high dielectric constant εr of 34.5 and a temperature coefficient of the resonant frequency τf of 0 ppm/°C were obtained for sample S2 (Table 2). The relative density of this specimen (S2) is about 6.29 indicating a high density of the obtained ceramic materials. On the other hand, a similar quality factor Qf of 99,700 GHz is obtained for the annealed sample S2a (Table 2) with a relative density of 6.55. In the case of specimen S1 (Table 2), a Qf value of 36,953 GHz is observed with a relative density of 6.44. The latter value of Qf is much lower than that obtained for specimen S2. However, the Qf value of the ceramics were remarkably improved by the annealing process at 1300 °C for 30 h and the maximum Qf value of BCZN sample (S1a) was 123,700 GHz, which is 25% higher than that of BCZN sample (S1) (Table 2). The relative density of the latter specimen is 6.56 (~96% of the theoretical density). The results in Table 2 show that high densities were obtained for all ceramics materials regardless of the processing conditions. This confirms that, from certain density values on (>90%), the Qf value is independent of the density in agreement with previous data [13]. Indeed, during the sintering step, the improved Qf value could be linked to differences in the ceramic microstructure as shown in Table 2, with a high Qf value of 96132 was obtained for the BCZN specimen (S2), with a grain size of 0.6–2.3 microns. During the annealing process, the quality factor Qf of the BCZN ceramics was significantly improved. It can be seen from Table 2, that the high values of Qf of 99,700 and 123,700 GHz are observed of the annealed samples S2a and S1a, respectively. This improvement of the Qf-value is explained by 1:2 cation ordering in accordance with the XRD data recorded on the surface of the post-sinter annealed ceramics (S1a and S2a), as shown in the small insert figure in Figure 3b and Figure 5b, respectively. A similar result was previously reported which shows the increase of the Qf values as a consequence of cation ordering [9]. This Qf value of 123,700 GHz is higher than those obtained for the undoped and Al2O3-doped BCZN ceramics (Qf = 115,307 and 61,056 GHz, respectively), published recently [14,15], indicating that the Ba(Co0.7Zn0.3)1/3Nb2/3O3 materials are promising candidates for microwave device applications.
Table 2. Characteristics and dielectric properties (measured at 6 GHz) of BCZN specimens S1, S2, S1a and S2a.
Heat Treatment Conditions and Sample NameDensity (g/cm3)εrτf (ppm/°C)Qf (GHz)OrderGrain Size (µm)
Sintering process(S2):1350 °C for 30 h6.29~34.5~096,1320.6–2.3
(S1):1450 °C for 2 h6.44~34.5~036,953~14
Annealing process(S2a):1300 °C for 30 h6.56~34.5~099,700+0.9–4
(S1a):1300 °C for 30 h6.47~34.5~0123,700+~14
a Italic letter corresponds to annealing process of the BCZN ceramics. (,+) Absence, Presence of the characteristic signal of 1:2 cation ordering within the crystal.

4. Conclusions

Densified ceramics with a BCZN Perovskite-type structure were prepared by a simple method using the aqueous mixing technique-assisted solid-state method. X-ray diffraction shows that Ba5Nb4O15 and/or Ba8(Co,Zn)1Nb6O24 were found as secondary phases on the surface, depending on the sintering conditions. This study demonstrated that a higher sintering temperature with a shorter holding time followed by annealing steps at lower temperatures with a longer holding time are very important to produce microwave dielectric materials. Excellent microwave dielectric properties were achieved for the coarse-grained microstructures after sintering and annealing steps at 1450 °C for 2 h and at 1300 °C for 30 h, respectively. These process conditions represent the optimal sintering and annealing conditions to produced Ba(Co0.7Zn0.3)1/3Nb2/3O3 microwave dielectric materials. BCZN ceramics (S1a) prepared under these conditions exhibit a high quality factor Qf of 123,700 GHz measured at 6 GHz, a high dielectric constant εr of 34.5 and a temperature coefficient of the resonant frequency τf of 0 ppm/°C. All the characteristics of the prepared Ba(Co0.7Zn0.3)1/3Nb2/3O3 suggest its suitability for applications in the microwave range.

Acknowledgments

The authors gratefully acknowledge support from the French ANR under Contract No. ANR-08-MAPR-0013 project “Cheapcomponents”. We wish to thank our industrial partner: TEMEX Ceramics.

Author Contributions

All the authors have made significant contributions to this study and have approved this submission. Brahim Itaalit and Mohamed Mouyane prepared the powders and the ceramics materials. Mohamed Mouyane, Brahim Itaalit, David Houivet and Jérôme Bernard carried out the experiments. Mohamed Mouyane, Jerôme Bernard, Manfred Womes and David Houivet contributed to analysis and interpretation of data. Mohamed Mouyane and Manfred Womes prepared the manuscript.

Conflicts of Interest

The authors declare no conflict of interest.

References

  1. Luck, F. Wet air oxidation: Past, present and future. Catal. Today 1999, 53, 81–91. [Google Scholar] [CrossRef]
  2. Chen, Y.C. Microwave dielectric properties of (Mg(1-x)Cox)2SnO4 ceramics for application in dual-band inverted-E-shaped monopole antenna. IEEE Trans. Ultrason. Ferroelectr. Freq. Control 2011, 58, 2531–2538. [Google Scholar] [CrossRef] [PubMed]
  3. Sebastian, M.T. Dielectric Materials for Wireless Communication; Elsevier: Amsterdam, the Netherland, 2008. [Google Scholar]
  4. Wersing, W. Microwave ceramics for resonators and filters. Curr. Opin. Solid State Mater. Sci. 1996, 1, 715–731. [Google Scholar] [CrossRef]
  5. Scott, R.I.; Thomas, M.; Hampson, C. Development of low cost, high performance Ba(Zn1/3Nb2/3O3) based materials for microwave resonator applications. J. Eur. Ceram. Soc. 2003, 23, 2467–2471. [Google Scholar] [CrossRef]
  6. Endo, K.; Fujimoto, K.; Murakawa, K. Dielectric properties of ceramics in Ba(Co1/3Nb2/3)O3-Ba(Zn1/3Nb2/3)O3 solid solutions. J. Am. Ceram. Soc. 1987, 70, 215–218. [Google Scholar] [CrossRef]
  7. Ahn, C.-W.; Jang, H.-J.; Nahm, S.; Park, H.-M.; Lee, H.-J. Effect of microstructure on the microwave dielectric properties of Ba(Co1/3Nb2/3)O3 and (1-x)Ba(Co1/3Nb2/3)O3-xBa(Zn1/3Nb2/3)O3 solid solutions. J. Eur. Ceram. Soc. 2003, 23, 2473–2478. [Google Scholar] [CrossRef]
  8. Huang, C.-L.; Chien, Y.-H.; Shih, C.-F.; Chang, H.-Y. Crystal structure and dielectric properties of xCa(Mg1/3Nb2/3)O3-(1−x)(Ca0.61Nd0.26)TiO3 at the microwave frequency. Mater. Res. Bull. 2015, 63, 1–5. [Google Scholar] [CrossRef]
  9. Azough, F.; Leach, C.; Freer, R. Effect of CeO2 on the sintering behaviour, cation order and properties of Ba3Co0.7Zn0.3Nb2O9 ceramics. J. Eur. Ceram. Soc. 2006, 26, 1883–1887. [Google Scholar] [CrossRef]
  10. Abakumov, A.M.; Tendeloo, G.V.; Scheglov, A.A.; Shpanchenko, R.V.; Antipov, E.V. The crystal structure of Ba8Ni1Nb6O24: Cation ordering in hexagonal perovskites. J. Solid State Chem. 1966, 125, 102–107. [Google Scholar] [CrossRef]
  11. Itaalit, B.; Mouyane, M.; Bernard, J.; Reboul, J.-M.; Houivet, D. Improvement of microwave dielectric properties of Ba(Co0.7Zn0.3)1/3Nb2/3O3 ceramics prepared by solid-state reaction. Ceram. Int. 2015, 41, 1937–1942. [Google Scholar] [CrossRef]
  12. Azough, F.; Leach, C.; Freer, R. Effect of nonstoichiometry on the structure and microwave dielectric properties of Ba(Co1/3Nb2/3)O3 ceramics. J. Eur. Ceram. Soc. 2006, 26, 2877–2884. [Google Scholar] [CrossRef]
  13. Kim, W.S.; Kim, T.H.; Kim, E.S.; Yoon, K.H. Microwave dielectric properties and far infrared reflectivity spectra of the (Zr0.8Sn0.2)TiO4 ceramics with additives. Jpn. J. Appl. Phys. 1998, 37, 5367–5371. [Google Scholar] [CrossRef]
  14. Wang, Z.F.; Huang, B.Y.; Wang, L.X.; Fu, Z.X.; Zhang, Q.T. Effects of MnO2 addition on quality factor of Ba(Co0.7Zn0.3)1/3Nb2/3O3 microwave dielectric ceramics. Mater. Lett. 2015, 141, 272–274. [Google Scholar] [CrossRef]
  15. Liao, P.; Qiu, T.; Yang, J.; Lu, X. Effect of Al2O3 addition on microwave dielectric properties of BaCo0.194Zn0.116Nb0.69O3 ceramics. Electron. Mater. Lett. 2014, 10, 121–125. [Google Scholar] [CrossRef]