Article

Towards the Development of a Low-Cost Irradiance Nowcasting Sky Imager

by
Luis Valentín
1,*,
Manuel I. Peña-Cruz
1,
Daniela Moctezuma
2,
Cesar M. Peña-Martínez
1,
Carlos A. Pineda-Arellano
1 and
Arturo Díaz-Ponce
1
1
CONACYT—Centro de Investigaciones en Optica, Unidad de Aguascalientes, Prol. Constitución 607, Reserva Loma Bonita, Aguascalientes 20200, Mexico
2
CONACYT—Centro de Investigación en Ciencias de Información Geoespacial A.C., 117 Circuito Tecnopolo Norte Col. Tecnopolo Pocitos II, Aguascalientes 20313, Mexico
*
Author to whom correspondence should be addressed.
Appl. Sci. 2019, 9(6), 1131; https://doi.org/10.3390/app9061131
Submission received: 28 December 2018 / Revised: 1 February 2019 / Accepted: 1 February 2019 / Published: 18 March 2019

Abstract

:
Solar resource assessment is fundamental to reduce the risk in selecting the solar power-plants’ location; also for designing the appropriate solar-energy conversion technology and operating new sources of solar-power generation. Having a reliable methodology for solar irradiance forecasting allows accurately identifying variations in the plant energy production and, as a consequence, determining improvements in energy supply strategies. A new trend for solar resource assessment is based on the analysis of the sky dynamics by processing a set of images of the sky dome. In this paper, a methodology for processing the sky dome images to obtain the position of the Sun is presented; this parameter is relevant to compute the solar irradiance implemented in solar resource assessment. This methodology is based on the implementation of several techniques in order to achieve a combined, fast, and robust detection system for the Sun position regardless of the conditions of the sky, which is a complex task due to the variability of the sky dynamics. Identifying the correct position of the Sun is a critical parameter to project whether, in the presence of clouds, the occlusion of the Sun is occurring, which is essential in short-term solar resource assessment, the so-called irradiance nowcasting. The experimental results confirm that the proposed methodology performs well in the detection of the position of the Sun not only in a clear-sky day, but also in a cloudy one. The proposed methodology is also a reliable tool to cover the dynamics of the sky.

Graphical Abstract

1. Introduction

The assessment of solar irradiance has become one of the most important topics in the field of solar energy, such as the photovoltaic industry (PV), concentrating solar power (CSP), and the solar chemistry process [1,2,3,4]. In the solar power industry, constant assessment of the solar resource is essential to establish the viability of exploiting a specific location and predicting the factors that may affect its energy production. Having an accurate assessment of the solar resource is an important advantage that can help in establishing solar energy as a more competitive alternative. Currently, a number of maps and databases describing the solar resource distribution can be found on the Internet; however, confidence intervals of data are not provided in any of them [5]. The proposal in [1] argued that the assessment and forecasting of the solar resource are essential tasks, since they allow better management of the solar field in real time, reducing the maintenance activities, thus improving the expected benefits. Currently, the installation of PV and CSP plants has generated an increase in the production of electricity with renewable energy, and it is to be expected that this trend will continue increasing. However, the fluctuating nature of solar energy poses particular problems in delivering the generated energy to the electricity grids, not to mention the high initial investment cost, which require a short-term forecast of the solar irradiance availability, also known as “nowcasting” [1,2,6,7]. This makes the construction and improvement of “nowcasting” systems very important.
There are two main approaches that allow the forecast of solar irradiance [8]. The first one is the physical-statistical method, which deals with the forecast of the availability of solar irradiance by means of the so-called numerical weather prediction models (NWP). These prediction models have a spatial resolution around of 100 km 2 and deliver resolutions up to 10 km 2 [9], with long-term irradiance prediction [10,11]. On the other hand, there are models based on real-time prediction by means of satellite images. The spatial resolution of the satellite prediction models is 1 km 2 with a medium temporal resolution greater than 6 h [2]. The need for low temporal resolution (minutes) has been addressed by the development of sky imagers. These systems provide a hemispherical view of the whole sky by using a fish-eye lens or a convex dome mirror and a camera; allowing the Sun motion and cloud vector to be estimated [12].
Generally, the forecast of the NWP has a better performance in the temporal perspective than satellite and sky imagers. However, the fluctuation in the initial conditions and the limited resolution mean that the NWP numerical models cannot predict the position of the clouds accurately, nor their effects on the solar irradiance in a specific location [2,9,13]. Therefore, it is inescapable to make better forecasts by short-term measurements with high temporal and spatial resolutions.
Most of solar power plants look for reliable long-, medium-, and short-term data to estimate more accurately the amount of energy they can produce daily and thus establish energy generation strategies. In general, for these processes, irradiance sensors are used to obtain global horizontal irradiance (GHI), direct normal irradiance (DNI), and diffuse horizontal irradiance (DHI) data. However, properly calibrated and well-maintained sensors have a high cost, not only for the communication networks required to centralize and store the data, but also for the installations that must be carried out, the acquisition, and maintenance of the sensors themselves. It could be said that the forecasting of solar irradiance is a technology that allows optimizing the costs, offering a better quality of energy supplied by the electrical network, as long as the solar irradiance variation can be predicted with great accuracy [14]. The combination of these two factors (costs and quality), has been the main motivation for the development of a complex field of research that aims to make better predictions of solar irradiance values at the ground level and, thus, be able to predict output values depending on the type of technology used. The observations with terrestrial instruments that use a sky camera and record complete images of the celestial dome are a powerful tool, since they represent a great opportunity to fill the prognostic gap at a low cost of computational processing [2,15].
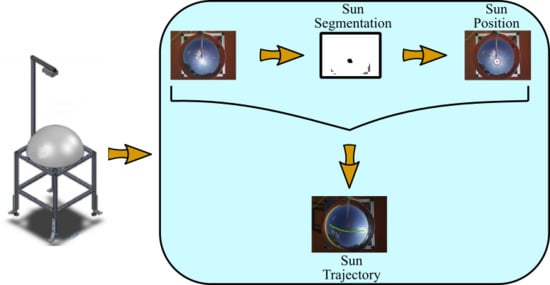
In this sense, the development of a robust and automatic Sun detection algorithm becomes an important step in the process of the forecasting of the solar resource. By knowing the Sun position with precision (solar centroid) and the cloud trajectory through the sky dome and towards the Sun (cloud vector), irradiance variance can be forecasted due to possible Sun occlusion. In this work, a low-cost solar nowcasting system based on artificial vision is proposed. With the purpose of capturing the image of the full sky reflection, the system is equipped with a dome-type convex mirror and a Raspberry Pi camera module pointing downwards. The camera acquires images every minute with a resolution of 1024 × 780 pixels; while the mirror occupies 673 × 641 pixels. To process the acquired images, a methodology addressing several challenges related to the computation of the position of the Sun has been proposed. This methodology is based on the implementation of several algorithms, which help to achieve a robust detection; since knowing the correct position of the Sun allows other processes to be carried out. For instance, knowing the position of a cloud with respect to the Sun enables us to identify if the Sun will be occluded, as well as the time it will take. In order to test this methodology, the system was installed in Aguascalientes city, Mexico ( 21 ° 51 N 102 ° 18 W).

2. Methodology

System development was achieved through an artificial vision system that analyzes Earth-sky dynamics. The prototype was designed with the intention of capturing sky dome images for detecting the position of the Sun and analyzing sky dynamics, avoiding the use of high-cost fish eye lenses, as well as expanding CMOS sensor life by avoiding overexposure to the sunlight. A robust and automatic methodology based on a digital image processing algorithm capable of identifying the position of the Sun in the images throughout the day and under different conditions has been developed. Having this information, the system will be able to estimate DHI and DNI values.

2.1. System Design

The prototype consists of a low-cost image acquisition system, based on a Raspberry-Pi camera, mounted over a highly-convex mirror that reflects the Sun and sky dome over the CMOS IMX219PQ sensor (see Figure 1).

2.2. Sun Detection

To build a system capable of estimating irradiance values based on sky images, as a first step, the correct detection of the Sun’s position in the image throughout the day is necessary. To fulfill this purpose, an image processing algorithm capable of accurately calculating the position of the Sun, through the elimination of any element different from it in the image, has been implemented.
With the proposed methodology, the system is able to perform the detection, regardless of the conditions of the day. For the above, a completely clear sky (sunny day), a partially sunny day (partial occlusions of the Sun) and a cloudy day (where in a period of time, a complete occlusion of the Sun is presented) have been analyzed. Furthermore, the system is smart enough to perform the detection without any extra information other than the image by combining several image processing algorithms. The followed methodology, as well as the implemented algorithms that compose the core of the system are detailed below.

2.2.1. Framework

The schematic overview of the proposed methodology is shown in Figure 2.
The system begins by acquiring a color image, where the algorithm executes the first process that consists of the dome’s detection, which is the region of interest (ROI), that is where the Sun should be in the image. Once this is done, the algorithm attempts to detect the Sun within the ROI, separating it from the rest of the elements in the image (also known as the segmentation process). Then, if the executed process finds the Sun, the system will store the position of the Sun in the image, the position that will be used as input to the tracking process through the particle filter. However, if the algorithm is not able to segment the Sun in the image, it is estimated through predefined and well-known equations, and this estimation is used as input to the particle filter. With this methodology, the proposed system is always able to return a position of the Sun in the image, no matter what conditions are present in the sky. This process is repeated automatically with each new image acquired by the sensor, except for the detection of the dome, which has already been performed on the first image, since it will not change its position while the system is running.
In the following sections, each of the processes followed by the proposed system are described in detail.

2.2.2. Dome Detection

In this section, the dome detection method, for the region where the Sun should be, is described.
The dome detection is carried out as follows. Let I ( m , n , p ) be the matrix, which represents an image with dimensions m × n × p , where i = 1 , 2 , , m and j = 1 , 2 , , n represent the spatial position of the pixel and k = 1 , , p is the channel. Hence, I ( i , j , k ) is a function that returns the intensity value of image I in position ( i , j ) in the k channel; in this case, the image has three channels, red, green, and blue. The image I is converted to a gray scale image G. This conversion is given by G ( i , j ) = 0.299 · I ( i , j , 1 ) + 0.587 · I ( i , j , 2 ) + 0.114 · I ( i , j , 3 ) [16].
Once the gray scale image has been computed, the system performs a noise reduction, resulting in a new image, denoted as G s ( m , n ) . The noise reduction was done through the well-known Gaussian filter. This filter works with a convolution mask with dimensions of 11 × 11 , which has the values of the center pixels weighted more (for more details about the Gaussian filter, see [17]). Then, G s ( m , n ) is binarized by an adaptive thresholding algorithm, which calculates the threshold for a small region of the image, getting different thresholds, according to its local neighborhood, for different regions of the same image. Image thresholding segments a digital image based on a certain characteristic of the pixels (for example, intensity value) based on a threshold ( t h ); that means the new pixel value will depend on if the pixel value is below or above this threshold, as follows:
B ( i , j ) = 0 if G s ( i , j ) < t h 1 if G s ( i , j ) t h
The goal is to create a binary representation of the image, let B ( m , n ) be such a representation, classifying each pixel into one of two categories, such as “dark” ( B ( i , j ) = 0 ) or “light” ( B ( i , j ) = 1 ) [18].
In order to find the dome, the system uses B ( m , n ) as the input of Algorithm 1. Here, the parameters m, n, and Δ y are also needed, m and n are the image dimensions, and Δ y is a slight vertical displacement that can take values in a range of 50–100 pixels with respect to the center of the image. What Algorithm 1 does is find the circle that best fits the dome; this circle is defined by three points, which are obtained through a search that starts at the center of the image and ends once a pixel, with a value of one, is found. The way to find the pixel is by moving along the image from the center, both to the left and to the right. As a result of this search, two of the three needed points are found. The third point is found by moving along the image to the left starting at the center, but adding a slight translation on the vertical axis (80 pixels). Having these three points, the parameters of the circle (center and radius) are computed through the procedure DomeParameters, which is composed of classical circle formulas. An example of dome detection is shown in Figure 3.
Algorithm 1 Dome detection algorithm.
1:
procedureFindDome( B ( m , n ) , Δ y , m , n )
2:
     w = n / 2
3:
     h = m / 2
4:
    first = T r u e
5:
    second = T r u e
6:
    third = T r u e
7:
    for j = 1 to ( m / 2 ) do
8:
        if B h , w j is equal to 1 and first then
9:
            P 1 = { h , w j }
10:
           first = F a l s e
11:
        end if
12:
        if B h , w + j is equal to 1 and second then
13:
            P 2 = { h , w + j }
14:
           second = F a l s e
15:
        end if
16:
        if B h Δ y , w j is equal to 1 and third then
17:
            P 3 = { h Δ y , w j }
18:
           third = F a l s e
19:
        end if
20:
        if first is equal to F a l s e and second is equal to F a l s e and third is equal to F a l s e then
21:
           break
22:
        end if
23:
    end for
24:
    ( P d o m e , r d o m e ) = DomeParameters ( P 1 , P 2 , P 3 )
25:
    return ( P d o m e , r d o m e )
26:
end procedure
 
27:
procedureDomeParameters( P 1 , P 2 , P 3 )
28:
     { x 1 , y 1 } = P 1
29:
     { x 2 , y 2 } = P 2
30:
     { x 3 , y 3 } = P 3
31:
     A = x 1 ( y 2 y 3 ) y 1 ( x 2 x 3 ) + x 2 y 3 x 3 y 2
32:
     B = ( x 1 2 + y 1 2 ) ( y 3 y 2 ) + ( x 2 2 + y 2 2 ) ( y 1 y 3 ) + ( x 3 2 + y 3 2 ) ( y 2 y 1 )
33:
     C = ( x 1 2 + y 1 2 ) ( x 2 x 3 ) + ( x 2 2 + y 2 2 ) ( x 3 x 1 ) + ( x 3 2 + y 3 2 ) ( x 1 x 2 )
34:
     D = ( x 1 2 + y 1 2 ) ( x 3 y 2 x 2 y 3 ) + ( x 2 2 + y 2 2 ) ( x 1 y 3 x 3 y 1 ) + ( x 3 2 + y 3 2 ) ( x 2 y 1 x 1 y 2 )
35:
     x d = B / 2 A
36:
     y d = C / 2 A
37:
     r d = ( B 2 + C 2 4 A D ) / 4 A 2
38:
    return ( x d , y d ) , r d
39:
end procedure
It is important to mention that this step is done only when the first image is acquired. Once the dome is detected, the system is ready to find the Sun within the ROI.

2.2.3. Clear Sky Sun Segmentation

The ideal case to make the detection of the position of the Sun is when a sunny day is presented, since there are no elements in the sky that interfere with the detection. This process is identified on the block called Sun segmentation from the diagram shown in Figure 2. The needed sequence of steps performed by the system to get the Sun’s position in the image are shown in the diagram of Figure 4.
In order to compute the Sun’s position, the system begins with a color space conversion from RGB to HSL; let H ( m , n , p ) be the new image representation. HSL is another color space, which represents the color on three channels: hue, saturation, and brightness (how bright the color is). Thus, objects with very large brightness values can be easily separated from the background in the image. From the image H ( m , n , p ) , where in this case, p = 3 , which represents the brightness channel in the image, the system performs thresholding over it and then a binarization. This threshold value is chosen based on the histogram of the image pixel intensities. From this operation, the matrix B H is obtained, this matrix contains dark values in the object zone and white values in the background.
The resulting image is shown in Figure 5b, where the objects segmented are the those with the highest brightness.
From each object found, the system computes the minimum enclosing circle to get the center, as well as the radius; let C = { c 1 ( x c 1 , y c 1 , r c 1 ) , , c n ( x c n , y c n , r c n ) } be the set of detected circles, where ( x c i , y c i ) represents the center coordinates and r c i the radius of the i th circle ( c i ). To discriminate the Sun from all those objects found in the segmentation process, Algorithm 2 has been implemented.
Algorithm 2 Sun-searching algorithm.
1:
procedureSunSearching(C, P d o m e , r d o m e , M a x S u n R a d i u s , M i n S u n R a d i u s )
2:
     n = C
3:
    for i = 1 to n do
4:
         P i , r i = c i ( x c i , y c i , r c i )
5:
         d = P i , P d o m e
6:
        if d < r d o m e and ( M i n S u n R a d i u s < r i < M a x S u n R a d i u s ) then
7:
            c S u n = c i
8:
        else
9:
            c S u n = ( 0 , 0 , 0 )
10:
        end if
11:
    end for
12:
    return c S u n
13:
end procedure
The input parameters of Algorithm 2 are the detected circles C, the center and radius of the detected dome, and a max and min radius of the Sun, which have been determined experimentally.
From the input parameters, Algorithm 2 begins by computing the cardinality of the set C (detected circles), then the algorithm iterates over each element in C, computing the distance (d) of each element (centroid of the circle) to the dome center; if the distance of an element is lower than the dome radius and the radius is between values M i n S u n R a d i u s and M a x S u n R a d i u s , then the system considers this element as one circle that could represent the Sun; otherwise, the system returns as the Sun position the point (0,0) with a radius of zero. That means, in the end, that the algorithm returns the last element that fulfills these conditions. As the output of this process, in Figure 6, a Sun detection example is shown.

2.2.4. Partially Sunny Day

The process described in Section 2.2.3 is repeated with each new image acquired by the camera.
However, it may be the case that a cloud with a brightness similar to the Sun is generated; if that happens, the system could segment two objects (the cloud and the Sun), and both objects could be within the circle that represents the dome; thus, they could be valid objects, and any of them could be considered as the Sun, or even worse, if a cloud is generated so close to the Sun such that the segmentation process generates an object that fuses these two elements, then the Sun’s position in the image would have a translation relative to the actual position. An example of this possible scenario is shown in Figure 7.
In order to deal with this problem, an object tracking algorithm based on particle filters was implemented.

Particle Filter 

Particle filters are based on probabilistic representations of states by a set of samples (particles), with the advantage of making possible the representation of a non-linear system and measurement models and multi-modal non-Gaussian density states [19,20]. The main idea of particle filters is to represent the required posterior density function by a set of random samples with associated weights and to compute estimates based on these samples and weights.
Let { x 0 : k i , ω 0 : k i } i = 0 N denote the set of samples that characterizes the a posteriori probability density function (PDF) p ( x 0 : k | z 0 : k ) , where { x 0 : k i , i = 1 , , N } is a set of points with associated weights { ω 0 : k i , i = 1 , , N } and x 0 : k = { x j , j = 0 , , k } and z 1 : k = { z j , j = 0 , , k } are the set of all states and measurements up to time k, respectively.
The weights are normalized such that i ω k i = 1 , and they can be chosen using the principle of importance sampling [21].
In the particle filter implementation, a re-sampling step has been applied. This step allows the reduction of the effects of degeneracy, observed in the basic particle filter algorithm. The basic idea is to eliminate particles that have small weights and to concentrate on particles with large weights [21].
Particle filtering provides a robust tracking framework, as it models uncertainty; besides, particle filters can deal with occlusions.

Sun’s Position Based on the Particle Filter 

After the segmentation process, the position of the Sun in the image is computed, allowing the system to use this information as an input parameter for the particle filter. By doing this, the system is able to track the Sun in each frame; then, if this position suffers an unexpected variation because it has been merged with a very close cloud, the system is capable of mitigating this change.
In Figure 8, the detection (red dot), as well as the tracking (green dot) positions of the Sun are shown.
On the other hand, from the case shown in Figure 7, in which the Sun and a cloud (that has suddenly formed very close to it) have been merged as a single object, causing the enclosing circle of this object to be such that its center moves away from the circumsolar area, the system is capable of mitigating the change, keeping the tracking position close to the circumsolar area, due to the use of the particle filter, as shown in Figure 9.
At this point, with the proposed approach, it is possible to determine the position of the Sun even in cases where there are elements in the scene that may interfere, as is the case of clouds whose intensity in the image could have values similar to the intensity of the Sun. However, it may be the case that the Sun cannot be detected because it is totally occluded by a cloud during a long period of time, for instance on a very cloudy day. To address this problem, a solution based on computing the position of the Sun through the geographical position of the prototype has been implemented.

2.2.5. Detection of the Sun on Cloudy Days

When the position of the Sun, in the image, cannot be computed due to an occlusion commonly caused by a cloud, the system attempts to approximate it through the geographical position (latitude and longitude) of the prototype. In order to do that, the Pysolar library (available at pysolar.org) has been used.
Pysolar is an online library of Python codes that implement an algorithm developed by the National Renewable Energy Laboratory (NREL) for solar position calculation [22]. The implemented algorithm is a set of fairly straightforward equations that calculate the Sun’s location in the sky at a specific time of a specific day.
In Figure 10, a set of positions of the Sun (red dots) computed by the Pysolar library on a unit sphere throughout the day are shown.
When the Sun is totally occluded by some clouds and it cannot be segmented in the image, which means that it is not possible to obtain its position, the position computed by the Pysolar library (for that specific day and time) is used. The computed point is projected onto the image and becomes the input parameter of the particle filter instead of the output of the segmentation process.
An example of the case where the Sun is occluded by some clouds is shown in Figure 11. Due to fact that the Sun’s position cannot be segmented in the image, the system estimates its position by the Pysolar library; however, once the segmentation process is capable of detecting the Sun, the system improves that approximation, since the position of the Sun given by the segmentation is much more precise.
By using this methodology, the proposed system is capable of detecting the Sun in the image, regardless of the day’s conditions. Knowing the position of the Sun at all times is a fundamental step, since from this information, a system like the one that has been proposed would be able to compute or infer other information, for instance an irradiance value.

3. Results and Discussion

To test the proposed approach, three different scenarios have been selected. These three scenarios are considered as the set of scenarios that cover all the possible conditions that may occur. In the first scenario, a full clear-sky day has been selected, in the second one, a day where a partial occlusion of the Sun in some instant of the day is present has been analyzed, and finally, for the third one, a day where in a period of time, a complete occlusion of the Sun is present, has been selected.

3.1. Scenario 1 (Sunny Day)

In this scenario, a full clear-sky day has been selected. For this scenario, a set of images taken every 15 min, from 9:00–17:00 on 8 November (i.e., from sunrise to sunset), has been analyzed. In Figure 12, three representative images of this first scenario are shown. In this case, since it is a clear-sky day, the segmentation process was able to segment the Sun in each frame.
In Figure 13, the Sun’s path throughout the day is shown, where red dots represent the position given by the segmentation process, while green dots represent the position given by the particle filter.
In order to compare these two trajectories, the distance between the resulting positions of both the segmentation process and the particle filter has been computed. Figure 14 shows a graph of the computed distance, in which is shown the average distance between these two trajectories (dashed black line), the value of which is about 8.03 pixels, as well as the standard deviation with a value that is around 2.05 pixels. Considering that the average radius of the Sun in the image was about 45.5 pixels, then it can be said that this error is not significant.

3.2. Scenario 2 (Partially Sunny Day)

In this scenario, a day in which a partial occlusion of the Sun is present has been selected. The set of analyzed data have been acquired by the sensor every 15 min, from 9:00 to 18:00 on 13 September. Figure 15 shows, as in the first case, three representative images of this scenario.
The partial occlusions of the Sun presented in this scenario are due to a cloud that formed very close to it, which caused the segmentation process to fuse the Sun and a part of the cloud as a single object; then, the calculated position is such that it is between the Sun and the cloud. In Figure 16, the trajectory during the day, as well as the partial occlusions of the Sun are shown.
As in Section 3.1, the distance between the positions given by the segmentation process and the particle filter have been computed.
In Figure 17a, three instants during the day where there is a clear difference in the position of the Sun computed by the segmentation process and the particle filter are shown. These differences become more evident when the distance between these positions are plotted, as shown in Figure 17b, in which an upper limit given by two-times the standard deviation of the distance above the mean value has been marked, and as can be seen, these points are above this limit; this means that these three points moved too far away from the average distance, an effect caused by inaccurate detection in the segmentation process (see Figure 16b–d).

3.3. Scenario 3 (Cloudy Day)

Figure 18 show the representative images of the third test scenario.
For this scenario, the images were taken from 10:00–14:00, every 15 min, on 17 August. Along this period of time, the Sun was completely occluded at several moments; one of these moments was at the beginning, as shown in Figure 18a.
In order to compute an approximate position of the Sun, the system uses the the geographical position (latitude and longitude) of the prototype to then, project this position in the image (see Figure 19).
The system attempts to follow the Sun using the computed estimated position until the system is able to segment the Sun. This is done because it is very important to know the position at any moment. However, given that the projected position is just an approximation, we improve it once the system is able to detect the Sun in the segmentation process, as is shown in Figure 20.
By adding this strategy to the system, it is possible to have an estimation of the position of the Sun in the image regardless of the occlusions generated by the clouds.
In Figure 21, the complete trajectory during the evaluated period of time is shown. It can be observed that there are some positions away from the trajectory; this is due to the cloud that was initially generating an occlusion of the Sun begins to move, so there is an instant where the Sun is partially occluded, and as a consequence, the segmentation process considers these two elements as a single one; however, by using the particle filter, the system avoids this abrupt change.
To form a better view of the performance of the system, a video in the three scenarios described above, can be seen online at Supplementary Materials https://youtu.be/HY2plwtBR-4.

3.4. Detection Accuracy

In order to test how accurate the system is, a day in which the system can always detect the Sun has been chosen, then, as reference the position given by the segmentation process, the positions generated by both the particle filter and the Pysolar model position have been compared. In Figure 22, the trajectories of the Sun given by the three proposed strategies are shown.
In Figure 23, each of the three trajectories have been plotted to clearly show their behavior. It can be observed that the estimated position (position given by the Pysolar model) diverges considerably from the trajectory of the Sun in the image, while the position given by the particle filter remains close. Nevertheless, as was mentioned before, when the system cannot segment the Sun, the only information it has is the result of the position model.
To evaluate the system quantitatively, the solar zenith angle (SZA) has been calculated as follows. From each point ( P d o m e with coordinates ( x , y ) ) of the positions of the Sun in the dome given by the segmentation process, particle filter and Pysolar model, the distance to the center of the dome has been calculated (this distance is denoted as d p in Figure 24).
Then, each of these distances is normalized by dividing them by the radius (defined as r d o m e in Figure 24) of the dome. Thus, it is possible to compute the solar zenith angle on a unit sphere according to the following expression,
S Z A i = arctan d p i / r d o m e 1 ( ( x i / r d o m e ) 2 + ( y i / r d o m e ) 2 ) , i { 1 , , N }
By doing this for the N Sun’s positions given by the segmentation process, the particle filter and the Pysolar model, the set of plots shown in the Figure 25 results.
Using the SZA of the segmentation process as the reference, the error from the SZA for both the particle filter and Pysolar model have been calculated.
As can be seen in Figure 26, the SZA given by the particle filter deviated about 0.86 ° away on average from the SZA given by the segmentation process; this indicates that the position of the particle filter remained practically in the center of the circumsolar area of the Sun. On the other hand, the SZA given by the Pysolar model was around 4.51 ° away on average from the SZA given by the segmentation process; thus, using only this information can result in significant errors in later processes, for instance the irradiance estimation.
Besides of the SZA calculation, the solar azimuth angle (SAA) has also been calculated using the following expression:
S A A i = arctan y i / r d o m e x i / r d o m e , i { 1 , , N }
Figure 27 shows the set of plots of the azimuth angles of the segmentation process, the particle filter, and the Pysolar model.
Similar to the previous case, taking as a reference the SAA of the segmentation process, the error of both the SAA of the particle filter and the SAA of the Pysolar model have been computed; in Figure 28, these errors are shown.
The behavior of the SAA errors was similar to the behavior of the SZA errors, the SAA of the particle filter having an average error of 2.47 ° while the SAA of the Pysolar model was around of 6.88 ° on average.
From the results obtained, it can be observed that clouds occluding the Sun generated the perception of changing the size of the Sun depending on the water vapor concentration of the cloud. “Thin” clouds (low water vapor concentration) tended to generate a perception of growth in the Sun size. On the other hand, when “heavy” clouds were present (high water vapor concentration), the sunlight was obstructed completely, and the Sun position could not be determined. Nevertheless, having the position of the Sun, at any moment, was crucial, and this could only be accomplished by a combination of algorithms that was ready for all the sky scenarios. In addition, mapping sky coordinates to image coordinates allowed working in a new reference system that avoided hardware errors.

4. Conclusions

A novel methodology based on the implementation of several image processing techniques to achieve a robust and automatic detection of the position of the Sun from a set of images, acquired with a low-cost artificial vision system, was proposed. The methodology allowed not only detecting the position of the Sun in a clear-sky day, but also in a cloudy one, even if the Sun was completely occluded. The proposed methodology has been tested using a set of images of three different scenarios, clear-sky day, a partially sunny day, and a cloudy day. Experimental results demonstrated that regardless of the conditions of the day, the computed position of the Sun was within the circumsolar area. It is important to mention that knowing an accurate position of the Sun at any moment allows performing other processes, for instance knowing not only the position of a cloud with respect to the position of the Sun to identify if an occlusion will occur, but also the time it will take, which is fundamental in the implementation of better solar resource assessment systems.

Supplementary Materials

A supporting video is available at: https://youtu.be/HY2plwtBR-4.

Author Contributions

Conceptualization and methodology, L.V. and M.I.P.-C.; software, L.V. and C.M.P.-M.; formal analysis, L.V., M.I.P.-C., and Daniela Moctezuma; writing, original draft preparation, L.V., D.M., and M.I.P.-C.; writing, review and editing, C.A.P.-A. and A.D.-P.

Funding

This research was partially funded by project CONACyT-Problemas Nacionales, grant number 2015-01-1651.

Acknowledgments

The authors acknowledge CONACyT for the partial financial support to the project Problemas Nacionales 2015-01-1651.

Conflicts of Interest

The authors declare no conflict of interest.

References

  1. Chauvin, R.; Nou, J.; Thil, S.; Grieu, S. Modelling the clear-sky intensity distribution using a sky imager. Sol. Energy 2015, 119, 1–17. [Google Scholar] [CrossRef]
  2. Yang, H.; Kurtz, B.; Nguyen, D.; Urquhart, B.; Chow, C.W.; Ghonima, M.; Kleissl, J. Solar irradiance forecasting using a ground-based sky imager developed at UC San Diego. Sol. Energy 2014, 103, 502–524. [Google Scholar] [CrossRef]
  3. Long, C.N.; Sabburg, J.M.; Calbó, J.; Pagès, D. Retrieving Cloud Characteristics from Ground-Based Daytime Color All-Sky Images. J. Atmos. Ocean. Technol. 2006, 23, 633–652. [Google Scholar] [CrossRef] [Green Version]
  4. Meza, F.; Varas, E. Estimation of mean monthly solar global radiation as a function of temperature. Agric. For. Meteorol. 2000, 100, 231–241. [Google Scholar] [CrossRef]
  5. Valdes-Barrón, M.; Riveros-Rosas, D.; Arancibia-Bulnes, C.; Bonifaz, R. The Solar Resource Assessment in Mexico: State of the Art. Energy Procedia 2014, 57, 1299–1308. [Google Scholar] [CrossRef] [Green Version]
  6. Igawa, N.; Koga, Y.; Matsuzawa, T.; Nakamura, H. Models of sky radiance distribution and sky luminance distribution. Sol. Energy 2004, 77, 137–157. [Google Scholar] [CrossRef]
  7. Florita, A.; Hodge, B.; Orwig, K. Identifying Wind and Solar Ramping Events. In Proceedings of the 2013 IEEE Green Technologies Conference (GreenTech), Denver, CO, USA, 4–5 April 2013; pp. 147–152. [Google Scholar]
  8. Lorenz, E.; Kühnert, J.; Heinemann, D. Short Term Forecasting of Solar Irradiance by Combining Satellite Data and Numerical Weather Predictions. In Proceedings of the 27th European Photovoltaic Solar Energy Conference and Exhibition, Frankfurt, Germany, 24–28 September 2012; pp. 4401–4405. [Google Scholar]
  9. Chow, C.W.; Urquhart, B.; Lave, M.; Dominguez, A.; Kleissl, J.; Shields, J.; Washom, B. Intra-hour forecasting with a total sky imager at the UC San Diego solar energy testbed. Sol. Energy 2011, 85, 2881–2893. [Google Scholar] [CrossRef]
  10. Reikard, G. Predicting solar radiation at high resolutions: A comparison of time series forecasts. Sol. Energy 2009, 83, 342–349. [Google Scholar] [CrossRef]
  11. Marquez, R.; Coimbra, C.F. Forecasting of global and direct solar irradiance using stochastic learning methods, ground experiments and the NWS database. Sol. Energy 2011, 85, 746–756. [Google Scholar] [CrossRef]
  12. Chu, Y.; Pedro, H.T.; Li, M.; Coimbra, C.F. Real-time forecasting of solar irradiance ramps with smart image processing. Sol. Energy 2015, 114, 91–104. [Google Scholar] [CrossRef]
  13. Marquez, R.; Coimbra, C.F. Intra-hour DNI forecasting based on cloud tracking image analysis. Sol. Energy 2013, 91, 327–336. [Google Scholar] [CrossRef]
  14. Diagne, M.; David, M.; Lauret, P.; Boland, J.; Schmutz, N. Review of solar irradiance forecasting methods and a proposition for small-scale insular grids. Renew. Sustain. Energy Rev. 2013, 27, 65–76. [Google Scholar] [CrossRef]
  15. Kurtz, B.; Kleissl, J. Measuring diffuse, direct, and global irradiance using a sky imager. Sol. Energy 2017, 141, 311–322. [Google Scholar] [CrossRef]
  16. Nguyen, R.M.H.; Brown, M.S. Why You Should Forget Luminance Conversion and Do Something Better. In Proceedings of the 2017 IEEE Conference on Computer Vision and Pattern Recognition (CVPR), Honolulu, HI, USA, 21–26 July 2017; pp. 5920–5928. [Google Scholar]
  17. Deng, G.; Cahill, L.W. An adaptive Gaussian filter for noise reduction and edge detection. In Proceedings of the 1993 IEEE Conference Record Nuclear Science Symposium and Medical Imaging Conference, San Francisco, CA, USA, 31 October–6 November 1993; Volune 3, pp. 1615–1619. [Google Scholar]
  18. Bradley, D.; Roth, G. Adaptive Thresholding using the Integral Image. J. Graph. Tools 2007, 12, 13–21. [Google Scholar] [CrossRef]
  19. Almeida, A.; Almeida, J.; Araujo, R. Real-Time Tracking of Moving Objects Using Particle Filters. In Proceedings of the IEEE International Symposium on Industrial Electronics, ISIE 2005, Dubrovnik, Croatia, 20–23 June 2005; Volume 4, pp. 1327–1332. [Google Scholar]
  20. Nummiaro, K.; Koller-Meier, E.; Gool, L.V. An adaptive color-based particle filter. Image Vis. Comput. 2003, 21, 99–110. [Google Scholar] [CrossRef] [Green Version]
  21. Arulampalam, M.S.; Maskell, S.; Gordon, N.; Clapp, T. A tutorial on particle filters for online nonlinear/non-Gaussian Bayesian tracking. IEEE Trans. Signal Process. 2002, 50, 174–188. [Google Scholar] [CrossRef] [Green Version]
  22. Reda, I.; Andreas, A. Solar position algorithm for solar radiation applications. Sol. Energy 2004, 76, 577–589. [Google Scholar] [CrossRef]
Figure 1. System prototype.
Applsci 09 01131 g001
Figure 2. Sun position detection process.
Applsci 09 01131 g002
Figure 3. Dome detection example. The input color image, as well as the dome detection are shown in (a,b), respectively.
Applsci 09 01131 g003
Figure 4. Sun segmentation based on image processing.
Applsci 09 01131 g004
Figure 5. Binarization of the image. (a) shows the input color image. (b) shows the result of the binarization.
Applsci 09 01131 g005
Figure 6. Sun detection example.
Applsci 09 01131 g006
Figure 7. Sun and cloud segmented as a single object. (b) shows the output of the segmentation process, while in (c), the resulting Sun position (red dot), as well as the enclosing circle are shown.
Applsci 09 01131 g007
Figure 8. Sun detection (red dot) and tracking (green dot).
Applsci 09 01131 g008
Figure 9. Correction of the Sun’s position through tracking.
Applsci 09 01131 g009
Figure 10. Solar position calculation made by Pysolar.
Applsci 09 01131 g010
Figure 11. Estimation of the Sun’s position when it is occluded by a cloud. (a) shows the input image where the Sun is occluded by some clouds, while in (b), the position estimation made by the Pysolar library (blue dot), as well as the position computed by the particle filter (green dot) are shown.
Applsci 09 01131 g011
Figure 12. Representative examples with full clear-sky day conditions. (a) shows an image taken at 9:00, (b) shows an image taken at 13:00, and finally, (c) shows an image taken at 17:00.
Applsci 09 01131 g012
Figure 13. Path followed by the Sun. (a) Projection of the trajectory of the Sun. (b) Trajectory of the Sun.
Applsci 09 01131 g013
Figure 14. Difference of positions between segmentation and particle filter.
Applsci 09 01131 g014
Figure 15. Representative examples where a partially sunny day is presented. (a) shows an image taken at 9:00, (b) shows an image taken at 14:30, and (c) shows an image taken at 18:00.
Applsci 09 01131 g015
Figure 16. Path followed by the Sun (Set 2). In (bd), partial occlusion of the Sun are shown.
Applsci 09 01131 g016
Figure 17. Sun trajectory and distance between trajectories.
Applsci 09 01131 g017
Figure 18. Representative examples of cloudy day conditions. (a) shows an image taken at 10:00, while (b,c) show an image taken at 12:15 and 14:00, respectively.
Applsci 09 01131 g018
Figure 19. Estimated position of the Sun. (a) shows the Sun position estimation at the beginning, and (b) shows an example of the trajectory of the Sun given by the Pysolar model (blue dots), as well as the trajectory given by the particle filter (green dots).
Applsci 09 01131 g019
Figure 20. Sun detection (red dot), estimation (blue dot), and tracking (green dot).
Applsci 09 01131 g020
Figure 21. Trajectory of the Sun during the evaluated period of time detection.
Applsci 09 01131 g021
Figure 22. Trajectory of the Sun given by the segmentation process (red dots), the particle filter (green dots), and the estimated position (blue dots), during the day.
Applsci 09 01131 g022
Figure 23. Trajectory of the Sun during a day where we can always detect it.
Applsci 09 01131 g023
Figure 24. Sun position in the dome.
Applsci 09 01131 g024
Figure 25. Solar zenith angle (SZA).
Applsci 09 01131 g025
Figure 26. Solar zenith error.
Applsci 09 01131 g026
Figure 27. Solar azimuth angle (SAA).
Applsci 09 01131 g027
Figure 28. Solar azimuth error.
Applsci 09 01131 g028