Next Issue
Volume 7, December
Previous Issue
Volume 7, June


Hydrology, Volume 7, Issue 3 (September 2020) – 32 articles

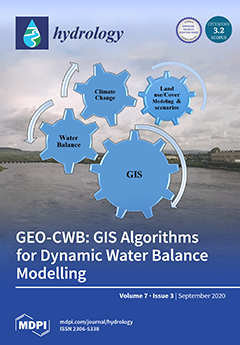
Cover Story (view full-size image): In this manuscript, we present the development of a GIS-based algorithm (GEO-CWB). GEO-CWB is designed to simulate the dynamic spatially distributed water balance on the catchment scale. GEO-CWB has a user-friendly interface and it is developed based on the integration of physical algorithms, statistical methods, and machine-learning techniques to model, predict, and project how climate and land use change affect the spatial and temporal patterns of dynamic water balance components. This manuscript also presents the application and validation of GEO-CWB on the Shannon River catchment in Ireland as an example of a large and complicated hydrological system. View this paper.
  • Issues are regarded as officially published after their release is announced to the table of contents alert mailing list.
  • You may sign up for e-mail alerts to receive table of contents of newly released issues.
  • PDF is the official format for papers published in both, html and pdf forms. To view the papers in pdf format, click on the "PDF Full-text" link, and use the free Adobe Reader to open them.
Order results
Result details
Section
Select all
Export citation of selected articles as:
21 pages, 4225 KiB  
Article
Assessment of Surface Irrigation Potential of the Dhidhessa River Basin, Ethiopia
by Meseret Dawit, Bilisummaa Dirriba Olika, Fiseha Behulu Muluneh, Olkeba Tolessa Leta and Megarsa Olumana Dinka
Hydrology 2020, 7(3), 68; https://doi.org/10.3390/hydrology7030068 - 16 Sep 2020
Cited by 13 | Viewed by 5730
Abstract
Assessing available water resources and their potential for irrigation water use is vital for sustainable agricultural development and planning. This is particularly of interest in developing countries like Ethiopia, where a small portion of largely accessible land for surface irrigation applications has been [...] Read more.
Assessing available water resources and their potential for irrigation water use is vital for sustainable agricultural development and planning. This is particularly of interest in developing countries like Ethiopia, where a small portion of largely accessible land for surface irrigation applications has been utilized, despite the majority of the population relying on agricultural productivity. This study utilized the Dhidhessa River Basin (Ethiopia) as a case study and analyzed the main challenges to balance the sustainable water resources utilization and enhance agricultural productivity of the basin. The study mainly focused on estimating the available water resources and their potential for surface irrigation water use in the basin. This was achieved by utilizing Geographic Information System (GIS)-based tools, a hydrological Soil and Water Assessment Tool (SWAT) model, and a Crop Water and Irrigation Requirements Program of FAO (CROPWAT) model. While the SWAT estimated the water availability in the basin, GIS-tools such as Model Builder were used to map the irrigation potential of the basin. For irrigation water potential assessment, we selected six crops (cabbage, maize, tomato, pepper, groundnut and sugarcane) and estimated their irrigation water requirements using the CROPWAT model. We developed the SWAT model for the period from 1986 to 2012 using the available hydro-meteorological and geo-spatial data. Due to many parameters used in the model, we first performed a parameter sensitivity analysis and identified the most essential/sensitivity parameters via Sequential Uncertainty Fitting-II (SUFI-2). The identified sensitive parameters were subsequently used for model calibration (1989–2000) and validation (2001–2012) procedures achieved via SUFI-2. SWAT was able to reproduce the observed monthly streamflow values with a coefficient of determination (R2) and Nash-Sutcliffe Coefficient (NSE) of 0.85 and 0.87 for the calibration period and 0.91 and 0.89 for the validation period, respectively. The findings generally indicated a “good” performance of the model in simulating the hydrology. The annual available water of the basin is 9.26 billion cubic meters (BCM) whereas the 70% and 80% dependable flow is 7.56 and 6.97 BCM, respectively. Based on the Model Builder of ArcGIS, the SWAT estimated available water can potentially irrigate an area of 259,028 ha for slope less than 8%, 643,162 ha for slopes less than 15% and 1,023,581 ha for slopes less than 30%. Moreover, the irrigation water requirements were calculated by the CROPWAT model for the six selected crops indicated that although the need for irrigation water varies depending on the season, the potential irrigation area of the Dhidhessa River Basin is greater than its irrigated land. Therefore, it is concluded that the basin’s surface irrigation systems need to be expanded to enhance the agricultural productivity and improve the livelihood of the basin’s communities and similar basins elsewhere. Full article
Show Figures

Figure 1

14 pages, 1168 KiB  
Article
Development and Evaluation of a Water Quality Index for the Iraqi Rivers
by Salam Hussein Ewaid, Salwan Ali Abed, Nadhir Al-Ansari and Riyadh M. Salih
Hydrology 2020, 7(3), 67; https://doi.org/10.3390/hydrology7030067 - 9 Sep 2020
Cited by 168 | Viewed by 12023
Abstract
Water quality evaluation is fundamental for water resources management. Water quality index (WQI) is an accurate and easily understandable method for assessing water quality for different purposes. In this study, the Iraqi water quality index (Iraq WQI) was constructed to be used to [...] Read more.
Water quality evaluation is fundamental for water resources management. Water quality index (WQI) is an accurate and easily understandable method for assessing water quality for different purposes. In this study, the Iraqi water quality index (Iraq WQI) was constructed to be used to evaluate the Iraqi rivers for drinking. For this purpose, some statistical techniques, experts’ advice, literature reviews, and authors’ experience were used. First, the principal component analysis (PCA) method and the modified Delphi method were used to select the most influential water quality parameters and their relative weights. Second, the quality curves of selected parameters were drawn to calculate the WQI scores basing on the water quality standards. Of twenty-seven parameters, six parameters were chosen to be within the index depending on their effect on water quality in order to reflect the specific characteristics of the Iraqi waters. The Iraq WQI was applied to the Tigris River within Baghdad as a case study and for some sites on other Iraqi rivers, and gave acceptable results. Results revealed that the statistical techniques used in this paper can be applied in all Iraqi rivers considering their specific characteristics. Based on the reliability of the Iraq WQI, there is no longer a need to use Indices designed for water for other countries. Full article
Show Figures

Figure 1

19 pages, 941 KiB  
Article
Analysis of the 2014 Wet Extreme in Bulgaria: Anomalies of Temperature, Precipitation and Terrestrial Water Storage
by Biliana Mircheva, Milen Tsekov, Ulrich Meyer and Guergana Guerova
Hydrology 2020, 7(3), 66; https://doi.org/10.3390/hydrology7030066 - 9 Sep 2020
Viewed by 2748
Abstract
Impact on the hydrology cycle is projected to be one of the most noticeable consequences of climate change. An increase in regional dry and wet extremes has already been observed, resulting in large socioeconomic losses. The 2014 wet conditions in Bulgaria present a [...] Read more.
Impact on the hydrology cycle is projected to be one of the most noticeable consequences of climate change. An increase in regional dry and wet extremes has already been observed, resulting in large socioeconomic losses. The 2014 wet conditions in Bulgaria present a valuable case study for analyzing the interaction between multiple drivers that are essential for early forecasting and warning of flood events. In this paper, time series analysis of temperature, precipitation and Terrestrial Water Storage Anomaly (TWSA) is performed and cross-correlations between observations and climate variability indices are computed for a 12-year period. In Bulgaria, a positive linear temperature trend was found with precipitation and TWSA exhibiting negative trends for the period 2003–2014. The year 2014 started with a drier and warmer than usual winter followed by five consecutive wet months from March to July. We found the following long-term variations: (1) temperature showing a local minimum in November 2014, (2) precipitation peaks in July 2014 and (3) a local TWSA maximum in December 2014. Over a 12-year period, weak to moderate negative correlations were observed between the long-term components of temperature, precipitation and TWSA. Moderate positive correlations with a 3 to 6-month lag were obtained between precipitation and TWSA long-term components. The long-term trends of temperature and precipitation from surface observations and atmospheric reanalysis showed very good alignment. Very large subseasonal precipitation residuals from observations and atmospheric reanalysis were obtained for April and September 2014. Two oscillation indices showed: (1) weak correlations with precipitation and (2) weak to moderate correlations with TWSA. Full article
(This article belongs to the Special Issue Soil Moisture: From Observations to Reanalysis and Remote Sensing)
Show Figures

Figure 1

12 pages, 4410 KiB  
Article
On the Uncertainty of the Image Velocimetry Method Parameters
by Evangelos Rozos, Panayiotis Dimitriadis, Katerina Mazi, Spyridon Lykoudis and Antonis Koussis
Hydrology 2020, 7(3), 65; https://doi.org/10.3390/hydrology7030065 - 8 Sep 2020
Cited by 22 | Viewed by 2604
Abstract
Image velocimetry is a popular remote sensing method mainly because of the very modest cost of the necessary equipment. However, image velocimetry methods employ parameters that require high expertise to select appropriate values in order to obtain accurate surface flow velocity estimations. This [...] Read more.
Image velocimetry is a popular remote sensing method mainly because of the very modest cost of the necessary equipment. However, image velocimetry methods employ parameters that require high expertise to select appropriate values in order to obtain accurate surface flow velocity estimations. This introduces considerations regarding the subjectivity introduced in the definition of the parameter values and its impact on the estimated surface velocity. Alternatively, a statistical approach can be employed instead of directly selecting a value for each image velocimetry parameter. First, probability distribution should be defined for each model parameter, and then Monte Carlo simulations should be employed. In this paper, we demonstrate how this statistical approach can be used to simultaneously produce the confidence intervals of the estimated surface velocity, reduce the uncertainty of some parameters (more specifically, the size of the interrogation area), and reduce the subjectivity. Since image velocimetry algorithms are CPU-intensive, an alternative random number generator that allows obtaining the confidence intervals with a limited number of iterations is suggested. The case study indicated that if the statistical approach is applied diligently, one can achieve the previously mentioned threefold objective. Full article
Show Figures

Figure 1

15 pages, 3123 KiB  
Article
Analysis of Groundwater Level Variations Caused by the Changes in Groundwater Withdrawals Using Long Short-Term Memory Network
by Mun-Ju Shin, Soo-Hyoung Moon, Kyung Goo Kang, Duk-Chul Moon and Hyuk-Joon Koh
Hydrology 2020, 7(3), 64; https://doi.org/10.3390/hydrology7030064 - 7 Sep 2020
Cited by 30 | Viewed by 3896
Abstract
To properly manage the groundwater resources, it is necessary to analyze the impact of groundwater withdrawal on the groundwater level. In this study, a Long Short-Term Memory (LSTM) network was used to evaluate the groundwater level prediction performance and analyze the impact of [...] Read more.
To properly manage the groundwater resources, it is necessary to analyze the impact of groundwater withdrawal on the groundwater level. In this study, a Long Short-Term Memory (LSTM) network was used to evaluate the groundwater level prediction performance and analyze the impact of the change in the amount of groundwater withdrawal from the pumping wells on the change in the groundwater level in the nearby monitoring wells located in Jeju Island, Korea. The Nash–Sutcliffe efficiency between the observed and simulated groundwater level was over 0.97. Therefore, the groundwater prediction performance of LSTM was remarkably high. If the groundwater level is simulated on the assumption that the future withdrawal amount is reduced by 1/3 of the current groundwater withdrawal, the range of the maximum rise of the groundwater level would be 0.06–0.13 m compared to the current condition. In addition, assuming that no groundwater is taken, the range of the maximum increase in the groundwater level would be 0.11–0.38 m more than the current condition. Therefore, the effect of groundwater withdrawal on the groundwater level in this area was exceedingly small. The method and results can be used to develop new groundwater withdrawal sources for the redistribution of groundwater withdrawals. Full article
(This article belongs to the Special Issue Integrated Surface Water and Groundwater Analysis)
Show Figures

Figure 1

26 pages, 7925 KiB  
Article
An Evaluation of Statistical Downscaling Techniques for Simulating Daily Rainfall Occurrences in the Upper Ping River Basin
by Sirikanya Cheevaprasert, Rajeshwar Mehrotra, Sansarith Thianpopirug and Nutchanart Sriwongsitanon
Hydrology 2020, 7(3), 63; https://doi.org/10.3390/hydrology7030063 - 2 Sep 2020
Cited by 2 | Viewed by 2468
Abstract
This study presents an exhaustive evaluation of the performance of three statistical downscaling techniques for generating daily rainfall occurrences at 22 rainfall stations in the upper Ping river basin (UPRB), Thailand. The three downscaling techniques considered are the modified Markov model (MMM), a [...] Read more.
This study presents an exhaustive evaluation of the performance of three statistical downscaling techniques for generating daily rainfall occurrences at 22 rainfall stations in the upper Ping river basin (UPRB), Thailand. The three downscaling techniques considered are the modified Markov model (MMM), a stochastic model, and two variants of regression models, statistical models, one with single relationship for all days of the year (RegressionYrly) and the other with individual relationships for each of the 366 days (Regression366). A stepwise regression is applied to identify the significant atmospheric (ATM) variables to be used as predictors in the downscaling models. Aggregated wetness state indicators (WIs), representing the recent past wetness state for the previous 30, 90 or 365 days, are also considered as additional potential predictors since they have been effectively used to represent the low-frequency variability in the downscaled sequences. Grouping of ATM and all possible combinations of WI is used to form eight predictor sets comprising ATM, ATM-WI30, ATM-WI90, ATM-WI365, ATM-WI30&90, ATM-WI30&365, ATM-WI90&365 and ATM-WI30&90&365. These eight predictor sets were used to run the three downscaling techniques to create 24 combination cases. These cases were first applied at each station individually (single site simulation) and thereafter collectively at all sites (multisite simulations) following multisite downscaling models leading to 48 combination cases in total that were run and evaluated. The downscaling models were calibrated using atmospheric variables from the National Centers for Environmental Prediction (NCEP) reanalysis database and validated using representative General Circulation Models (GCM) data. Identification of meaningful predictors to be used in downscaling, calibration and setting up of downscaling models, running all 48 possible predictor combinations and a thorough evaluation of results required considerable efforts and knowledge of the research area. The validation results show that the use of WIs remarkably improves the accuracy of downscaling models in terms of simulation of standard deviations of annual, monthly and seasonal wet days. By comparing the overall performance of the three downscaling techniques keeping common sets of predictors, MMM provides the best results of the simulated wet and dry spells as well as the standard deviation of monthly, seasonal and annual wet days. These findings are consistent across both single site and multisite simulations. Overall, the MMM multisite model with ATM and wetness indicators provides the best results. Upon evaluating the combinations of ATM and sets of wetness indicators, ATM-WI30&90 and ATM-WI30&365 were found to perform well during calibration in reproducing the overall rainfall occurrence statistics while ATM-WI30&365 was found to significantly improve the accuracy of monthly wet spells over the region. However, these models perform poorly during validation at annual time scale. The use of multi-dimension bias correction approaches is recommended for future research. Full article
(This article belongs to the Special Issue Climate Change Effects on Water Resources Management)
Show Figures

Figure 1

17 pages, 1598 KiB  
Article
Assessing the Robustness of Pan Evaporation Models for Estimating Reference Crop Evapotranspiration during Recalibration at Local Conditions
by Konstantinos Babakos, Dimitris Papamichail, Panagiotis Tziachris, Vassilios Pisinaras, Kleoniki Demertzi and Vassilis Aschonitis
Hydrology 2020, 7(3), 62; https://doi.org/10.3390/hydrology7030062 - 1 Sep 2020
Cited by 6 | Viewed by 3072
Abstract
A classic method for assessing the reference crop evapotranspiration (ETo) is the pan evaporation (Epan) method that uses Epan measurements and pan coefficient (kp) models, which can be functions of relative humidity (RH), wind speed (u [...] Read more.
A classic method for assessing the reference crop evapotranspiration (ETo) is the pan evaporation (Epan) method that uses Epan measurements and pan coefficient (kp) models, which can be functions of relative humidity (RH), wind speed (u2), and temperature (T). The aim of this study is to present a methodology for evaluating the robustness of regression coefficients associated to climate parameters (RH, u2, and T) in pan method models during recalibration at local conditions. Two years of daily data from April to October (warm season) of meteorological parameters, Epan measurements from class A pan evaporimeter and ETo estimated by ASCE-standardized method for the climatic conditions of Thessaloniki (Greece, semi-arid environment), were used. The regression coefficients of six general nonlinear (NLR) regression Epan models were analyzed through recalibration using a technique called “random cross-validation nonlinear regression RCV-NLR” that produced 1000 random splits of the initial dataset into calibration and validation sets using a constant proportion (70% and 30%, respectively). The variance of the regression coefficients was analyzed based on the 95% interval of the highest posterior density distribution. NLR models that included coefficients with a 95% HPD interval that fluctuates in both positive and negative values were considered nonrobust. The machine-learning technique of random forests (RF) was also used to build a RF model that includes Epan, u2, RH, and T parameters. This model was used as a benchmark for evaluating the predictive accuracy of NLR models but, also, for assessing the relative importance of the predictor climate variables if they were all included in one NLR model. The findings of this study indicated that locally calibrated NLR functions that use only the Epan parameter presented better results, while the inclusion of additional climate parameters was redundant and led to underfitting. Full article
(This article belongs to the Special Issue Technological Advances in Hydroclimatic Observations)
Show Figures

Graphical abstract

16 pages, 1699 KiB  
Article
Evaluating Mulch Cover with Coir Dust and Cover Crop with Palma Cactus as Soil and Water Conservation Techniques for Semiarid Environments: Laboratory Soil Flume Study under Simulated Rainfall
by Abelardo A.A. Montenegro, Thayná A.B. Almeida, Cleene A. de Lima, João R.C.B. Abrantes and João L.M.P. de Lima
Hydrology 2020, 7(3), 61; https://doi.org/10.3390/hydrology7030061 - 20 Aug 2020
Cited by 3 | Viewed by 2660
Abstract
This paper aims to investigate the performance of mulch cover with coir dust (Cocos nucifera L.) and cover crop with Palma cactus (Opuntia ficus indica Mill.) as soil and water conservation techniques, in a laboratory soil flume under simulated rainfall. Palma [...] Read more.
This paper aims to investigate the performance of mulch cover with coir dust (Cocos nucifera L.) and cover crop with Palma cactus (Opuntia ficus indica Mill.) as soil and water conservation techniques, in a laboratory soil flume under simulated rainfall. Palma cactus plants oriented at 90° and 30° angles with the slope direction were considered. Simulations comprised uniform advanced and delayed rainfall patterns. Runoff hydrographs and soil loss were monitored at the downstream end of the flume. Soil moisture and flow velocity were measured, and several hydraulic parameters of runoff were estimated. Results show that both mulch cover with coir dust and cover crop with Palma cactus were effective in reducing runoff and soil loss and increasing soil moisture content, thus being both suitable soil and water conservation techniques for semiarid environments. Coir dust was more effective than Palma cactus. Palma cactus oriented at a 90° angle was slightly more effective than Palma cactus oriented at a 30° angle. Differences between advanced and delayed rainfall patterns on the hydrological and erosive response were more pronounced for the mulch cover condition, where no runoff and soil loss were observed at the downstream end of the flume for the advanced rainfall pattern. Full article
Show Figures

Figure 1

30 pages, 12423 KiB  
Article
Seepage Velocity: Large Scale Mapping and the Evaluation of Two Different Aquifer Conditions (Silty Clayey and Sandy)
by Qais Al-Madhlom, Nadhir Al-Ansari, Bashar Abid Hamza, Jan Laue and Hussain Musa Hussain
Hydrology 2020, 7(3), 60; https://doi.org/10.3390/hydrology7030060 - 18 Aug 2020
Cited by 6 | Viewed by 7166
Abstract
Seepage velocity is a very important criterion in infrastructure construction. The planning of numerous large infrastructure projects requires the mapping of seepage velocity at a large scale. To date, however, no reliable approach exists to determine seepage velocity at such a scale. This [...] Read more.
Seepage velocity is a very important criterion in infrastructure construction. The planning of numerous large infrastructure projects requires the mapping of seepage velocity at a large scale. To date, however, no reliable approach exists to determine seepage velocity at such a scale. This paper presents a tool within ArcMap/Geographic Information System (GIS) software that can be used to map the seepage velocity at a large scale. The resultant maps include both direction and magnitude mapping of the seepage velocity. To verify the GIS tool, this study considered two types of aquifer conditions in two regions in Iraq: silty clayey (Babylon province) and sandy (Dibdibba in Karbala province). The results indicate that, for Babylon province, the groundwater flows from the northwest to southeast with a seepage velocity no more than 0.19 m/d; for the Dibdibba region, the groundwater flows from the west to the east with a seepage velocity not exceeding 0.27 m/d. The effectiveness of the presented tool in depicting the seepage velocity was thus demonstrated. The accuracy of the resultant maps depends on the resolution of the four essential maps (groundwater elevation head, effective porosity, saturated thickness, and transmissivity) and locations of wells that are used to collect the data. Full article
Show Figures

Figure 1

24 pages, 5683 KiB  
Article
Long-Term Groundwater Level Prediction Model Based on Hybrid KNN-RF Technique
by Omar Haji Kombo, Santhi Kumaran, Yahya H. Sheikh, Alastair Bovim and Kayalvizhi Jayavel
Hydrology 2020, 7(3), 59; https://doi.org/10.3390/hydrology7030059 - 18 Aug 2020
Cited by 49 | Viewed by 6235
Abstract
Reliable seasonal prediction of groundwater levels is not always possible when the quality and the amount of available on-site groundwater data are limited. In the present work, a hybrid K-Nearest Neighbor-Random Forest (KNN-RF) is used for the prediction of variations in groundwater levels [...] Read more.
Reliable seasonal prediction of groundwater levels is not always possible when the quality and the amount of available on-site groundwater data are limited. In the present work, a hybrid K-Nearest Neighbor-Random Forest (KNN-RF) is used for the prediction of variations in groundwater levels (L) of an aquifer with the groundwater relatively close to the surface (<10 m) is proposed. First, the time-series smoothing methods are applied to improve the quality of groundwater data. Then, the ensemble K-Nearest Neighbor-Random Forest (KNN-RF) model is treated using hydro-climatic data for the prediction of variations in the levels of the groundwater tables up to three months ahead. Climatic and groundwater data collected from eastern Rwanda were used for validation of the model on a rolling window basis. Potential predictors were: the observed daily mean temperature (T), precipitation (P), and daily maximum solar radiation (S). Previous day’s precipitation P (t − 1), solar radiation S (t), temperature T (t), and groundwater level L (t) showed the highest variation in the fluctuations of the groundwater tables. The KNN-RF model presents its results in an intelligible manner. Experimental results have confirmed the high performance of the proposed model in terms of root mean square error (RMSE), mean absolute error (MAE), Nash–Sutcliffe (NSE), and coefficient of determination (R2). Full article
Show Figures

Figure 1

29 pages, 4037 KiB  
Article
Variations in Canopy Cover and Its Relationship with Canopy Water and Temperature in the Miombo Woodland Based on Satellite Data
by Henry Zimba, Miriam Coenders-Gerrits, Banda Kawawa, Hubert Savenije, Imasiku Nyambe and Hessel Winsemius
Hydrology 2020, 7(3), 58; https://doi.org/10.3390/hydrology7030058 - 16 Aug 2020
Cited by 3 | Viewed by 4269
Abstract
Understanding the canopy cover relationship with canopy water content and canopy temperature in the Miombo ecosystem is important for studying the consequences of climate change. To better understand these relationships, we studied the satellite data-based land surface temperature (LST) as proxy for canopy [...] Read more.
Understanding the canopy cover relationship with canopy water content and canopy temperature in the Miombo ecosystem is important for studying the consequences of climate change. To better understand these relationships, we studied the satellite data-based land surface temperature (LST) as proxy for canopy temperature, leaf area index (LAI), and the normalized difference vegetation index (NDVI) as proxies for canopy cover. Meanwhile, the normalized difference infrared index (NDII) was used as a proxy for canopy water content. We used several statistical approaches including the correlated component regression linear model (CCR.LM) to understand the relationships. Our results showed that the most determinant factor of variations in the canopy cover was the interaction between canopy water content (i.e., NDII) and canopy temperature (i.e., LST) with coefficients of determination (R2) ranging between 0.67 and 0.96. However, the coefficients of estimates showed the canopy water content (i.e., NDII) to have had the largest percentage of the interactive effect on the variations in canopy cover regardless of the proxy used i.e., LAI or NDVI. From 2009–2018, the NDII (proxy for canopy water content) showed no significant (at alpha level 0.05) trend. However, there was a significant upward trend in LST (proxy for canopy temperature) with a magnitude of 0.17 °C/year. Yet, the upward trend in LST did not result in significant (at alpha level 0.05) downward changes in canopy cover (i.e., proxied by LAI and NDVI). This result augments the observed least determinant factor characterization of temperature (i.e., LST) on the variations in canopy cover as compared to the vegetation water content (i.e., NDII). Full article
Show Figures

Figure 1

51 pages, 39222 KiB  
Article
Flow Topology in the Confluence of an Open Channel with Lateral Drainage Pipe
by Mohammad Nazari-Sharabian, Moses Karakouzian and Donald Hayes
Hydrology 2020, 7(3), 57; https://doi.org/10.3390/hydrology7030057 - 15 Aug 2020
Cited by 8 | Viewed by 3075
Abstract
The purpose of this paper is to develop design guidelines for flood control channel height in the vicinity of the confluence of a submerged drainage pipe and a flood control channel. The water exchange in the confluence of an open channel with a [...] Read more.
The purpose of this paper is to develop design guidelines for flood control channel height in the vicinity of the confluence of a submerged drainage pipe and a flood control channel. The water exchange in the confluence of an open channel with a lateral drainage pipe produces unique hydraulic characteristics, ultimately affecting the water surface elevation in the channel. An accurate prediction of the water surface elevation is essential in the successful design of a high-velocity channel. By performing several experiments, and utilizing a numerical model (FLOW-3D), this study investigated the impact of submerged lateral drainage pipe discharges into rectangular open channels on flow topology in the confluence hydrodynamics zone (CHZ). The experiments were conducted in different flume and junction configurations and flow conditions. Moreover, the simulations were performed on actual size channels with different channel, pipe, and junction configurations and flow conditions. The flow topology in the CHZ was found to be highly influenced by the junction angle, as well as the momentum ratios of the channel flow and the pipe flow. The findings of this study were used to develop conservative design curves for channel confluences with lateral drainage pipe inlets. The curves can be used to estimate water surface elevation rise in different channel and pipe configurations with different flow conditions to determine the channel wall heights required to contain flows in the vicinity of laterals. Full article
Show Figures

Figure 1

3 pages, 181 KiB  
Editorial
Advances in Flood Early Warning: Ensemble Forecast, Information Dissemination and Decision-Support Systems
by Haiyun Shi, Erhu Du, Suning Liu and Kwok-Wing Chau
Hydrology 2020, 7(3), 56; https://doi.org/10.3390/hydrology7030056 - 13 Aug 2020
Cited by 4 | Viewed by 3748
Abstract
Floods are usually highly destructive, which may cause enormous losses to lives and property. It is, therefore, important and necessary to develop effective flood early warning systems and disseminate the information to the public through various information sources, to prevent or at least [...] Read more.
Floods are usually highly destructive, which may cause enormous losses to lives and property. It is, therefore, important and necessary to develop effective flood early warning systems and disseminate the information to the public through various information sources, to prevent or at least mitigate the flood damages. For flood early warning, novel methods can be developed by taking advantage of the state-of-the-art techniques (e.g., ensemble forecast, numerical weather prediction, and service-oriented architecture) and data sources (e.g., social media), and such developments can offer new insights for modeling flood disasters, including facilitating more accurate forecasts, more efficient communication, and more timely evacuation. The present Special Issue aims to collect the latest methodological developments and applications in the field of flood early warning. More specifically, we collected a number of contributions dealing with: (1) an urban flash flood alert tool for megacities; (2) a copula-based bivariate flood risk assessment; and (3) an analytic hierarchy process approach to flash flood impact assessment. Full article
18 pages, 2396 KiB  
Article
Temporal Variability of Temperature Extremes in the Sardinia Region (Italy)
by Tommaso Caloiero and Ilaria Guagliardi
Hydrology 2020, 7(3), 55; https://doi.org/10.3390/hydrology7030055 - 11 Aug 2020
Cited by 4 | Viewed by 2691
Abstract
In this paper, the temporal tendencies of temperature data from the island of Sardinia (Italy) were analyzed by considering 48 data series in the period 1982–2011. In particular, monthly temperatures (maximum and minimum), and some indices of daily extremes were evaluated and tested [...] Read more.
In this paper, the temporal tendencies of temperature data from the island of Sardinia (Italy) were analyzed by considering 48 data series in the period 1982–2011. In particular, monthly temperatures (maximum and minimum), and some indices of daily extremes were evaluated and tested to detect trends using the Mann-Kendall non-parametric test. Results showed a positive trend in the spring months and a marked negative trend in the autumn-winter months for minimum temperatures. As regards maximum temperatures, almost all months showed positive trends, although an opposite behavior was detected in September and in the winter months. With respect to the extreme indices, a general increasing trend of the series was detected for the diurnal temperature range (DTR), frost days (FD), summer days (SU25), warm (WSDI) and cold (CSDI) spells. As regards tropical nights (TR20), an equal distribution of positive and negative trends has emerged. Results of the spatial analysis performed on the trend marks suggested that Sardinia’s topography could influence temperature variability. Full article
Show Figures

Figure 1

26 pages, 4401 KiB  
Article
Susceptibility of Water Resources and Hydropower Production to Climate Change in the Tropics: The Case of Lake Malawi and Shire River Basins, SE Africa
by Lucy Mtilatila, Axel Bronstert, Pallav Shrestha, Peter Kadewere and Klaus Vormoor
Hydrology 2020, 7(3), 54; https://doi.org/10.3390/hydrology7030054 - 7 Aug 2020
Cited by 14 | Viewed by 5155
Abstract
The sensitivity of key hydrologic variables and hydropower generation to climate change in the Lake Malawi and Shire River basins is assessed. The study adapts the mesoscale Hydrological Model (mHM) which is applied separately in the Upper Lake Malawi and Shire River basins. [...] Read more.
The sensitivity of key hydrologic variables and hydropower generation to climate change in the Lake Malawi and Shire River basins is assessed. The study adapts the mesoscale Hydrological Model (mHM) which is applied separately in the Upper Lake Malawi and Shire River basins. A particular Lake Malawi model, which focuses on reservoir routing and lake water balance, has been developed and is interlinked between the two basins. Climate change projections from 20 Coordinated Regional Climate Downscaling Experiment (CORDEX) models for Africa based on two scenarios (RCP4.5 and RCP8.5) for the periods 2021–2050 and 2071–2100 are used. An annual temperature increase of 1 °C decreases mean lake level and outflow by 0.3 m and 17%, respectively, signifying the importance of intensified evaporation for Lake Malawi’s water budget. Meanwhile, a +5% (−5%) deviation in annual rainfall changes mean lake level by +0.7 m (−0.6 m). The combined effects of temperature increase and rainfall decrease result in significantly lower flows in the Shire River. The hydrological river regime may change from perennial to seasonal with the combination of annual temperature increase and precipitation decrease beyond 1.5 °C (3.5 °C) and −20% (−15%). The study further projects a reduction in annual hydropower production between 1% (RCP8.5) and 2.5% (RCP4.5) during 2021–2050 and between 5% (RCP4.5) and 24% (RCP8.5) during 2071–2100. The results show that it is of great importance that a further development of hydro energy on the Shire River should take into account the effects of climate change, e.g., longer low flow periods and/or higher discharge fluctuations, and thus uncertainty in the amount of electricity produced. Full article
Show Figures

Figure 1

21 pages, 3424 KiB  
Article
Hydrochemical Characterization and Suitability Assessment of Groundwater Quality in the Saboba and Chereponi Districts, Ghana
by Larry Pax Chegbeleh, Delali Kwasi Aklika and Bismark Awinbire Akurugu
Hydrology 2020, 7(3), 53; https://doi.org/10.3390/hydrology7030053 - 6 Aug 2020
Cited by 15 | Viewed by 2975
Abstract
Hydrochemical data of groundwater samples obtained from the mudstones, sandstones, and siltstones aquifer units that underlie the study area have been characterized. The aim of this study was to assess the suitability of groundwater for drinking, domestic, and agricultural purposes. The physico-chemical parameters [...] Read more.
Hydrochemical data of groundwater samples obtained from the mudstones, sandstones, and siltstones aquifer units that underlie the study area have been characterized. The aim of this study was to assess the suitability of groundwater for drinking, domestic, and agricultural purposes. The physico-chemical parameters were initially compared with the World Health Organization (WHO) standards for potable water. They were further subjected to various hydrochemical techniques to assess the overall water quality for drinking purposes. Conventional methods of assessing irrigation water suitability were also adopted. The results indicate that, with the exception of HCO3 characterized as unsuitable for drinking water, most of the parameters are within the WHO permissible limits and are thus characterized as suitable for drinking water. A few samples however show slight deviation. The results also show that the abundance of major cations in groundwater is in the order: Na+ > Ca2+ > Mg2+ > K+. However, the abundance of the major anions is in the order: HCO3 > Cl > SO42. Na-HCO3 is thus inferred as the dominant water type in the area. Analyses of the overall Water Quality Index (WQI) and irrigation water assessment indices suggest that groundwater in the area is generally suitable for drinking, domestic, and irrigation purposes. Full article
Show Figures

Figure 1

25 pages, 6732 KiB  
Article
Use of Teleconnections to Predict Western Australian Seasonal Rainfall Using ARIMAX Model
by Farhana Islam and Monzur Alam Imteaz
Hydrology 2020, 7(3), 52; https://doi.org/10.3390/hydrology7030052 - 5 Aug 2020
Cited by 15 | Viewed by 3028
Abstract
Increased demand for engineering propositions to forecast rainfall events in an area or region has resulted in developing different rainfall prediction models. Interestingly, rainfall is a very complicated natural system that requires consideration of various attributes. However, regardless of the predictability performance, easy [...] Read more.
Increased demand for engineering propositions to forecast rainfall events in an area or region has resulted in developing different rainfall prediction models. Interestingly, rainfall is a very complicated natural system that requires consideration of various attributes. However, regardless of the predictability performance, easy to use models have always been welcomed over the complex and ambiguous alternatives. This study presents the development of Auto–Regressive Integrated Moving Average models with exogenous input (ARIMAX) to forecast autumn rainfall in the South West Division (SWD) of Western Australia (WA). Climate drivers such as Indian Ocean Dipole (IOD) and El Nino Southern Oscillation (ENSO) were used as predictors. Eight rainfall stations with 100 years of continuous data from two coastal regions (south coast and north coast) were selected. In the south coast region, Albany (0,1,1) with exogenous input DMIOct–Nino3Nov, and Northampton (0,1,1) with exogenous input DMIJan–Nino3Nov were able to forecast autumn rainfall 4 months and 2 months in advance, respectively. Statistical performance of the ARIMAX model was compared with the multiple linear regression (MLR) model, where for calibration and validation periods, the ARIMAX model showed significantly higher correlations (0.60 and 0.80, respectively), compared to the MLR model (0.44 and 0.49, respectively). It was evident that the ARIMAX model can predict rainfall up to 4 months in advance, while the MLR has shown strict limitation of prediction up to 1 month in advance. For WA, the developed ARIMAX model can help to overcome the difficulty in seasonal rainfall prediction as well as its application can make an invaluable contribution to stakeholders’ economic preparedness plans. Full article
Show Figures

Figure 1

14 pages, 1632 KiB  
Article
A GIS-Based Multicriteria Analysis in Modeling Optimum Sites for Rainwater Harvesting
by Khamis Sayl, Ammar Adham and Coen J. Ritsema
Hydrology 2020, 7(3), 51; https://doi.org/10.3390/hydrology7030051 - 5 Aug 2020
Cited by 30 | Viewed by 4610
Abstract
In order to select suitable rainwater harvesting sites within the study area, rainwater harvesting criteria needed to be determined, defined, and structured. Several criteria played an important role in selecting the most suitable rainwater harvesting sites. A multicriteria analysis (MCA) approach, which is [...] Read more.
In order to select suitable rainwater harvesting sites within the study area, rainwater harvesting criteria needed to be determined, defined, and structured. Several criteria played an important role in selecting the most suitable rainwater harvesting sites. A multicriteria analysis (MCA) approach, which is widely used to classify potential rainwater harvesting sites, was chosen to help select potential sites in the Wadi Horan region of Iraq. An MCA approach offered a systematic methodology focused on mathematics as well as professional expertise to organize and evaluate complex decisions. Unfortunately, there is no method for choosing among them the most appropriate for a given decision problem, as the choice remains a subjective task. This study used a geographic information system (GIS)-based approach with remote sensing to identify the optimal sites for rainwater harvesting. Four indices: evaporation, cost–benefit, sediment, and hydrology were selected in order to compare the potential sites. The analytic hierarchy process (AHP), fuzzy AHP, and rank order method (ROM) were used to assign weight to the study criteria. The results were then compared using a statistical (variance inverse (VI)) method. A sensitivity analysis was done to test the uncertainties and robustness of the results for each method. The results showed that the ROM and VI methods affected the ranking priority and considered all of the criteria that were sensitive to impact in the ranking process at the different levels compared to the methods of AHP and fuzzy AHP. Full article
Show Figures

Figure 1

27 pages, 6808 KiB  
Article
Modelling Actual Evapotranspiration Seasonal Variability by Meteorological Data-Based Models
by Mirka Mobilia, Marius Schmidt and Antonia Longobardi
Hydrology 2020, 7(3), 50; https://doi.org/10.3390/hydrology7030050 - 2 Aug 2020
Cited by 7 | Viewed by 3419
Abstract
This study aims at illustrating a methodology for predicting monthly scale actual evapotranspiration losses only based on meteorological data, which mimics the evapotranspiration intra-annual dynamic. For this purpose, micrometeorological data at the Rollesbroich and Bondone mountain sites, which are energy-limited systems, and the [...] Read more.
This study aims at illustrating a methodology for predicting monthly scale actual evapotranspiration losses only based on meteorological data, which mimics the evapotranspiration intra-annual dynamic. For this purpose, micrometeorological data at the Rollesbroich and Bondone mountain sites, which are energy-limited systems, and the Sister site, a water-limited system, have been analyzed. Based on an observed intra-annual transition between dry and wet states governed by a threshold value of net radiation at each site, an approach that couples meteorological data-based potential evapotranspiration and actual evapotranspiration relationships has been proposed and validated against eddy covariance measurements, and further compared to two well-known actual evapotranspiration prediction models, namely the advection-aridity and the antecedent precipitation index models. The threshold approach improves the intra-annual actual evapotranspiration variability prediction, particularly during the wet state periods, and especially concerning the Sister site, where errors are almost four times smaller compared to the basic models. To further improve the prediction within the dry state periods, a calibration of the Priestley-Taylor advection coefficient was necessary. This led to an error reduction of about 80% in the case of the Sister site, of about 30% in the case of Rollesbroich, and close to 60% in the case of Bondone Mountain. For cases with a lack of measured data of net radiation and soil heat fluxes, which are essential for the implementation of the models, an application derived from empirical relationships is discussed. In addition, the study assessed whether this variation from meteorological data worsened the prediction performances of the models. Full article
(This article belongs to the Special Issue Soil Water Balance)
Show Figures

Figure 1

20 pages, 6596 KiB  
Article
Hydrogeological Characterization of the Thyspunt Area, Eastern Cape Province, South Africa
by Seeke C. Mohuba, Tamiru A. Abiye, Molla B. Demlie and Moneri. J. Modiba
Hydrology 2020, 7(3), 49; https://doi.org/10.3390/hydrology7030049 - 31 Jul 2020
Cited by 7 | Viewed by 3914
Abstract
This paper presents a comprehensive hydrogeological investigation that involves field work, aquifer test, hydrogeochemical analysis, environmental isotope analysis, and interpretations around a proposed nuclear power facility in South Africa. The study was undertaken to test the complementarity of the various methods in the [...] Read more.
This paper presents a comprehensive hydrogeological investigation that involves field work, aquifer test, hydrogeochemical analysis, environmental isotope analysis, and interpretations around a proposed nuclear power facility in South Africa. The study was undertaken to test the complementarity of the various methods in the coastal aquifer and to verify the hydrogeological conditions within and around the site. The study revealed the presence of two types of aquifers: an upper primary aquifer made up of the Cenozoic deposits of the Algoa Group, and a deeper fractured aquifer made of the Palaezoic Table Mountain Group (TMG) metasedimentary rocks. Owing to ductile deformation in the form of folding, the fractured quartzite and shale aquifers resulted in an artesian condition, often characterized by slightly acidic (pH ≤ 6) and iron-rich groundwater. The most important hydrogeochemical processes responsible for the observed changes in the hydrochemical composition and facies are mineral dissolution, ion exchange and mixing. The environmental isotope results suggest that all groundwater samples are characterized by a depleted δ18O and δ2H signal, indicating high latitude moisture source (southern polar region) and recharge from rainfall, with no or minimal evaporation before and during infiltration. Similarities in the stable isotope signatures between the deeper and shallow aquifer confirm the presence of a strong hydraulic link. The residence time of groundwater in the aquifers underlying the proposed nuclear power plant is estimated using tritium (3H) and 14C, and the results indicate that in the shallow aquifer it ranges from recent recharge to 50 years, and in the deeper aquifer, it ranges from 430 ± 5 years to 1000 ± 10 years, which exists in a quasi-pristine condition. Full article
Show Figures

Figure 1

21 pages, 6326 KiB  
Article
The Applicability of the Cosmic Ray Neutron Sensor to Simultaneously Monitor Soil Water Content and Biomass in an Acacia mearnsii Forest
by Thigesh Vather, Colin S. Everson and Trenton E. Franz
Hydrology 2020, 7(3), 48; https://doi.org/10.3390/hydrology7030048 - 31 Jul 2020
Cited by 19 | Viewed by 4046
Abstract
Soil water content is an important hydrological parameter, which is difficult to measure at a field scale due to its spatial and temporal heterogeneity. The Cosmic Ray Neutron Sensor (CRNS) is a novel and innovative approach to estimate area-averaged soil water content at [...] Read more.
Soil water content is an important hydrological parameter, which is difficult to measure at a field scale due to its spatial and temporal heterogeneity. The Cosmic Ray Neutron Sensor (CRNS) is a novel and innovative approach to estimate area-averaged soil water content at an intermediate scale, which has been implemented across the globe. The CRNS is moderated by all hydrogen sources within its measurement footprint. In order to isolate the soil water content signal from the neutron intensity, the other sources of hydrogen need to be accounted for. The CRNS’s applications are not only limited to soil water content estimation, as it can potentially be used to monitor biomass. The Two-Streams clear-felling provided the unique opportunity to monitor the cosmic ray neutron intensities before, during, and after the clear-felling. The cadmium-difference method was used to obtain the pure thermal and epithermal neutron intensities from the bare and moderated detectors. The study concluded that the presence of biomass within the site reduced the epithermal neutron intensity by 12.43% and the N0 value by 13.8%. The use of the neutron ratio to monitor biomass was evaluated and changes in the neutron ratio coincided with biomass changes and resulted in a high correlation (R2 of 0.868) with the normalized difference vegetation index (NDVI) and (R2 of 0.817) leaf area index (LAI). The use of the CRNS to simultaneously monitor soil water content and biomass will be beneficial in providing more reliable soil water content estimates, provide biomass estimates at a field scale, and aid in understanding the dynamics between soil water content and vegetation. Full article
Show Figures

Figure 1

18 pages, 2230 KiB  
Article
Assessing the Performance of Different Time of Concentration Equations in Urban Ungauged Watersheds: Case Study of Cartagena de Indias, Colombia
by Álvaro González-Álvarez, José Molina-Pérez, Brandon Meza-Zúñiga, Orlando M. Viloria-Marimón, Kibrewossen Tesfagiorgis and Javier A. Mouthón-Bello
Hydrology 2020, 7(3), 47; https://doi.org/10.3390/hydrology7030047 - 25 Jul 2020
Cited by 8 | Viewed by 5618
Abstract
In ungauged watersheds, the estimation of the time of concentration (Tc) is always a challenging task due to the intrinsic uncertainty involved when making assumptions. Given that Tc is one of the main inputs in a hydrological analysis for the design [...] Read more.
In ungauged watersheds, the estimation of the time of concentration (Tc) is always a challenging task due to the intrinsic uncertainty involved when making assumptions. Given that Tc is one of the main inputs in a hydrological analysis for the design of hydraulic structures for stormwater management, ten equations (including one proposed in several local studies) and two Tc methodologies (overland flow time plus channel flow time) were used to compute the Tc in fifteen urban ungauged watersheds, located in Cartagena de Indias (Colombia), with different area sizes and slopes to statistically assess their performance against the value obtained via the Natural Resources Conservation Service (NRCS) velocity method (assumed to be the true value). According to the Nash–Sutcliffe efficiency index, none of the equations proved to be reliable in all watersheds as only four equations predicted the Tc value in 53% of the cases. In addition, based on the percent bias, all equations tended to significantly over- or underestimate the Tc, which affects the quantification of the runoff volume necessary for, among others, the implementation of best management practices for watershed management (e.g., conventional and/or sustainable drainage system design), flood-prone area delineation and flood risk analyses, urban planning, and stream restoration. Full article
Show Figures

Figure 1

16 pages, 6065 KiB  
Article
Estimation of Daily Spatial Snow Water Equivalent from Historical Snow Maps and Limited In-Situ Measurements
by Sami A. Malek, Roger C. Bales and Steven D. Glaser
Hydrology 2020, 7(3), 46; https://doi.org/10.3390/hydrology7030046 - 25 Jul 2020
Cited by 3 | Viewed by 2577
Abstract
We present a scheme aimed at estimating daily spatial snow water equivalent (SWE) maps in real time and at high spatial resolution from scarce in-situ SWE measurements from Internet of Things (IoT) devices at actual sensor locations and historical SWE maps. The method [...] Read more.
We present a scheme aimed at estimating daily spatial snow water equivalent (SWE) maps in real time and at high spatial resolution from scarce in-situ SWE measurements from Internet of Things (IoT) devices at actual sensor locations and historical SWE maps. The method consists of finding a background SWE field, followed by an update step using ensemble optimal interpolation to estimate the residuals. This novel approach allowed for areas with parsimonious sensors to have accurate estimates of spatial SWE without explicitly discovering and specifying the spatial-interpolation features. The scheme is evaluated across the Tuolumne River basin on a 50 m grid using an existing LiDAR-based product as the historical dataset. Results show a minimum RMSE of 30% at 50 m resolutions. Compared with the operational SNODAS product, reduction in error is up to 80% with historical LiDAR-measured snow depth as input data. Full article
(This article belongs to the Special Issue Advances in Land Surface Hydrological Processes)
Show Figures

Figure 1

24 pages, 4134 KiB  
Article
Characteristics of Rainfall Events Triggering Landslides in Two Climatologically Different Areas: Southern Ecuador and Southern Spain
by José Antonio Palenzuela Baena, John Soto Luzuriaga and Clemente Irigaray Fernández
Hydrology 2020, 7(3), 45; https://doi.org/10.3390/hydrology7030045 - 21 Jul 2020
Cited by 7 | Viewed by 3372
Abstract
In the research field on landslide hazard assessment for natural risk prediction and mitigation, it is necessary to know the characteristics of the triggering factors, such as rainfall and earthquakes, as well as possible. This work aims to generate and compare the basic [...] Read more.
In the research field on landslide hazard assessment for natural risk prediction and mitigation, it is necessary to know the characteristics of the triggering factors, such as rainfall and earthquakes, as well as possible. This work aims to generate and compare the basic information on rainfall events triggering landslides in two areas with different climate and geological settings: the Loja Basin in southern Ecuador and the southern part of the province of Granada in Spain. In addition, this paper gives preliminary insights on the correlation between these rainfall events and major climate cycles affecting each of these study areas. To achieve these objectives, the information on previous studies on these areas was compiled and supplemented to obtain and compare Critical Rainfall Threshold (CRT). Additionally, a seven-month series of accumulated rainfall and mean climate indices were calculated from daily rainfall and monthly climate, respectively. This enabled the correlation between both rainfall and climate cycles. For both study areas, the CRT functions were fitted including the confidence and prediction bounds, and their statistical significance was also assessed. However, to overcome the major difficulties to characterize each landslide event, the rainfall events associated with every landslide are deduced from the spikes showing uncommon return periods cumulative rainfall. Thus, the method used, which has been developed by the authors in previous research, avoids the need to preselect specific rainfall durations for each type of landslide. The information extracted from the findings of this work show that for the wetter area of Ecuador, CRT presents a lower scale factor indicating that lower values of accumulated rainfall are needed to trigger a landslide in this area. This is most likely attributed to the high soil saturation. The separate analysis of the landslide types in the case of southern Granada show very low statistical significance for translational slides, as a low number of data could be identified. However, better fit was obtained for rock falls, complex slides, and the global fit considering all landslide types with R2 values close to one. In the case of the Loja Basin, the ENSO (El Niño Southern Oscillation) cycle shows a moderate positive correlation with accumulated rainfall in the wettest period, while for the case of the south of the province of Granada, a positive correlation was found between the NAO (North Atlantic Oscillation) and the WeMO (Western Mediterranean Oscillation) climate time series and the accumulated rainfall. This correlation is highlighted when the aggregation (NAO + WeMO) of both climate indices is considered, reaching a Pearson coefficient of –0.55, and exceeding the average of the negative values of this combined index with significant rates in the hydrological years showing a higher number of documented landslides. Full article
(This article belongs to the Special Issue Rainfall-Induced Landslides Hazard)
Show Figures

Figure 1

19 pages, 2984 KiB  
Article
Flood Frequency Analyses over Different Basin Scales in the Blue Nile River Basin, Ethiopia
by Getachew Tegegne, Assefa M. Melesse, Dereje H. Asfaw and Abeyou W. Worqlul
Hydrology 2020, 7(3), 44; https://doi.org/10.3390/hydrology7030044 - 20 Jul 2020
Cited by 16 | Viewed by 5013
Abstract
The frequency and intensity of flood quantiles and its attendant damage in agricultural establishments have generated a lot of issues in Ethiopia. Moreover, precise estimates of flood quantiles are needed for efficient design of hydraulic structures; however, quantification of these quantiles in data-scarce [...] Read more.
The frequency and intensity of flood quantiles and its attendant damage in agricultural establishments have generated a lot of issues in Ethiopia. Moreover, precise estimates of flood quantiles are needed for efficient design of hydraulic structures; however, quantification of these quantiles in data-scarce regions has been a continuing challenge in hydrologic design. Flood frequency analysis is thus essential to reduce possible flood damage by investigating the most suitable flood prediction model. The annual maximum discharges from six representative stations in the Upper Blue Nile River Basin were fitted to the commonly used nine statistical distributions. This study also assessed the performance evolution of the probability distributions with varying spatial scales, such that three different spatial scales of small-, medium-, and large-scale basins in the Blue Nile River Basin were considered. The performances of the candidate probability distributions were assessed using three goodness-of-fit test statistics, root mean square error, and graphical interpretation approaches to investigate the robust probability distribution for flood frequency analysis over different basin spatial scales. Based on the overall analyses, the generalized extreme value distribution was proven to be a robust model for flood frequency analysis in the study region. The generalized extreme value distribution significantly improved the performance of the flood prediction over different spatial scales. The generalized extreme value flood prediction performance improvement measured in root mean square error varied between 5.84 and 67.91% over other commonly used probability distribution models. Thus, the flood frequency analysis using the generalized extreme value distribution could be essential for the efficient planning and design of hydraulic structures in the Blue Nile River Basin. Furthermore, this study suggests that, in the future, significant efforts should be put to conduct similar flood frequency analyses over the other major river basins of Ethiopia. Full article
Show Figures

Figure 1

29 pages, 6485 KiB  
Article
Testing the Robustness of a Physically-Based Hydrological Model in Two Data Limited Inland Valley Catchments in Dano, Burkina Faso
by Mouhamed Idrissou, Bernd Diekkrüger, Bernhard Tischbein, Boubacar Ibrahim, Yacouba Yira, Gero Steup and Thomas Poméon
Hydrology 2020, 7(3), 43; https://doi.org/10.3390/hydrology7030043 - 20 Jul 2020
Cited by 5 | Viewed by 3187
Abstract
This study investigates the robustness of the physically-based hydrological model WaSiM (water balance and flow simulation model) for simulating hydrological processes in two data sparse small-scale inland valley catchments (Bankandi-Loffing and Mebar) in Burkina Faso. An intensive instrumentation with two weather stations, three [...] Read more.
This study investigates the robustness of the physically-based hydrological model WaSiM (water balance and flow simulation model) for simulating hydrological processes in two data sparse small-scale inland valley catchments (Bankandi-Loffing and Mebar) in Burkina Faso. An intensive instrumentation with two weather stations, three rain recorders, 43 piezometers, and one soil moisture station was part of the general effort to reduce the scarcity of hydrological data in West Africa. The data allowed us to successfully parameterize, calibrate (2014–2015), and validate (2016) WaSiM for the Bankandi-Loffing catchment. Good model performance concerning discharge in the calibration period (R2 = 0.91, NSE = 0.88, and KGE = 0.82) and validation period (R2 = 0.82, NSE = 0.77, and KGE = 0.57) was obtained. The soil moisture (R2 = 0.7, NSE = 0.7, and KGE = 0.8) and the groundwater table (R2 = 0.3, NSE = 0.2, and KGE = 0.5) were well simulated, although not explicitly calibrated. The spatial transposability of the model parameters from the Bankandi-Loffing model was investigated by applying the best parameter-set to the Mebar catchment without any recalibration. This resulted in good model performance in 2014–2015 (R2 = 0.93, NSE = 0.92, and KGE = 0.84) and in 2016 (R2 = 0.65, NSE = 0.64, and KGE = 0.59). This suggests that the parameter-set achieved in this study can be useful for modeling ungauged inland valley catchments in the region. The water balance shows that evaporation is more important than transpiration (76% and 24%, respectively, of evapotranspiration losses) and the surface flow is very sensitive to the observed high interannual variability of rainfall. Interflow dominates the uplands, but base flow is the major component of stream flow in inland valleys. This study provides useful information for the better management of soil and scarce water resources for smallholder farming in the area. Full article
Show Figures

Figure 1

22 pages, 2631 KiB  
Article
An Evaluation Matrix to Compare Computer Hydrological Models for Flood Predictions
by Pasquale Filianoti, Luana Gurnari, Demetrio Antonio Zema, Giuseppe Bombino, Marco Sinagra and Tullio Tucciarelli
Hydrology 2020, 7(3), 42; https://doi.org/10.3390/hydrology7030042 - 15 Jul 2020
Cited by 25 | Viewed by 4780
Abstract
In order to predict and control the impacts of floods in torrents, it is important to verify the simulation accuracy of the most used hydrological models. The performance verification is particularly needed for applications in watersheds with peculiar climatic and geomorphological characteristics, such [...] Read more.
In order to predict and control the impacts of floods in torrents, it is important to verify the simulation accuracy of the most used hydrological models. The performance verification is particularly needed for applications in watersheds with peculiar climatic and geomorphological characteristics, such as the Mediterranean torrents. Moreover, in addition to the accuracy, other factors affect the choice of software by stakeholders (users, modellers, researchers, etc.). This study introduces a “performance matrix”, consisting of several evaluation parameters weighted by stakeholders’ opinions. The aim is to evaluate the accuracy of the flood prediction which is achieved by different models, as well as the pros and cons of software user experience. To this aim, the performances and requisites of four physical-based and conceptual models (HEC-HMS, SWMM, MIKE11 NAM and WEC-FLOOD) have been evaluated, by predicting floods in a midsized Mediterranean watershed (Mèsima torrent, Calabria, Southern Italy). In the case study, HEC-HMS and MIKE 11 NAM were the best computer models (with a weighted score of 4.45 and 4.43, respectively), thanks to their low complexity and computation effort, as well as good user interface and prediction accuracy. However, MIKE11 NAM is not free of charge. SWMM showed a lower prediction accuracy, which put the model in third place of the four models. The performance of WEC-FLOOD, although not being as good as for the other tested models, can be considered overall acceptable in comparison to the other well-consolidated models, considering that WEC-FLOOD is in the early stage of development. Overall, the proposal of the performance matrix for hydrological models may represent a first step in building a more complete evaluation framework of the hydrological and hydraulic commercial models, in order to give indications to allow potential users to make an optimal choice. Full article
Show Figures

Figure 1

16 pages, 2672 KiB  
Article
Autonomous Aerial Vehicles (AAVs) as a Tool for Improving the Spatial Resolution of Snow Albedo Measurements in Mountainous Regions
by Eric A. Sproles, Andrew Mullen, Jordy Hendrikx, Charles Gatebe and Suzi Taylor
Hydrology 2020, 7(3), 41; https://doi.org/10.3390/hydrology7030041 - 15 Jul 2020
Cited by 4 | Viewed by 3852
Abstract
We present technical advances and methods to measure effective broadband physical albedo in snowy mountain headwaters using a prototype dual-sensor pyranometer mounted on an Autonomous Aerial Vehicle (an AAV). Our test flights over snowy meadows and forested areas performed well during both clear [...] Read more.
We present technical advances and methods to measure effective broadband physical albedo in snowy mountain headwaters using a prototype dual-sensor pyranometer mounted on an Autonomous Aerial Vehicle (an AAV). Our test flights over snowy meadows and forested areas performed well during both clear sky and snowy/windy conditions at an elevation of ~2650 m above mean sea level (MSL). Our AAV-pyranometer platform provided high spatial (m) and temporal resolution (sec) measurements of effective broadband (310–2700 nm) surface albedo. The AAV-based measurements reveal spatially explicit changes in landscape albedo that are not present in concurrent satellite measurements from Landsat and MODIS due to a higher spatial resolution. This AAV capability is needed for validation of satellite snow albedo products, especially over variable montane landscapes at spatial scales of critical importance to hydrological applications. Effectively measuring albedo is important, as annually the seasonal accumulation and melt of mountain snowpack represent a dramatic transformation of Earth’s albedo, which directly affects headwaters’ water and energy cycles. Full article
Show Figures

Figure 1

21 pages, 6574 KiB  
Article
Evaluation of MERRA-2 Precipitation Products Using Gauge Observation in Nepal
by Kalpana Hamal, Shankar Sharma, Nitesh Khadka, Binod Baniya, Munawar Ali, Mandira Singh Shrestha, Tianli Xu, Dibas Shrestha and Binod Dawadi
Hydrology 2020, 7(3), 40; https://doi.org/10.3390/hydrology7030040 - 13 Jul 2020
Cited by 42 | Viewed by 5882
Abstract
Precipitation is the most important variable in the climate system and the dominant driver of land surface hydrologic conditions. Rain gauge measurement provides precipitation estimates on the ground surface; however, these measurements are sparse, especially in the high-elevation areas of Nepal. Reanalysis datasets [...] Read more.
Precipitation is the most important variable in the climate system and the dominant driver of land surface hydrologic conditions. Rain gauge measurement provides precipitation estimates on the ground surface; however, these measurements are sparse, especially in the high-elevation areas of Nepal. Reanalysis datasets are the potential alternative for precipitation measurement, although it must be evaluated and validated before use. This study evaluates the performance of second-generation Modern-ERA Retrospective analysis for Research and Applications (MERRA-2) datasets with the 141-gauge observations from Nepal between 2000 and 2018 on monthly, seasonal, and annual timescales. Different statistical measures based on the Correlation Coefficient (R), Mean Bias (MB), Root-Mean-Square Error (RMSE), and Nash–Sutcliffe efficiency (NSE) were adopted to determine the performance of both MERRA-2 datasets. The results revealed that gauge calibrated (MERRA-C) underestimated, whereas model-only (MERRA-NC) overestimated the observed seasonal cycle of precipitation. However, both datasets were able to reproduce seasonal precipitation cycle with a high correlation (R ≥ 0.95), as revealed by observation. MERRA-C datasets showed a more consistent spatial performance (higher R-value) to the observed datasets than MERRA-NC, while MERRA-NC is more reasonable to estimate precipitation amount (lower MB) across the country. Both MERRA-2 datasets performed better in winter, post-monsoon, and pre-monsoon than in summer monsoon. Moreover, MERRA-NC overestimated the observed precipitation in mid and high-elevation areas, whereas MERRA-C severely underestimated at most of the stations throughout all seasons. Among both datasets, MERRA-C was only able to reproduce the observed elevation dependency pattern. Furthermore, uncertainties in MERRA-2 precipitation products mentioned above are still worthy of attention by data developers and users. Full article
(This article belongs to the Special Issue Advances in Modelling of Rainfall Fields)
Show Figures

Figure 1

46 pages, 26057 KiB  
Article
GEO-CWB: GIS-Based Algorithms for Parametrising the Responses of Catchment Dynamic Water Balance Regarding Climate and Land Use Changes
by Salem S. Gharbia, Laurence Gill, Paul Johnston and Francesco Pilla
Hydrology 2020, 7(3), 39; https://doi.org/10.3390/hydrology7030039 - 13 Jul 2020
Cited by 5 | Viewed by 3349
Abstract
Parametrising the spatially distributed dynamic catchment water balance is a critical factor in studying the hydrological system responses to climate and land use changes. This study presents the development of a geographic information system (GIS)-based set of algorithms (geographical spatially distributed water balance [...] Read more.
Parametrising the spatially distributed dynamic catchment water balance is a critical factor in studying the hydrological system responses to climate and land use changes. This study presents the development of a geographic information system (GIS)-based set of algorithms (geographical spatially distributed water balance model (GEO-CWB)), which is developed from integrating physical, statistical, and machine learning models. The GEO-CWB tool has been developed to simulate and predict future spatially distributed dynamic water balance using GIS environment at the catchment scale in response to the future changes in climate variables and land use through a user-friendly interface. The tool helps in bridging the gap in quantifying the high-resolution dynamic water balance components for the large catchments by reducing the computational costs. Also, this paper presents the application and validation of GEO-CWB on the Shannon catchment in Ireland as an example of a large and complicated hydrological system. It can be concluded that climate and land use changes have significant effects on the spatial and temporal patterns of the different water balance components of the catchment. Full article
(This article belongs to the Special Issue Technological Advances in Hydroclimatic Observations)
Show Figures

Graphical abstract

Previous Issue
Next Issue
Back to TopTop