Stock Net Entropy: Evidence from the Chinese Growth Enterprise Market


Abstract
:1. Introduction
2. Net Entropy of a Stock Market
3. Research Hypothesis
4. Data
5. Dynamic Financial Network
5.1. Dynamic Correlation Algorithm
5.1.1. Network Construction
5.1.2. Network Indicators
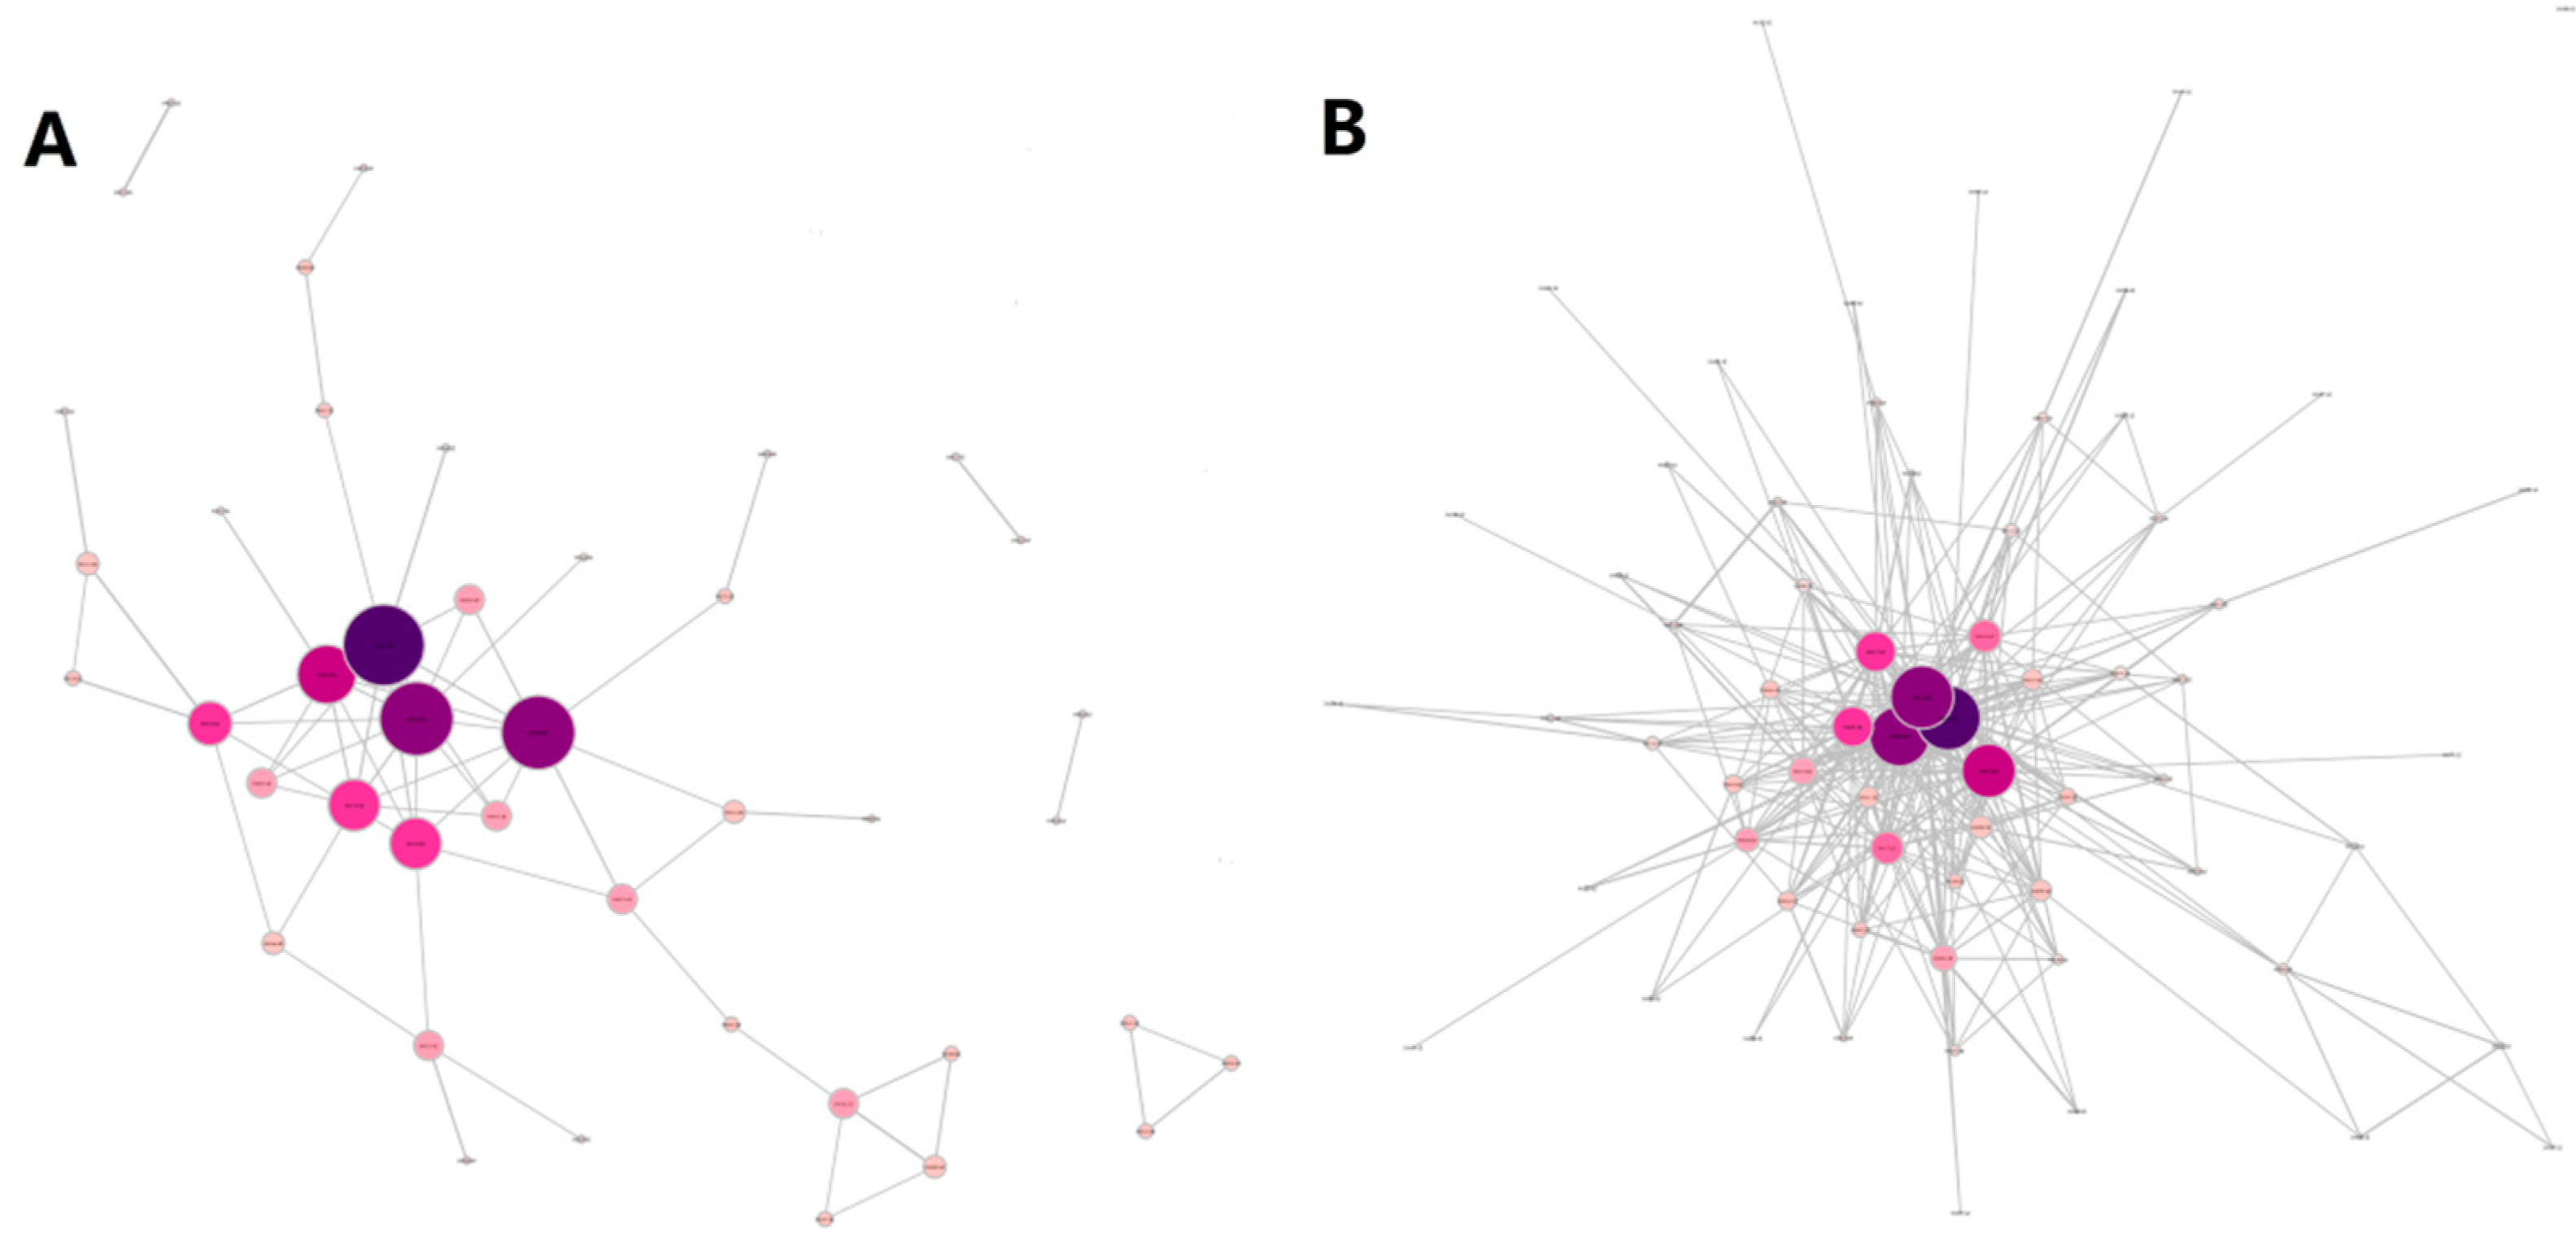
5.2. Network of the Chinese Growth Enterprise Market
5.3. Indicator Discussion
6. Results
6.1. Network Entropy Effect on Trading and Returns
6.2. Information Transmission Analysis
7. Conclusions
Author Contributions
Funding
Conflicts of Interest
References
- Gençay, R.; Signori, D.; Xue, Y.; Yu, X.; Zhang, K. Economic links and credit spreads. J. Bank. Financ. 2015, 55, 157–169. [Google Scholar] [CrossRef] [Green Version]
- Liu, A.; Paddrik, M.; Yang, S.Y.; Zhang, X. Interbank contagion: An agent-based model approach to endogenously formed networks. J. Bank. Financ. 2017. [Google Scholar] [CrossRef]
- Mantegna, R.N. Hierarchical structure in financial markets. Eur. Phys. J. B 1999, 11, 193–197. [Google Scholar] [CrossRef] [Green Version]
- Vandewalle, N.; Brisbois, F.; Tordoir, X. Non-random topology of stock markets. Quant. Financ. 2001, 1, 372–374. [Google Scholar] [CrossRef]
- Bonanno, G.; Lillo, F.; Mantegna, R.N. High-frequency cross-correlation in a set of stocks. Quant. Financ. 2001, 1, 96–104. [Google Scholar] [CrossRef]
- Lee, K.E.; Lee, J.W.; Hong, B.H. Complex networks in a stock market. Comput. Phys. Commun. 2007, 177, 186. [Google Scholar] [CrossRef]
- Chi, K.T.; Jing, L.; Lau, F.C.M.; Baillie, R.T.; Palm, F.C.; Vermaelen, T.J.; Wolff, C.C.P. A network perspective of the stock market. J. Empir. Financ. 2010, 17, 659–667. [Google Scholar] [CrossRef] [Green Version]
- Heiberger, R.H. Stock network stability in times of crisis. Phys. A Stat. Mech. Its Appl. 2014, 393, 376–381. [Google Scholar] [CrossRef]
- Birch, J.; Pantelous, A.A.; Soramäki, K. Analysis of correlation based networks representing dax 30 stock price returns. Comput. Econ. 2016, 47, 501–525. [Google Scholar] [CrossRef]
- Gradojevic, N.; Lento, C. Multiscale analysis of foreign exchange order flows and technical trading profitability. Econ. Model. 2015, 47, 156–165. [Google Scholar] [CrossRef]
- Caraiani, P. The predictive power of local properties of financial networks. Phys. A Stat. Mech. Its Appl. 2017, 466, 79–90. [Google Scholar] [CrossRef]
- Lyócsa, Š.; Výrost, T.; Baumöhl, E. Stock market networks: The dynamic conditional correlation approach. Phys. A Stat. Mech. Its Appl. 2012, 391, 4147–4158. [Google Scholar] [CrossRef]
- Huang, W.Q.; Zhuang, X.T.; Yao, S.; Uryasev, S. A financial network perspective of financial institutions’ systemic risk contributions. Phys. A Stat. Mech. Its Appl. 2016, 456, 183–196. [Google Scholar] [CrossRef]
- Lahrech, A.; Sylwester, K.U.S. And latin american stock market linkages. J. Int. Money Financ. 2011, 30, 1341–1357. [Google Scholar] [CrossRef]
- Long, H.; Zhang, J.; Tang, N. Does network topology influence systemic risk contribution? A perspective from the industry indices in chinese stock market. PLoS ONE 2017, 12, e0180382. [Google Scholar] [CrossRef] [PubMed]
- Qiao, H.; Yue, X.; Ying, L. Can network linkage effects determine return? Evidence from chinese stock market. PLoS ONE 2016, 11, e0156784. [Google Scholar] [CrossRef] [PubMed]
- Yin, K.; Liu, Z.; Liu, P. Trend analysis of global stock market linkage based on a dynamic conditional correlation network. J. Bus. Econ. Manag. 2017, 18, 779–800. [Google Scholar] [CrossRef]
- Djauhari, M.; Gan, S. Dynamics of correlation structure in stock market. Entropy 2014, 16, 455–470. [Google Scholar] [CrossRef]
- Papana, A.; Kyrtsou, C.; Kugiumtzis, D.; Diks, C. Financial networks based on granger causality: A case study. Phys. A Stat. Mech. Its Appl. 2017, 482, 65–73. [Google Scholar] [CrossRef]
- Wen, X.; Wei, Y.; Huang, D. Measuring contagion between energy market and stock market during financial crisis: A copula approach. Energy Econ. 2012, 34, 1435–1446. [Google Scholar] [CrossRef]
- Ji, Q.; Fan, Y. How does oil price volatility affect non-energy commodity markets? Appl. Energy 2012, 89, 273–280. [Google Scholar] [CrossRef]
- Silvennoinen, A.; Thorp, S. Financialization, crisis and commodity correlation dynamics. J. Int. Financ. Mark. Inst. Money 2013, 24, 42–65. [Google Scholar] [CrossRef] [Green Version]
- Han, L.; Zhou, Y.; Yin, L. Exogenous impacts on the links between energy and agricultural commodity markets. Energy Econ. 2015, 49, 350–358. [Google Scholar] [CrossRef]
- Ferreira, P.; Dionísio, A. How long is the memory of the us stock market? Phys. A Stat. Mech. Its Appl. 2016, 451, 502–506. [Google Scholar] [CrossRef]
- Podobnik, B.; Stanley, H.E. Detrended cross-correlation analysis: A new method for analyzing two nonstationary time series. Phys. Rev. Lett. 2008, 100, 084102. [Google Scholar] [CrossRef] [PubMed]
- Peng, C.K.; Buldyrev, S.V.; Havlin, S.; Simons, M.; Stanley, H.E.; Goldberger, A.L. Mosaic organization of DNA nucleotides. Phys. Rev. E Stat. Phys. Plasmas Fluids Relat. Interdiscip. Top. 1994, 49, 1685. [Google Scholar] [CrossRef] [PubMed]
- Caraiani, P. The predictive power of singular value decomposition entropy for stock market dynamics. Phys. A Stat. Mech. Its Appl. 2014, 393, 571–578. [Google Scholar] [CrossRef]
- Gu, R.; Xiong, W.; Li, X. Does the singular value decomposition entropy have predictive power for stock market?—Evidence from the shenzhen stock market. Phys. A Stat. Mech. Its Appl. 2015, 439, 103–113. [Google Scholar] [CrossRef]
- Gu, R.; Shao, Y. How long the singular value decomposed entropy predicts the stock market?—Evidence from the dow jones industrial average index. Phys. A Stat. Mech. Its Appl. 2016, 453, 150–161. [Google Scholar] [CrossRef]
- Heiberger, R.H. Predicting economic growth with stock networks. Phys. A Stat. Mech. Its Appl. 2018, 489, 102–111. [Google Scholar] [CrossRef]
- Tabak, B.M.; Fazio, D.M.; Cajueiro, D.O. The effects of loan portfolio concentration on brazilian banks’ return and risk. J. Bank. Financ. 2011, 35, 3065–3076. [Google Scholar] [CrossRef]
- Narayan, P.K.; Phan, D.H.B.; Sharma, S.S. Does islamic stock sensitivity to oil prices have economic significance? Pac.-Basin Financ. J. 2018. [Google Scholar] [CrossRef]
- Tan, Y.J.; Jun, W.U. Network structure entropy and its application to scale-free networks. Syst. Eng.-Theory Pract. 2004, 24, 339–379. [Google Scholar] [CrossRef]
- Cai, M.; Du Hai-Feng, R.Y.K.; Marcus, W. A new network structure entropy based node difference and edge difference. Acta Phys. Sin. 2011, 60, 110513–111386. [Google Scholar] [CrossRef]
- Shannon, C.E.; Weaver, W.; Wiener, N. The mathematical theory of communication. Phys. Today 1950, 3, 31–32. [Google Scholar] [CrossRef]
- Bekiros, S.D. Timescale analysis with an entropy-based shift-invariant discrete wavelet transform. Comput. Econ. 2014, 44, 231–251. [Google Scholar] [CrossRef]
- Bowden, R.J. Directional entropy and tail uncertainty, with applications to financial hazard. Quant. Financ. 2011, 11, 437–446. [Google Scholar] [CrossRef]
- Kitamura, Y.; Stutzer, M. Connections between entropic and linear projections in asset pricing estimation. J. Econom. 2002, 107, 159–174. [Google Scholar] [CrossRef]
- Peter, F.J.; Dimpfl, T.; Huergo, L. Using transfer entropy to measure information flows between financial markets. Stud. Nonlinear Dyn. Econom. 2013, 17, 85–102. [Google Scholar] [CrossRef]
- Stutzer, M.J. Simple entropic derivation of a generalized black-scholes option pricing model. Entropy 2000, 2, 70–77. [Google Scholar] [CrossRef]
- Zhou, R.; Cai, R.; Tong, G. Applications of entropy in finance: A review. Entropy 2013, 15, 4909–4931. [Google Scholar] [CrossRef]
- Boyarchenko, N. Ambiguity shifts and the 2007–2008 financial crisis. J. Monet. Econ. 2012, 59, 493–507. [Google Scholar] [CrossRef]
- Yang, J.P.; Qiu, W.H. A measure of risk and a decision-making model based on expected utility and entropy. Eur. J. Oper. Res. 2005, 164, 792–799. [Google Scholar] [CrossRef]
- Zhou, R.; Liu, X.; Yu, M.; Huang, K. Properties of risk measures of generalized entropy in portfolio selection. Entropy 2017, 19, 657. [Google Scholar] [CrossRef]
- Gençay, R.; Gradojevic, N. The tale of two financial crises: An entropic perspective. Entropy 2017, 19, 244. [Google Scholar] [CrossRef]
- Gradojevic, N.; Caric, M. Predicting systemic risk with entropic indicators. J. Forecast. 2016, 36, 16–25. [Google Scholar] [CrossRef]
- Su, C.; Chen, T.; Cheng, C.; Chen, Y. Forecasting the stock market with linguistic rules generated from the minimize entropy principle and the cumulative probability distribution approaches. Entropy 2010, 12, 2397–2417. [Google Scholar] [CrossRef]
- Rashevsky, N. Life, information theory, and topology. Bull. Math. Biophys. 1955, 17, 229–235. [Google Scholar] [CrossRef]
- Trucco, E. A note on the information content of graphs. Bull. Math. Biophys. 1956, 18, 129–135. [Google Scholar] [CrossRef]
- Mowshowitz, A. Entropy and the complexity of graphs: Iv. Entropy measures and graphical structure. Bull. Math. Biol. 1968, 30, 533–546. [Google Scholar] [CrossRef]
- Anand, K.; Bianconi, G. Entropy measures for networks: Toward an information theory of complex topologies. Phys. Rev. E Stat. Nonlinear Soft Matter Phys. 2009, 80, 045102. [Google Scholar] [CrossRef] [PubMed]
- Costa, L.F.; Rodrigues, F.A.; Travieso, G.; Boas, P.R.V. Characterization of complex networks: A survey of measurements. Adv. Phys. 2005, 56, 167–242. [Google Scholar] [CrossRef]
- Li, S.; He, J.; Song, K. Network entropies of the chinese financial market. Entropy 2016, 18, 331. [Google Scholar] [CrossRef]
- Xu, X.J.; Wang, K.; Zhu, L.; Zhang, L.J. Efficient construction of threshold networks of stock markets. Phys. A Stat. Mech. Its Appl. 2018, 509, 1080–1086. [Google Scholar] [CrossRef]
- Nie, C.; Song, F. Relationship between entropy and dimension of financial correlation-based network. Entropy 2018, 20, 177. [Google Scholar] [CrossRef]
- Caraiani, P. Modeling the comovement of entropy between financial markets. Entropy 2018, 20, 417. [Google Scholar] [CrossRef]
- Stutzer, M. The role of entropy in estimating financial network default impact. Entropy 2018, 20, 369. [Google Scholar] [CrossRef]
- Cai, M.; Cui, Y.; Stanley, H.E. Analysis and evaluation of the entropy indices of a static network structure. Sci. Rep. 2017, 7, 9340. [Google Scholar] [CrossRef] [PubMed] [Green Version]
- Chuang, W.; Liu, H.; Susmel, R. The bivariate garch approach to investigating the relation between stock returns, trading volume, and return volatility. Glob. Financ. J. 2012, 23, 1–15. [Google Scholar] [CrossRef]
- Ichsani, S.; Suhardi, A.R. The effect of return on equity (ROE) and return on investment (ROI) on trading volume. Procedia Soc. Behav. Sci. 2015, 211, 896–902. [Google Scholar] [CrossRef]
- Sheng, X.; Brzeszczyński, J.; Ibrahim, B.M. International stock return co-movements and trading activity. Financ. Res. Lett. 2017, 23, 12–18. [Google Scholar] [CrossRef]
- Balcilar, M.; Bouri, E.; Gupta, R.; Roubaud, D. Can volume predict bitcoin returns and volatility? A quantiles-based approach. Econ. Model. 2017, 64, 74–81. [Google Scholar] [CrossRef]
- Engle, R.F. Dynamic conditional correlation: A simple class of multivariate generalized autoregressive conditional heteroskedasticity models. J. Bus. Econ. Stat. 2002, 20, 339–350. [Google Scholar] [CrossRef]
- Mensi, W.; Hammoudeh, S.; Nguyen, D.K.; Yoon, S.M. Dynamic spillovers among major energy and cereal commodity prices. Energy Econ. 2014, 43, 225–243. [Google Scholar] [CrossRef]
- Yang, M.; Jiang, Z.Q. The dynamic correlation between policy uncertainty and stock market returns in China. Phys. A Stat. Mech. Its Appl. 2016, 461, 92–100. [Google Scholar] [CrossRef]
- Bonanno, G.; Caldarelli, G.; Lillo, F.; Mantegna, R.N. Topology of correlation-based minimal spanning trees in real and model markets. Phys. Rev. E 2003, 68, 046130. [Google Scholar] [CrossRef] [PubMed]
- Tumminello, M.; Aste, T.; Matteo, T.D.; Mantegna, R.N.; Stanley, H.E. A tool for filtering information in complex systems. Proc. Natl. Acad. Sci. USA 2005, 102, 10421–10426. [Google Scholar] [CrossRef] [PubMed] [Green Version]
- Barrat, A.; Barthlemy, M.; Vespignani, A. Dynamical Processes on Complex Networks; Cambridge University Press: Cambridge, UK, 2008. [Google Scholar]
- Watts, D.; Strogatz, S. Collectivedynamics of ’small-world’ networks. Nature 1998, 393, 440–442. [Google Scholar] [CrossRef] [PubMed]
- Huang, W.Q.; Zhuang, X.T.; Yao, S. A network analysis of the chinese stock market. Phys. A Stat. Mech. Its Appl. 2009, 388, 2956–2964. [Google Scholar] [CrossRef]
- Kim, K.; Kim, S.Y.; Ha, D.H. Characteristics of networks in financial markets. Comput. Phys. Commun. 2007, 177, 184–185. [Google Scholar] [CrossRef]
- Tabak, B.M.; Takami, M.Y.; Cajueiro, D.O.; Petitinga, A. Quantifying price fluctuations in the brazilian stock market. Phys. A Stat. Mech. Its Appl. 2009, 388, 59–62. [Google Scholar] [CrossRef]
- Phan, D.H.B.; Sharma, S.S.; Tran, V.T. Can economic policy uncertainty predict stock returns? Global evidence. J. Int. Financ. Mark. Inst. Money 2018, 55, 134–150. [Google Scholar] [CrossRef]
- Huang, D.; Jiang, F.; Tu, J.; Zhou, G. Investor sentiment aligned: A powerful predictor of stock returns. Rev. Financ. Stud. 2013, 28, 791–837. [Google Scholar] [CrossRef]
- Li, L.; Yin, L.; Zhou, Y. Exogenous shocks and the spillover effects between uncertainty and oil price. Energy Econ. 2016, 54, 224–234. [Google Scholar] [CrossRef]


| Variable | Mean | Min | Max | Std. Dev. | Skewness | Kurtosis | JB | ADF |
|---|---|---|---|---|---|---|---|---|
| index returns (RET) | 0.0001 | −0.0933 | 0.0691 | 0.0212 | −0.6410 | 5.7852 | 411.5000 *** | −9.3918 *** |
| VOL | 0.0002 | −2.7224 | 3.7566 | 1.0761 | 0.7633 | 3.4216 | 6.5940 *** | −3.9248 ** |
| Variable | Mean | Min | Max | Std. Dev | Skewness | Kurtosis | JB | ADF |
|---|---|---|---|---|---|---|---|---|
| AD | 2.5549 | 1.6500 | 7.6500 | 0.7528 | 2.6726 | 12.0187 | 4881.8 *** | −4.6724 *** |
| C | 0.2433 | 0.1447 | 0.5420 | 0.0571 | 1.7325 | 6.6846 | 1136.3 *** | −4.8559 *** |
| L | 0.6818 | 0.2785 | 1.5880 | 0.2332 | 1.0950 | 3.7486 | 237.9 *** | −4.6379 *** |
| D | 5.8565 | 4.0000 | 9.0000 | 0.9420 | 0.8081 | 3.2974 | 119.9 *** | −5.0254 *** |
| ACC | 0.0417 | 0.0023 | 0.0869 | 0.0167 | −0.4451 | 2.8129 | 36.7 *** | −4.9271 *** |
| ABC | 33.6322 | 12.8250 | 75.0500 | 11.7622 | 0.8625 | 3.0327 | 132.2 *** | −4.7012 *** |
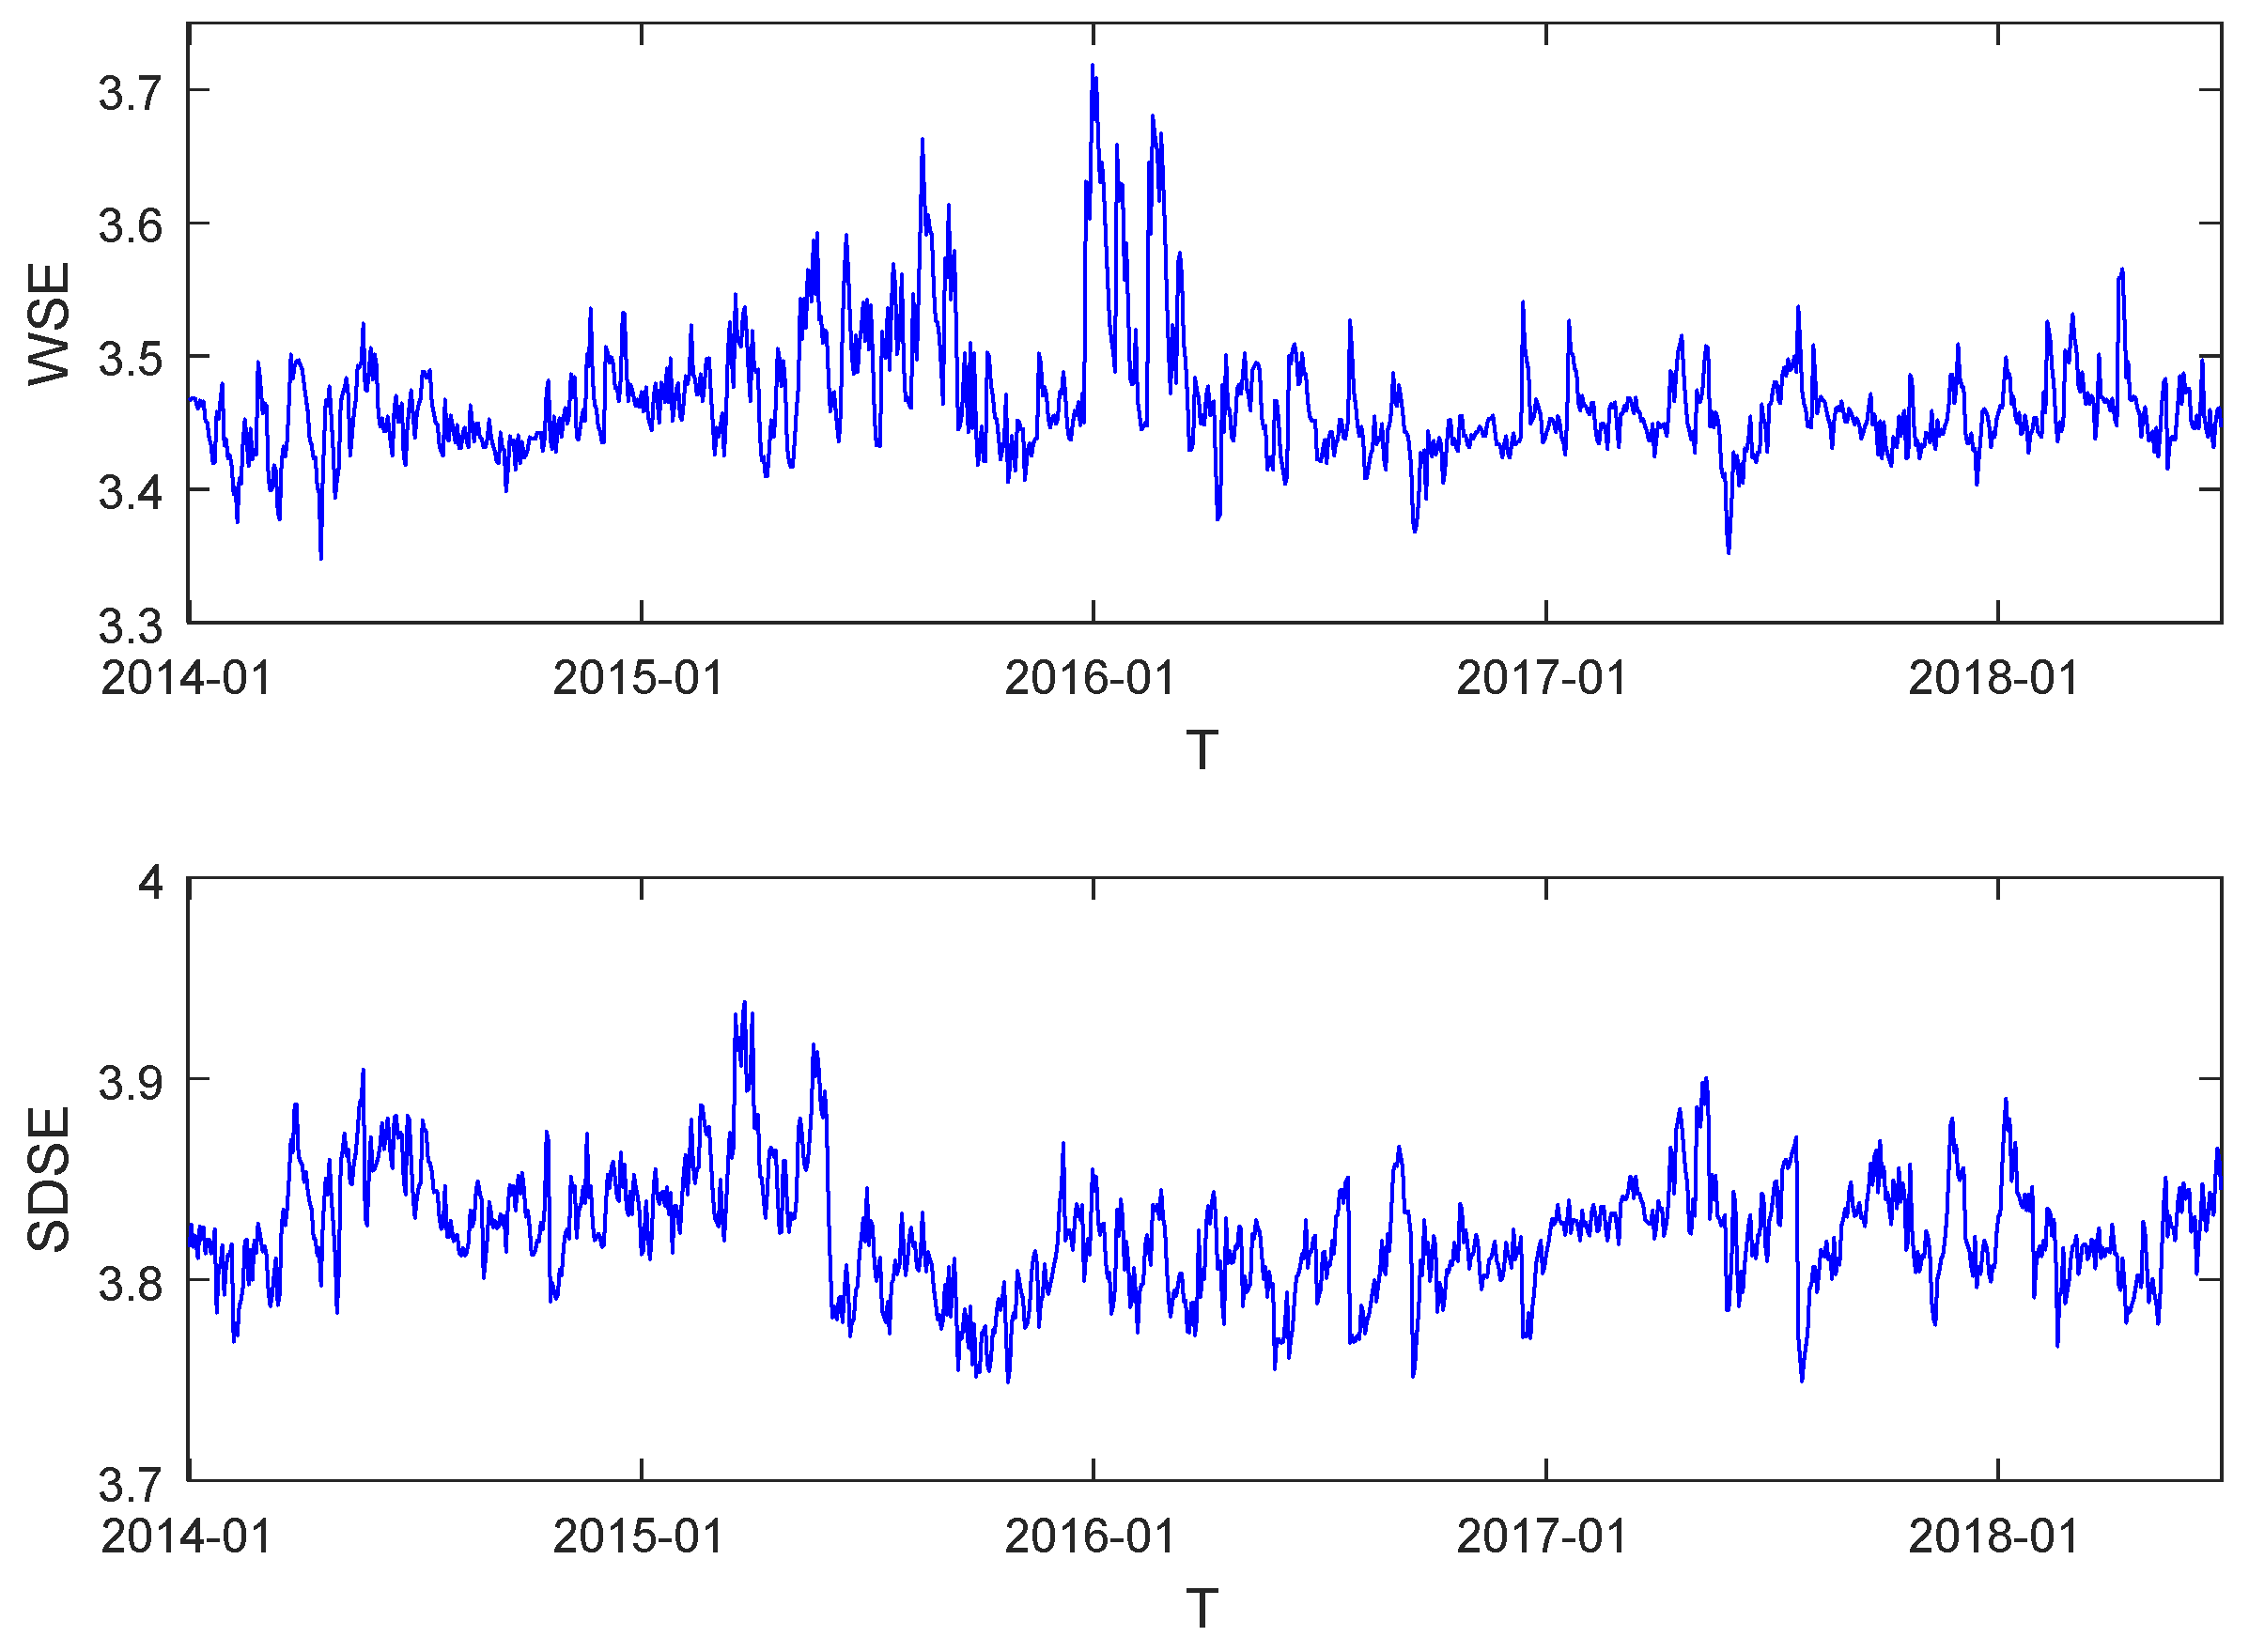
| WSE | 3.4657 | 3.3476 | 3.7183 | 0.0456 | 1.8426 | 8.3604 | 1879.5 *** | −5.8809 *** |
| SDSE | 3.8235 | 3.7489 | 3.9384 | 0.0298 | 0.3624 | 3.5176 | 35.2 *** | −5.7875 *** |
| EPU | 0.0002 | −1.8587 | 3.2156 | 0.5588 | 0.2742 | 1.4854 | 109.7 *** | −14.8010 *** |
| VIX | −0.0001 | −0.3411 | 0.7682 | 0.0823 | 1.3573 | 10.2224 | 4919.4 *** | −12.4900 *** |
| AD | C | L | D | ACC | ABC | WSE | SDSE | |
|---|---|---|---|---|---|---|---|---|
| AD | 1.000 | 0.939 | 0.769 | −0.212 | −0.719 | 0.658 | 0.747 | −0.447 |
| C | 1.000 | 0.674 | −0.290 | −0.661 | 0.559 | 0.665 | −0.497 | |
| L | 1.000 | 0.282 | −0.588 | 0.986 | 0.777 | −0.179 | ||
| D | 1.000 | −0.096 | 0.411 | 0.036 | 0.332 | |||
| ACC | 1.000 | −0.821 | −0.532 | 0.407 | ||||
| ABC | 1.000 | 0.723 | −0.103 | |||||
| WSE | 1.000 | 0.205 | ||||||
| SDSE | 1.000 |
| Index Returns | |||||
|---|---|---|---|---|---|
| Model 1 | Model 2 | Model 3 | Model 4 | Model 5 | |
| Panel A: Wu Structure Entropy (WSE) | |||||
| WSE | −0.0417 * (−1.87) | −0.0543 ** (−1.85) | −0.0540 ** (−1.92) | −0.0602 *** (−2.09) | −0.0623 ** (−2.33) |
| D | 0.0007 (0.64) | 0.0004 (0.36) | 0.0013 (1.24) | 0.0008 (0.74) | |
| ACC | 0.1001 (1.06) | 0.1001 (1.11) | 0.1127 (1.19) | 0.1255 (1.41) | |
| AD | −0.0003 (−0.13) | 0.0005 (0.26) | |||
| C | 0.0190 (0.90) | 0.0241 (1.18) | |||
| L | 0.0163 (1.54) | 0.0135 (1.32) | |||
| ABC | 0.0003 * (1.68) | 0.0003 * (1.65) | |||
| EPU | −0.0016 (−1.38) | −0.0016 (−1.39) | −0.0016 (−1.37) | −0.0016 (−1.38) | |
| VIX | −0.0226 ** (−2.88) | −0.0226 ** (−2.88) | −0.0227 *** (−2.90) | −0.0227 *** (−2.90) | |
| 0.1457 * (1.88) | 0.1698 * (1.79) | 0.1698 * (1.85) | 0.1830 ** (1.95) | 0.1906 *** (2.17) | |
| 3.50 *** | 2.8380 ** | 2.9050 *** | 2.9540 *** | 3.0980 *** | |
| (%) | 0.69 | 2.10 | 2.10 | 2.10 | 2.10 |
| RSE | 0.03 | 0.02 | 0.02 | 0.02 | 0.02 |
| Panel B: SD Structure Entropy (SDSE) | |||||
| SDSE | −0.0604 ** (−1.97) | −0.0645 ** (−2.24) | −0.0643 ** (−2.27) | −0.0517 * (−1.78) | −0.0558 * (−1.94) |
| D | 0.0011 (1.06) | 0.0009 (0.78) | 0.0019 * (1.92) | 0.0016 (1.45) | |
| ACC | 0.0960 (1.08) | 0.0975 (1.14) | 0.0726 (0.82) | 0.0961 (1.12) | |
| AD | −0.0029 (−1.42) | −0.0023 (−1.38) | |||
| C | 0.0049 (0.22) | −0.0070 (−0.35) | |||
| L | 0.0123 (1.37) | 0.0039 (0.51) | |||
| ABC | 0.0002 (1.50) | 0.0001 (0.90) | |||
| EPU | −0.0016 (−1.37) | −0.0016 (−1.37) | −0.0016 (−1.36) | −0.0016 (−1.36) | |
| VIX | −0.0230 *** (−2.94) | −0.0230 *** (−2.94) | −0.0228 *** (−2.91) | −0.0228 *** (−2.91) | |
| 0.2298 * (1.96) | 0.2357 ** (2.18) | 0.2354 ** (2.21) | 0.1824 * (1.66) | 0.1980 * (1.82) | |
| F | 3.87 ** | 3.067 *** | 3.1200 *** | 2.7790 *** | 2.8590 *** |
| (%) | 0.53 | 2.10 | 2.10 | 2.10 | 2.10 |
| RSE | 0.02 | 0.02 | 0.02 | 0.02 | 0.02 |
| Trading Volume | |||||
|---|---|---|---|---|---|
| Model 1 | Model 2 | Model 3 | Model 4 | Model 5 | |
| Panel A: Wu Structure Entropy (WSE) | |||||
| WSE | −3.0949 *** | −5.5598 *** (−3.86) | −4.8069 *** | −5.406 *** | −4.2074 *** |
| (−4.31) | (−3.46) | (−3.81) | (−3.18) | ||
| D | −0.0251 | −0.0299 | −0.0349 | −0.0438 | |
| (−0.48) | (−0.54) | (−0.69) | (−0.79) | ||
| ACC | 6.2542 | 3.422 | 6.126 | 2.2922 | |
| (1.34) | (0.77) | (1.31) | (0.52) | ||
| AD | 0.0691 | 0.1787 ** | |||
| (0.72) | (1.98) | ||||
| C | 0.4438 | 1.4247 | |||
| (0.43) | (1.41) | ||||
| L | 2.2785 *** | 2.3569 *** | |||
| (4.38) | (4.68) | ||||
| ABC | 0.0343 *** | 0.0354 *** | |||
| (3.92) | (4.06) | ||||
| EPU | −0.0184 | −0.0189 | −0.0185 | −0.0191 | |
| (−0.32) | (−0.33) | (−0.33) | (−0.33) | ||
| VIX | 0.3686 | 0.3729 | 0.3671 | 0.3688 | |
| (0.95) | (0.96) | (0.95) | (0.95) | ||
| 10.7257 *** | 17.4241 *** | 15.0808 *** | 16.9691 *** | 13.2044 *** | |
| (4.313) | (3.72) | (3.32) | (3.67) | (3.04) | |
| 18.61 *** | 13.44 *** | 13.86 *** | 13.39 *** | 13.56*** | |
| (%) | 1.72 | 8.17 | 7.84 | 8.14 | 7.67 |
| RSE | 1.07 | 1.04 | 1.04 | 1.04 | 1.04 |
| Panel B: SD Structure Entropy (SDSE) | |||||
| WSE | −5.1960 *** | −6.0595 *** | −5.6154 *** | −6.1642 *** | −5.8321 *** |
| (−4.74) | (−4.27) | (−4.02) | (−4.31) | (−4.12) | |
| D | 0.0171 | 0.0102 | 0.0197 | 0.001 | |
| (0.34) | (0.19) | (0.4) | (0.02) | ||
| ACC | 5.02 | 3.04 | 4.6477 | 3.0363 | |
| (1.15) | (0.72) | (1.07) | (0.72) | ||
| AD | −0.1842 * | −0.069 | |||
| (−1.85) | (−0.83) | ||||
| C | −2.164 * | −1.1692 | |||
| (−1.96) | (−1.18) | ||||
| L | 1.8007 *** | 1.6722 *** | |||
| (4.08) | (4.36) | ||||
| ABC | 0.028 *** | 0.0286 *** | |||
| (3.7) | (4.04) | ||||
| EPU | −0.0164 | −0.017 | −0.0166 | −0.0172 | |
| (−0.29) | (−0.3) | (−0.29) | (−0.3) | ||
| VIX | 0.3326 | 0.3374 | 0.3408 | 0.3396 | |
| (0.86) | (0.87) | (0.88) | (0.88) | ||
| 19.8680 *** | 22.1017 *** | 20.5173 *** | 22.6462 *** | 21.4911 *** | |
| (4.74) | (4.15) | (3.91) | (4.2) | (4.01) | |
| F | 22.42 *** | 13.96 *** | 13.51 *** | 14.02 *** | 13.62 *** |
| (%) | 2.06 | 8.46 | 8.21 | 8.49 | 8.27 |
| RSE | 1.07 | 1.03 | 1.03 | 1.03 | 1.03 |
| Model 1 | Model 2 | Model 3 | Model 4 | Model 5 | |
|---|---|---|---|---|---|
| Panel A: Index Returns | |||||
| WSE | −0.0140 (−0.20) | −0.2935 (−1.76) | −0.2704 (−1.64) | −0.2922 * (−1.87) | −0.2426 (−1.65) |
| SDSE | −0.2358 * (−1.74) | −0.3097 (−1.49) | −0.2988 * (−1.95) | −0.3260 * (−1.65) | −0.3113 (−1.50) |
| Panel B: Trading Volume | |||||
| WSE | −5.0350 (−1.33) | −18.9196 * (−1.97) | −17.2429 * (−1.83) | −18.2344 * (−1.94) | −15.1681 (−1.62) |
| SDSE | −12.989 ** (−2.33) | −18.0666 ** (−2.03) | −17.1747 ** (−2.15) | −18.2988 ** (−2.04) | −17.5346 ** (−2.18) |
| WSE/RET | WSE/VOL | SDSE/RET | SDSE/VOL | |
|---|---|---|---|---|
| Panel A: Conditional Mean Equations Own lagged returns effects | ||||
| 0.0154 (1.33) | −0.1239 *** (−4.39) | 0.0115 (0.91) | −0.1117 *** (−4.06) | |
| 0.0191 * (1.95) | −0.0624 (−0.06) | 0.0287 * (1.65) | −1.3401 ** (−2.69) | |
| Mean spillover effects | ||||
| −0.1396 *** (−4.81) | −0.0005 (−0.72) | −0.1246 *** (−4.47) | −0.0079 *** (−6.26) | |
| −0.0826 (−1.07) | −0.2100 *** (−7.72) | −0.1208 (−0.94) | −0.2628 *** (−10.89) | |
| Error-correction terms | ||||
| 0.0002 (0.56) | 0.0001 (0.57) | 0.0001 (0.44) | 0.0001 (0.19) | |
| −0.0036 * (−1.98) | −0.0452 *** (−4.55) | −0.0039 * (−1.72) | −0.0451 *** (−4.51) | |
| Panel B: Conditional Variance Equations Own lagged volatility effects | ||||
| 0.0034 (1.14) | −0.0003 (−0.63) | 0.0031 (1.37) | 0.1903 ** (2.75) | |
| 0.0107 *** (3.26) | 0.0002 (0.31) | 0.0048 (1.26) | 0.1986 *** (3.09) | |
| Volatility spillover effects | ||||
| 0.4817 *** (8.57) | 0.2182 *** (2.81) | 0.0914 ** (2.13) | 0.4556 *** (8.12) | |
| 0.2513 *** (5.84) | 0.2521 *** (4.11) | 0.1665 *** (2.96) | 0.1428 * (1.94) | |
| Asymmetry for volatility | ||||
| −9.5389 *** (−70.61) | −150.4575 ** (−2.05) | 13.6072 *** (9.76) | −0.2718 (−1.27) | |
| −0.1886 *** (−3.45) | 0.1574 (0.90) | −0.2426 *** (−3.73) | 0.1362 (1.32) | |
© 2018 by the authors. Licensee MDPI, Basel, Switzerland. This article is an open access article distributed under the terms and conditions of the Creative Commons Attribution (CC BY) license (http://creativecommons.org/licenses/by/4.0/).
Share and Cite
Lv, Q.; Han, L.; Wan, Y.; Yin, L. Stock Net Entropy: Evidence from the Chinese Growth Enterprise Market. Entropy 2018, 20, 805. https://doi.org/10.3390/e20100805
Lv Q, Han L, Wan Y, Yin L. Stock Net Entropy: Evidence from the Chinese Growth Enterprise Market. Entropy. 2018; 20(10):805. https://doi.org/10.3390/e20100805
Chicago/Turabian StyleLv, Qiuna, Liyan Han, Yipeng Wan, and Libo Yin. 2018. "Stock Net Entropy: Evidence from the Chinese Growth Enterprise Market" Entropy 20, no. 10: 805. https://doi.org/10.3390/e20100805
APA StyleLv, Q., Han, L., Wan, Y., & Yin, L. (2018). Stock Net Entropy: Evidence from the Chinese Growth Enterprise Market. Entropy, 20(10), 805. https://doi.org/10.3390/e20100805