Results and Discussion
The biosurfactant was adsorbed onto DEAE-Sephadex™, eluted with 0.2 M ammonium acetate-containing solvent [
12] and further purified by silica-gel column and thin-layer chromatography. It was obtained at a yield of 64 mg (0.64%) from 10 g of the lyophilized material. The surfactant, 2-acyloxyethylphosphonate (AOEP)
1, was a colorless amorphous solid which gave an Rf value of 0.67 on TLC using chloroform/methanol (95/5, v/v).
The spot on TLC was stained by iodine vapor. The
1H-NMR data of the intact AOEP species is summarized in
Table 1. These signals, with the exception of one at 2.80 ppm, suggested that the surfactant contained a mixture of saturated and unsaturated fatty acyl groups. The triplet signal at 2.80 ppm suggested that the CH
2 combined with a hetero atom such as nitrogen or phosphorus.
Table 1.
1H-NMR spectroscopic data for 2-acyloxyethanephosphonate in CD3OD
Table 1.
1H-NMR spectroscopic data for 2-acyloxyethanephosphonate in CD3OD
| Signal | 1H | J (Hz) | 1H-1H COSY
(cross peak) |
|---|
| 1 | 5.3 (2.6H) | (m) | 2, 4 |
| 2 | 2.80 (2H) | (t, 5.8) | 1 |
| 3 | 2.16 (2H) | (t, 7.3) | 5 |
| 4 | 2.07 (0.4H) | (m) | 1, 6, 7 |
| 5 | 1.58 (2H) | (q, 7.3) | 3, 6 |
| 6 | 1.32-1.28 (22H) | (broad m) | 4, 5, 8 |
| 7 | 0.96 (0.3H) | (t, 7.3) | 4 |
| 8 | 0.89 (2.7H) | (t, 7.0) | 6 |
In order to identify the fatty acyl group present, the surfactant was subjected to methanolysis using 1.0M HCl-containing methanol at 80 °C for 20 h. Fatty acid methyl esters were extracted with
n-hexane, and analyzed by GC-MS using chemical ionization (CI) and electron impact ionization (EI). The CI-MS and EI-MS data indicated the presence of tetradecanoic [Rt, 8.21 min; CI: m/z 243 (M+1)
+; EI: m/z 242 (M
+)], hexadecatrienoic [Rt, 9.20 min; CI: m/z 265 (M+1)
+; EI: m/z 264 (M
+)], hexadecanoic [Rt, 9.34 min; CI: m/z 271 (M+1)
+; EI: m/z 270 (M
+)] and octadecatrienoic [Rt, 10.22 min; CI: 293 (M+1)
+; EI: m/z 292 (M
+)] acids. Fragments of the unsaturated fatty acids were observed by EI-MS: M
+- m/z 29 (CH
3-CH
2), M
+- m/z 55 (CH
3-CH
2-CH=CH), M
+- m/z 81 (CH
3-CH
2-CH=CH- CH=CH), m/z 107 (CH
3-CH
2- CH=CH-CH=CH -CH=CH) and m/z 121 (CH
3-CH
2- CH=CH-CH=CH- CH=CH-CH
2). These results suggest that the double bond positions of the unsaturated fatty acids are located at ω-3, 5 and 7. The fatty acid composition is shown in
Table 2. The most abundant fatty acid was hexadecanoic (palmitic) acid, which amounted to 84.1%. The unsaturated fatty acids accounted for about 10% of the total fatty acid, and were all ω-3 type.
Table 2.
Fatty acid composition of 2-acyloxyethanephosphonate.
Table 2.
Fatty acid composition of 2-acyloxyethanephosphonate.
| Fatty acid | Composition (%) |
|---|
| C14 | 5.3 |
| C16 | 84.1 |
| C16:3,Δ 7,10,13 | 4.8 |
| C18:3,Δ 9,12,15 | 5.8 |
After the extraction of fatty acid methyl esters from the methanolysate, the phosphonic acid-containing aqueous solution was condensed under reduced pressure, and analyzed by LC-MS. The phosphonic acid-containing compound was detected at 9.74 min in the positive mode of total ion and the selected ion monitors at m/z 126 (M
+) and 125 (M-H)
+. The results suggested that the phosphonic acid-containing compound was 2-hydroxyethylphosphonic acid (HO-CH
2-CH
2-PO
3H
2). The C-P linkage was confirmed by hydrolysis with 5 M H
2SO
4 for the hydrolysis of ester phosphorus and with 70% perchloric acid (V/V) for the hydrolysis of phosphonate phosphorus [
13]. The phosphorus linkage of the water soluble compound in the methanolysate could be hydrolyzed with 70% perchloric acid, but not 5 M H
2SO
4. From this result, the phosphorus linkage of the surfactant was identified as phosphonate (C-P).
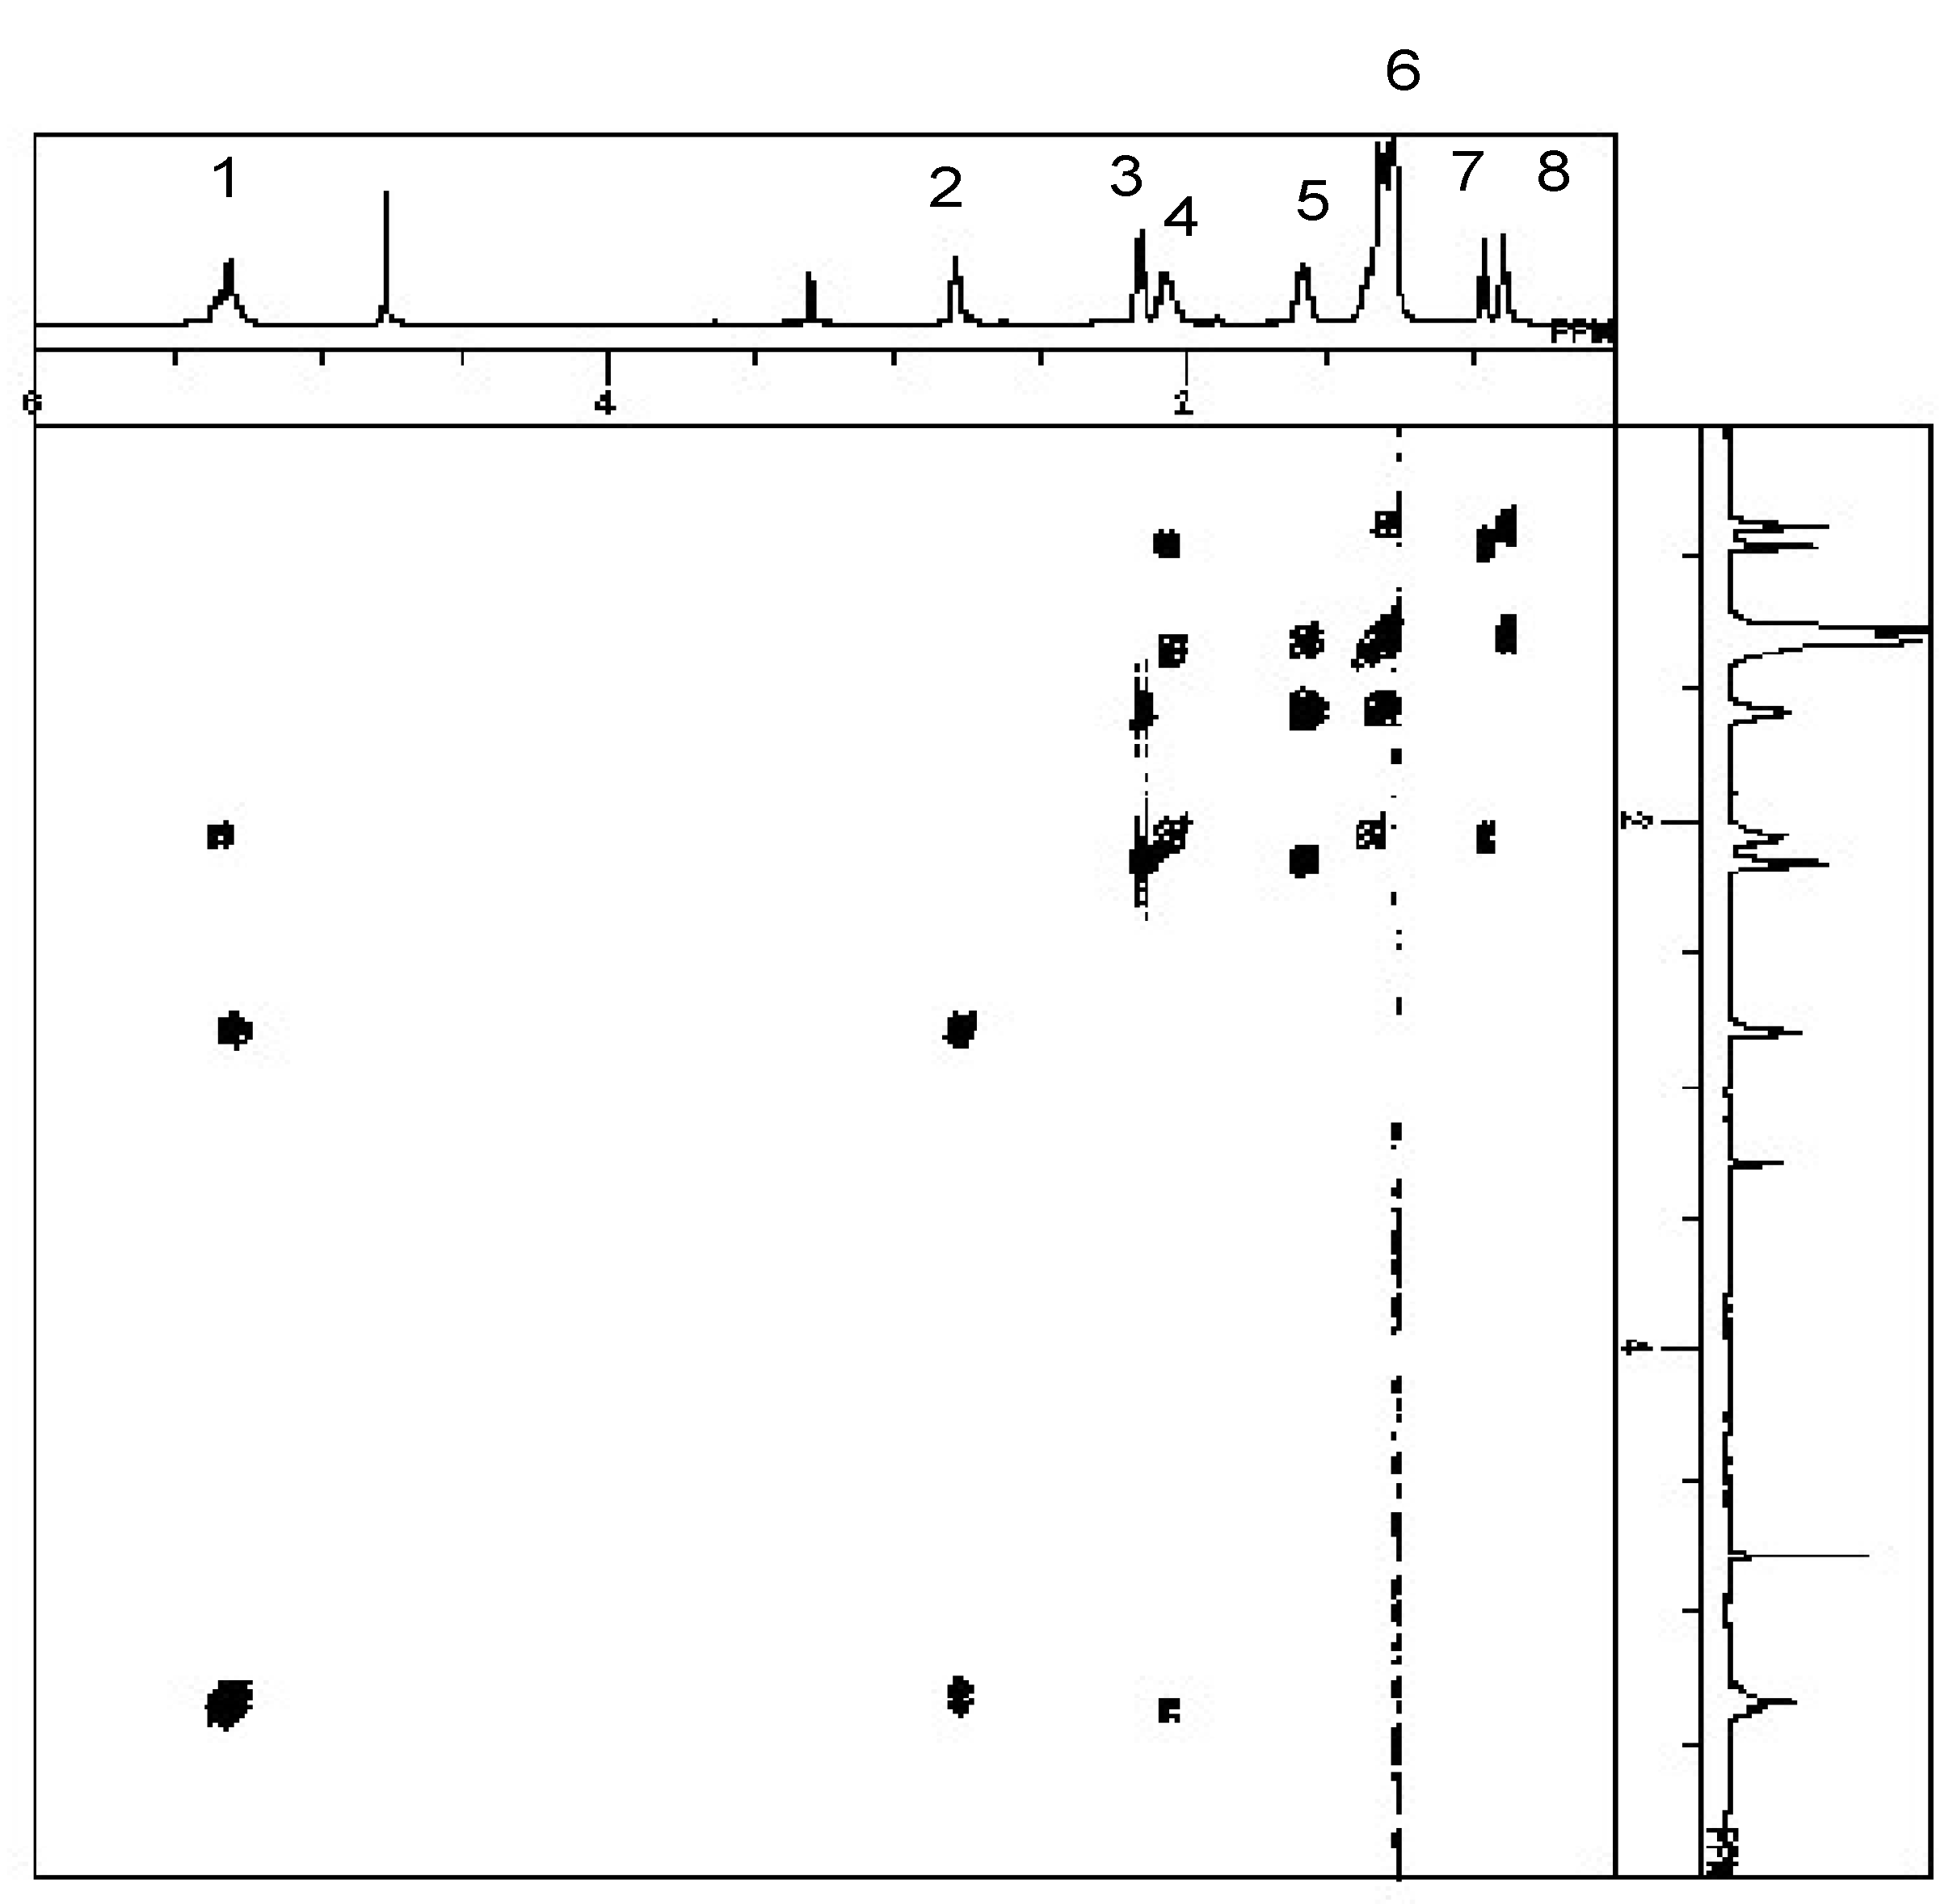
To elucidate the structure of the intact surfactant, the
1H-
1H COSY spectrum was observed. In the spectrum (
Figure 1), the cross peak between the signals at 5.3 ppm (2.6H, multiplet) and 2.80 ppm (2H, triplet, J= 5.8 Hz) suggested that the protons on the alcoholic carbon esterified with the carboxyl group of the fatty acid that is located at the neighbouring CH
2-P, while the cross peak between the signal at 5.3 ppm and 2.07 ppm (0.4H, multiplet) was assigned to protons on the carbon neighbouring olefin (CH=CH-
CH2-) of the unsaturated fatty acid. The remaining signals of the
1H-NMR spectrum were assigned as follows: 5.3 ppm (multiplet, olefin protons of fatty acid and -C(=O)-O-C
H2-CH
2-P); 2.80 ppm (O-CH
2-C
H2-P); 2.16 ppm (CH
2-C
H2-COO of fatty acid); 2.07 ppm (CH=CH-C
H2- of fatty acid); 1.58 ppm (-C
H2-CH
2-COO of fatty acid); 1.32-1.28 ppm (-C
H2-CH
2-CH=CH- of unsaturated fatty acid and C
H2 of saturated fatty acid), 0.96 ppm (C
H3 of unsaturated fatty acid), and 0.89 ppm (C
H3 of saturated fatty acid).
Figure 1.
1H-1H COSY spectrum of 2-acyloxyethylphosphonate isolated from cyanobacterial waterbloom material. CD3OD was used as the solvent.
Figure 1.
1H-1H COSY spectrum of 2-acyloxyethylphosphonate isolated from cyanobacterial waterbloom material. CD3OD was used as the solvent.
From the above assignment and the identification of 2-hydroxyethylphosphonic acid, the structure of the surfactant was elucidated as 2-acyloxyethylphosphonate, and the most abundant molecule as 2-hexadecanolyloxyethylphosphonate. In order to confirm the elucidation, a model derivative was synthesized. The synthesized/authentic surfactant, 2-oleoyloxyethylphosphonate, gave the same Rf value (0.67) as that of the surfactant isolated from A. flos-aquae on a HPTLC plate developed with chloroform/methanol (95:5, v/v) as the solvent. In the 1H-1H-COSY spectrum of the authentic surfactant, the correlation peak between the triplet at 2.80 ppm and the multiplet at 5.3 ppm was observed. The chemical shifts and the correlation were completely agreed with that of the surfactant isolated from A. flos-aquae. After methanolysis of the synthetic compound, 2-hydroxyethyl- phosphonate was detected at 9.74 min in the total ion positive mode and the selected ion monitors at m/z 126 (M+) and 125 (M-H)+ by LC-MS. From the results, the structure of the surfactant was identified as 2-acyloxyethylphosphonate.
The surfactant activity of AOEP isolated from
A. flos-aquae can be measured by demonstrating a reduction in surface tension. In this study, a drop spreading test modified from Hildebrand [
14] was used to measure the effectiveness of AOEP dissolved in deionised water (dH
2O) or methanol (MeOH) at reducing the surface tension of a drop of dH
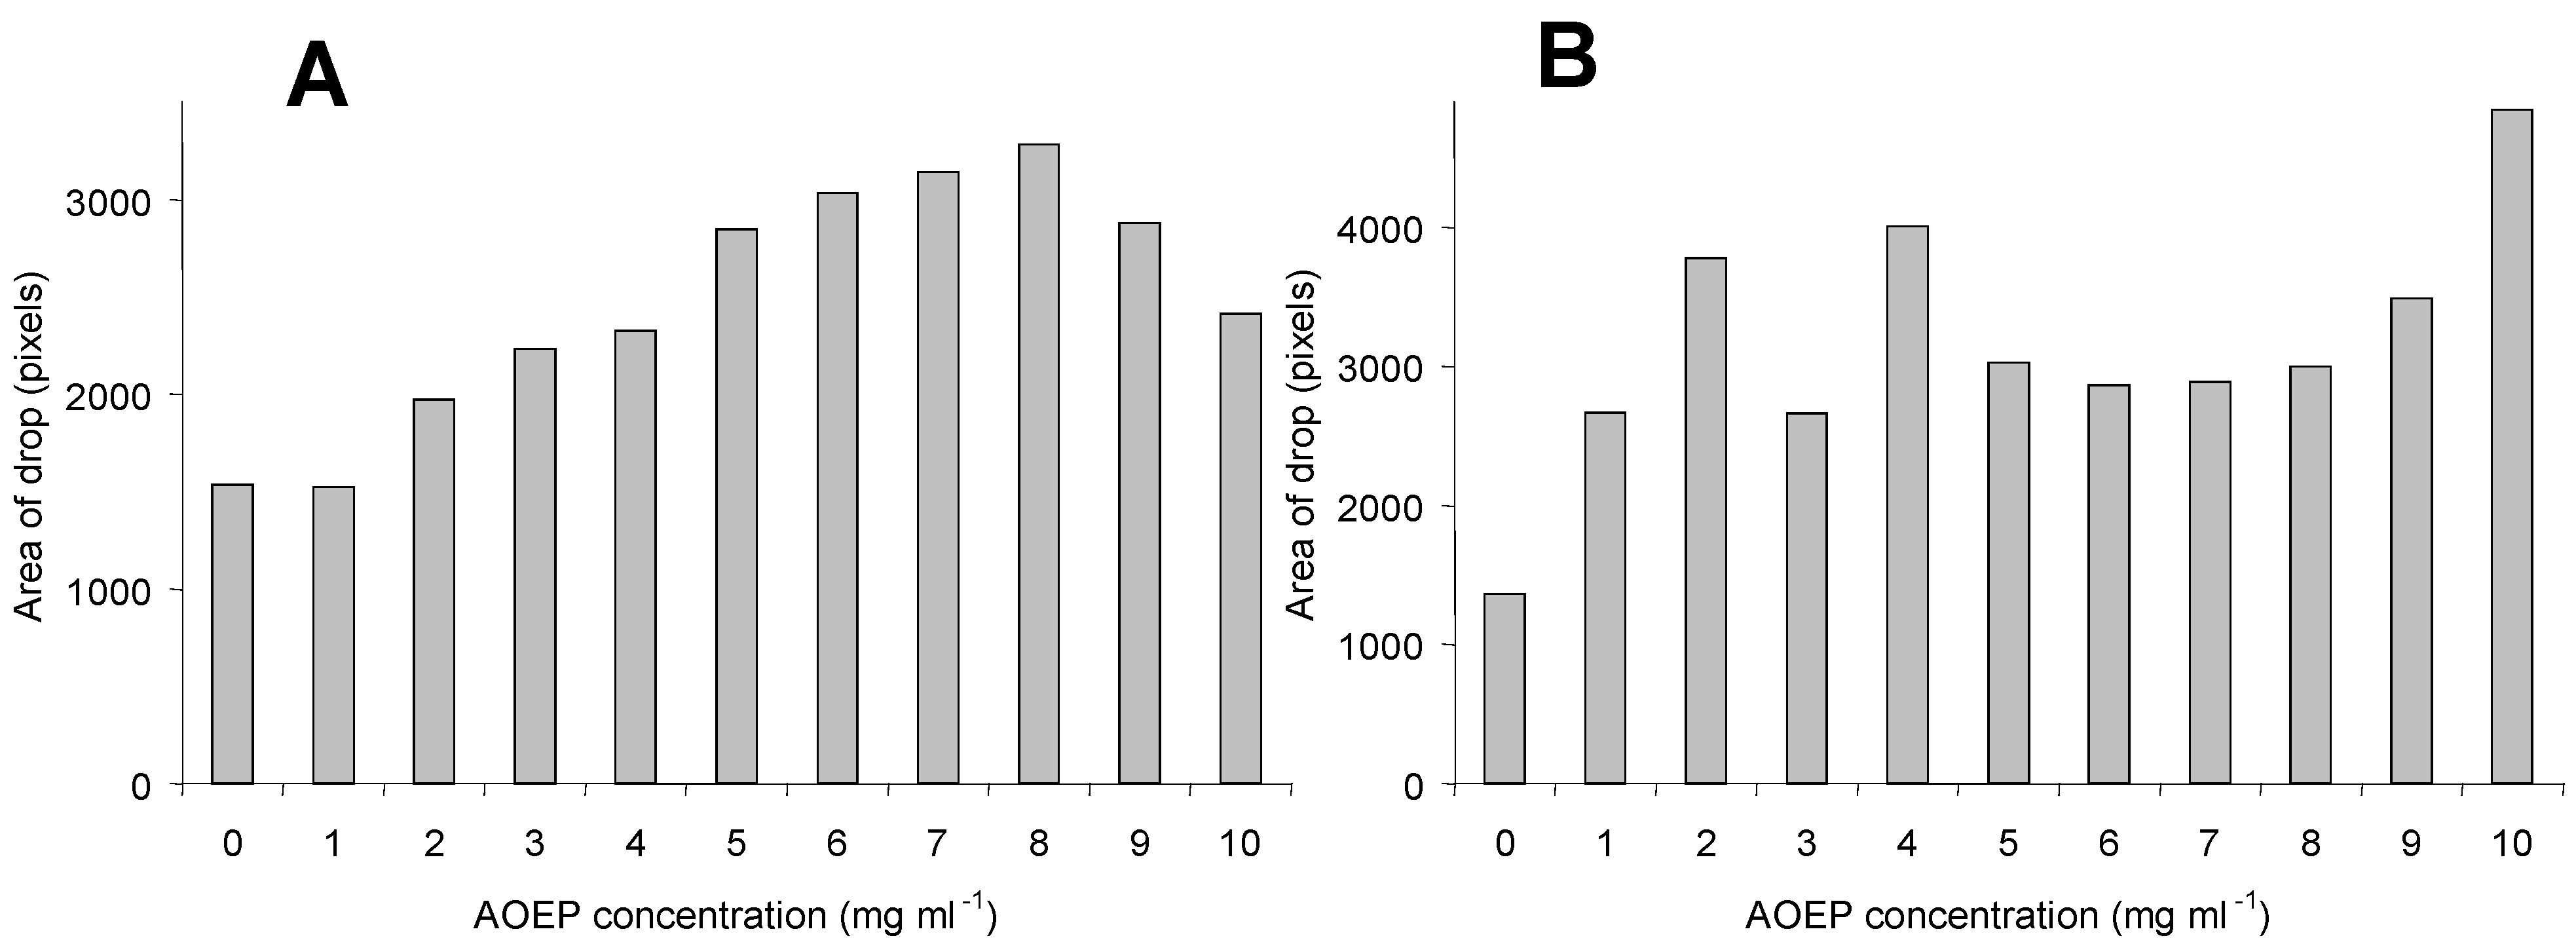
2O by measuring the area the drop covers when no longer spherical. The results are shown in
Figure 2A and
Figure 2B.
AOEP was dissolved in 10 μL dH
2O or 10 μL MeOH and added to a 10 μL drop of dH
2O. The concentrations in dH
2O were 50 to 0 mg/mL, and 10 to 0 mg/mL in MeOH. In SigmaScan Pro V5.0.0 (SPSS Inc), drops were identified and areas measured in pixels with an auto threshold range for objects 70% darker than background image. The area of each drop containing the surfactant was compared to the control (0: dH
2O in
Figure 2A and MeOH in
Figure 2B). On addition of AOEP in water at concentrations of 2-10 mg/mL and 50 mg/mL, the spherical shape of water droplet spread on the Petri dish surface covering an area that was greater than the water control (
Figure 2). The drop areas were increased to 8 mg/mL, and then reduced. From the concentration of AOEP at the inflection point (
Figure 2E), the critical micelle concentration (CMC) was calculated to be about 22 mM when the molecular of AOEP isolated from
A. flos-aquae was regarded as hexadecanoyloxyethylphosphonic acid (mw. 364). The drop areas measured when AOEP was dissolved in MeOH were more irregular than those with water. However, concentrations of the surfactant from 1- 10 mg/mL in MeOH resulted in the water droplet spreading to a greater area than the control to which 10 μL of MeOH was added. When dissolved in water, there was little difference between the area of the control drop and 1 mg/mL drop but this was not the case when AOEP was dissolved in MeOH.
The solubility of different compounds in solvents can vary. In this case, the surfactant appears to be more soluble in MeOH than water. This may account for the increased drop area measured at 1 mg/mL AOEP in MeOH compared to water. AOEP is found to be more soluble in solution as a sodium salt. When dissolved in sodium carbonate buffer as an aqueous carrier, surfactant properties similar to those measured in MeOH may be observed, but without the irregularity of MeOH use. Surface tension is the property of water that allows a water droplet to remain spherical and AOEP clearly has the ability to reduce surface tension, consistent with its surfactant activity. AOEP was found to be non-toxic in brine shrimp bioassays at concentrations up to 50 μg/mL. The assays were conducted at AOEP concentrations between 0.05 and 50 μg/mL. C-P linkage-containing compounds are widely distributed among many species of protozoa, animals, bacteria, and other biota [
15]. However, the C-P compounds have not been previously identified in cyanobacteria. In many cases, 2-aminoethanephosphonate [
9] or its
N-methyl analogues [
16,
17] have been identified as the C-P linkage-containing moiety of lipids, whereas 2-hydroxyethane phosphonate was identified as the moiety of the biosurfactant isolated from the cyanobacterium,
A. flos-aquae. Whether the biosurfactant has a natural role in the ecological functions of the cyanobacterium is unknown and requires investigation.
Figure 2.
Drop spreading test of 2-acyloxyethylphosphonate (AOEP) isolated from waterblooms of
Aphanizomenon floa-aquae. The drop spreading test was used to measure the effectiveness of AOEP dissolved in deionised water (
Figure 2A) or methanol (
Figure 2B) at reducing the surface tension of a drop of deionised water by measuring the area the drop covers when no longer spherical.
Experimental
General
Ethylene chlorohydrin, phosphorus acid and oleic acid chloride were obtained from Wako Chemicals, Osaka, Japan. All solvents were of analytical grade. NMR spectra were recorded on a JEOL JNM A-500 spectrometer (500 MHz). The 1H chemical shift was referenced to CD3OD signal (1H, δ 3.30 ppm). Homonuclear 1H connectivities were determined from COSY experiments. Gas chromatograms were recorded on a HP-5890 GC (Hewlett-Packard, USA) using a methyl silicone capillary column (25 m x 0.32 mm x 0.25 μm). The instrument was temperature-programmed from 60 to 250 ºC at 20 ºC/min, then 250 to 300 ºC at 4 ºC/min. Electron impact (EI) and chemical ionization (CI) (reagent gas iso-butane) MS spectra were obtained with a JEOL JMS 700 (JEOL, Tokyo, Japan). MS data were obtained under the following conditions: ionization current, 300mA; ionization energy, 70 eV; accelerating voltage, 3 kV; scan range, m/z 50-500. Liquid chromatographic data were acquired with an LC10AD system (Shimadzu, Japan) combined with a Shimadzu LC-MS 2010 and equipped with a Zorbax ODS column. The mobile phase was used 0.1% aqueous formic acid (v/v) and methanol. The methanol concentration was increased from 0 to 80% over 40 min (0 to 55% methanol for 10 min, then 55 to 80% methanol for 20 min, and held 80% methanol for 10 min) with a flow rate of 0.2 mL/min and a column temperature of 40 ºC. The MS spectra were detected in the conditions of positive mode ionization, electrospray ionization (ESI) and scan range, m/z 50-400.
Cyanobacterial bloom samples
Waterblooms of Aphanizomenon flos-aquae were collected in August, 2004 from surface water of Balgavies Loch, Forfa, Scotland. The collected material was frozen at -20 ºC immediately, lyophilized and the resulting cell powder stored in the University of Dundee cyanobacterial archive at -20 ºC (sample ID: 160903 85).
Extraction and isolation
Lyophilized cells of
A. flos-aquae (10 g dry wt.) were extracted with MeOH. The extract was evaporated under reduced pressure. The remaining residue was suspended with chloroform/methanol/water (3:7:1, v/v), and applied to a DEAE-Sephadex™ column (20 mm I.D. x 300 mm). After the column was washed with chloroform/methanol/0.05 M ammonium acetate (200 mL, 3:7:1, v/v), the surfactant was eluted with chloroform/methanol/0.2 M ammonium acetate (200 mL, 3:7:1, v/v). The surfactant fraction was evaporated under reduced pressure and suspended with chloroform. The suspension was further applied to a silica gel column (20 mm I.D. x 300 mm, Iatrobeads, Iatron Laboratories, Tokyo, Japan). The column was washed with chloroform and a mixture of methanol-chloroform (20:80, v/v). The surfactant was eluted with a methanol-chloroform mixture (200 mL, 40:60, v/v). The eluted surfactant was further purified by HPTLC (E.Merck, Silica gel 60 containing fluorescent indicator) using chloroform/methanol (95:5, v/v) as the solvent.
2-Acyloxyethylphosphonate: 64 mg (0.64% yield); colorless amorphous solid; for
1H-NMR spectra, see
Table 1 and
Figure 1.
Methanolysis of 2-acyloxyethylphosphonate
2-Acyloxyethylphosphonate (100 μg) was methanolyzed with 1.0 M HCl-containing methanol at 80 °C for 20 h. After the methanolysis, water (2 mL) was added in the solution and fatty acid methyl esters were extracted with n-hexane and analyzed by GC-MS using CI and EI. The remaining aqueous solution was condensed under a reduced pressure for LC-MS analysis of the phosphonate compound. GC-MS data of fatty acid methyl esters: tetradecanoic acid methyl ester: Rt, 8.30 min.; CI, m/z 243 (M+1)+; EI, m/z 232 (M+), 199, 143, 87 and 74 (base peak); hexadecanoic acid methyl ester: Rt, 9.34 min.; CI, m/z 271 (M+1)+; EI, m/z 227 (M+), 171, 87, 74 (base peak); hexadecatrienoic acid methyl ester: Rt, 9.20 min.; CI, m/z 265 (M+1)+; EI, m/z 264 (M+), 235, 163, 149, 135, 121, 107, 95, 79 (base peak); octadecatrienoic acid methyl ester: Rt, 10.22 min.; CI, m/z 293 (M+1)+; EI, m/z 292 (M+), 263, 163, 149, 135, 121, 95 (base peak), 79. LC-MS data of 2-hydroxyethylphosphonic acid: Rt, 9.74min.; ESI (positive), m/z 126 (M+) and 125 (base peak).
Analysis of the phosphorus linkage
The C-P linkage was confirmed by the hydrolysis with 5 M H
2SO
4 for the hydrolysis of ester phosphorus and with 70% perchloric acid for the phosphonate phosphorus [
13]. The phosphorus linkage of the water soluble compound in the methanolysate could be hydrolyzed with 70% perchloric acid, but not 5 M H
2SO
4. From this result, the phosphorus linkage of the biosurfactant was identified as phosphonate (C-P).
Synthesis of 2-oleoyloxyethylphosphonate
Ethylene oxide was derived from ethylene chlorohydrin in 1M sodium hydroxide solution at 4 ºC, and distilled at 12.5 ºC. Dropwise addition of phosphorus acid (0.1 mol) to 10% aqueous ethylene oxide (0.1 mol) at 0 ºC gave 2-hydroxyethylphosphonic acid in 30% yield. Oleic acid (9-cis-octadecenoic acid) chloride (0.01 mol) was added to 2-hydroxyethylphosphonic acid (0.01 mol)-containing dry pyridine at -20 ºC. The yield of 2-oleoyloxyethylphosphonate was 56%. 1H-NMR: 5.3 ppm (4H, m, oleic acid olefin protons and C(=O)-O-CH2-CH2-P), 2.80 ppm (2H, t, J=5.8 Hz, C(=O)-O-CH2-CH2-P ), 2.16 ppm (2H, t, J=7.3 Hz, -CH2-C(=O)-), 2.07 ppm (4H, m, -CH2-CH=CH-), 1.58 ppm (2H, quart., -CH2-CH2-CH2-(=O)-O), 1.32-1.28 ppm (20H, broad m, -CH2-CH2-CH=CH- and -CH2-CH2-CH2-CH2-CH2), and 0.89 ppm (3H, t, J=7.0 Hz, -CH3).
Surfactant activity measurement
Concentrations of AOEP dissolved in dH2O (10 μL) or MeOH (10 μL) were added to 10 μL drops of water on a polystyrene Petri dish and stained with methylene blue (0.5 μL, 5 g/L). Additions of dH2O (10 μL) and MeOH (10 μL ) were used as controls. Samples were photographed and the area covered by drop measured in pixels by SigmaScan Pro 5.0.0 (SPSS Inc).
Toxicity Test
AOEP was dissolved in water at concentrations of 100, 50, 10, 5, 1, 0.5 and 0.1 μg/mL. The brine shrimp (
Artemia salina) assay was carried out according to Campbell
et al. [
18]. Briefly,
A. salina cysts (Sciento, Manchester) were inoculated into artificial seawater (ASW, Coral Reef Red Sea Salt, Red Sea Fish Pharm, Israel) and incubated at room temperature under constant illumination. At 24 h, hatched nauplii were transferred to fresh ASW and incubated for a further 24 h. At 48 h, 15-20 nauplii were transferred in 100 μL aliquots of ASW to the wells of a 96-well microtitre plate. A sample (100 μL) was added to each nauplii-containing well. The plates were covered and incubated as before. The number of dead organisms in each well was noted at 24 h.


