
Energy Substrate Transporters in High-Grade Ovarian Cancer: Gene Expression and Clinical Implications

 , , , ,
  , and
, and
Abstract
:1. Introduction
2. Results
2.1. Patient Characteristics
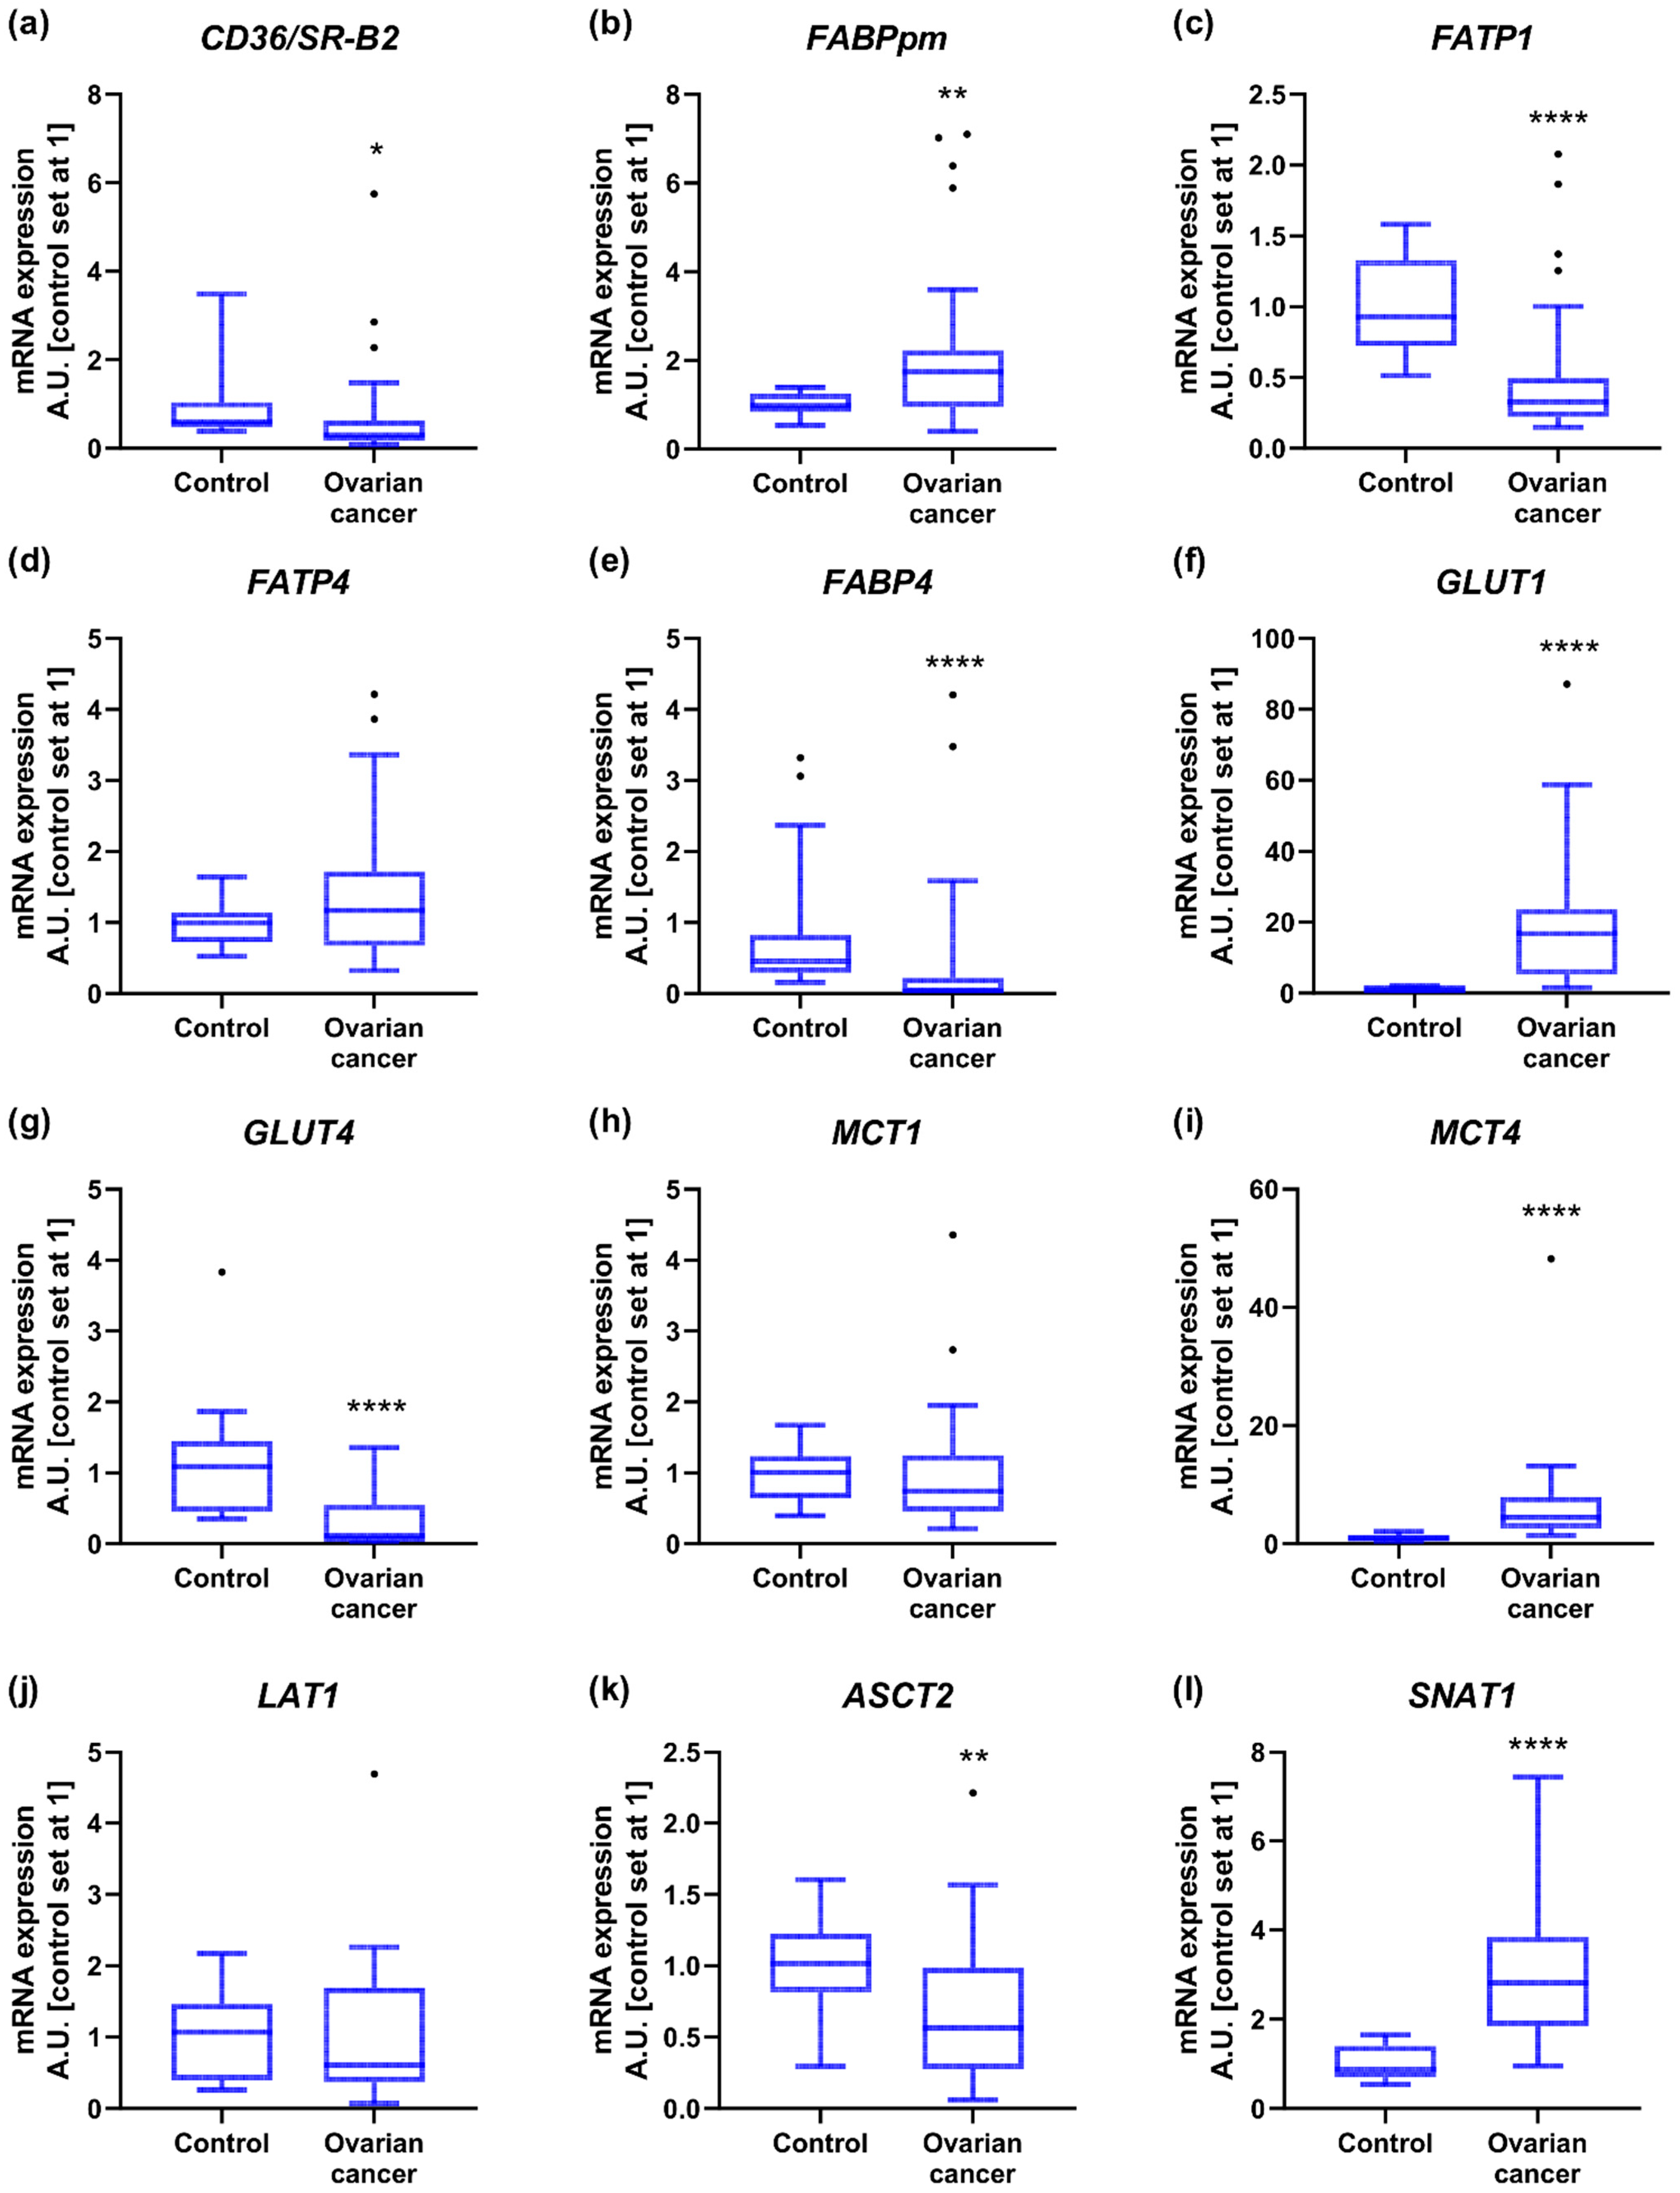
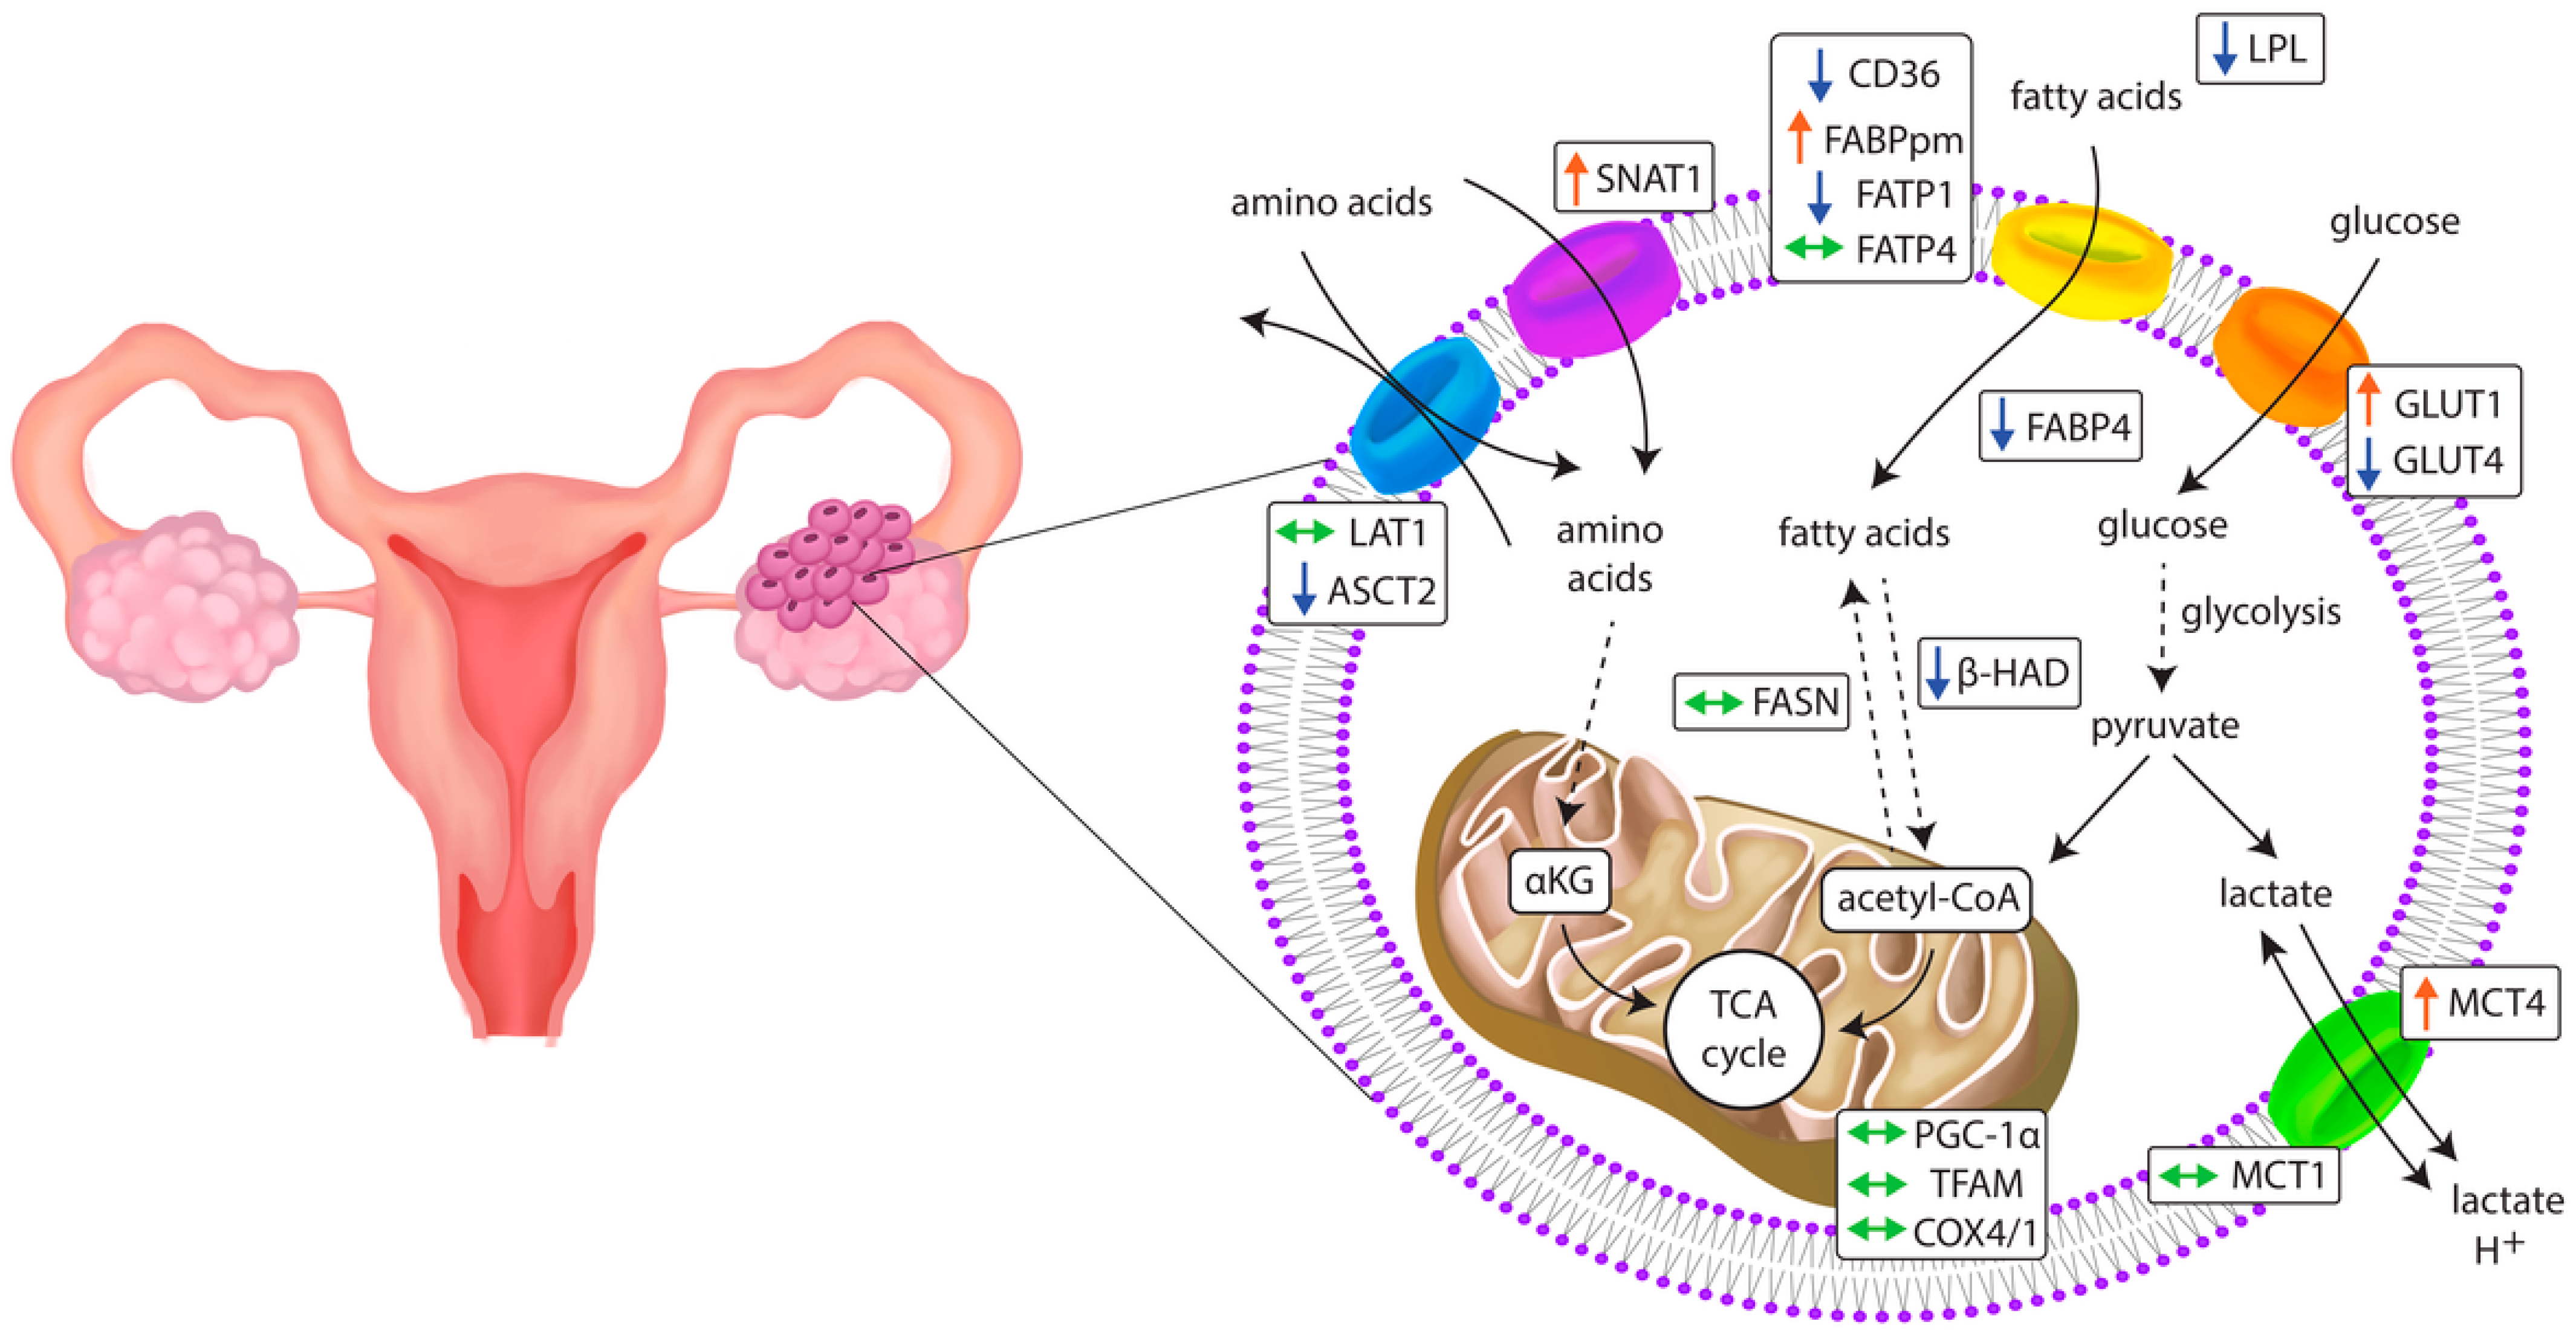
2.2. Energy Substrate Transporters and Metabolism-Related Gene Expression
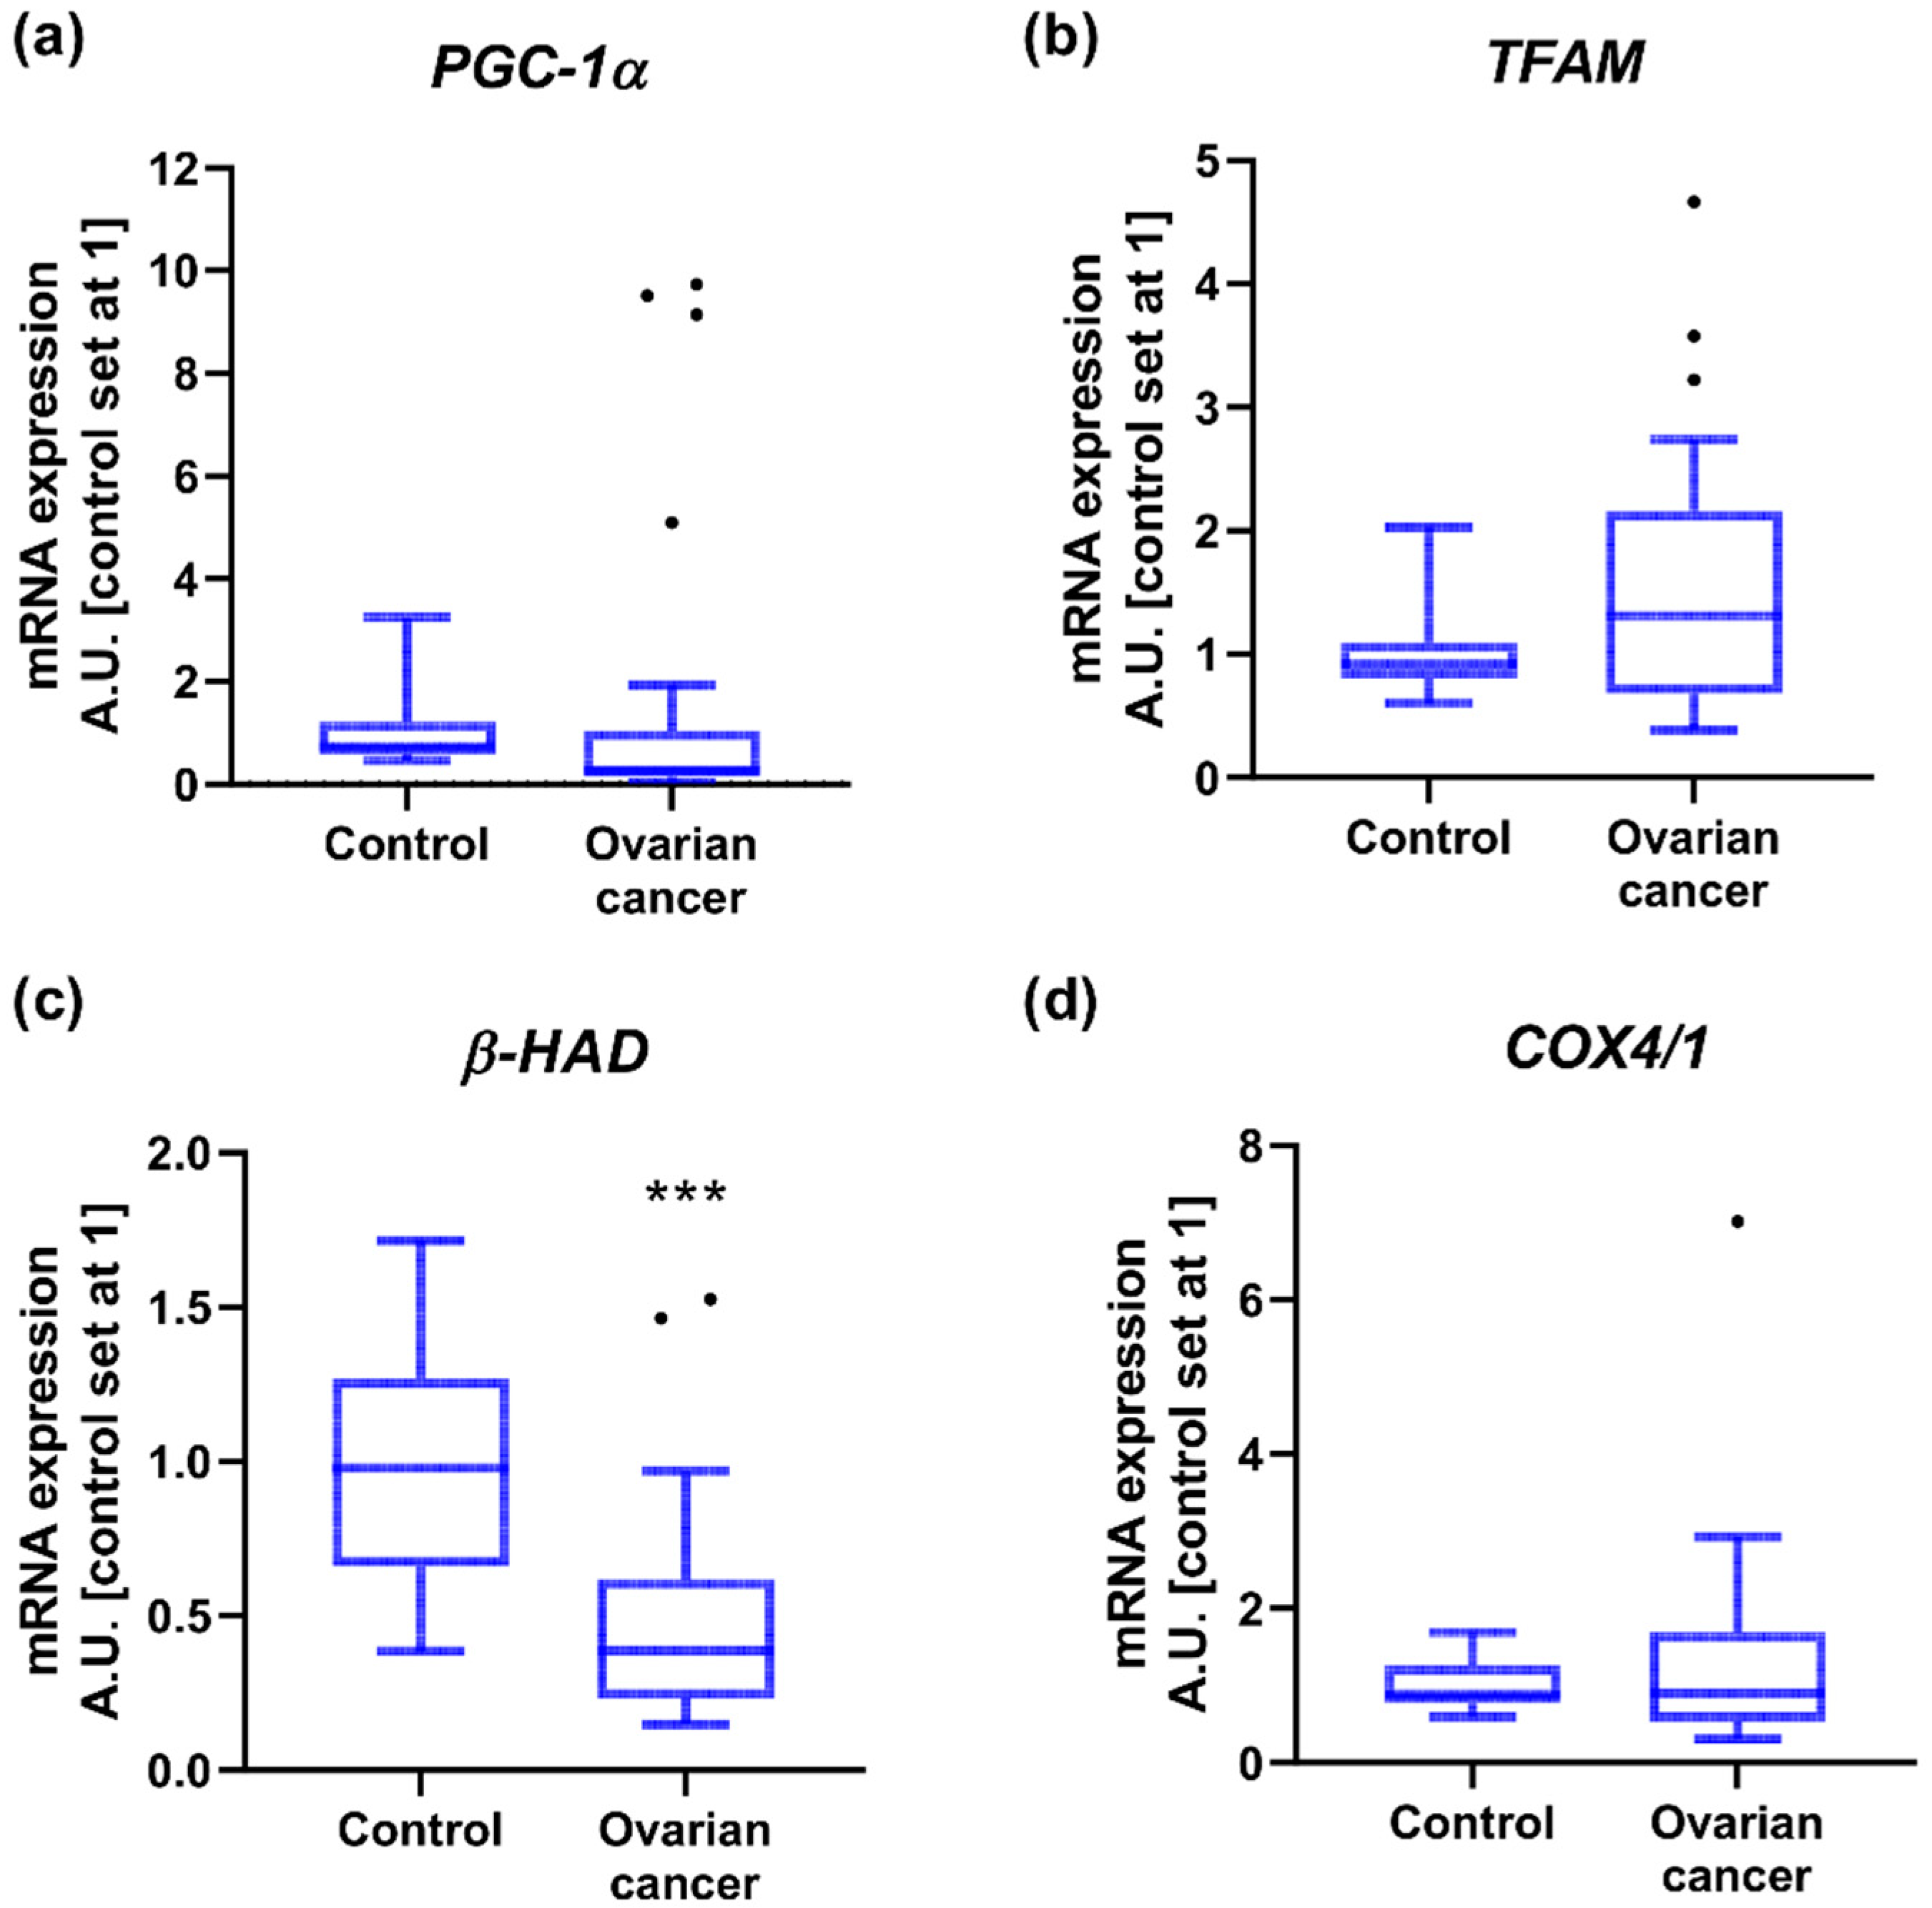
2.3. Mitochondrial Gene Expression
2.4. Associations of Gene Expression with BMI in Patients with Ovarian Cancer
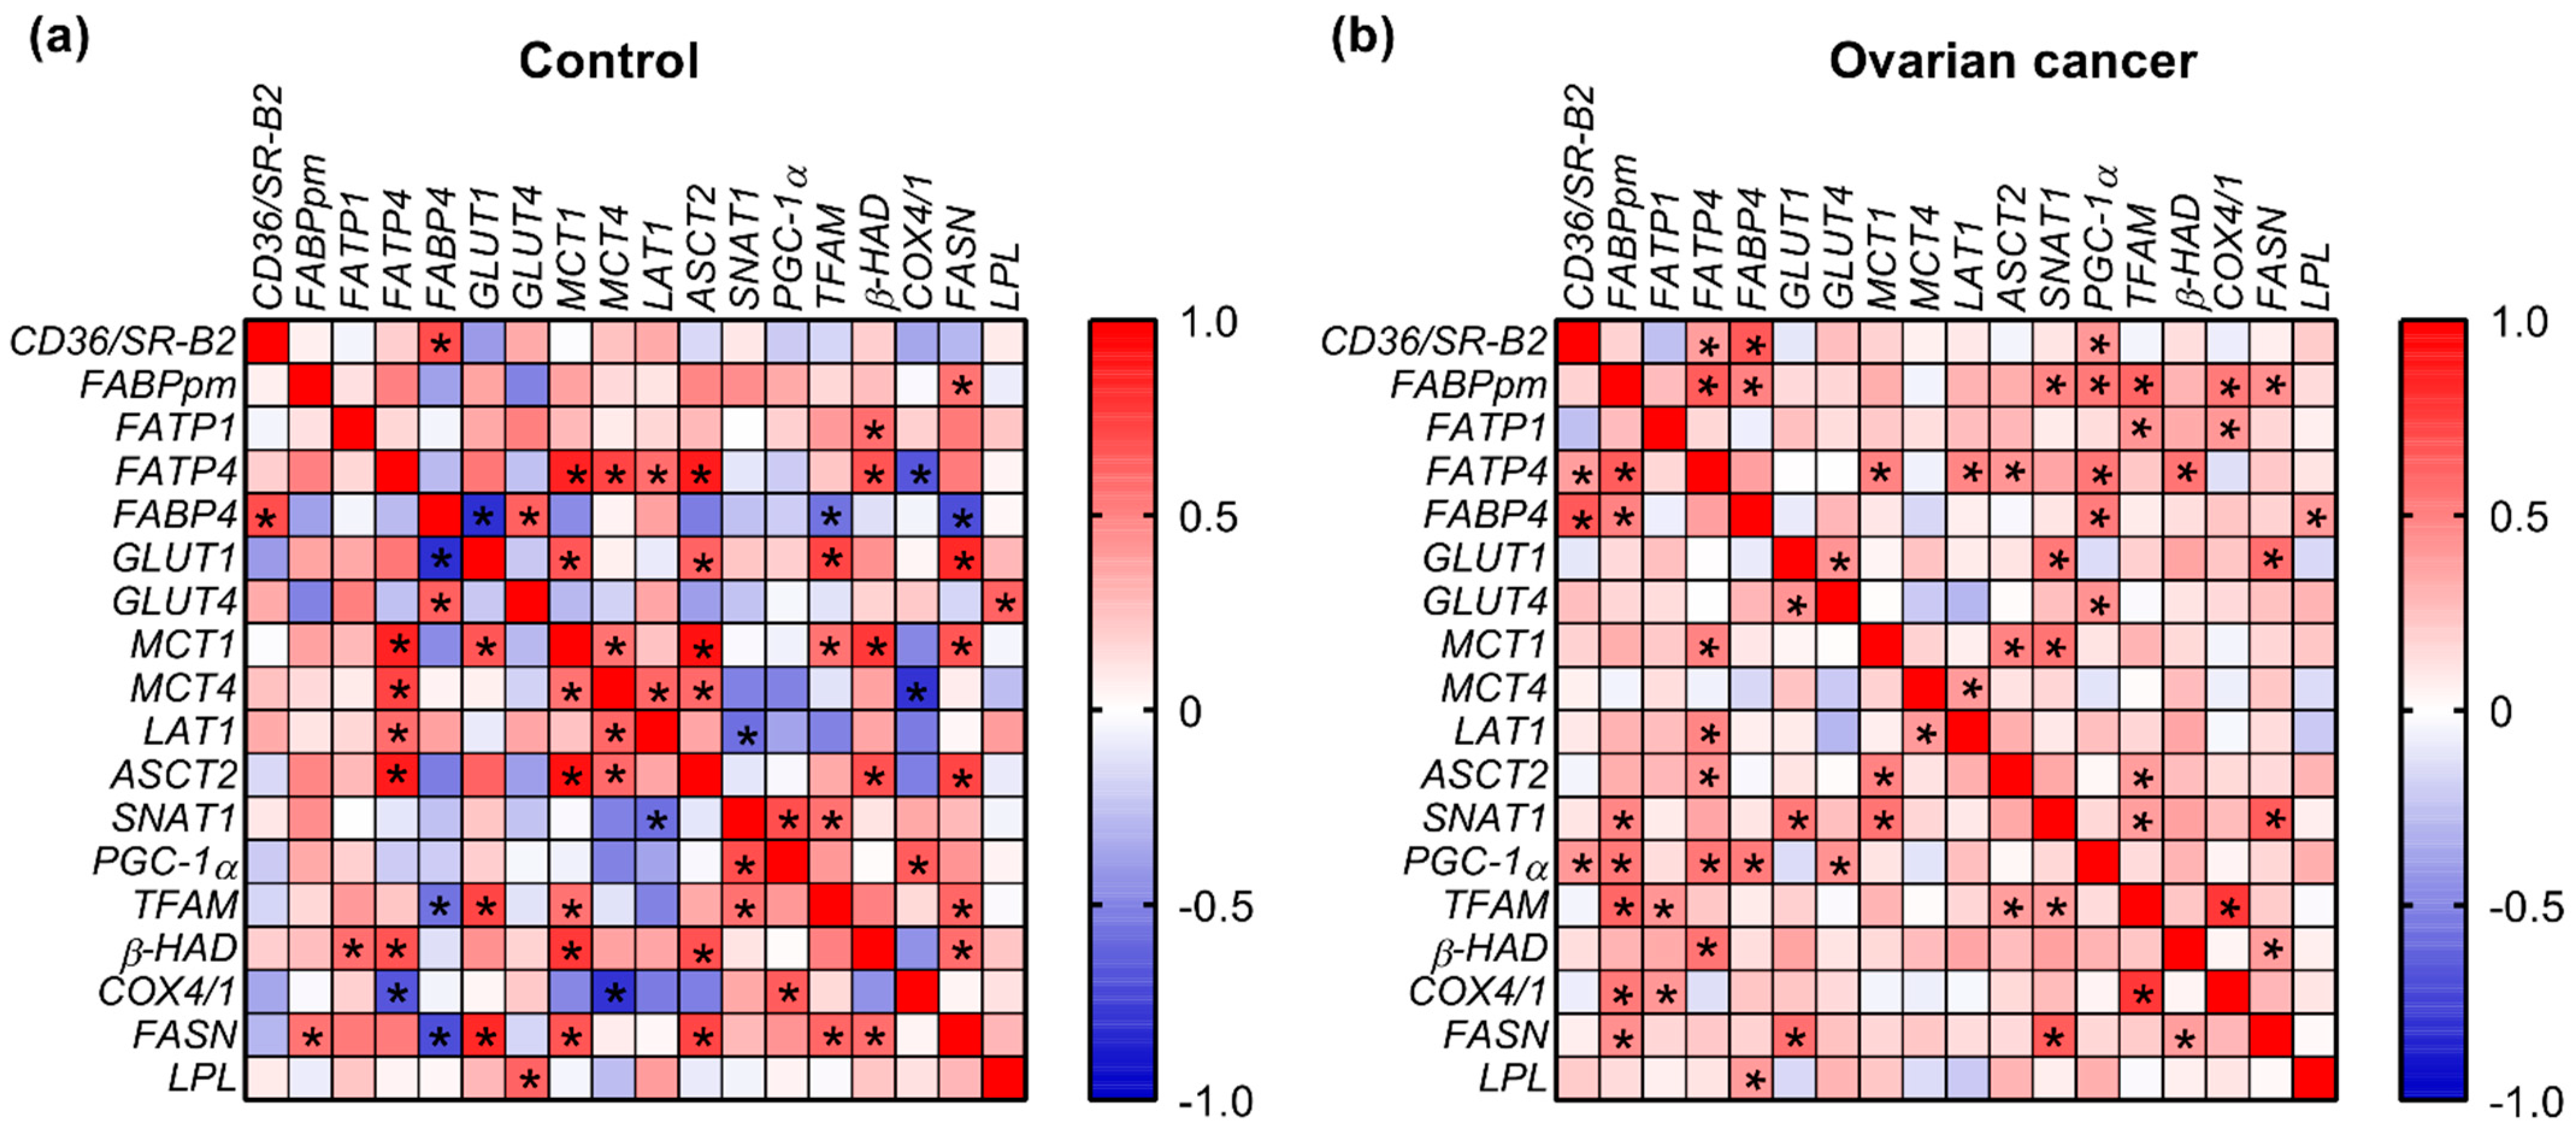
2.5. Correlations
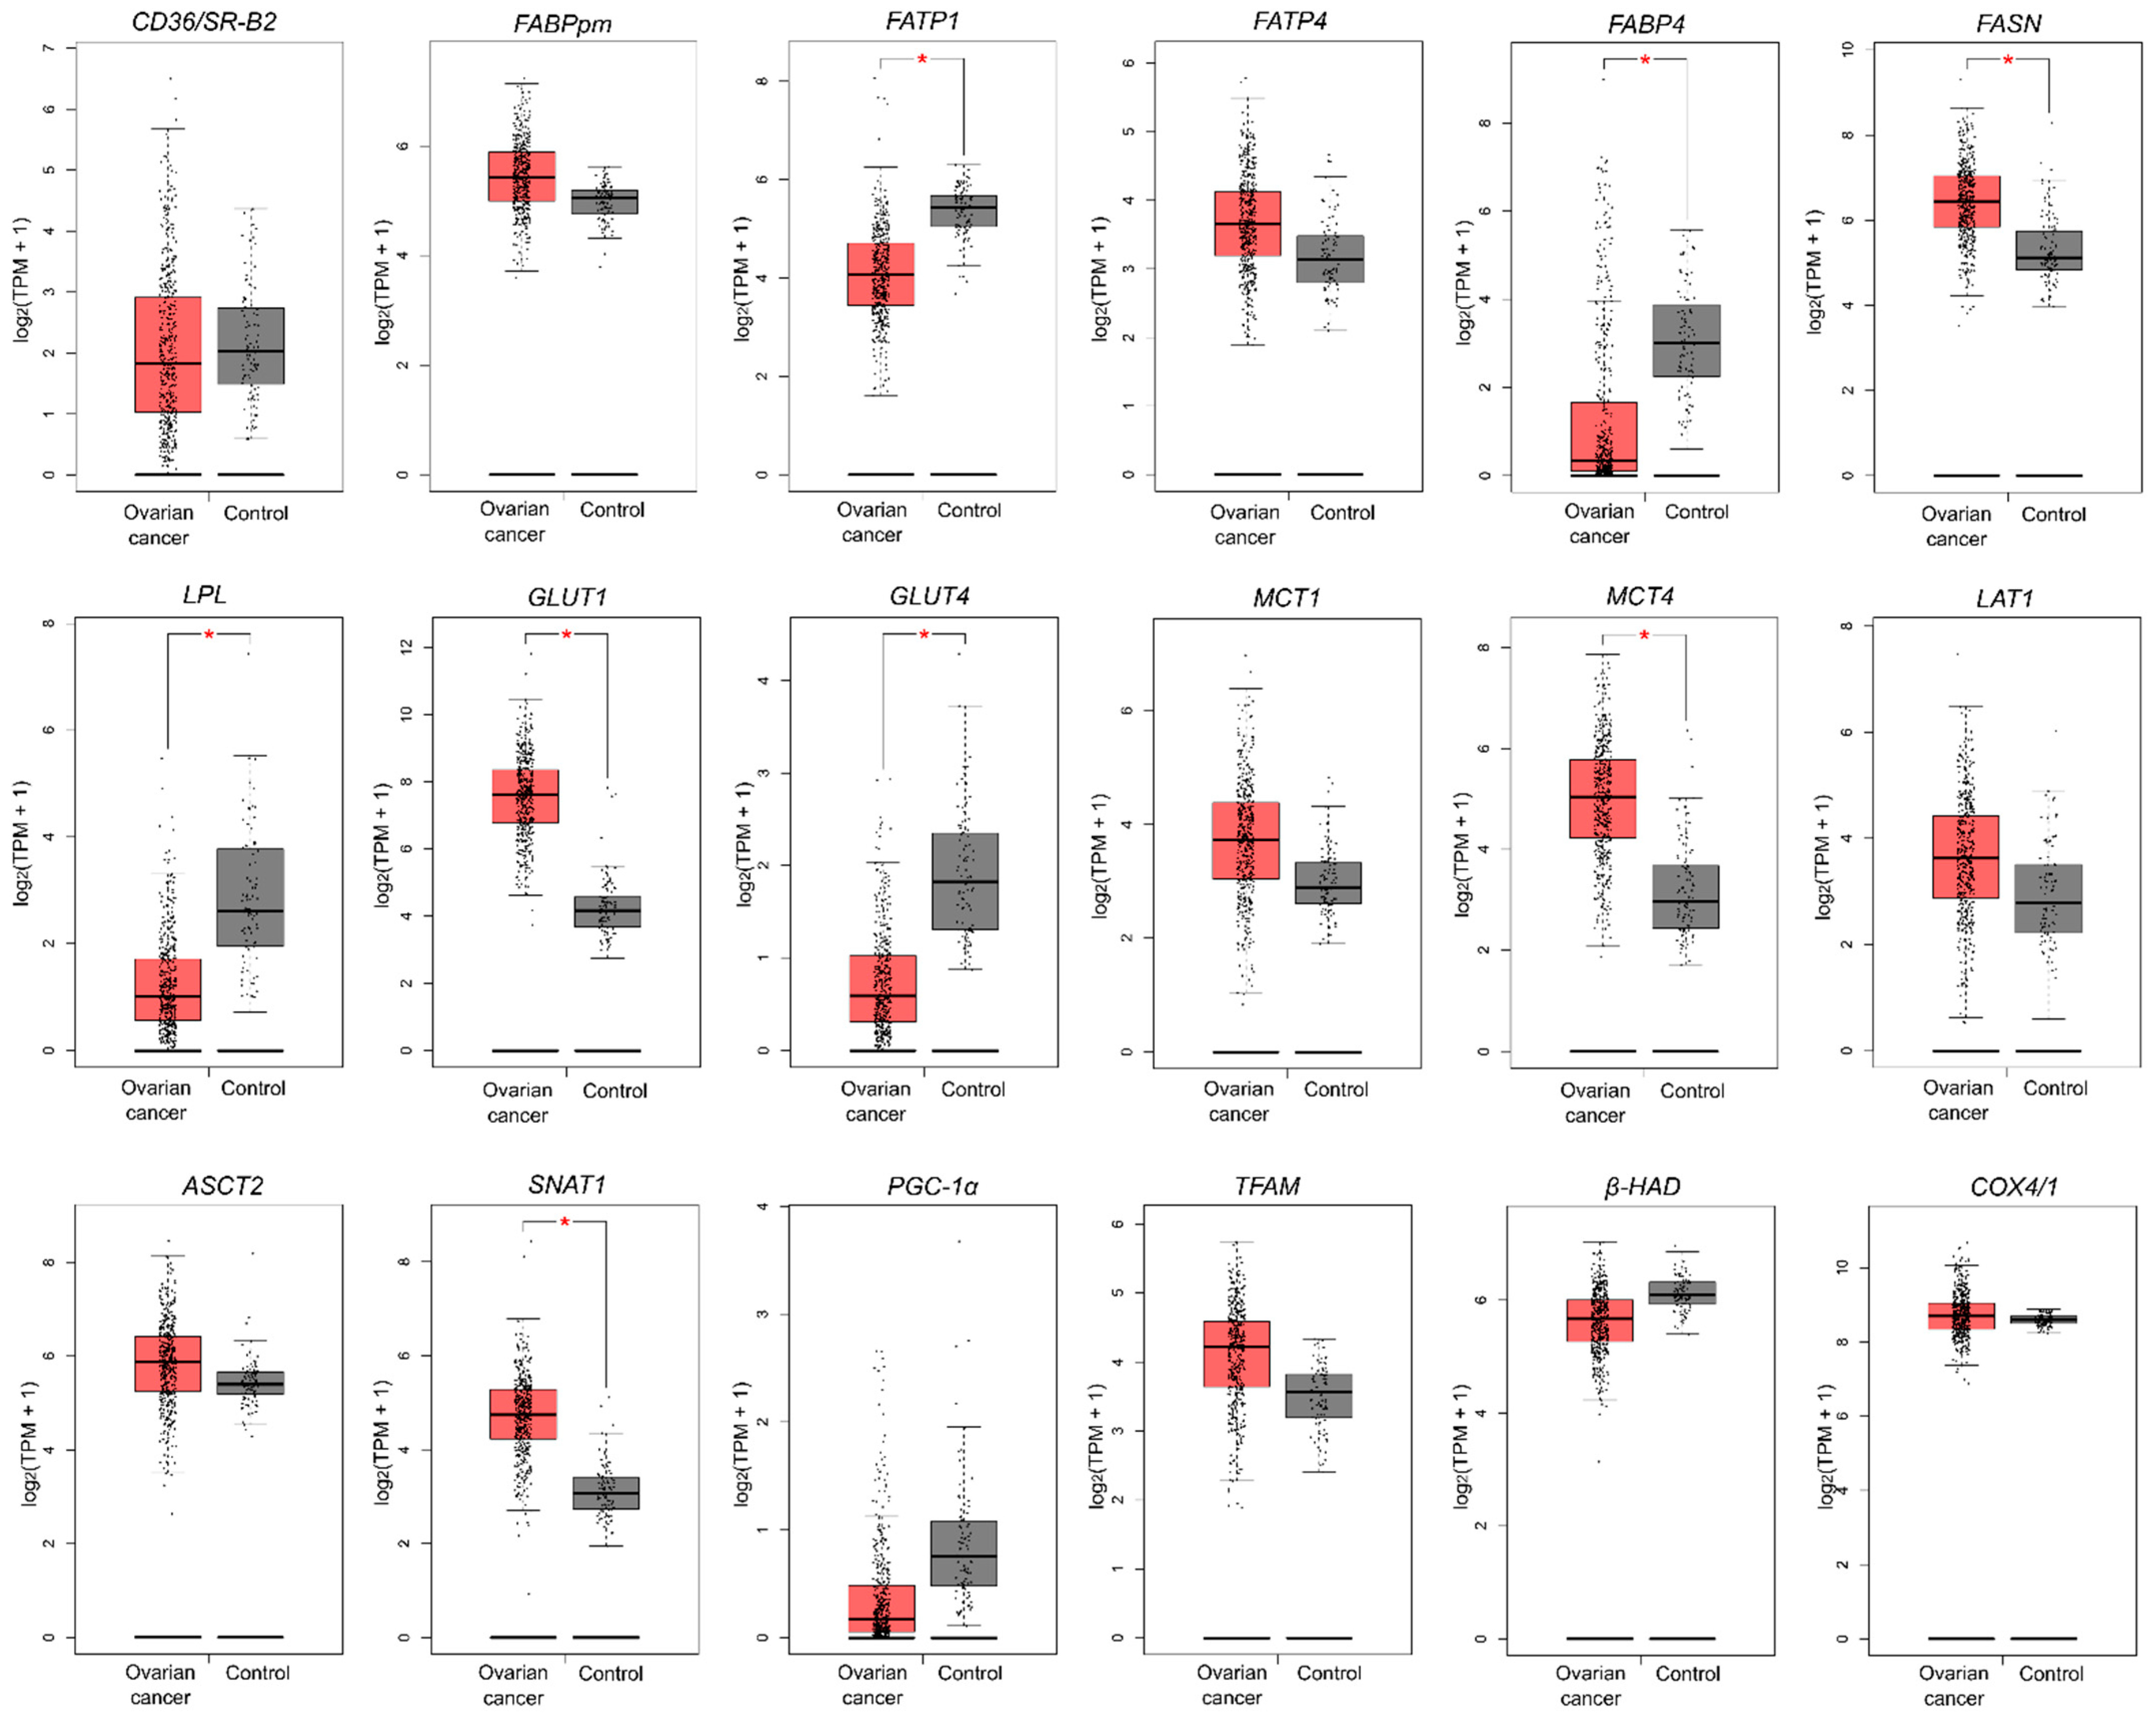
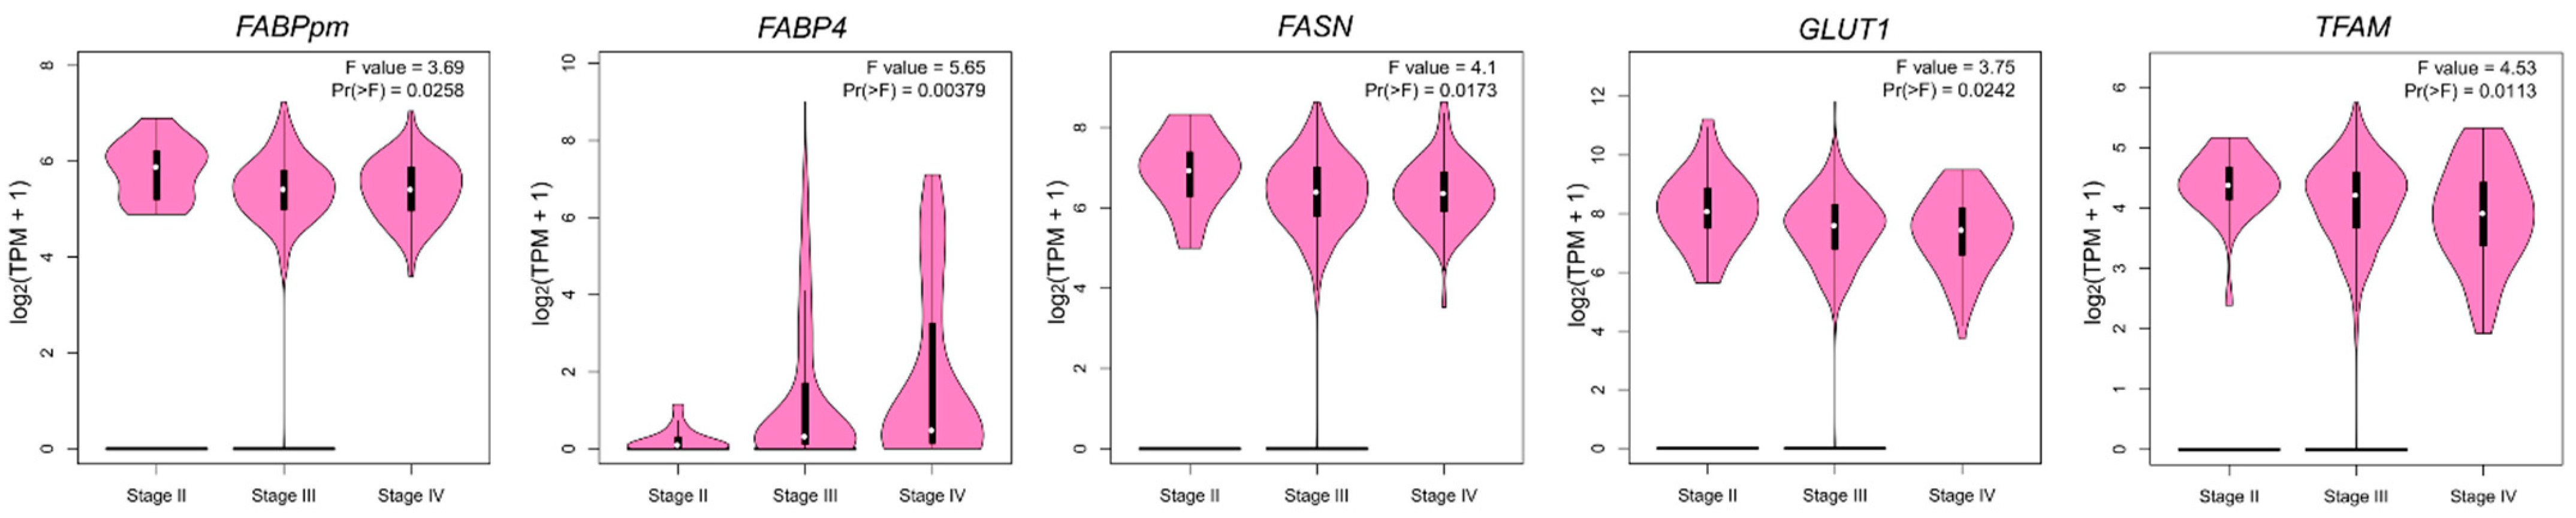
2.6. Genetic Alterations in Metabolism-Related Genes Based on TCGA and GTEx Datasets
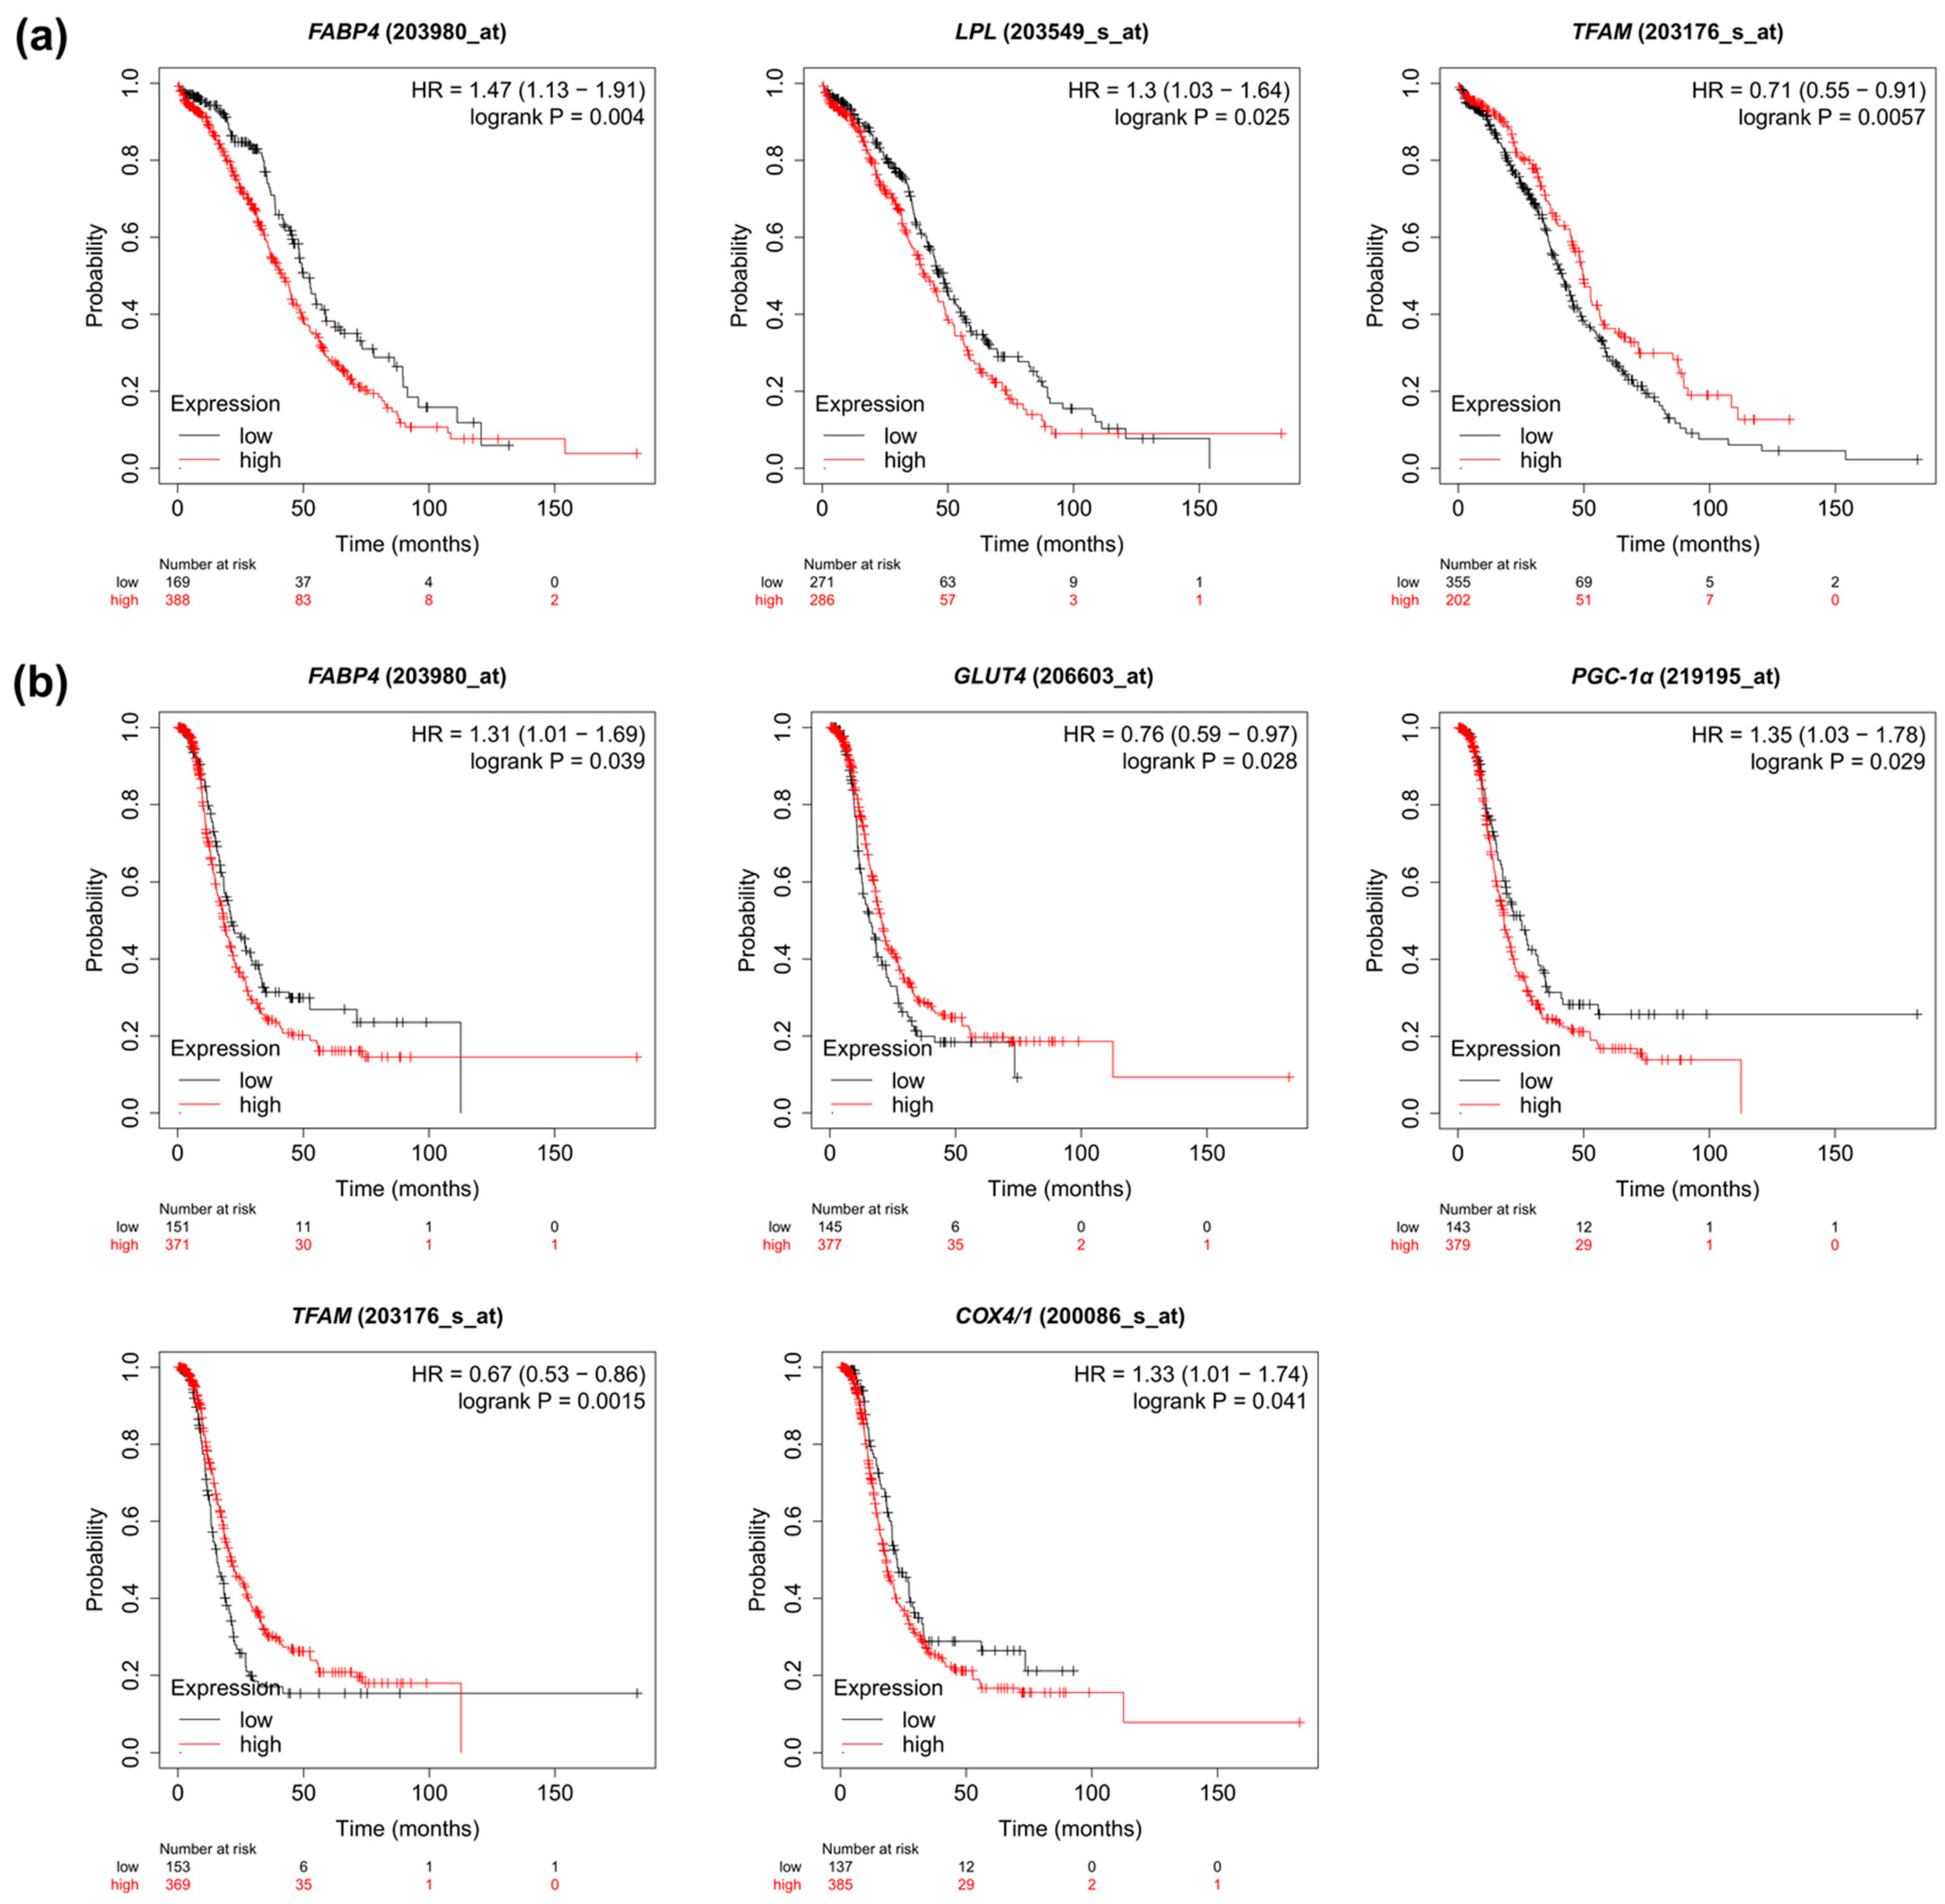
2.7. Prognostic Value of the Metabolic Pathway Genes Based on TCGA Cohort
3. Discussion
3.1. Glucose Transporters
3.2. Monocarboxylate Transporters
3.3. Fatty Acid Transporters
3.4. Amino Acid Transporters
3.5. Mitochondrial Genes
4. Materials and Methods
4.1. Study and Control Group
4.2. Real-Time PCR Analysis
4.3. Public Data Mining
4.4. Statistical Analysis
5. Conclusions
Supplementary Materials
Author Contributions
Funding
Institutional Review Board Statement
Informed Consent Statement
Data Availability Statement
Acknowledgments
Conflicts of Interest
Appendix A

| Gene | FIGO I and II vs. FIGO III and IV 1 | N0 vs. N1+N2 (Lymph Node Metastasis) 2 | Lack of vs. ‘Omental-Cake’ | Nodal Invasion > Omental Invasion vs. Nodal Invasion < Omental Invasion 3 |
|---|---|---|---|---|
| CD36/SR-B2 | p = 0.5756 0.61 (0.125–5.529) vs. 0.296 (0.077–2.746) | p = 0.2773 0.717 (0.077–5.529) vs. 0.283 (0.135–1.427) | p = 0.5806 0.482 (0.125–5.529) vs. 0.29 (0.077–2.746) | p = 0.2371 0.268 (0.135–0.486) vs. 0.472 (0.17–2.746) |
| FABPpm | p = 0.5756 1.488 (1.021–4.368) vs. 1.266 (0.273–4.859) | p = 0.2562 1.49 (0.961–4.802) vs. 1.226 (0.273–4.859) | p = 0.3473 1.125 (0.273–4.859) vs. 1.422 (0.594–4.802) | p = 0.6636 1.294 (1.198–1.389) vs. 1.472 (0.594–4.029) |
| FATP1 | p = 0.9215 0.69 (0.345–1.828) vs. 0.642 (0.272–3.788) | p = 0.4559 0.849 (0.307–3.788) vs. 0.637 (0.272–3.403) | p = 0.4856 0.6 (0.307–3.788) vs. 0.868 (0.272–3.403) | p = 0.5608 0.436 (0.436–0.436) vs. 0.9442 (0.2719–3.403) |
| FATP4 | p = 0.9737 1.193 (0.314–3.066) vs. 0.867 (0.234–2.811) | p = 0.5480 0.98 (0.314–3.066) vs. 0.867 (0.234–2.445) | p = 0.2773 0.831 (0.234–3.066) vs. 1.053 (0.429–2.811) | p = 0.1607 0.665 (0.234–0.899) vs. 1.259 (0.513–2.811) |
| FABP4 | p ≥ 0.9999 0.881 (0.046–2.094) vs. 0.2 (0.013–26.74) | p = 0.2773 0.79 (0.046–26.74) vs. 0.161 (0.013–22.11) | p = 0.2773 0.199 (0.013–10.11) vs. 0.474 (0.015–26.74) | p = 0.3083 0.0472 (0.0429–1.354) vs. 1.416 (0.114–26.74) |
| GLUT1 | p = 0.5314 1.112 (0.157–2.911) vs. 0.76 (0.076–4.324) | p = 0.1138 1.109 (0.157–2.911) vs. 0.519 (0.076–4.324) | p = 0.4856 1.044 (0.076–4.324) vs. 0.626 (0.125–2.495) | p = 0.698 0.155 (0.076–1.17) vs. 0.3119 (0.125–2.397) |
| GLUT4 | p = 0.2719 0.209 (0.155–2.327) vs. 0.141 (0.013–1.957) | p = 0.1385 0.334 (0.028–2.327) vs. 0.06 (0.013–1.957) | p = 0.8291 0.155 (0.013–2.327) vs. 0.155 (0.013–1.957) | p = 0.344 0.034 (0.017–0.126) vs. 0.169 (0.037–1.957) |
| MCT1 | p = 0.5314 1.895 (0.295–2.387) vs. 1.025 (0.315–6.052) | p = 0.2562 1.569 (0.295–6.052) vs. 0.952 (0.315–3.801) | p = 0.4271 1.256 (0.295–6.052) vs. 0.93 (0.375–3.801) | p = 0.7989 1.115 (0.921–1.256) vs. 0.835 (0.375–3.801) |
| MCT4 | p = 0.9183 0.812 (0.317–8.742) vs. 0.777 (0.259–2.225) | p = 0.5267 0.869 (0.259–8.742) vs. 0.605 (0.316–2.225) | p = 0.0869 0.995 (0.316–8.742) vs. 0.516 (0.259–1.538) | p = 0.0419 1.497 (0.357–1.609) vs. 0.481 (0.259–0.688) |
| LAT1 | p = 0.8693 0.549 (0.05–3.221) vs. 0.466 (0.139–8.853) | p = 0.7551 0.416 (0.051–3.221) vs. 0.47 (0.179–8.853) | p = 0.5164 0.47 (0.051–8.853) vs. 0.416 (0.139–1.300) | p = 0.1864 0.47 (0.179–8.853) vs. 0.474 (0.191–1.289) |
| ASCT2 | p = 0.3715 0.86 (0.456–1.663) vs. 0.566 (0.066–2.349) | p = 0.4559 0.777 (0.249–2.349) vs. 0.546 (0.066–1.278) | p = 0.6833 0.566 (0.066–2.349) vs. 0.737 (0.22–1.278) | p = 0.5431 0.522 (0.254–1.135) vs. 0.841 (0.296–1.153) |
| SNAT1 | p = 0.1910 1.951 (1.582–3.27) vs. 1.363 (0.516–3.996) | p = 0.1385 1.94 (0.516–3.27) vs. 1.099 (0.645–3.996) | p = 0.3473 1.589 (0.822–3.398) vs. 1.300 (0.516–3.996) | p = 0.4262 0.994 (0.847–1.021) vs. 1.034 (0.516–3.996) |
| PGC-1α | p = 0.6217 0.49 (0.153–1.252) vs. 0.196 (0.024–6.298) | p = 0.7919 0.373 (0.024–6.298) vs. 0.181 (0.05–6.156) | p = 0.4559 0.177 (0.024–6.156) vs. 0.363 (0.098–6.298) | p = 0.0359 0.024 (0.05–0.077) vs. 1.002 (0.098–6.298) |
| TFAM | p = 0.2158 2.513 (1.643–2.950) vs. 1.516 (0.464–5.620) | p = 0.6833 1.838 (0.647–3.301) vs. 1.514 (0.464–5.62) | p = 0.8667 1.643 (0.513–4.308) vs. 1.838 (0.464–5.62) | p = 0.9088 1.514 (1.007–4.308) vs. 1.831 (0.464–5.62) |
| β-HAD | p = 0.8693 0.662 (0.374–2.543) vs. 0.685 (0.259–2.649) | p = 0.3420 0.94 (0.298–2.543) vs. 0.62 (0.259–2.649) | p = 0.9046 0.725 (0.259–2.649) vs. 0.62 (0.365–1.685) | p = 0.1967 0.349 (0.259–0.865) vs. 0.873 (0.372–1.685) |
| COX4/1 | p = 0.1243 2.088 (1.021–4.29) vs. 0.894 (0.287–6.43) | p = 0.2827 1.415 (0.401–4.47) vs. 0.894 (0.287–6.43) | p = 0.7826 1.021 (0.287–4.29) vs. 0.873 (0.305–6.43) | p = 0.7839 0.952 (0.8–2.14) vs. 0.736 (0.305–6.43) |
| FASN | p = 0.4085 0.576 (0.375–1.636) vs. 0.895 (0.341–7.296) | p = 0.6483 0.904 (0.374–2.334) vs. 0.654 (0.341–7.296) | p = 0.7919 0.822 (0.341–3.03) vs. 0.858 (0.374–7.296) | p = 0.2619 0.506 (0.341–0.602) vs. 0.668 (0.414–7.296) |
| LPl | p = 0.6688 0.541 (0.39–0.763) vs. 0.46 (0.072–4.689) | p = 0.0044 0.668 (0.348–4.689) vs. 0.276 (0.072–1.399) | p = 0.3229 0.39 (0.072–4.689) vs. 0.578 (0.12–3.437) | p = 0.1833 0.182 (0.072–1.06) vs. 0.748 (0.275–3.437) |
References
- Huang, J.; Chan, W.C.; Ngai, C.H.; Lok, V.; Zhang, L.; Lucero-Prisno, D.E.; Xu, W.; Zheng, Z.J.; Elcarte, E.; Withers, M.; et al. Worldwide Burden, Risk Factors, and Temporal Trends of Ovarian Cancer: A Global Study. Cancers 2022, 14, 2230. [Google Scholar] [CrossRef] [PubMed]
- Sung, H.; Ferlay, J.; Siegel, R.L.; Laversanne, M.; Soerjomataram, I.; Jemal, A.; Bray, F. Global Cancer Statistics 2020: GLOBOCAN Estimates of Incidence and Mortality Worldwide for 36 Cancers in 185 Countries. CA Cancer J. Clin. 2021, 71, 209–249. [Google Scholar] [CrossRef] [PubMed]
- Lheureux, S.; Braunstein, M.; Oza, A.M. Epithelial ovarian cancer: Evolution of management in the era of precision medicine. CA Cancer J. Clin. 2019, 69, 280–304. [Google Scholar] [CrossRef] [PubMed]
- Matulonis, U.A.; Sood, A.K.; Fallowfield, L.; Howitt, B.E.; Sehouli, J.; Karlan, B.Y. Ovarian cancer. Nat. Rev. Dis. Prim. 2016, 2, 16061. [Google Scholar] [CrossRef]
- Kurman, R.J.; Shih, I.M. The origin and pathogenesis of epithelial ovarian cancer: A proposed unifying theory. Am. J. Surg. Pathol. 2010, 34, 433–443. [Google Scholar] [CrossRef]
- Pereira, M.; Matuszewska, K.; Jamieson, C.; Petrik, J. Characterizing Endocrine Status, Tumor Hypoxia and Immunogenicity for Therapy Success in Epithelial Ovarian Cancer. Front. Endocrinol. 2021, 12, 772349. [Google Scholar] [CrossRef]
- Freimund, A.E.; Beach, J.A.; Christie, E.L.; Bowtell, D.D.L. Mechanisms of Drug Resistance in High-Grade Serous Ovarian Cancer. Hematol. Oncol. Clin. N. Am. 2018, 32, 983–996. [Google Scholar] [CrossRef]
- Cho, H.; Lee, Y.S.; Kim, J.; Chung, J.Y.; Kim, J.H. Overexpression of glucose transporter-1 (GLUT-1) predicts poor prognosis in epithelial ovarian cancer. Cancer Investig. 2013, 31, 607–615. [Google Scholar] [CrossRef]
- Cairns, R.A.; Harris, I.S.; Mak, T.W. Regulation of cancer cell metabolism. Nat. Rev. Cancer 2011, 11, 85–95. [Google Scholar] [CrossRef]
- Bose, S.; Le, A. Glucose Metabolism in Cancer. Adv. Exp. Med. Biol. 2018, 1063, 3–12. [Google Scholar]
- Yoon, H.; Lee, S. Fatty Acid Metabolism in Ovarian Cancer: Therapeutic Implications. Int. J. Mol. Sci. 2022, 23, 2170. [Google Scholar] [CrossRef] [PubMed]
- Corn, K.C.; Windham, M.A.; Rafat, M. Lipids in the tumor microenvironment: From cancer progression to treatment. Prog. Lipid Res. 2020, 80, 101055. [Google Scholar] [CrossRef] [PubMed]
- Buckley, D.; Duke, G.; Heuer, T.S.; O’Farrell, M.; Wagman, A.S.; McCulloch, W.; Kemble, G. Fatty acid synthase—Modern tumor cell biology insights into a classical oncology target. Pharmacol. Ther. 2017, 177, 23–31. [Google Scholar] [CrossRef]
- Deberardinis, R.J.; Cheng, T. Q’s next: The diverse functions of glutamine in metabolism, cell biology and cancer. Oncogene 2010, 29, 313–324. [Google Scholar] [CrossRef] [PubMed]
- Supruniuk, E.; Żebrowska, E.; Chabowski, A. Branched chain amino acids—Friend or foe in the control of energy substrate turnover and insulin sensitivity? Crit. Rev. Food Sci. Nutr. 2021, 1–39. [Google Scholar] [CrossRef] [PubMed]
- Yang, L.; Moss, T.; Mangala, L.S.; Marini, J.; Zhao, H.; Wahlig, S.; Armaiz-Pena, G.; Jiang, D.; Achreja, A.; Win, J.; et al. Metabolic shifts toward glutamine regulate tumor growth, invasion and bioenergetics in ovarian cancer. Mol. Syst. Biol. 2014, 10, 728. [Google Scholar] [CrossRef]
- Li, N.; Li, H.; Wang, Y.; Cao, L.; Zhan, X. Quantitative proteomics revealed energy metabolism pathway alterations in human epithelial ovarian carcinoma and their regulation by the antiparasite drug ivermectin: Data interpretation in the context of 3P medicine. EPMA J. 2020, 11, 661–694. [Google Scholar] [CrossRef]
- Bell, D.; Berchuck, A.; Birrer, M.; Chien, J.; Cramer, D.W.; Dao, F.; Dhir, R.; Disaia, P.; Gabra, H.; Glenn, P.; et al. Integrated genomic analyses of ovarian carcinoma. Nature 2011, 474, 609–615. [Google Scholar] [CrossRef]
- Miethe, C.; Torres, L.; Beristain, J.; Zamora, M.; Price, R.S. The role of visfatin and resistin in an in vitro model of obesityinduced invasive liver cancer. Can. J. Physiol. Pharmacol. 2021, 99, 839–846. [Google Scholar] [CrossRef]
- Li, Z.; Liu, H.; He, J.; Wang, Z.; Yin, Z.; You, G.; Wang, Z.; Davis, R.E.; Lin, P.; Bergsagel, P.L.; et al. Acetyl-CoA Synthetase 2: A Critical Linkage in Obesity-Induced Tumorigenesis in Myeloma. Cell Metab. 2021, 33, 78–93.e7. [Google Scholar] [CrossRef]
- Beyaz, S.; Mana, M.D.; Roper, J.; Kedrin, D.; Saadatpour, A.; Hong, S.J.; Bauer-Rowe, K.E.; Xifaras, M.E.; Akkad, A.; Arias, E.; et al. High-fat diet enhances stemness and tumorigenicity of intestinal progenitors. Nature 2016, 531, 53–58. [Google Scholar] [CrossRef] [PubMed]
- Park, J.; Morley, T.S.; Kim, M.; Clegg, D.J.; Scherer, P.E. Obesity and cancer—Mechanisms underlying tumour progression and recurrence. Nat. Rev. Endocrinol. 2014, 10, 455–465. [Google Scholar] [CrossRef] [PubMed]
- Tworoger, S.S.; Huang, T. Obesity and ovarian cancer. In Recent Results in Cancer Research; Springer: Berlin/Heidelberg, Germany, 2016; Volume 208, pp. 155–176. [Google Scholar]
- Liu, Z.; Zhang, T.T.; Zhao, J.J.; Qi, S.F.; Du, P.; Liu, D.W.; Tian, Q.B. The association between overweight, obesity and ovarian cancer: A meta-analysis. Jpn. J. Clin. Oncol. 2015, 45, 1107–1115. [Google Scholar] [CrossRef] [PubMed]
- Foong, K.W.; Bolton, H. Obesity and ovarian cancer risk: A systematic review. Post Reprod. Health 2017, 23, 183–198. [Google Scholar] [CrossRef]
- Mukherjee, A.; Chiang, C.Y.; Daifotis, H.A.; Nieman, K.M.; Fahrmann, J.F.; Lastra, R.R.; Romero, I.L.; Fiehn, O.; Lengyel, E. Adipocyte-induced FABP4 expression in ovarian cancer cells promotes metastasis and mediates carboplatin resistance. Cancer Res. 2020, 80, 1748–1761. [Google Scholar] [CrossRef]
- Rudlowski, C.; Moser, M.; Becker, A.J.; Rath, W.; Buttner, R.; Schroder, W.; Schurmann, A. GLUT1 mRNA and protein expression in ovarian borderline tumors and cancer. Oncology 2004, 66, 404–410. [Google Scholar] [CrossRef]
- Pizzuti, L.; Sergi, D.; Mandoj, C.; Antoniani, B.; Sperati, F.; Chirico, A.; Di Lauro, L.; Valle, M.; Garofalo, A.; Vizza, E.; et al. GLUT 1 receptor expression and circulating levels of fasting glucose in high grade serous ovarian cancer. J. Cell. Physiol. 2018, 233, 1396–1401. [Google Scholar] [CrossRef]
- Cantuaria, G.; Magalhaes, A.; Penalver, M.; Angioli, R.; Braunschweiger, P.; Gomez-Marin, O.; Kanhoush, R.; Gomez-Fernandez, C.; Nadji, M. Expression of GLUT-1 glucose transporter in borderline and malignant epithelial tumors of the ovary. Gynecol. Oncol. 2000, 79, 33–37. [Google Scholar] [CrossRef]
- Vaupel, P.; Multhoff, G. Revisiting the Warburg effect: Historical dogma versus current understanding. J. Physiol. 2021, 599, 1745–1757. [Google Scholar] [CrossRef]
- Lunt, S.Y.; Vander Heiden, M.G. Aerobic glycolysis: Meeting the metabolic requirements of cell proliferation. Annu. Rev. Cell Dev. Biol. 2011, 27, 441–464. [Google Scholar] [CrossRef]
- Barron, C.C.; Bilan, P.J.; Tsakiridis, T.; Tsiani, E. Facilitative glucose transporters: Implications for cancer detection, prognosis and treatment. Metabolism 2016, 65, 124–139. [Google Scholar] [CrossRef] [PubMed]
- Kalir, T.; Wang, B.Y.; Goldfischer, M.; Haber, R.S.; Reder, I.; Demopoulos, R.; Cohen, C.J.; Burstein, D.E. Immunohistochemical staining of GLUT1 in benign, borderline, and malignant ovarian epithelia. Cancer 2002, 94, 1078–1082. [Google Scholar] [CrossRef] [PubMed]
- Ebert, B.L.; Firth, J.D.; Ratcliffe, P.J. Hypoxia and mitochondrial inhibitors regulate expression of glucose transporter-1 via distinct cis-acting sequences. J. Biol. Chem. 1995, 270, 29083–29089. [Google Scholar] [CrossRef] [PubMed]
- Watson, R.T.; Pessin, J.E. Intracellular organization of insulin signaling and GLUT4 translocation. Recent Prog. Horm. Res. 2001, 56, 175–193. [Google Scholar] [CrossRef] [PubMed]
- Ma, Y.; Wang, W.; Idowu, M.O.; Oh, U.; Wang, X.Y.; Temkin, S.M.; Fang, X. Ovarian cancer relies on glucose transporter 1 to fuel glycolysis and growth: Anti-tumor activity of BAY-876. Cancers 2019, 11, 33. [Google Scholar] [CrossRef] [PubMed]
- Shin, S.J.; Kim, J.Y.; Kwon, S.Y.; Mun, K.-C.; Cho, C.H.; Ha, E. Ciglitazone Enhances Ovarian Cancer Cell Death via Inhibition of Glucose Transporter-1. Eur. J. Pharmacol. 2014, 743, 17–23. [Google Scholar] [CrossRef]
- Xintaropoulou, C.; Ward, C.; Wise, A.; Queckborner, S.; Turnbull, A.; Michie, C.O.; Williams, A.R.W.; Rye, T.; Gourley, C.; Langdon, S.P. Expression of Glycolytic Enzymes in Ovarian Cancers and Evaluation of the Glycolytic Pathway as a Strategy for Ovarian Cancer Treatment. BMC Cancer 2018, 18, 636. [Google Scholar] [CrossRef]
- Chen, L.; Cheng, X.; Tu, W.; Qi, Z.; Li, H.; Liu, F.; Yang, Y.; Zhang, Z.; Wang, Z. Apatinib Inhibits Glycolysis by Suppressing the VEGFR2/AKT1/SOX5/GLUT4 Signaling Pathway in Ovarian Cancer Cells. Cell. Oncol. 2019, 42, 679–690. [Google Scholar] [CrossRef]
- Liu, Y.; Sun, X.; Huo, C.; Sun, C.; Zhu, J. Monocarboxylate Transporter 4 (MCT4) Overexpression Is Correlated with Poor Prognosis of Osteosarcoma. Med. Sci. Monit. 2019, 25, 4278–4284. [Google Scholar] [CrossRef]
- Reuss, A.M.; Groos, D.; Ghoochani, A.; Buchfelder, M.; Savaskan, N. MCT4 Promotes Tumor Malignancy in F98 Glioma Cells. J. Oncol. 2021, 2021, 6655529. [Google Scholar] [CrossRef]
- Zhao, Y.; Zhao, B.; Yan, W.H.; Xia, Y.; Wang, Z.H.; Zheng, G.Y.; Wang, W.D.; Zhang, Y.S. Integrative Analysis Identified MCT4 as an Independent Prognostic Factor for Bladder Cancer. Front. Oncol. 2021, 11, 704857. [Google Scholar] [CrossRef] [PubMed]
- Contreras-Baeza, Y.; Sandoval, P.Y.; Alarcón, R.; Galaz, A.; Cortés-Molina, F.; Alegriá, K.; Baeza-Lehnert, F.; Arce-Molina, R.; Guequén, A.; Flores, C.A.; et al. Monocarboxylate transporter 4 (MCT4) is a high affinity transporter capable of exporting lactate in high-lactate microenvironments. J. Biol. Chem. 2019, 294, 20135–20147. [Google Scholar] [CrossRef]
- San-Millán, I.; Brooks, G.A. Reexamining cancer metabolism: Lactate production for carcinogenesis could be the purpose and explanation of the Warburg Effect. Carcinogenesis 2017, 38, 119–133. [Google Scholar] [CrossRef] [PubMed]
- Ullah, M.S.; Davies, A.J.; Halestrap, A.P. The plasma membrane lactate transporter MCT4, but not MCT1, is up-regulated by hypoxia through a HIF-1α-dependent mechanism. J. Biol. Chem. 2006, 281, 9030–9037. [Google Scholar] [CrossRef] [PubMed]
- Semenza, G.L. HIF-1: Upstream and downstream of cancer metabolism. Curr. Opin. Genet. Dev. 2010, 20, 51–56. [Google Scholar] [CrossRef] [PubMed]
- Bovenzi, C.D.; Hamilton, J.; Tassone, P.; Johnson, J.; Cognetti, D.M.; Luginbuhl, A.; Keane, W.M.; Zhan, T.; Tuluc, M.; Bar-Ad, V.; et al. Prognostic Indications of Elevated MCT4 and CD147 across Cancer Types: A Meta-Analysis. BioMed Res. Int. 2015, 2015, 242437. [Google Scholar] [CrossRef]
- Yang, H.; Zou, W.; Chen, B. Overexpression of CD147 in ovarian cancer is initiated by the hypoxic microenvironment. Cell Biol. Int. 2013, 37, 1139–1142. [Google Scholar] [CrossRef]
- Chen, H.; Wang, L.; Beretov, J.; Hao, J.; Xiao, W.; Li, Y. Co-expression of CD147/EMMPRIN with monocarboxylate transporters and multiple drug resistance proteins is associated with epithelial ovarian cancer progression. Clin. Exp. Metastasis 2010, 27, 557–569. [Google Scholar] [CrossRef]
- Piga, I.; Verza, M.; Montenegro, F.; Nardo, G.; Zulato, E.; Zanin, T.; Del Bianco, P.; Esposito, G.; Indraccolo, S. In situ Metabolic Profiling of Ovarian Cancer Tumor Xenografts: A Digital Pathology Approach. Front. Oncol. 2020, 10, 1277. [Google Scholar] [CrossRef]
- Whitaker-Menezes, D.; Martinez-Outschoorn, U.E.; Lin, Z.; Ertel, A.; Flomenberg, N.; Witkiewicz, A.K.; Birbe, R.C.; Howell, A.; Pavlides, S.; Gandara, R.; et al. Evidence for a stromal-epithelial “lactate shuttle” in human tumors: MCT4 is a marker of oxidative stress in cancer-associated fibroblasts. Cell Cycle 2011, 10, 1772–1783. [Google Scholar] [CrossRef]
- Kim, S.; Jung, W.H.; Koo, J.S. The expression of Glut-1, CAIX, and MCT4 in Mucinous carcinoma. J. Breast Cancer 2013, 16, 146–151. [Google Scholar] [CrossRef] [PubMed]
- Mogi, A.; Koga, K.; Aoki, M.; Hamasaki, M.; Uesugi, N.; Iwasaki, A.; Shirakusa, T.; Tamura, K.; Nabeshima, K. Expression and role of GLUT-1, MCT-1, and MCT-4 in malignant pleural mesothelioma. Virchows Arch. 2013, 462, 83–93. [Google Scholar] [CrossRef] [PubMed]
- Gatenby, R.A.; Gillies, R.J. Why do cancers have high aerobic glycolysis? Nat. Rev. Cancer 2004, 4, 891–899. [Google Scholar] [CrossRef] [PubMed]
- Benjamin, D.; Robay, D.; Hindupur, S.K.; Pohlmann, J.; Colombi, M.; El-Shemerly, M.Y.; Maira, S.M.; Moroni, C.; Lane, H.A.; Hall, M.N. Dual Inhibition of the Lactate Transporters MCT1 and MCT4 Is Synthetic Lethal with Metformin due to NAD+ Depletion in Cancer Cells. Cell Rep. 2018, 25, 3047–3058.e4. [Google Scholar] [CrossRef]
- Massari, F.; Ciccarese, C.; Santoni, M.; Iacovelli, R.; Mazzucchelli, R.; Piva, F.; Scarpelli, M.; Berardi, R.; Tortora, G.; Lopez-Beltran, A.; et al. Metabolic phenotype of bladder cancer. Cancer Treat. Rev. 2016, 45, 46–57. [Google Scholar] [CrossRef]
- Zhao, G.; Cardenas, H.; Matei, D. Ovarian cancer—why lipids matter. Cancers 2019, 11, 1870. [Google Scholar] [CrossRef]
- Zeng, J.; Sauter, E.R.; Li, B. FABP4: A New Player in Obesity-Associated Breast Cancer. Trends Mol. Med. 2020, 26, 437–440. [Google Scholar] [CrossRef]
- Tian, W.; Zhang, W.; Zhang, Y.; Zhu, T.; Hua, Y.; Li, H.; Zhang, Q.; Xia, M. FABP4 promotes invasion and metastasis of colon cancer by regulating fatty acid transport. Cancer Cell Int. 2020, 20, 512. [Google Scholar] [CrossRef]
- Li, G.; Wu, Q.; Gong, L.; Xu, X.; Cai, J.; Xu, L.; Zeng, Y.; He, X.; Wang, Z. FABP4 is an independent risk factor for lymph node metastasis and poor prognosis in patients with cervical cancer. Cancer Cell Int. 2021, 21, 568. [Google Scholar] [CrossRef]
- Gharpure, K.M.; Pradeep, S.; Sans, M.; Rupaimoole, R.; Ivan, C.; Wu, S.Y.; Bayraktar, E.; Nagaraja, A.S.; Mangala, L.S.; Zhang, X.; et al. FABP4 as a key determinant of metastatic potential of ovarian cancer. Nat. Commun. 2018, 9, 2923. [Google Scholar] [CrossRef]
- Nieman, K.M.; Kenny, H.A.; Penicka, C.V.; Ladanyi, A.; Buell-Gutbrod, R.; Zillhardt, M.R.; Romero, I.L.; Carey, M.S.; Mills, G.B.; Hotamisligil, G.S.; et al. Adipocytes promote ovarian cancer metastasis and provide energy for rapid tumor growth. Nat. Med. 2011, 17, 1498–1503. [Google Scholar] [CrossRef] [PubMed]
- Wang, J.; Li, Y. CD36 tango in cancer: Signaling pathways and functions. Theranostics 2019, 9, 4893–4908. [Google Scholar] [CrossRef] [PubMed]
- Pascual, G.; Avgustinova, A.; Mejetta, S.; Martín, M.; Castellanos, A.; Attolini, C.S.O.; Berenguer, A.; Prats, N.; Toll, A.; Hueto, J.A.; et al. Targeting metastasis-initiating cells through the fatty acid receptor CD36. Nature 2017, 541, 41–45. [Google Scholar] [CrossRef] [PubMed]
- Ladanyi, A.; Mukherjee, A.; Kenny, H.A.; Johnson, A.; Mitra, A.K.; Sundaresan, S.; Nieman, K.M.; Pascual, G.; Benitah, S.A.; Montag, A.; et al. Adipocyte-induced CD36 expression drives ovarian cancer progression and metastasis. Oncogene 2018, 37, 2285–2301. [Google Scholar] [CrossRef] [PubMed]
- Dias, F.; Almeida, C.; Teixeira, A.L.; Morais, M.; Medeiros, R. Lat1 and asct2 related micrornas as potential new therapeutic agents against colorectal cancer progression. Biomedicines 2021, 9, 195. [Google Scholar] [CrossRef]
- Fan, X.; Ross, D.D.; Arakawa, H.; Ganapathy, V.; Tamai, I.; Nakanishi, T. Impact of system L amino acid transporter 1 (LAT1) on proliferation of human ovarian cancer cells: A possible target for combination therapy with anti-proliferative aminopeptidase inhibitors. Biochem. Pharmacol. 2010, 80, 811–818. [Google Scholar] [CrossRef]
- Sato, K.; Miyamoto, M.; Takano, M.; Furuya, K.; Tsuda, H. Significant relationship between the LAT1 expression pattern and chemoresistance in ovarian clear cell carcinoma. Virchows Arch. 2019, 474, 701–710. [Google Scholar] [CrossRef]
- Kaira, K.; Nakamura, K.; Hirakawa, T.; Imai, H.; Tominaga, H.; Oriuchi, N.; Nagamori, S.; Kanai, Y.; Tsukamoto, N.; Oyama, T.; et al. Prognostic significance of l-type amino acid transporter 1 (Lat1) expression in patients with ovarian tumors. Am. J. Transl. Res. 2015, 7, 1161–1171. [Google Scholar]
- Watanabe, J.; Yokoyama, Y.; Futagami, M.; Mizunuma, H.; Yoshioka, H.; Washiya, K.; Hana, K.; Endou, H.; Okayasu, I. L-type amino acid transporter 1 expression increases in well-differentiated but decreases in poorly differentiated endometrial endometrioid adenocarcinoma and shows an inverse correlation with p53 expression. Int. J. Gynecol. Cancer 2014, 24, 659–663. [Google Scholar] [CrossRef]
- Choi, Y.K.; Park, K.G. Targeting glutamine metabolism for cancer treatment. Biomol. Ther. 2018, 26, 19–28. [Google Scholar] [CrossRef]
- Guo, H.; Xu, Y.; Wang, F.; Shen, Z.; Tuo, X.; Qian, H.; Wang, H.; Wang, K. Clinical associations between ASCT2 and p-mTOR in the pathogenesis and prognosis of epithelial ovarian cancer. Oncol. Rep. 2018, 40, 3725–3733. [Google Scholar] [CrossRef] [PubMed]
- Wang, M.; Liu, Y.; Fang, W.; Liu, K.; Jiao, X.; Wang, Z.; Wang, J.; Zang, Y.S. Increased SNAT1 is a marker of human osteosarcoma and potential therapeutic target. Oncotarget 2017, 8, 78930–78939. [Google Scholar] [CrossRef] [PubMed]
- Bröer, A.; Rahimi, F.; Bröer, S. Deletion of amino acid transporter ASCT2 (SLC1A5) Reveals an essential role for transporters SNAT1 (SLC38A1) and SNAT2 (SLC38A2) to sustain glutaminolysis in cancer cells. J. Biol. Chem. 2016, 291, 13194–13205. [Google Scholar] [CrossRef] [PubMed]
- Wang, K.; Cao, F.; Fang, W.; Hu, Y.; Chen, Y.; Ding, H.; Yu, G. Activation of SNAT1/SLC38A1 in human breast cancer: Correlation with p-Akt overexpression. BMC Cancer 2013, 13, 343. [Google Scholar] [CrossRef] [PubMed]
- Böhme-Schäfer, I.; Lörentz, S.; Bosserhoff, A.K. Role of Amino Acid Transporter SNAT1/SLC38A1 in Human Melanoma. Cancers 2022, 14, 2151. [Google Scholar] [CrossRef]
- Gwangwa, M.V.; Joubert, A.M.; Visagie, M.H. Effects of glutamine deprivation on oxidative stress and cell survival in breast cell lines. Biol. Res. 2019, 52, 15. [Google Scholar] [CrossRef]
- Signorile, A.; De Rasmo, D.; Cormio, A.; Musicco, C.; Rossi, R.; Fortarezza, F.; Palese, L.L.; Loizzi, V.; Resta, L.; Scillitani, G.; et al. Human ovarian cancer tissue exhibits increase of mitochondrial biogenesis and cristae remodeling. Cancers 2019, 11, 1350. [Google Scholar] [CrossRef]
- Li, Y.; Kang, J.; Fu, J.; Luo, H.; Liu, Y.; Li, Y.; Sun, L. Pgc1α promotes cisplatin resistance in ovarian cancer by regulating the hsp70/hk2/vdac1 signaling pathway. Int. J. Mol. Sci. 2021, 22, 2537. [Google Scholar] [CrossRef]
- Kim, B.; Jung, J.W.; Jung, J.; Han, Y.; Suh, D.H.; Kim, H.S.; Dhanasekaran, D.N.; Song, Y.S. PGC1α induced by reactive oxygen species contributes to chemoresistance of ovarian cancer cells. Oncotarget 2017, 8, 60299–60311. [Google Scholar] [CrossRef]
- Gabrielson, M.; Björklund, M.Y.; Carlson, J.; Shoshan, M. Expression of mitochondrial regulators PGC1a and TFAM as putative markers of subtype and chemoresistance in epithelial ovarian carcinoma. PLoS ONE 2014, 9, e107109. [Google Scholar] [CrossRef]
- Zhang, Y.; Ba, Y.; Liu, C.; Sun, G.; Ding, L.; Gao, S.; Hao, J.; Yu, Z.; Zhang, J.; Zen, K.; et al. PGC-1α induces apoptosis in human epithelial ovarian cancer cells through a PPARγ-dependent pathway. Cell Res. 2007, 17, 363–373. [Google Scholar] [CrossRef] [PubMed]
- Kleih, M.; Böpple, K.; Dong, M.; Gaißler, A.; Heine, S.; Olayioye, M.A.; Aulitzky, W.E.; Essmann, F. Direct impact of cisplatin on mitochondria induces ROS production that dictates cell fate of ovarian cancer cells. Cell Death Dis. 2019, 10, 851. [Google Scholar] [CrossRef] [PubMed]
- Pfaffl, M.W. A new mathematical model for relative quantification in real-time RT–PCR. Nucleic Acids Res. 2001, 29, E45. [Google Scholar] [CrossRef] [PubMed]
- Tang, Z.; Li, C.; Kang, B.; Gao, G.; Li, C.; Zhang, Z. GEPIA: A web server for cancer and normal gene expression profiling and interactive analyses. Nucleic Acids Res. 2017, 45, W98–W102. [Google Scholar] [CrossRef] [PubMed]
- Lánczky, A.; Győrffy, B. Web-based survival analysis tool tailored for medical research (KMplot): Development and implementation. J. Med. Internet Res. 2021, 23, e27633. [Google Scholar] [CrossRef]
- Izumi, H.; Torigoe, T.; Ishiguchi, H.; Uramoto, H.; Yoshida, Y.; Tanabe, M.; Ise, T.; Murakami, T.; Yoshida, T.; Nomoto, M.; et al. Cellular pH regulators: Potentially promising molecular targets for cancer chemotherapy. Cancer Treat. Rev. 2003, 29, 541–549. [Google Scholar] [CrossRef]


| Control | Ovarian Cancer | p | |
|---|---|---|---|
| Total Age mean | n = 14 55.72 (45.58–63.75) | n = 27 63.56 (57.31–70.86) | - 0.06 |
| BMI (kg/m2) Overweight/obese Ca125 (U/mL) PLT (x103 cells/mm3) Fibrinogen (mg/dl) Serum potassium (mEq/L) TSH (µU/mL) SBP (mmHg) DBP (mmHg) Primary tumor velocity 1 Time of hospitalization (day) | 26.67 (24.92–28.72) n = 9 16 (10.6–26.0) 219 (206–260) 317 (288–356) 4.06 (4.0–4.3) 1.33 (1.18–1.6) 131 (124–149) 87 (83–90) - 4.0 (3.0–5.0) | 27.89 (24.85–33.53) n = 19 503.00 (267.00–1478.00) 350.00 (266.0–452.0) 453.0 (373.0–522.0) 4.72 (4.39–5.10) 1.79 (1.32–2.43) 132 (130–145) 86 (73–92) 109.9 (64.11–276.32) 9.5 (7.0–14.0) | 0.32 - <0.00001 0.00023 0.0014 0.0016 0.23 0.40 0.65 - 0.000024 |
| n | |
|---|---|
| Total | 27 |
| FIGO I | 2 |
| FIGO II | 2 |
| FIGO III | 20 |
| FIGO IV | 3 |
| BRCA 1/2 mutation | 4 |
| p53 | 14/19 1 |
| Wilms tumor gene product (WT1) | 13/15 |
| p16 | 1/2 |
| Vimentin | 0/6 |
| Estrogen receptors (ERs) | 5/12 |
| Progesterone receptors (PRs) | 2/5 |
| Nodal invasion | 15/27 |
| Omentum ‘omental-cake’ 2 | 12/27 |
| Nodal invasion > omental invasion 3 | 3 |
| Nodal invasion < omental invasion 4 | 7 |
| Cancer cells in peritoneal fluid | 14 |
| Gene | Fold Change | p Value | ||
|---|---|---|---|---|
| Overweight | Obese | Overweight | Obese | |
| CD36/SR-B2 | 0.9172 | −0.1781 | 0.252 | >0.999 |
| FABPpm | 0.6058 | 1.0061 | 0.329 | 0.026 |
| FATP1 | 0.0376 | 0.552 | >0.999 | >0.999 |
| FATP4 | 0.3567 | 0.8573 | 0.974 | 0.219 |
| FABP4 | 2.1578 | 0.7444 | 0.51 | 0.288 |
| GLUT1 | −1.6832 | 0.3236 | 0.407 | >0.999 |
| GLUT4 | 0.737 | 2.214 | 0.779 | 0.094 |
| MCT1 | −0.7112 | −0.3096 | 0.908 | >0.999 |
| MCT4 | 0.4707 | −0.245 | >0.999 | 0.622 |
| LAT1 | 1.131 | 0.1321 | 0.856 | >0.999 |
| ASCT2 | −0.2871 | 0.6762 | 0.827 | 0.75 |
| SNAT1 | −0.073 | 0.7698 | >0.999 | 0.208 |
| PGC-1α | 1.1636 | 1.8047 | 0.089 | 0.016 |
| TFAM | 0.6391 | 1.0391 | 0.955 | 0.984 |
| β-HAD | −0.575 | 0.2069 | 0.861 | 0.994 |
| COX4/1 | 0.221 | 0.6918 | >0.999 | 0.532 |
| FASN | −0.2943 | 1.2679 | 0.948 | 0.045 |
| LPL | 0.5653 | 0.7144 | 0.888 | 0.201 |
| Target Gene | Forward Primer (5′-3′) | Reverse Primer (5′-3′) | Amplicon Length [bp] |
|---|---|---|---|
| CD36/SR-B2 | GGTACAGATGCAGCCTCATT | AGGCCTTGGATGGAGAACA | 157 |
| FATP1/SLC27A1 | GCTAAGGCCCTGATCTTTGG | CCAAGTCTCCAGAGCAGAAC | 316 |
| FATP4/SLC27A4 | TGGCGCTTCATCCGGGTCTT | CGAACGGTAGAGGCAAACAA | 140 |
| FABPpm | GAAGGCAAAGGTGCGACAGT | GCCGAACGGTAGAGGCAAA | 71 |
| FABP4 | GGGCCAGGAATTTGACGAAG | AACTCTCGTGGAAGTGACGC | 184 |
| GLUT1/SLC2A1 | CACCACCTCACTCCTGTTAC | CCACTTACTTCTGTCTCACTCC | 123 |
| GLUT4/SLC2A4 | GACCAACTAAGGCAAAGAG | CAATAGGATGCTTGTCTTCA | 183 |
| MCT1/SLC16A1 | CACCGTACAGCAACTATACG | CAATGGTCGCCTCTTGTAGA | 115 |
| MCT4/SLC16A3 | ATTGGCCTGGTGCTGCTGATG | CGAGTCTGCAGGAGGCTTGTG | 243 |
| LAT1/SLC7A5 | CACAGAAAGCCTGAGCTTGA | CACCTGCATGAGCTTCTGA | 249 |
| ASCT2/SLC1A5 | AGCTGCTTATCCGCTTCTTCAA | AGCAGGCAGCACAGAATGTA | 175 |
| SNAT1/SLC38A1 | GCTTTGGTTAAAGAGCGGG | CTGAGGGTCACGAATCGGA | 151 |
| PGC-1α | AGCCTCTTTGCCCAGATCTT | GGCAATCCGTCTTCATCCAC | 241 |
| TFAM | AGCTCAGAACCCAGATGC | CCACTCCGCCCTATAAGC | 115 |
| β-HAD | CTTGCTCCGAGAGGGAGTC | AGCTCGTAGCTGGGAGGAAC | 148 |
| COX 4/1 | GGTCACGCCGATCCATATAAG | TCTGTGTGTGTACGAGCTCATGA | 79 |
| FASN | CTTCCGAGATTCCATCCTACGC | TGGCAGTCAGGCTCACAAACG | 131 |
| LPL | GAGATTTCTCTGTATGGCACC | CTGCAAATGAGACACTTTCTC | 276 |
| β-actin | AGTCGGTTGGAGCGAGCATC | GGACTTCCTGTAACAACGCATCTC | 115 |
Publisher’s Note: MDPI stays neutral with regard to jurisdictional claims in published maps and institutional affiliations. |
© 2022 by the authors. Licensee MDPI, Basel, Switzerland. This article is an open access article distributed under the terms and conditions of the Creative Commons Attribution (CC BY) license (https://creativecommons.org/licenses/by/4.0/).
Share and Cite
Baczewska, M.; Supruniuk, E.; Bojczuk, K.; Guzik, P.; Milewska, P.; Konończuk, K.; Dobroch, J.; Chabowski, A.; Knapp, P. Energy Substrate Transporters in High-Grade Ovarian Cancer: Gene Expression and Clinical Implications. Int. J. Mol. Sci. 2022, 23, 8968. https://doi.org/10.3390/ijms23168968
Baczewska M, Supruniuk E, Bojczuk K, Guzik P, Milewska P, Konończuk K, Dobroch J, Chabowski A, Knapp P. Energy Substrate Transporters in High-Grade Ovarian Cancer: Gene Expression and Clinical Implications. International Journal of Molecular Sciences. 2022; 23(16):8968. https://doi.org/10.3390/ijms23168968
Chicago/Turabian StyleBaczewska, Marta, Elżbieta Supruniuk, Klaudia Bojczuk, Paweł Guzik, Patrycja Milewska, Katarzyna Konończuk, Jakub Dobroch, Adrian Chabowski, and Paweł Knapp. 2022. "Energy Substrate Transporters in High-Grade Ovarian Cancer: Gene Expression and Clinical Implications" International Journal of Molecular Sciences 23, no. 16: 8968. https://doi.org/10.3390/ijms23168968
APA StyleBaczewska, M., Supruniuk, E., Bojczuk, K., Guzik, P., Milewska, P., Konończuk, K., Dobroch, J., Chabowski, A., & Knapp, P. (2022). Energy Substrate Transporters in High-Grade Ovarian Cancer: Gene Expression and Clinical Implications. International Journal of Molecular Sciences, 23(16), 8968. https://doi.org/10.3390/ijms23168968