Appendix A
Let the parametric points be
New center points are calculated by using parametric factor. The new center points which is less dependent with irregular distribution of anchor node, can be calculated as:
where
represent parametric function of PLD network obtained from [
40] whose value is constant if anchor node has regular distribution. Due to symmetry, we can also write this for anchor node distribution
i.e., For regular distribution the centroid of points lies in centre i.e.,
In case of irregular distribution the value of
lies between 0.5 to 0.75. Hence,
To compute radio irregularity we take two different values of . One is 0.5 for assuming center value and 0.75 for anchor nodes. has direct effect on cosine angle that is between two anchor nodes from the center points in triangulation. Suppose the difference in angle is (0∼90)°, then the value of ranges from 0.516 to 0.765.
has a parametric factor
and
. So the next mid-point is
The change in parametric value shifts the assuming center to the exact center.
Appendix B
For perfect mathematical modelling we, assume that anchor nodes are regularly distributed, the sum of acute angle making with center is equal to 360°.
If , has value of 0.3090 and = 72°. And the value of .
If , has value of 0.5 and = 60°. And the value of .
If irregular anchor node distribution occurs, then we consider irregular distribution of angle between anchor nodes. The angle effect on parametric factor is significant only when it has significant difference between angles.
If angle varies by 10° at
then the value of
lies between
= (67∼77°) and the value of
= (0.5984∼0.5610). Hence localization error = 0.0374. Similarly, if angle varies by 10° at
then the value of
lies between
= (55∼65°) and the value of
= 0.6437∼0.6060. Hence localization error = 0.0377. This shows that anchor node irregularity produce some considerable error but we minimize it. The minimization occur because we calculate only midpoint of each iteration by using this parametric function. The difference of shifting is greatly minimized by:
with the localization error of 0.0377 in a parametric factor equation, we get;
.
From the numeric parametric analysis, it is clearly seen that less angle gives higher parametric value and higher angle gives lower parametric constant .
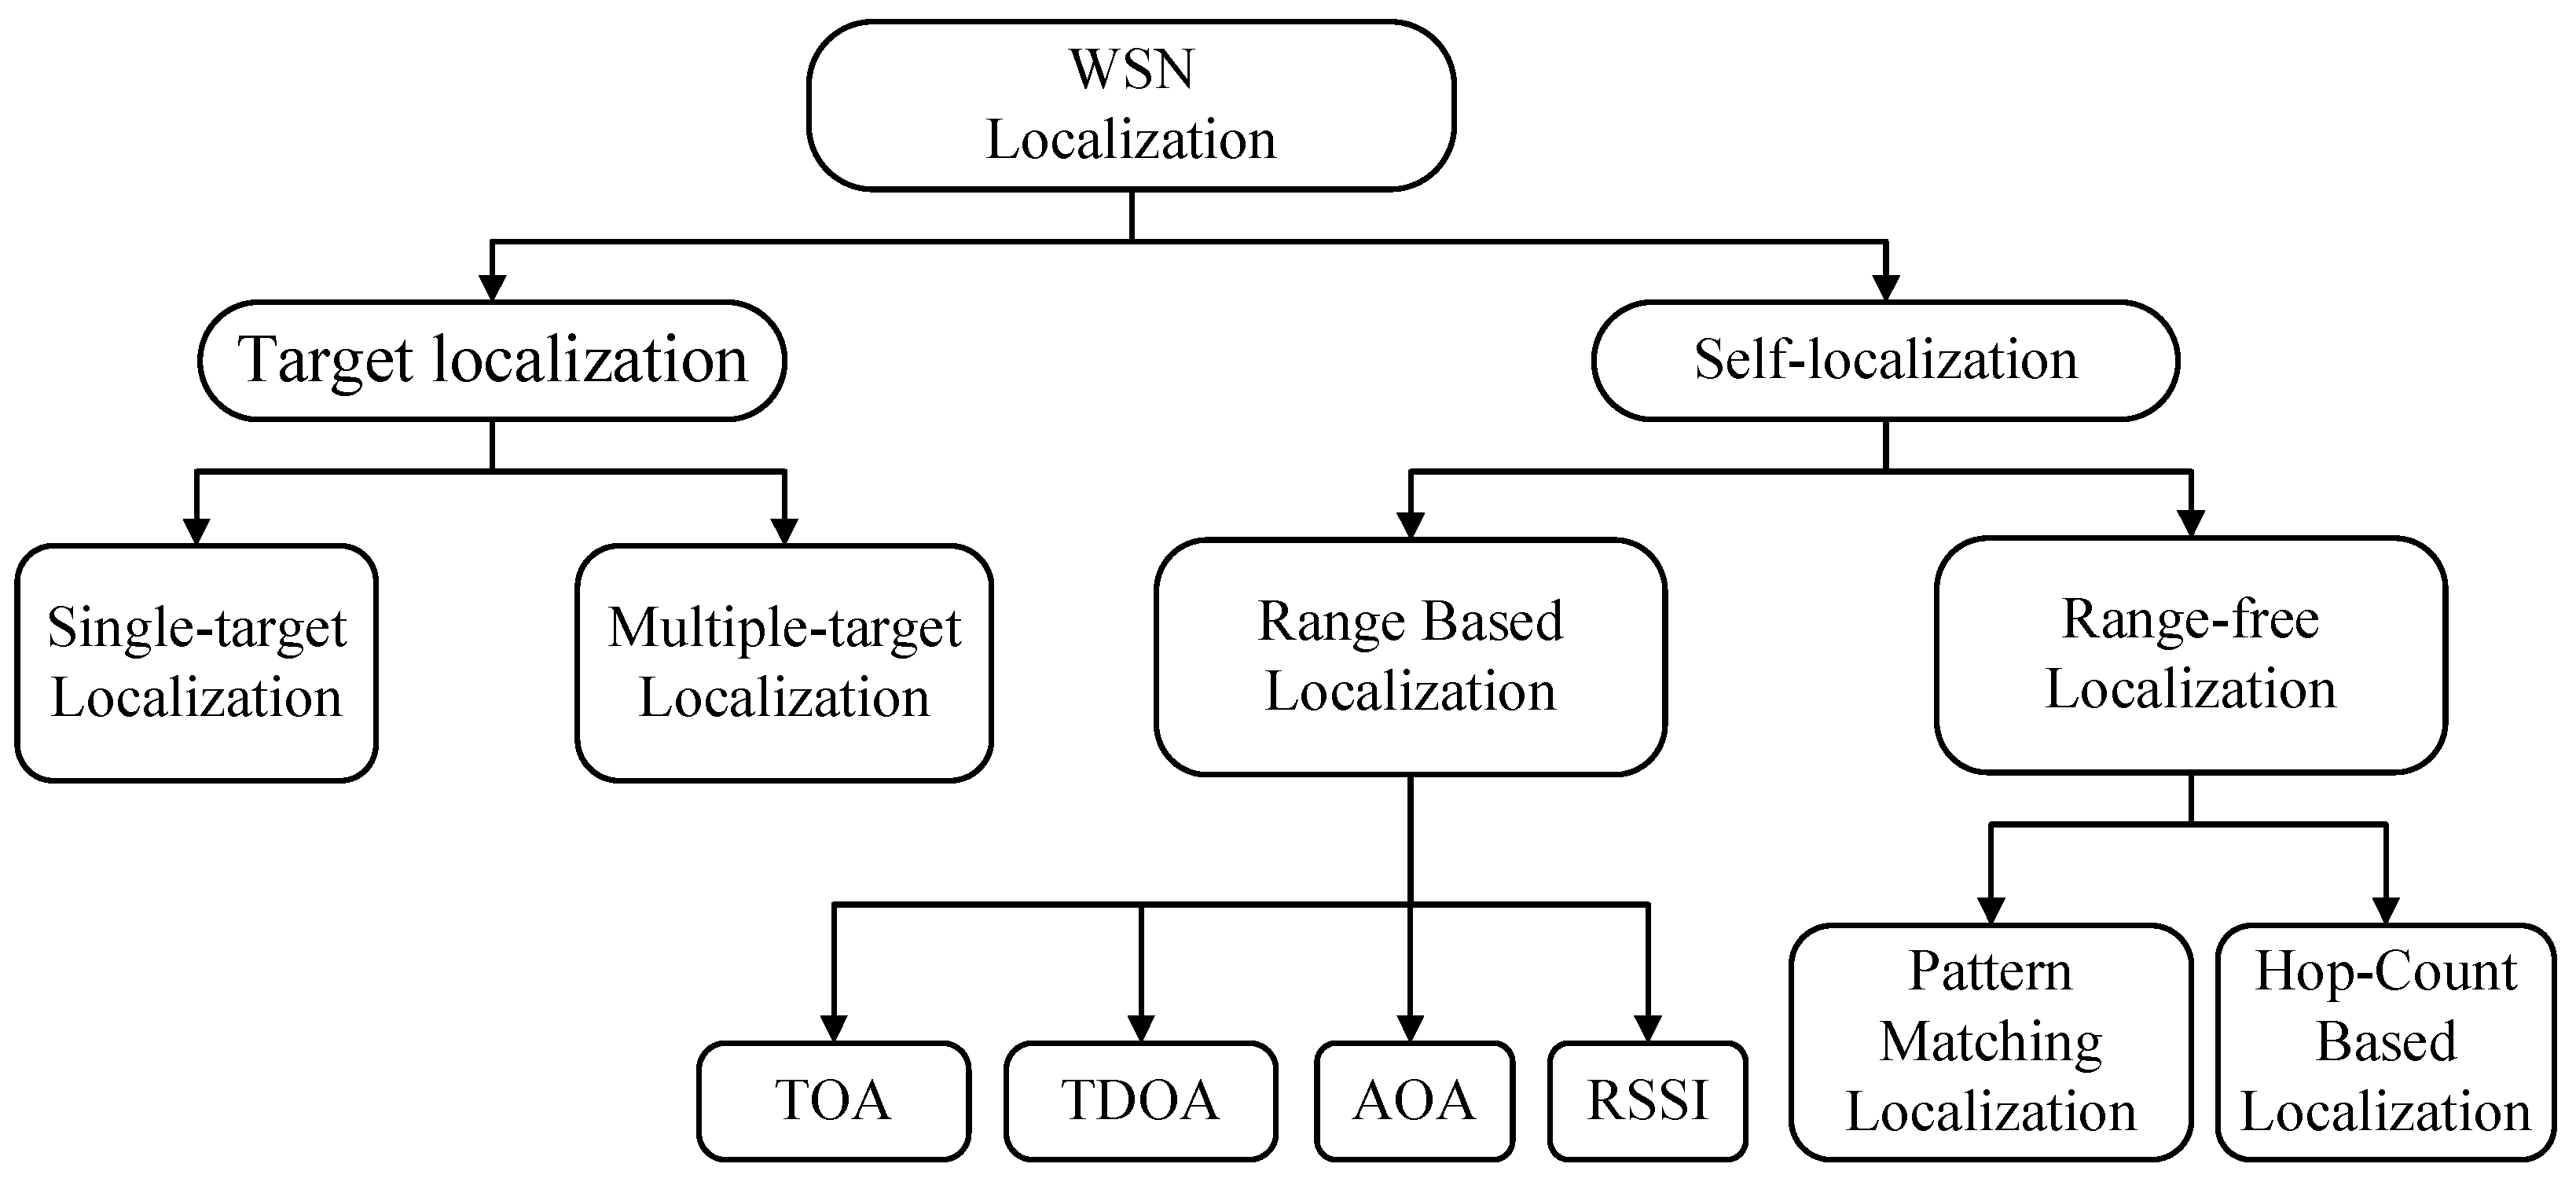
Figure 1.
Classification of localization algorithms.
Figure 1.
Classification of localization algorithms.
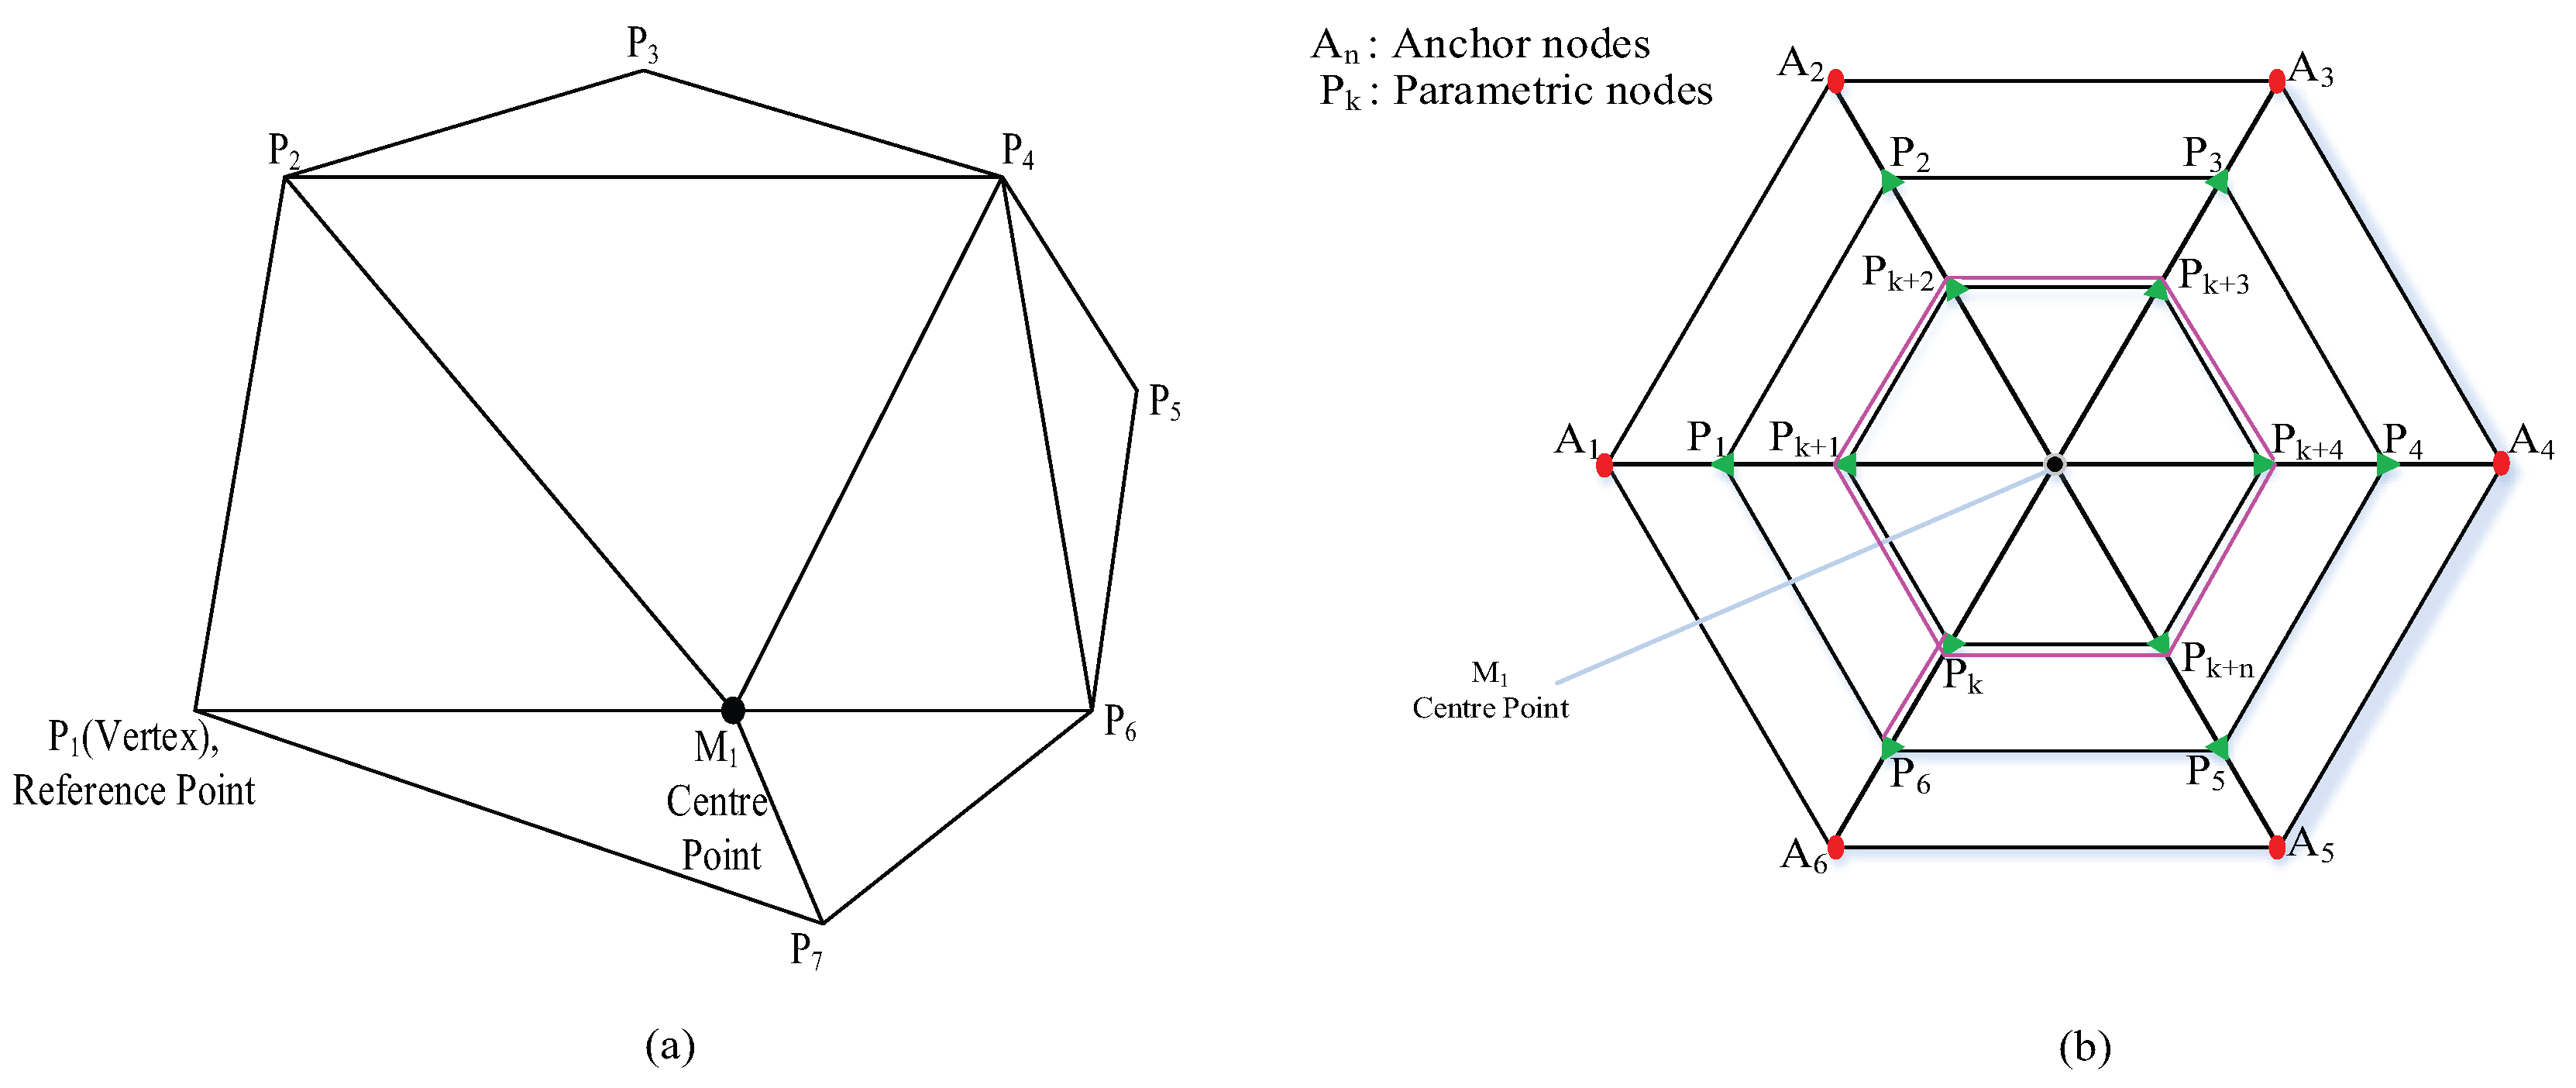
Figure 2.
(a) Triangulation of Parametric nodes distribution from control vertices; (b) Parametric points calculation in Loop division.
Figure 2.
(a) Triangulation of Parametric nodes distribution from control vertices; (b) Parametric points calculation in Loop division.
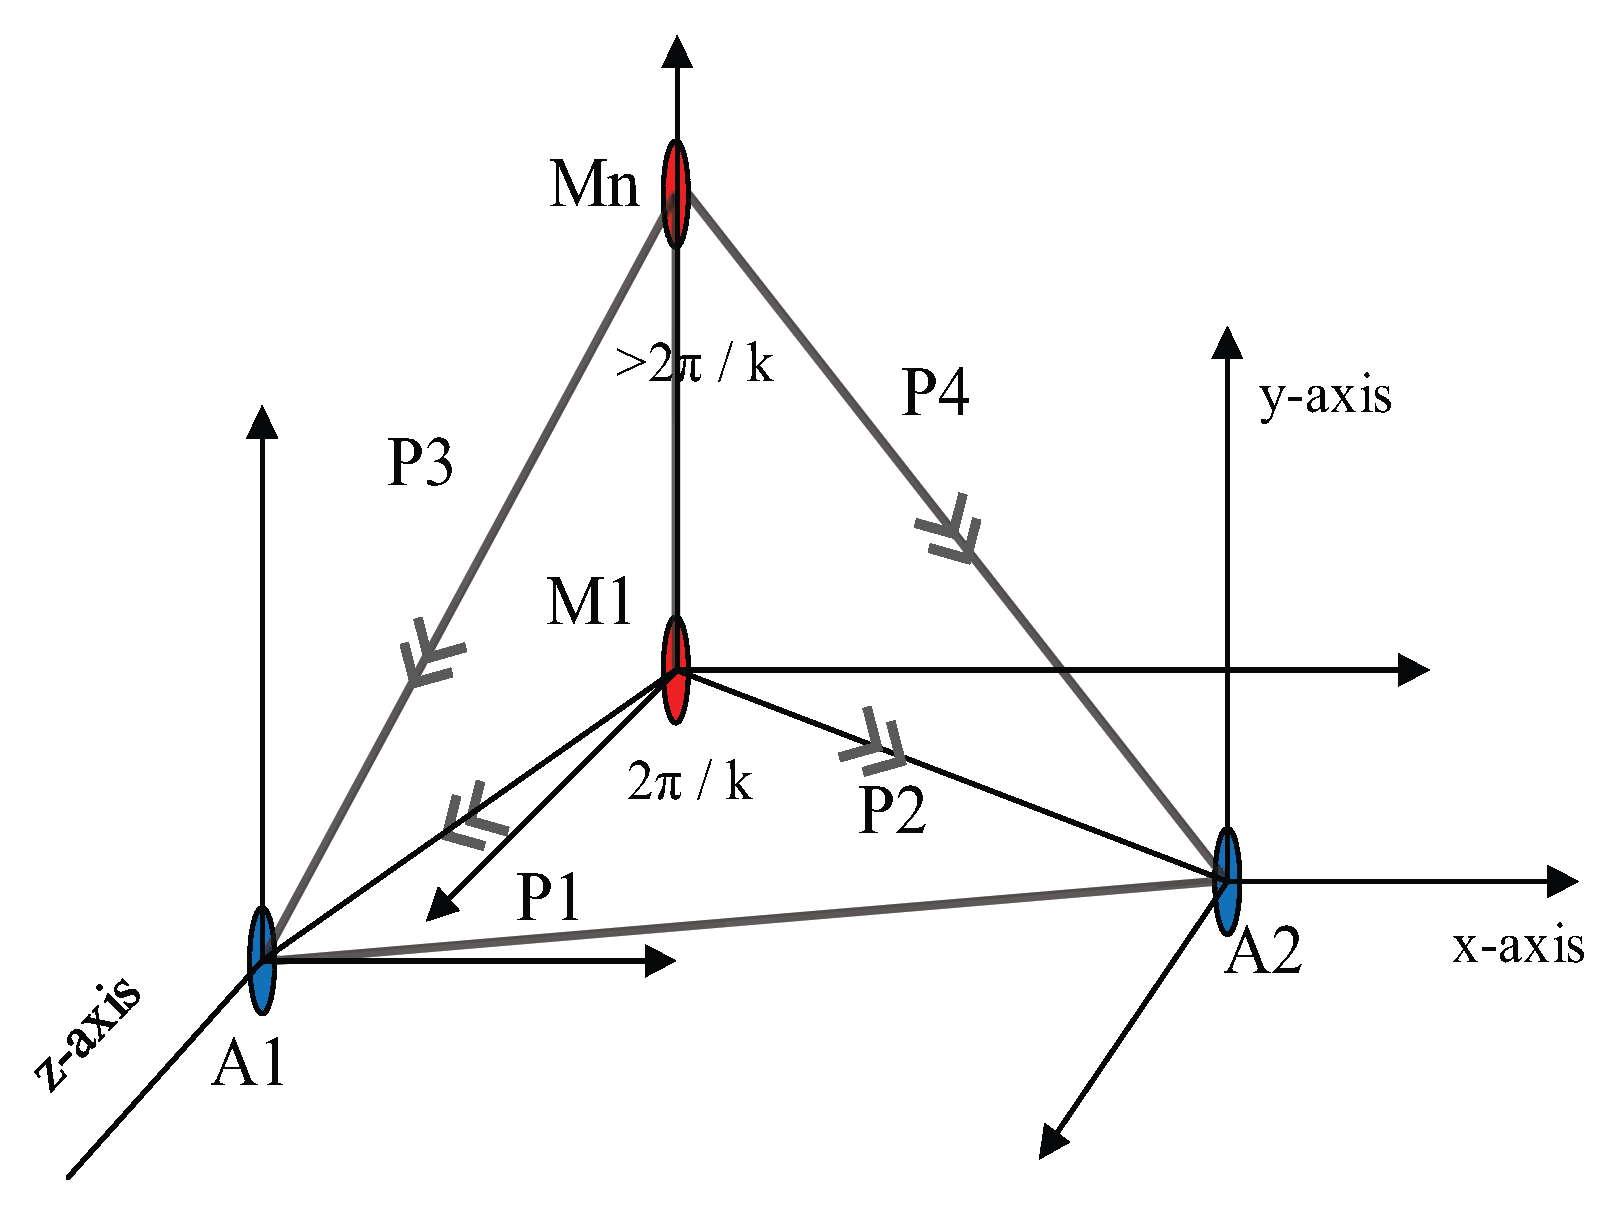
Figure 3.
Triangulation and midpoint calculations in a parametric Loop division (PLD) network.
Figure 3.
Triangulation and midpoint calculations in a parametric Loop division (PLD) network.
Figure 4.
Effect on parameterization with various parametric factors.
Figure 4.
Effect on parameterization with various parametric factors.
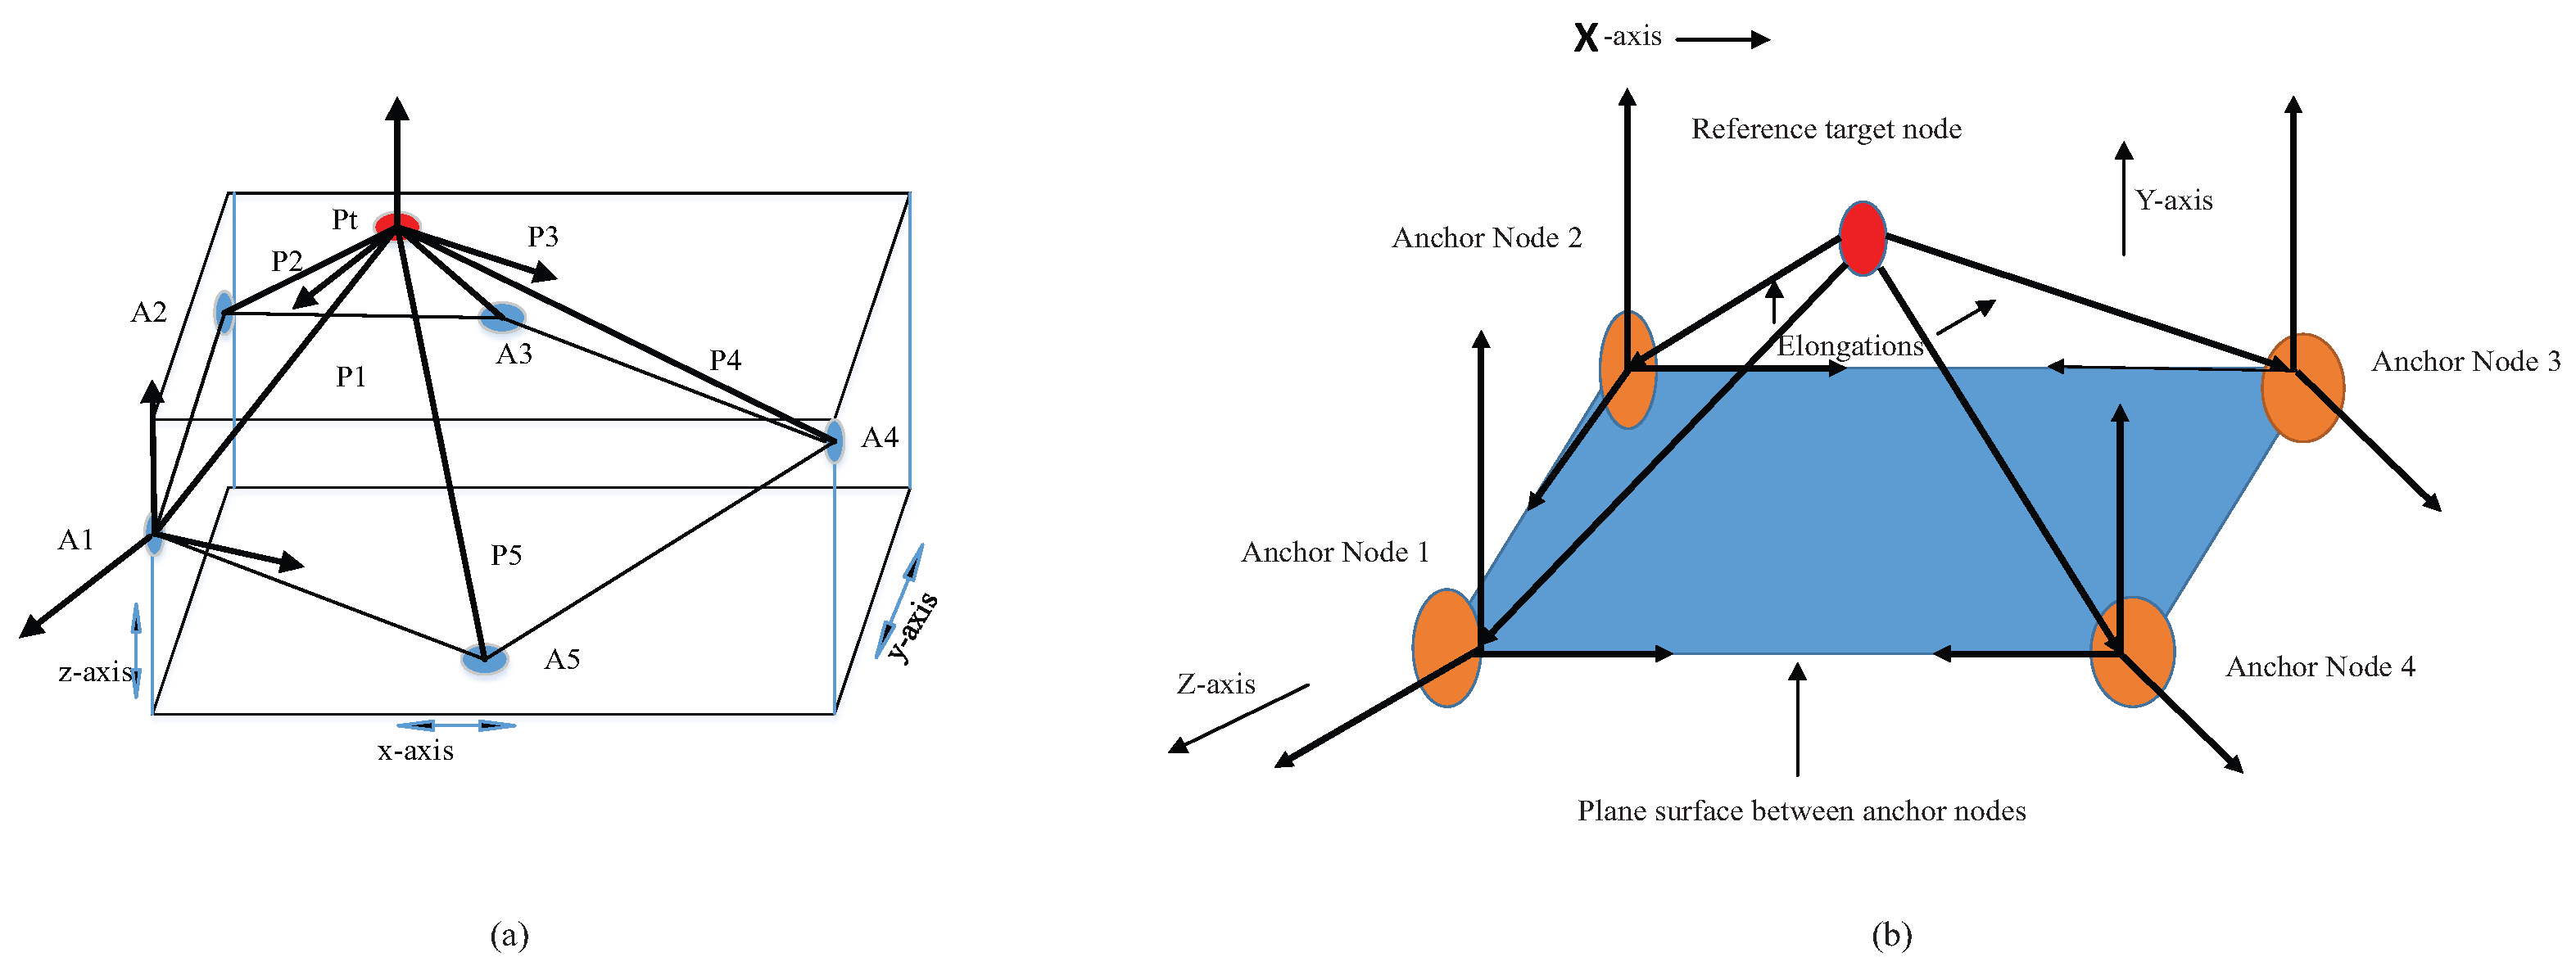
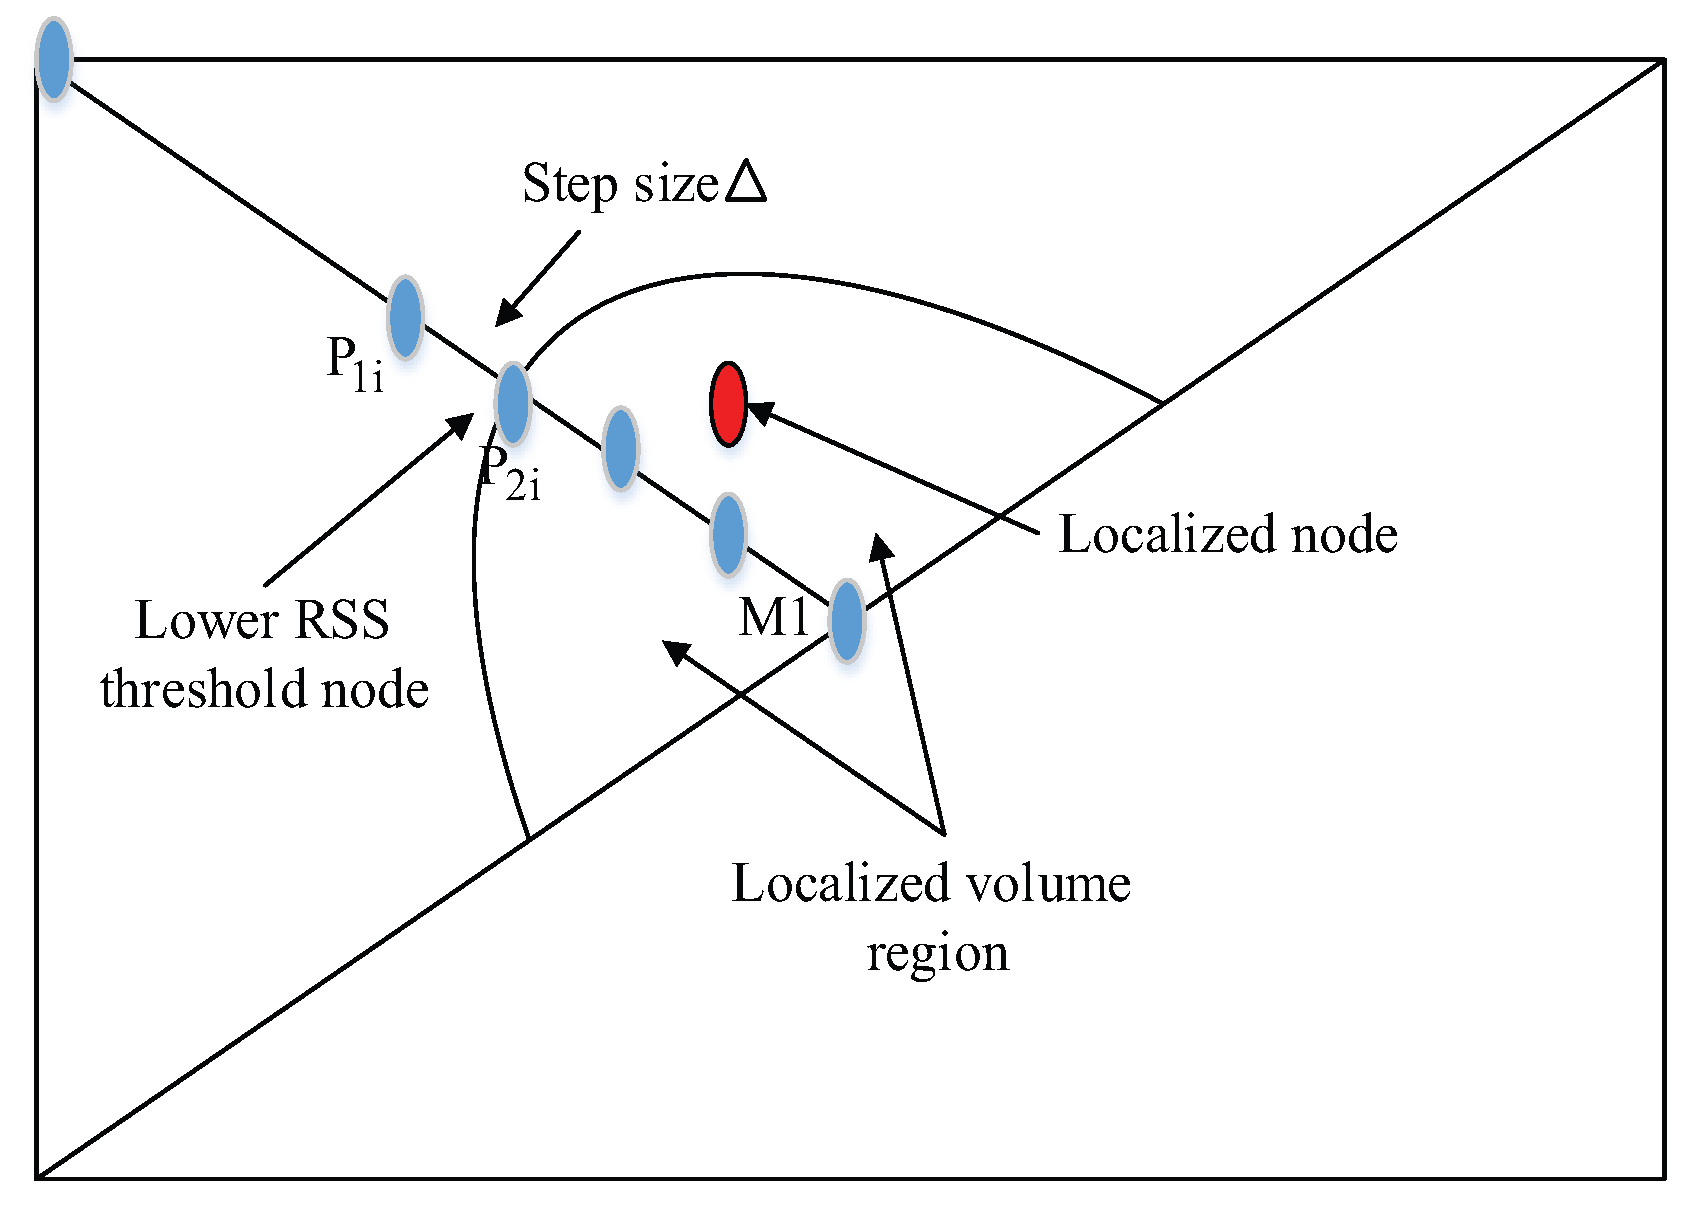
Figure 5.
Localized volume region along with localized node.
Figure 5.
Localized volume region along with localized node.
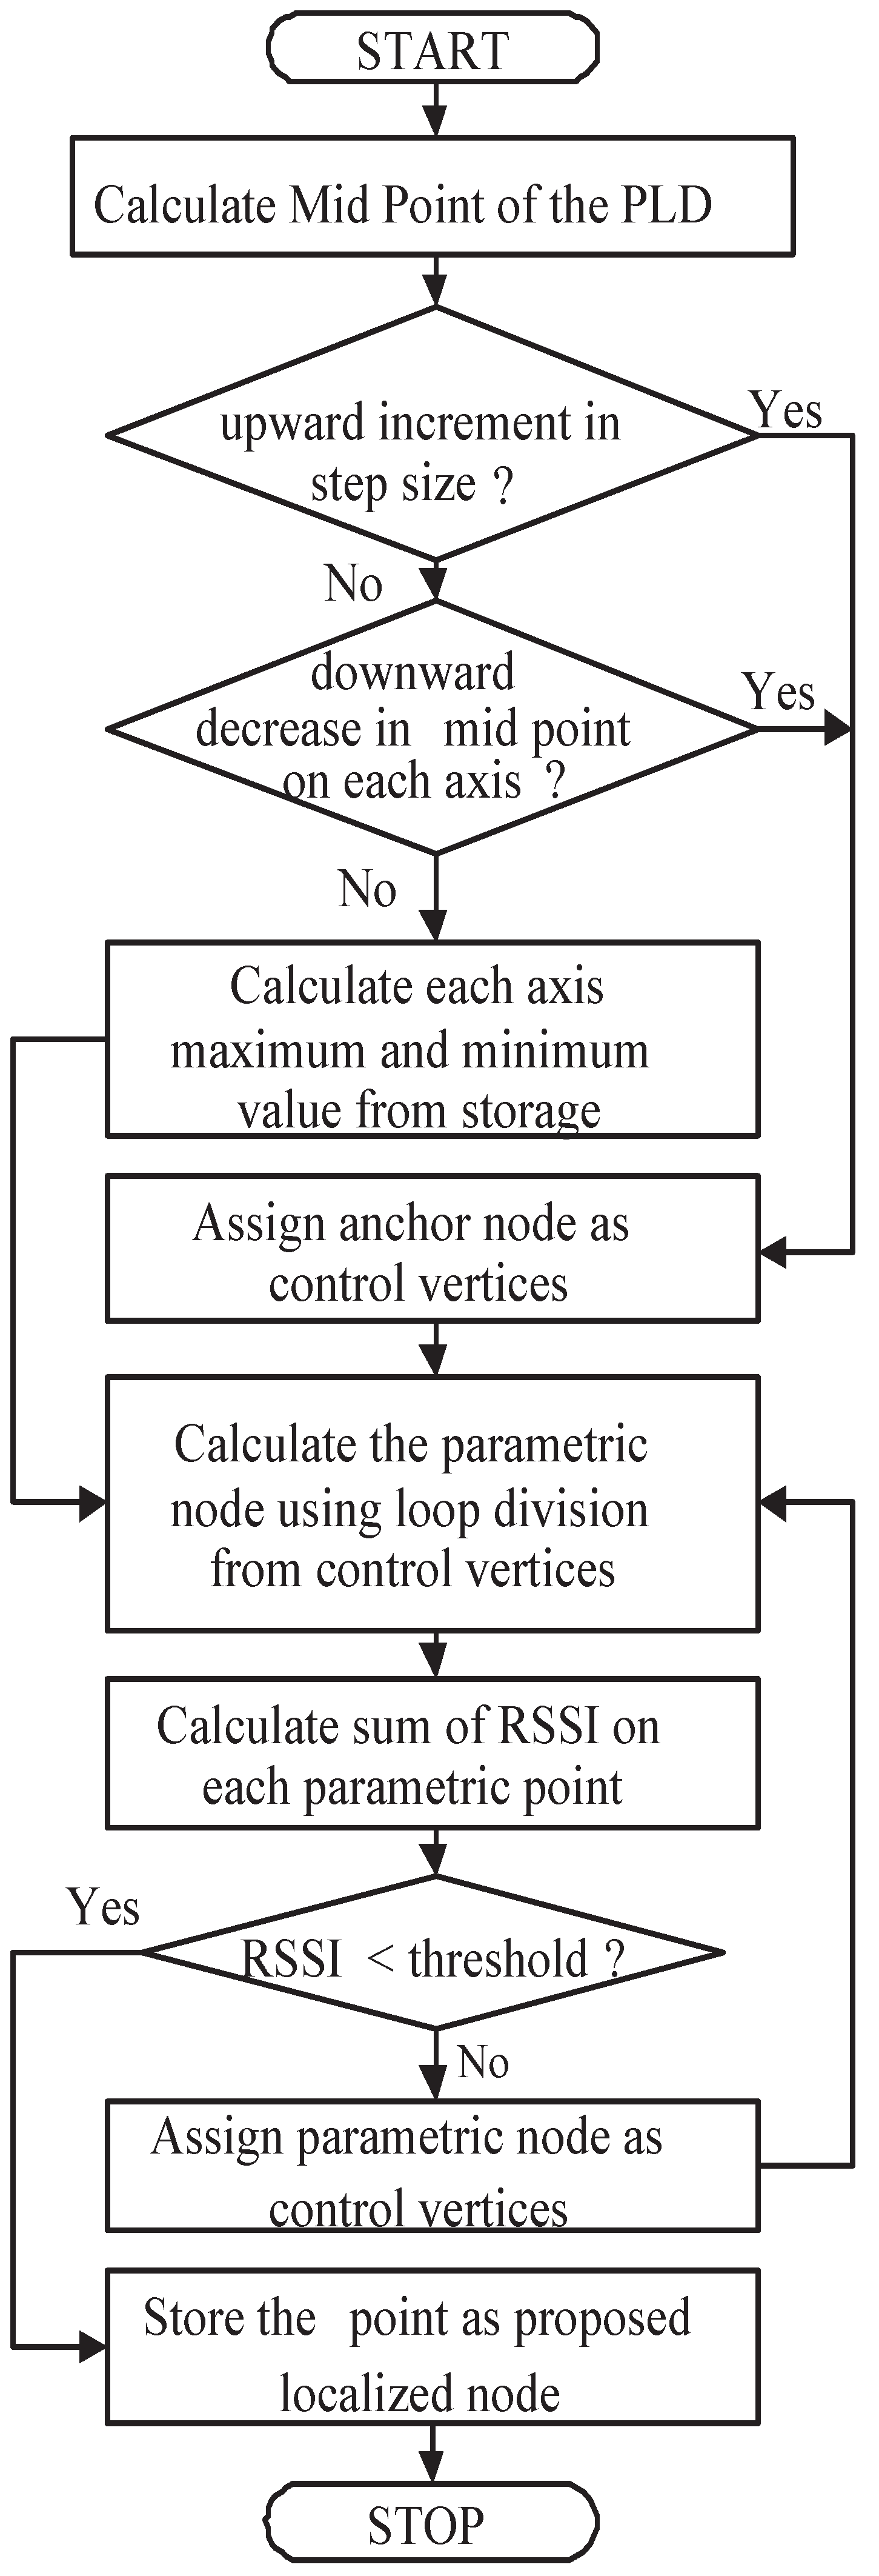
Figure 6.
Flow diagram of PLD algorithm.
Figure 6.
Flow diagram of PLD algorithm.
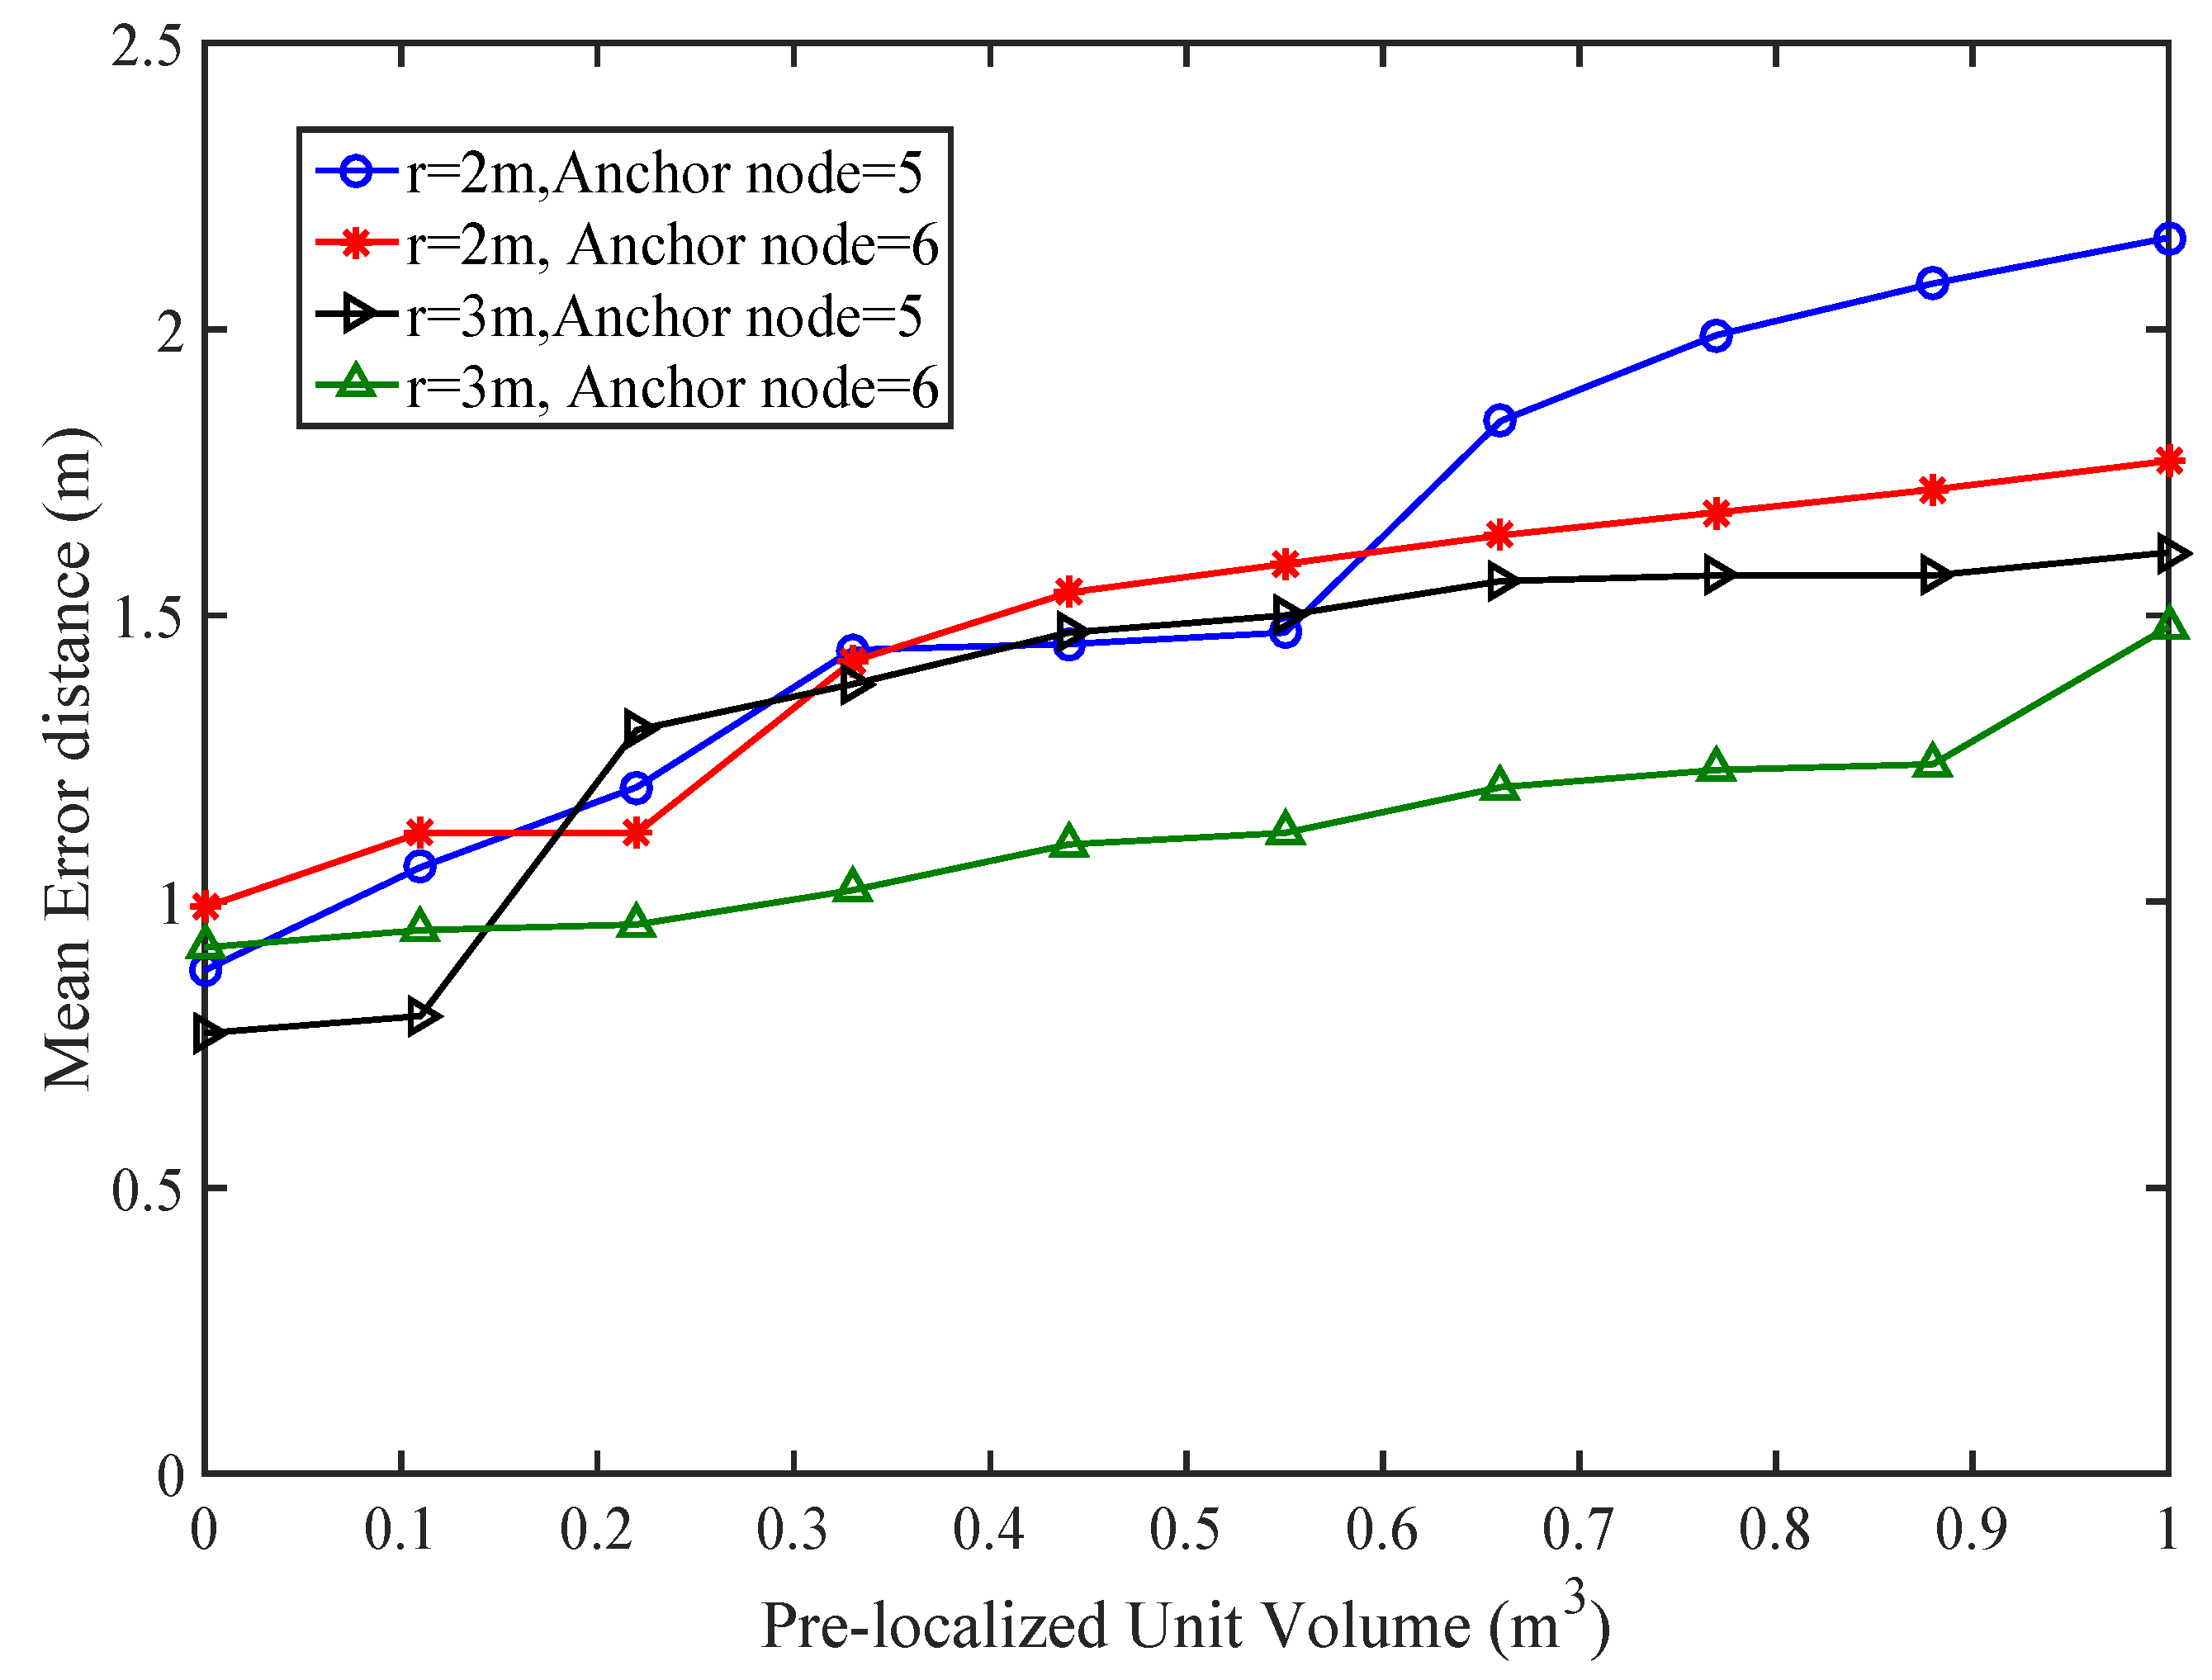
Figure 7.
Mean error analysis with different volumes of PLD.
Figure 7.
Mean error analysis with different volumes of PLD.
Figure 8.
Effect of Multipath Fading on Localization Error.
Figure 8.
Effect of Multipath Fading on Localization Error.
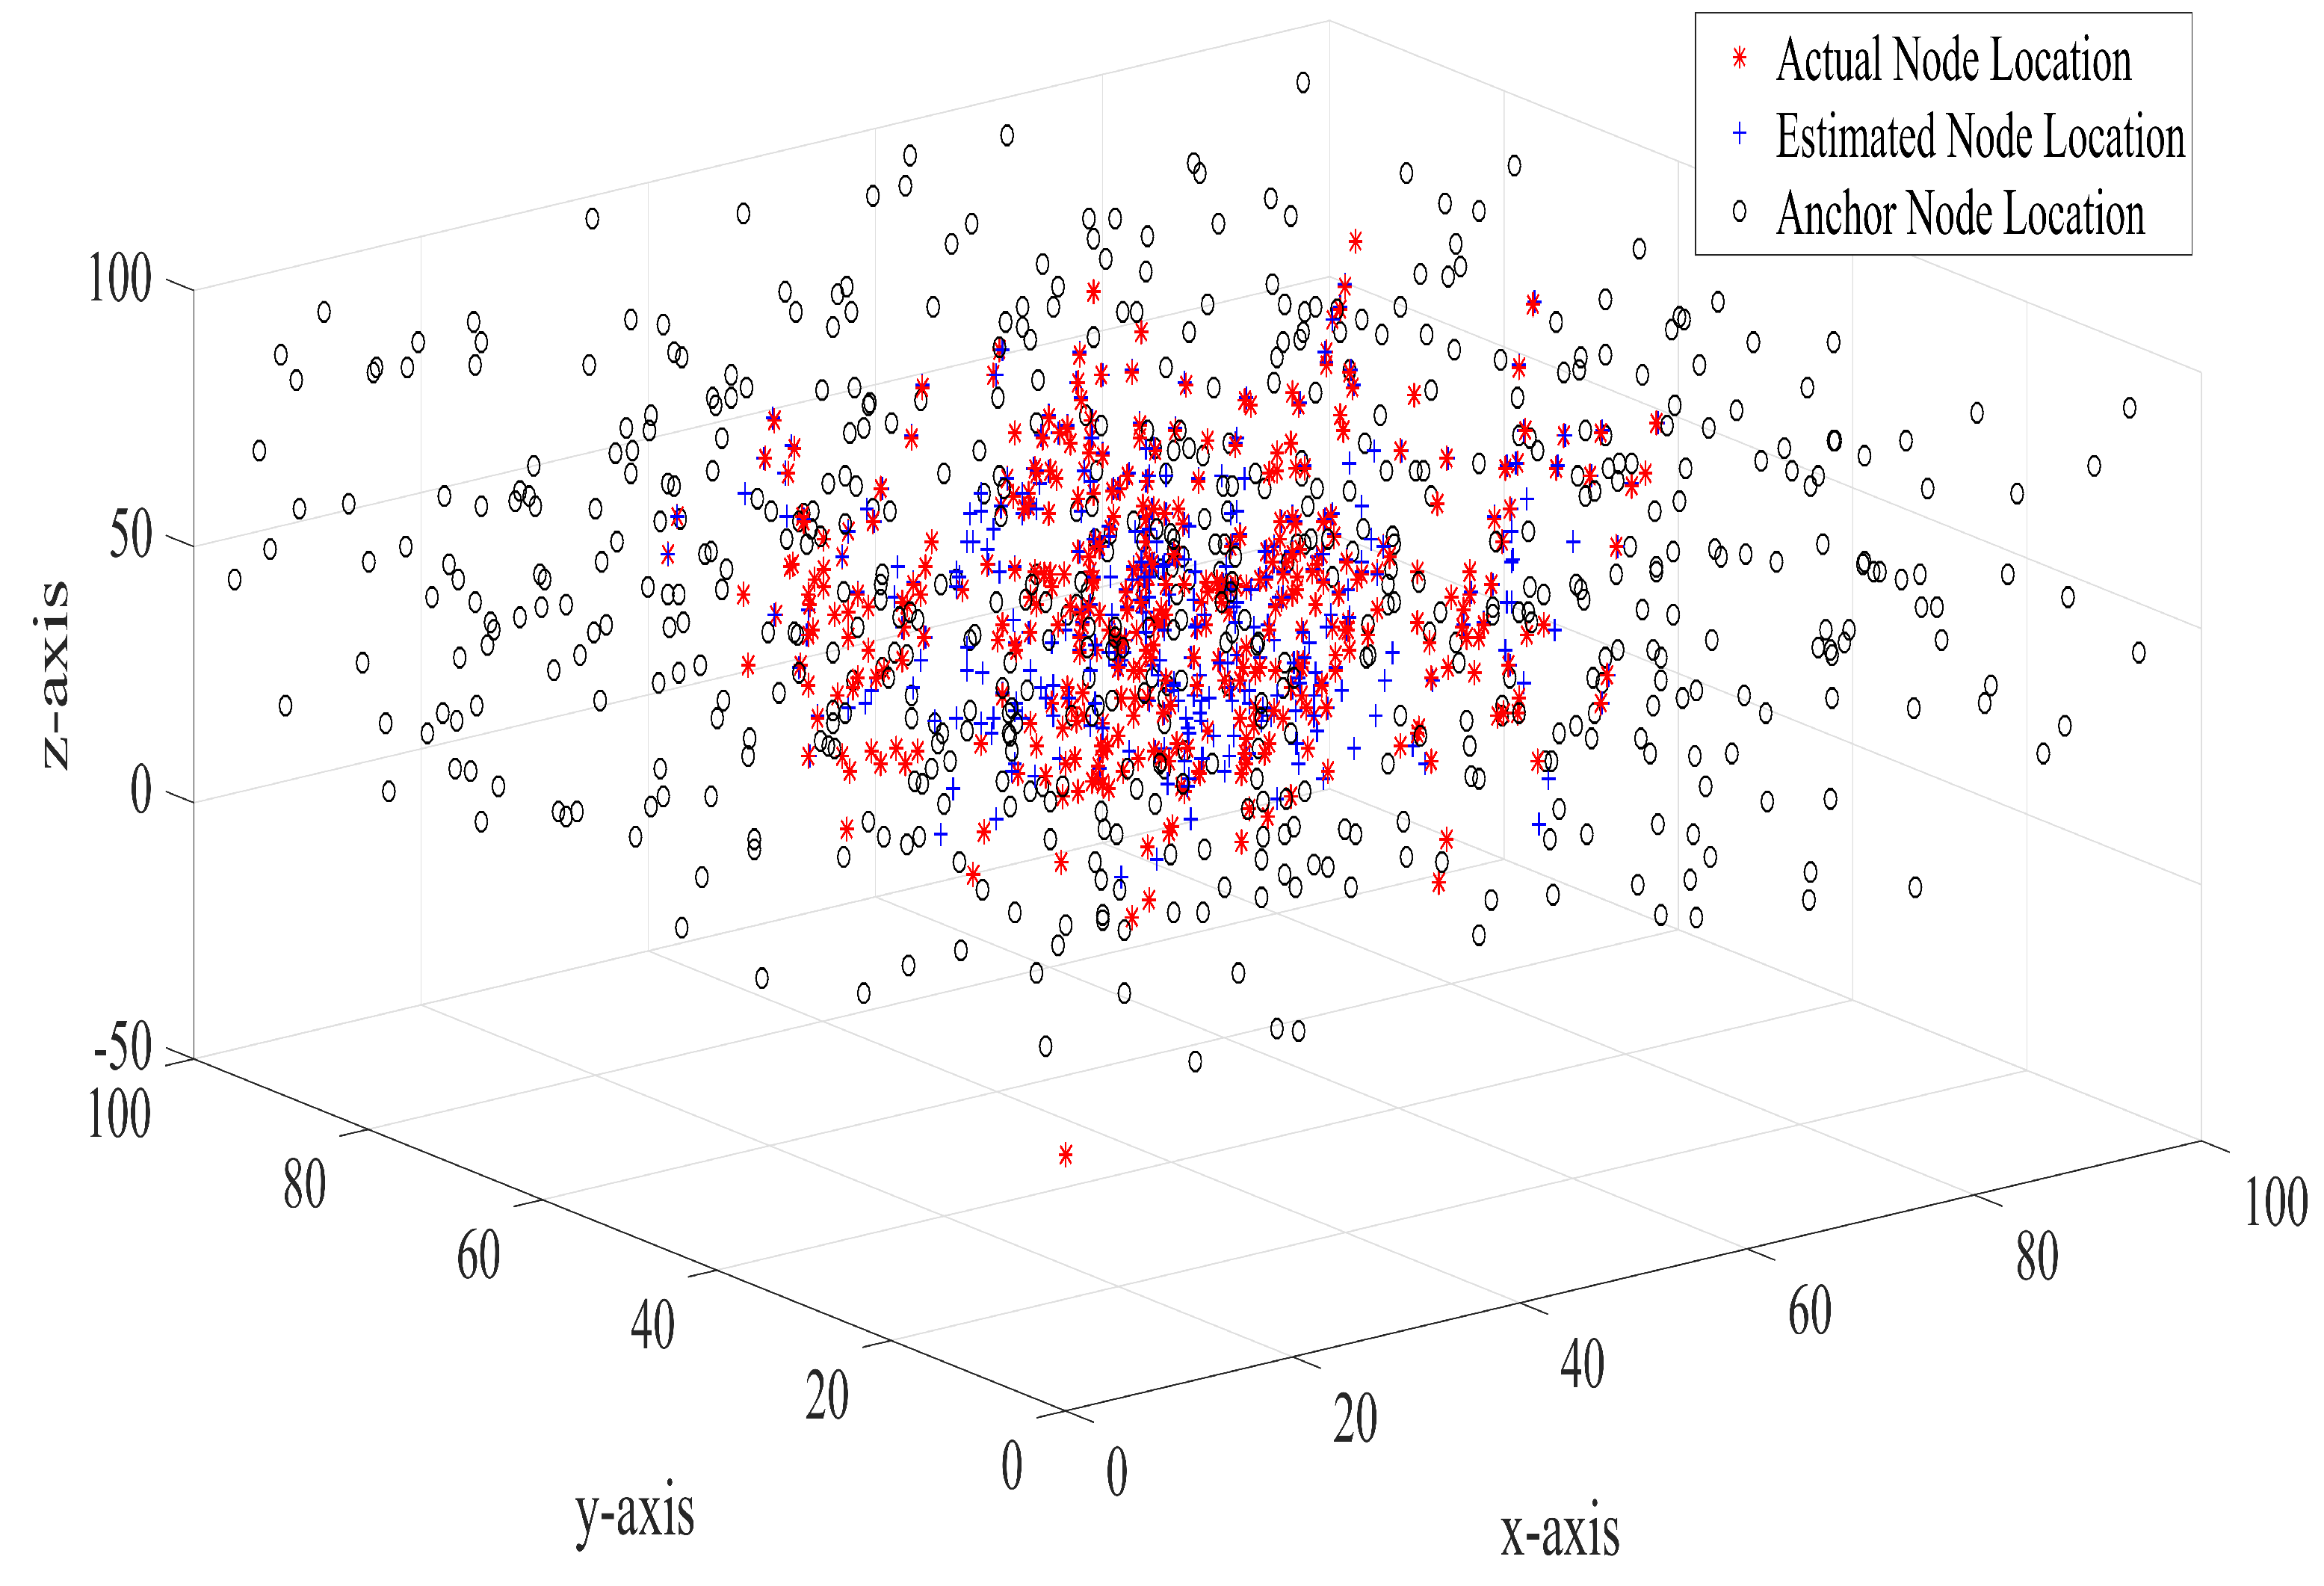
Figure 9.
Location of anchor nodes, actual sensor nodes and estimated sensor nodes in 3D environment.
Figure 9.
Location of anchor nodes, actual sensor nodes and estimated sensor nodes in 3D environment.
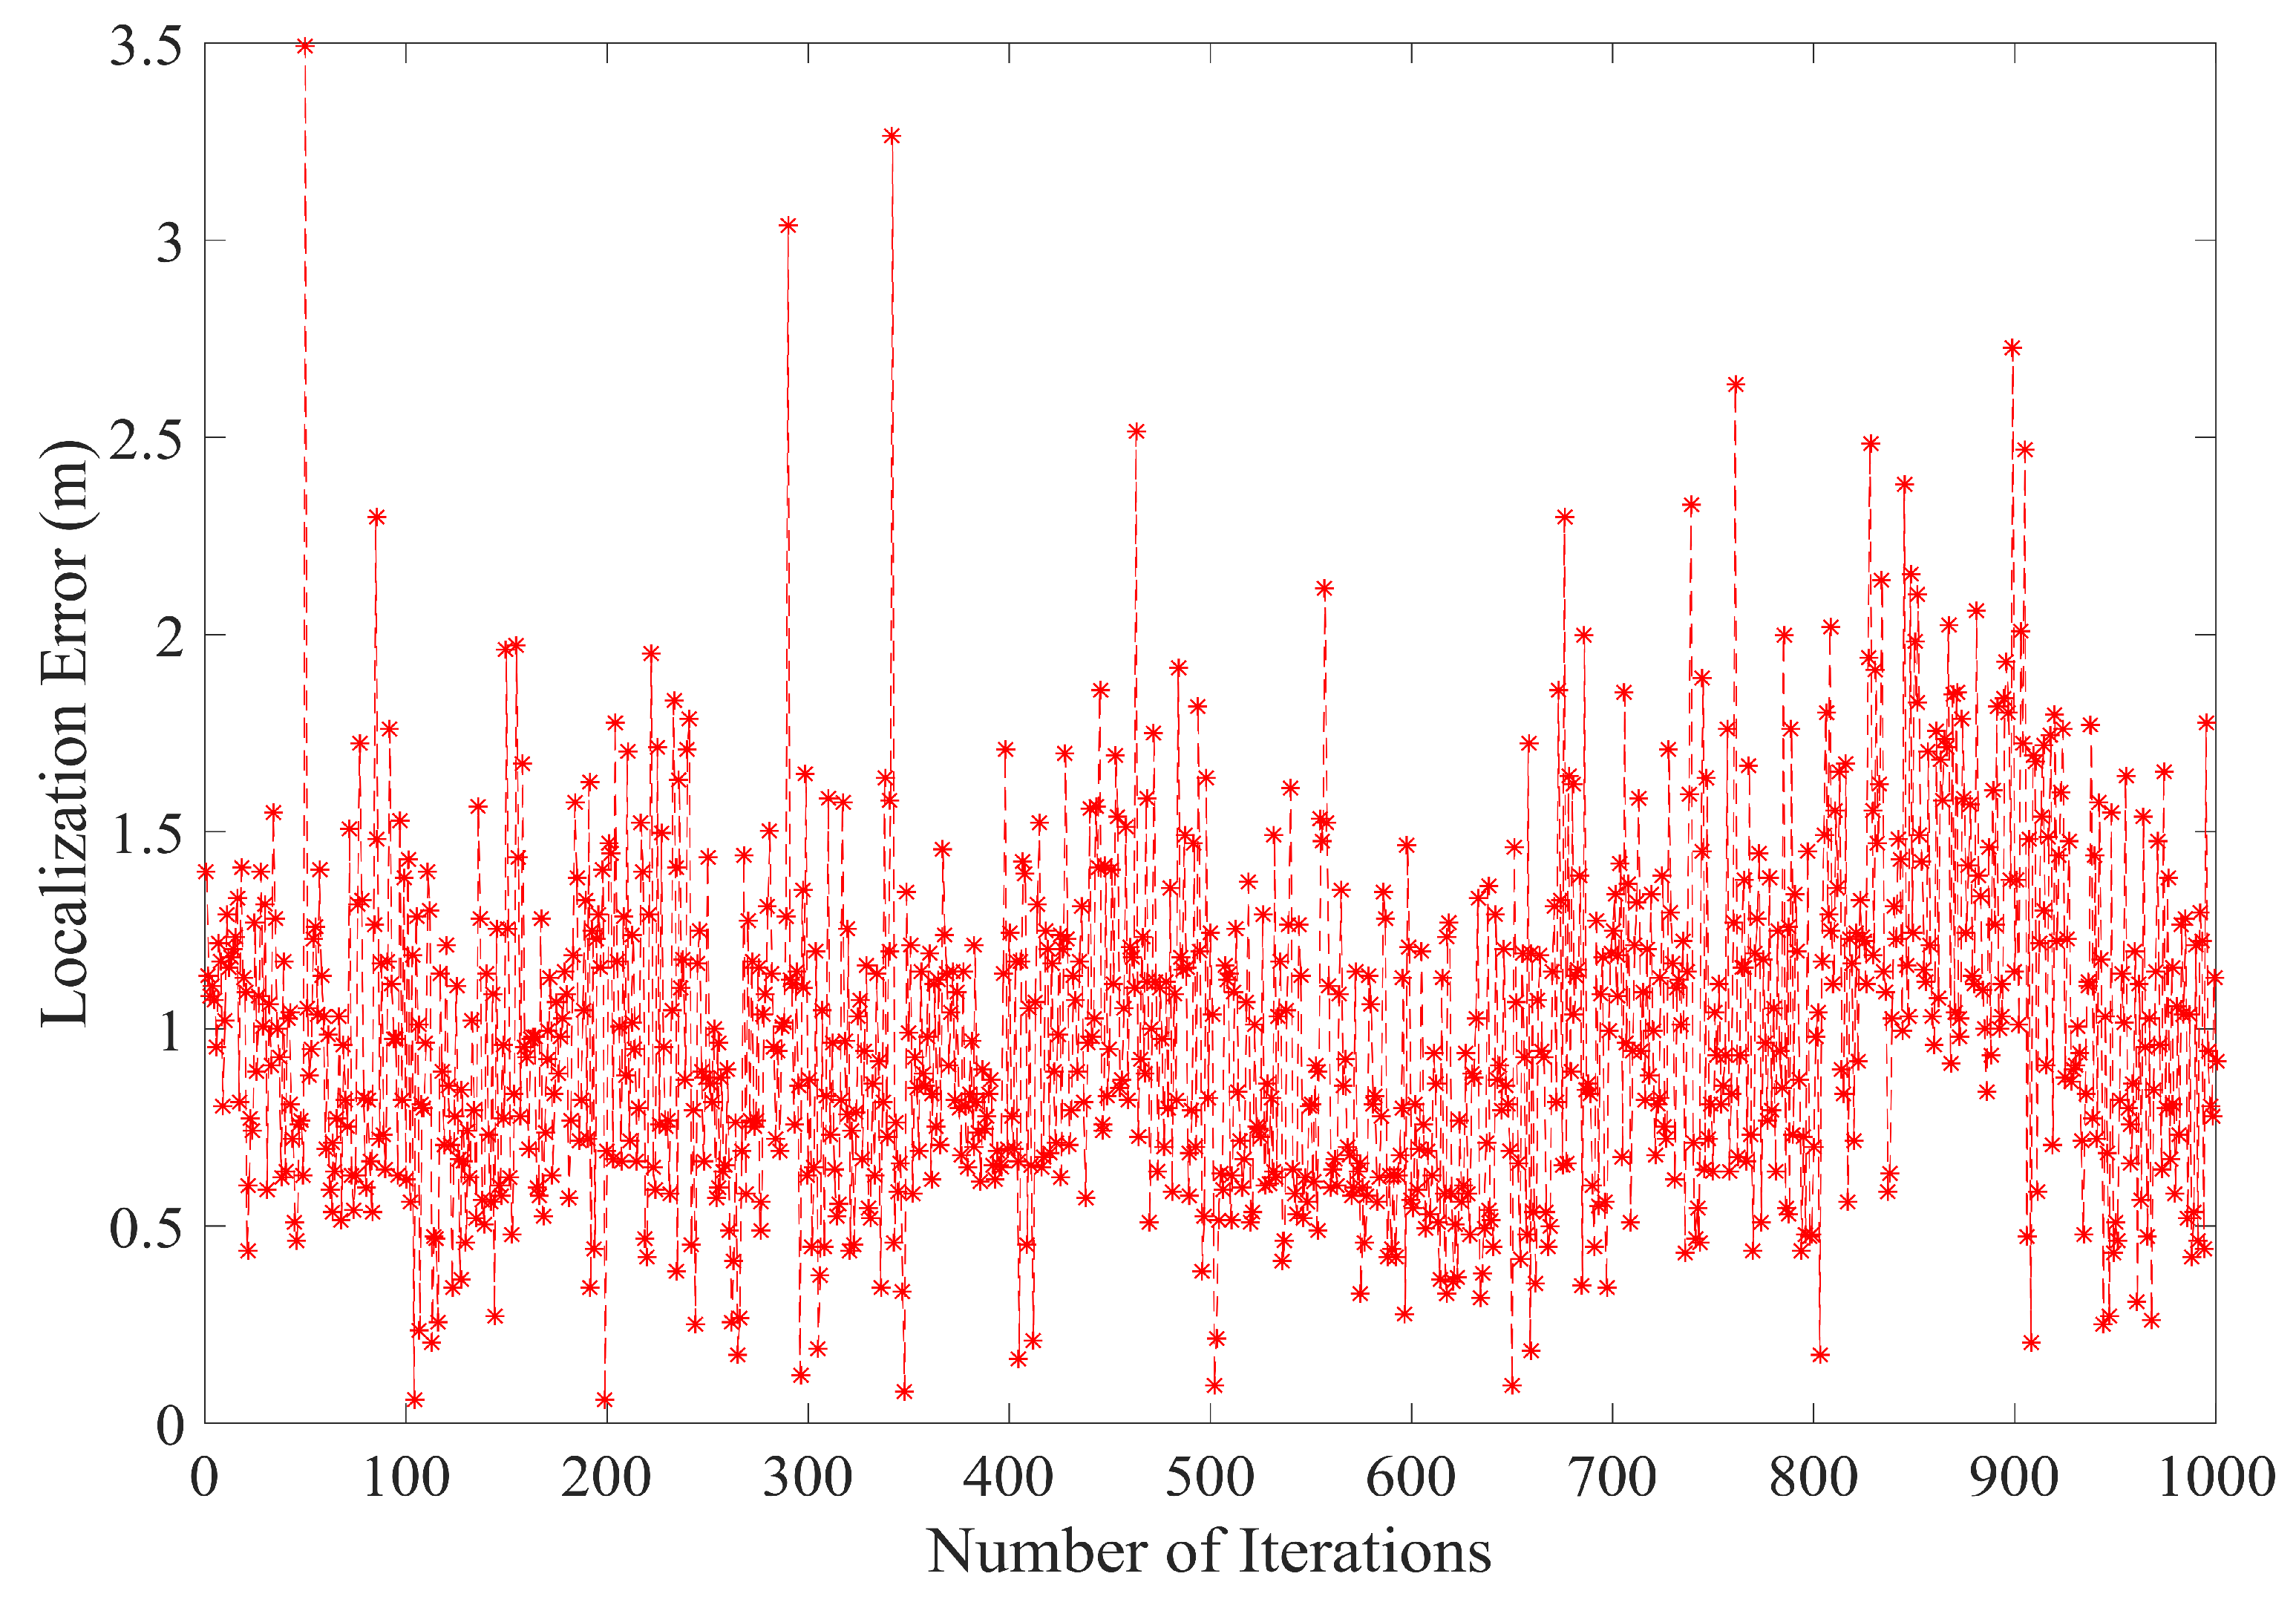
Figure 10.
Average localization error after 1000 iterations.
Figure 10.
Average localization error after 1000 iterations.
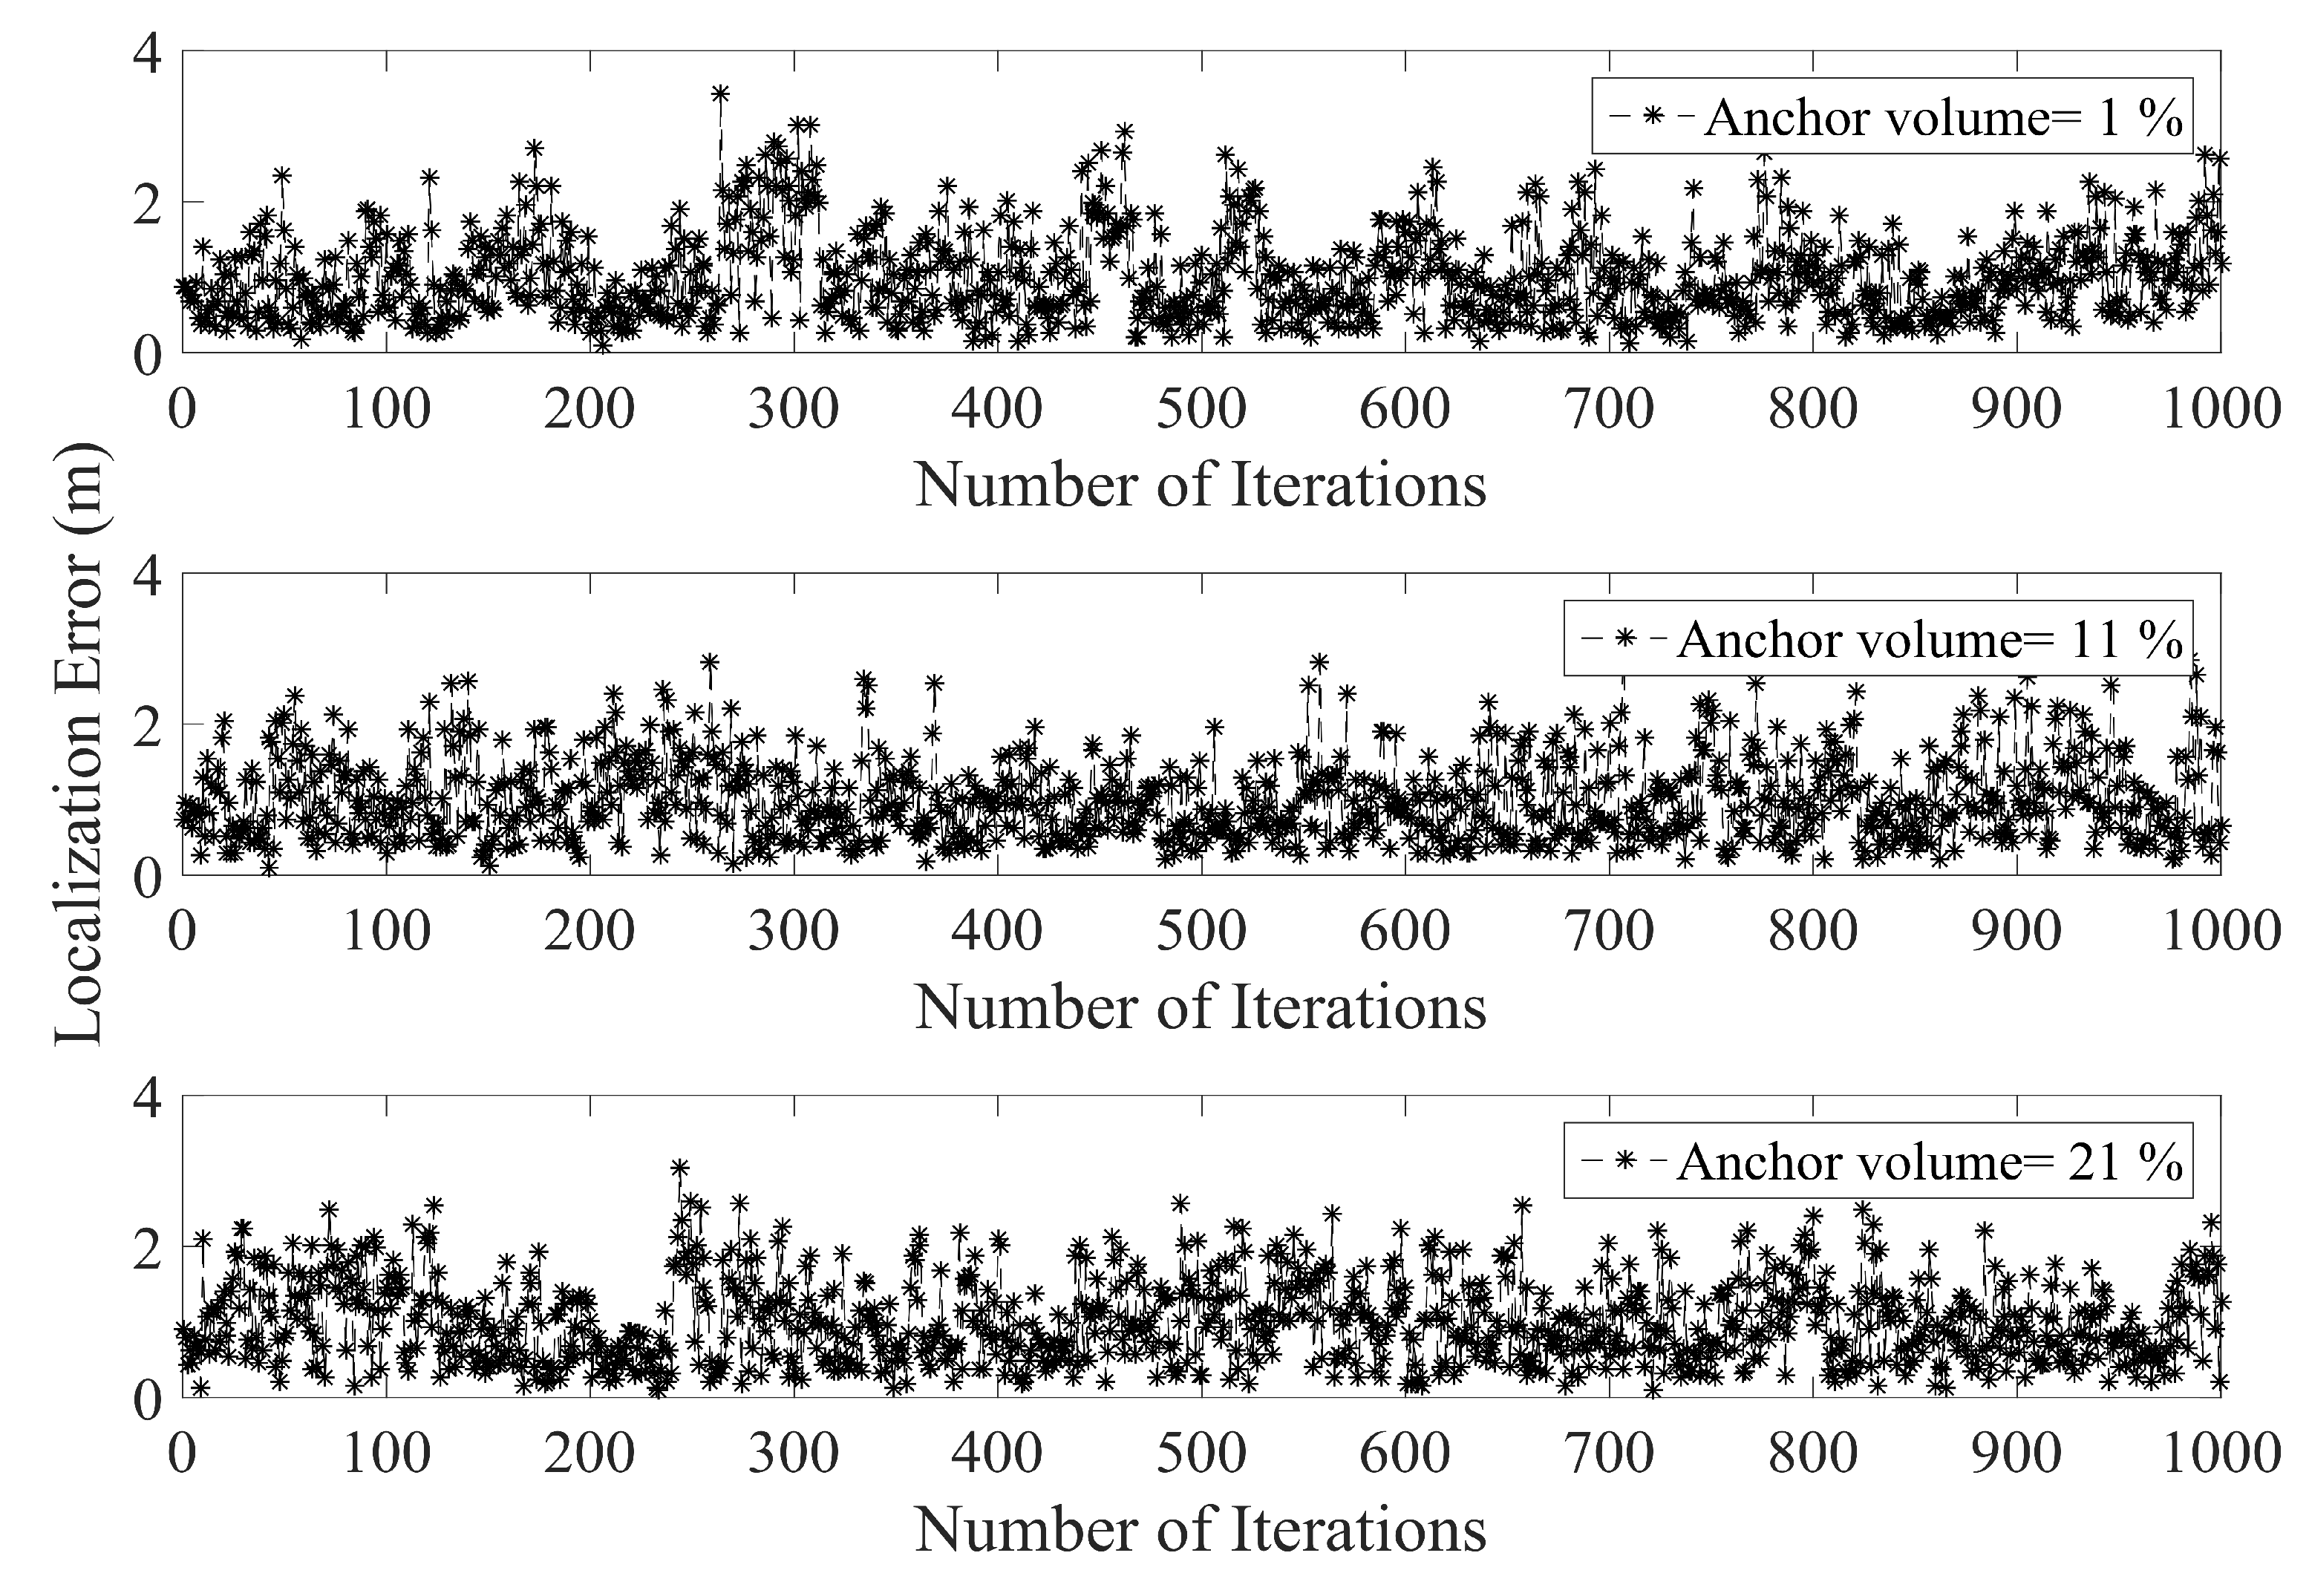
Figure 11.
Localization error under different percentage of anchor node density.
Figure 11.
Localization error under different percentage of anchor node density.
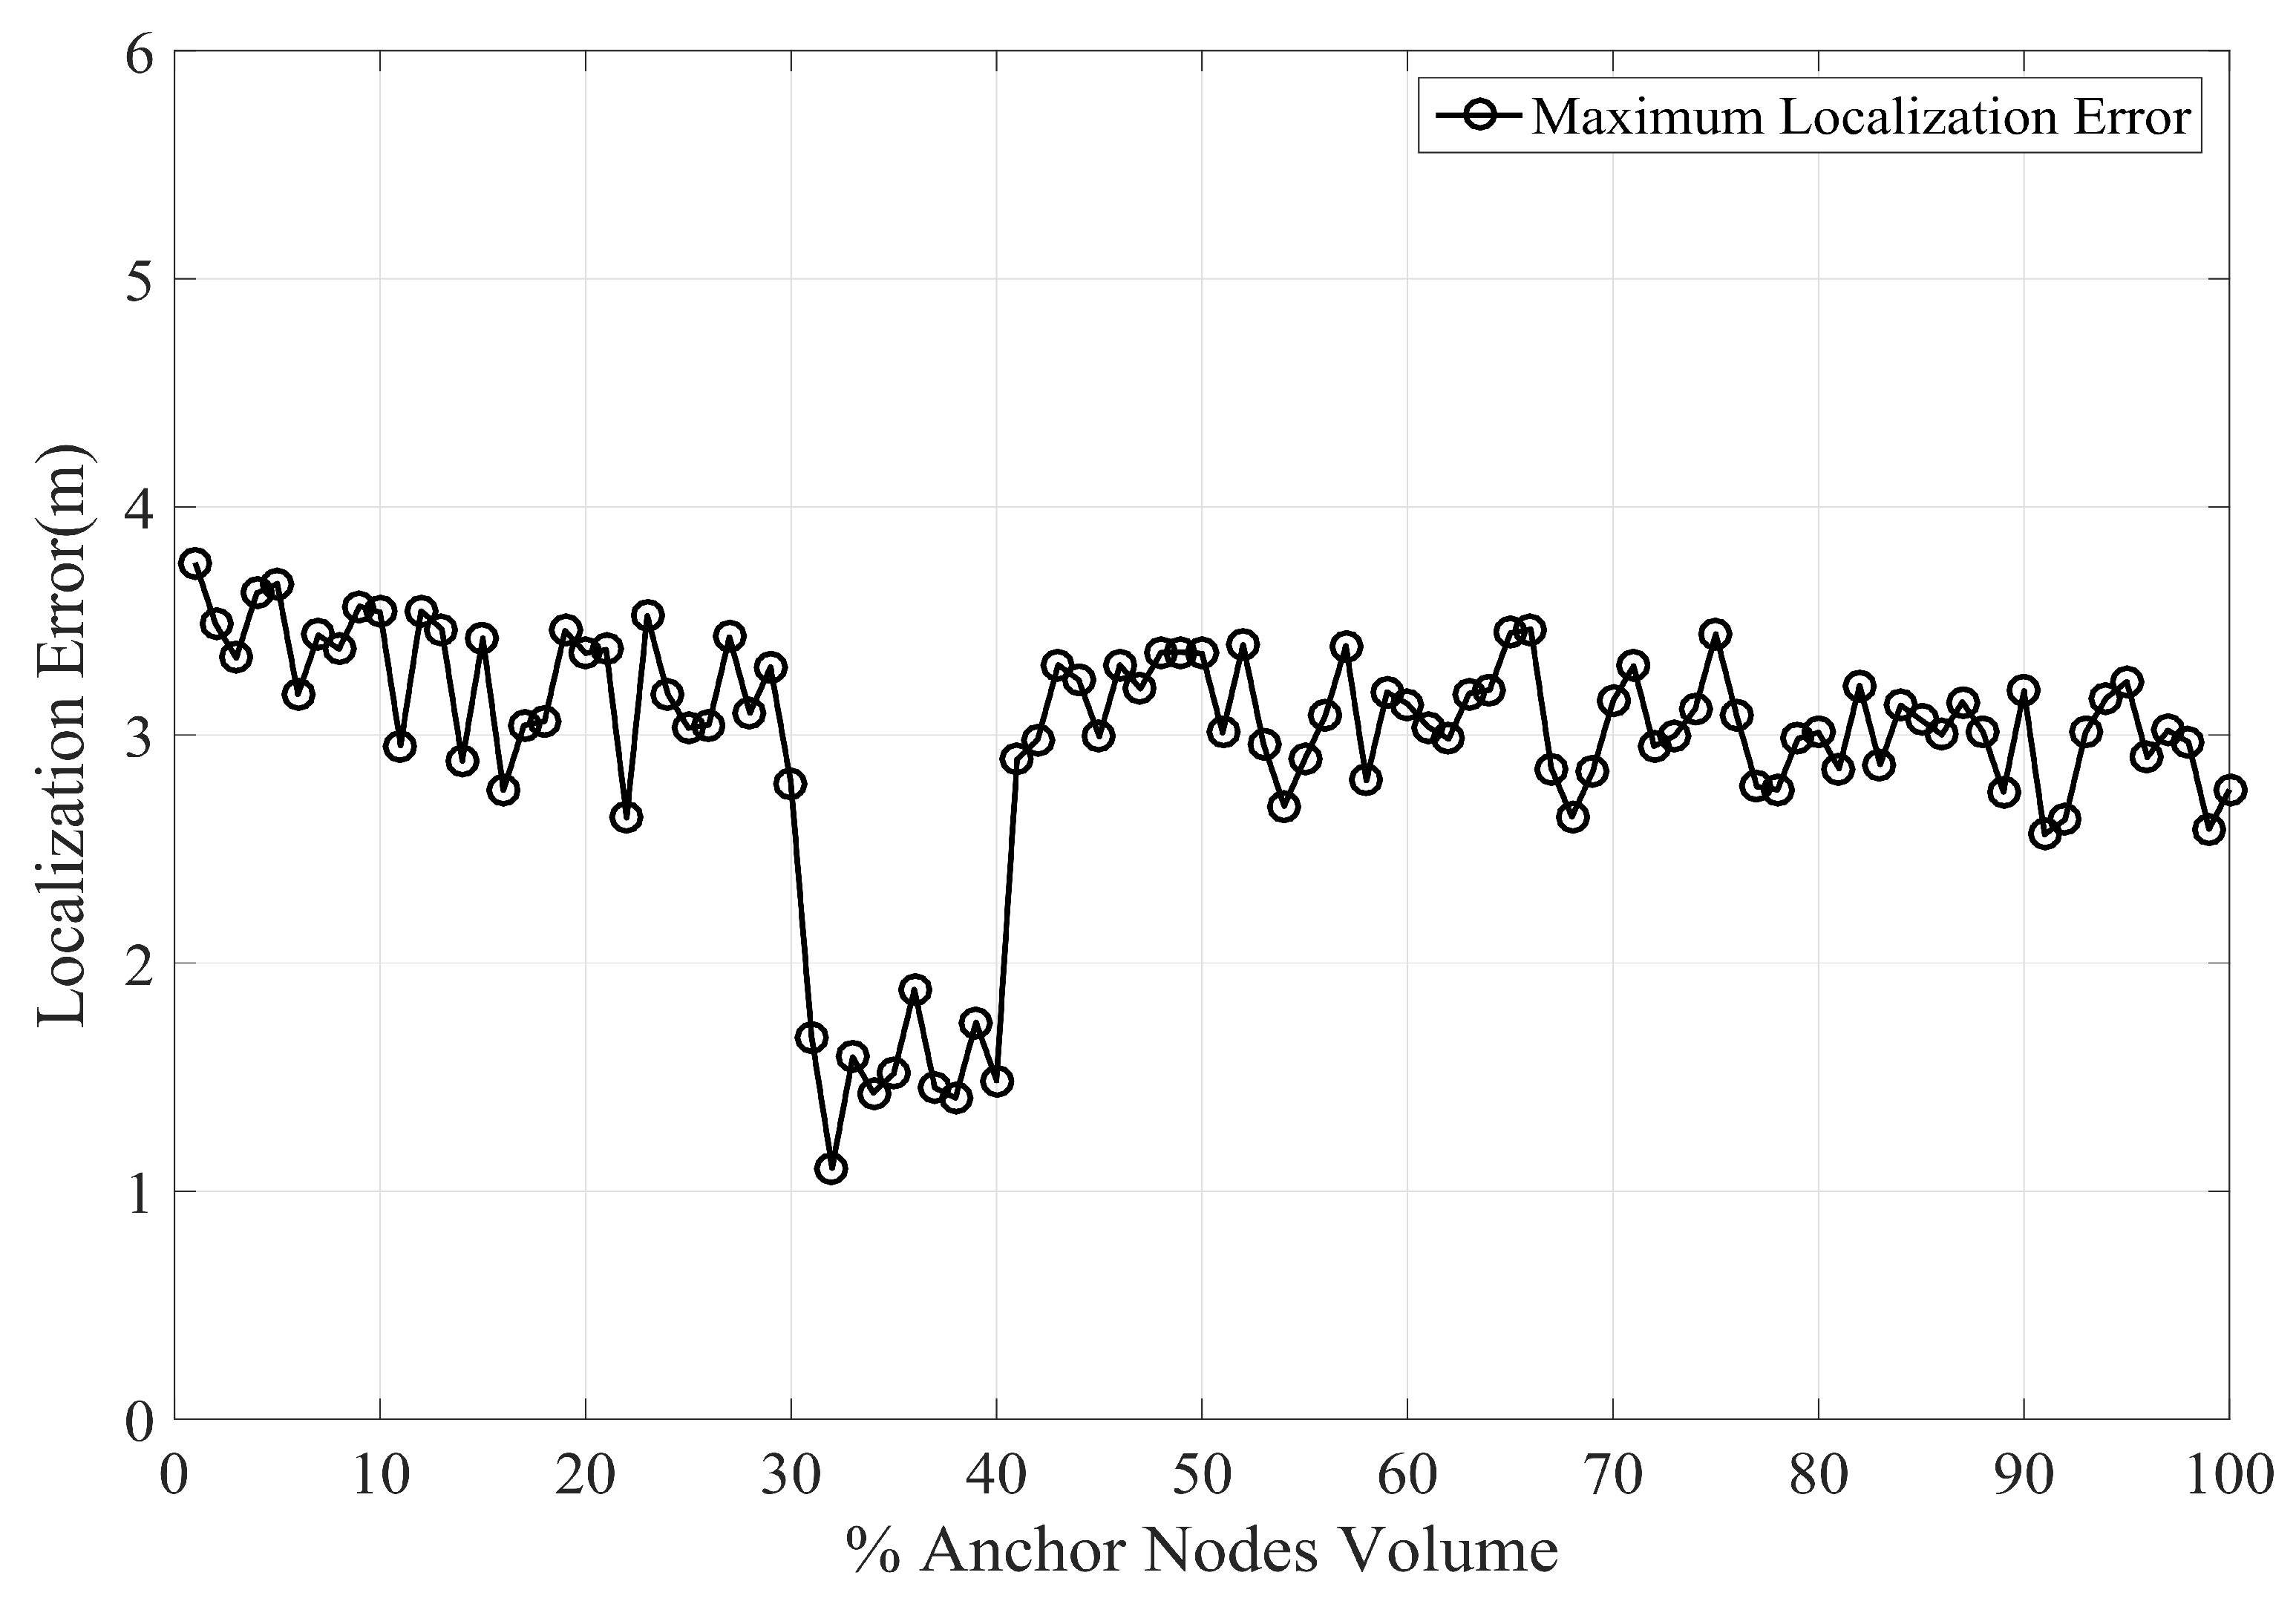
Figure 12.
Localization error vs varying percentage of anchor node density.
Figure 12.
Localization error vs varying percentage of anchor node density.
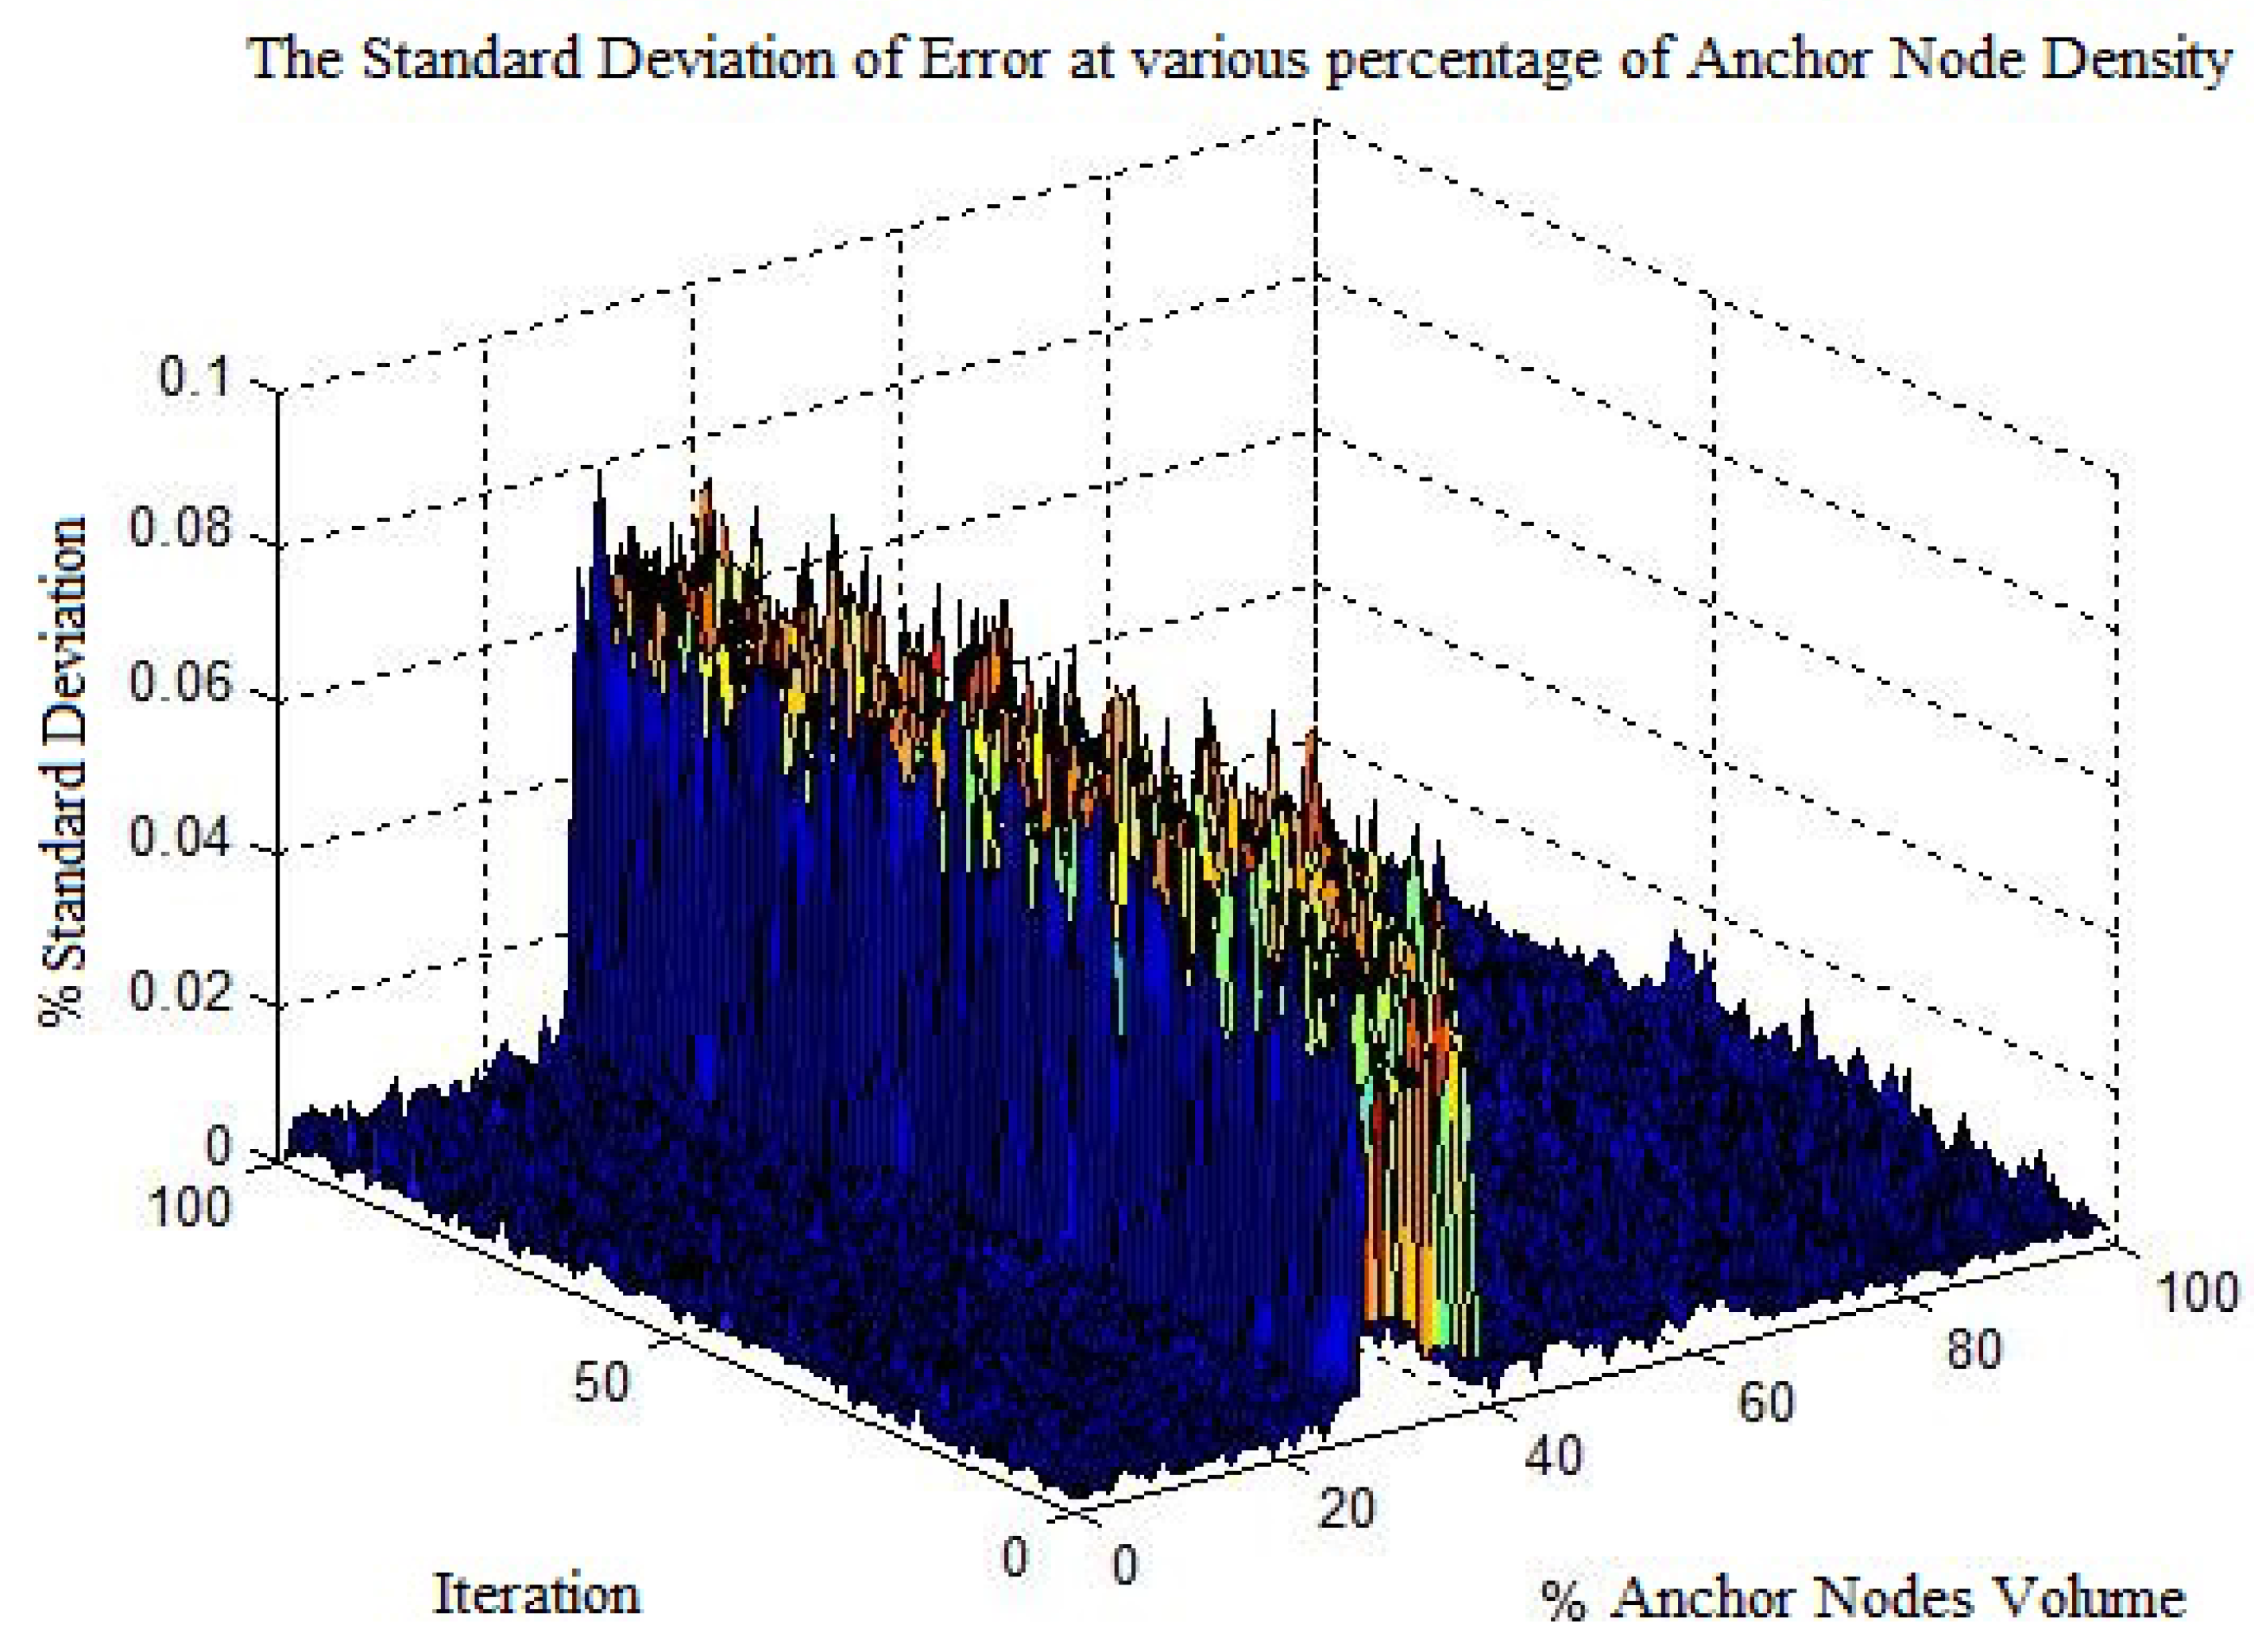
Figure 13.
Percentage maximum standard deviation with varying anchor node volume.
Figure 13.
Percentage maximum standard deviation with varying anchor node volume.
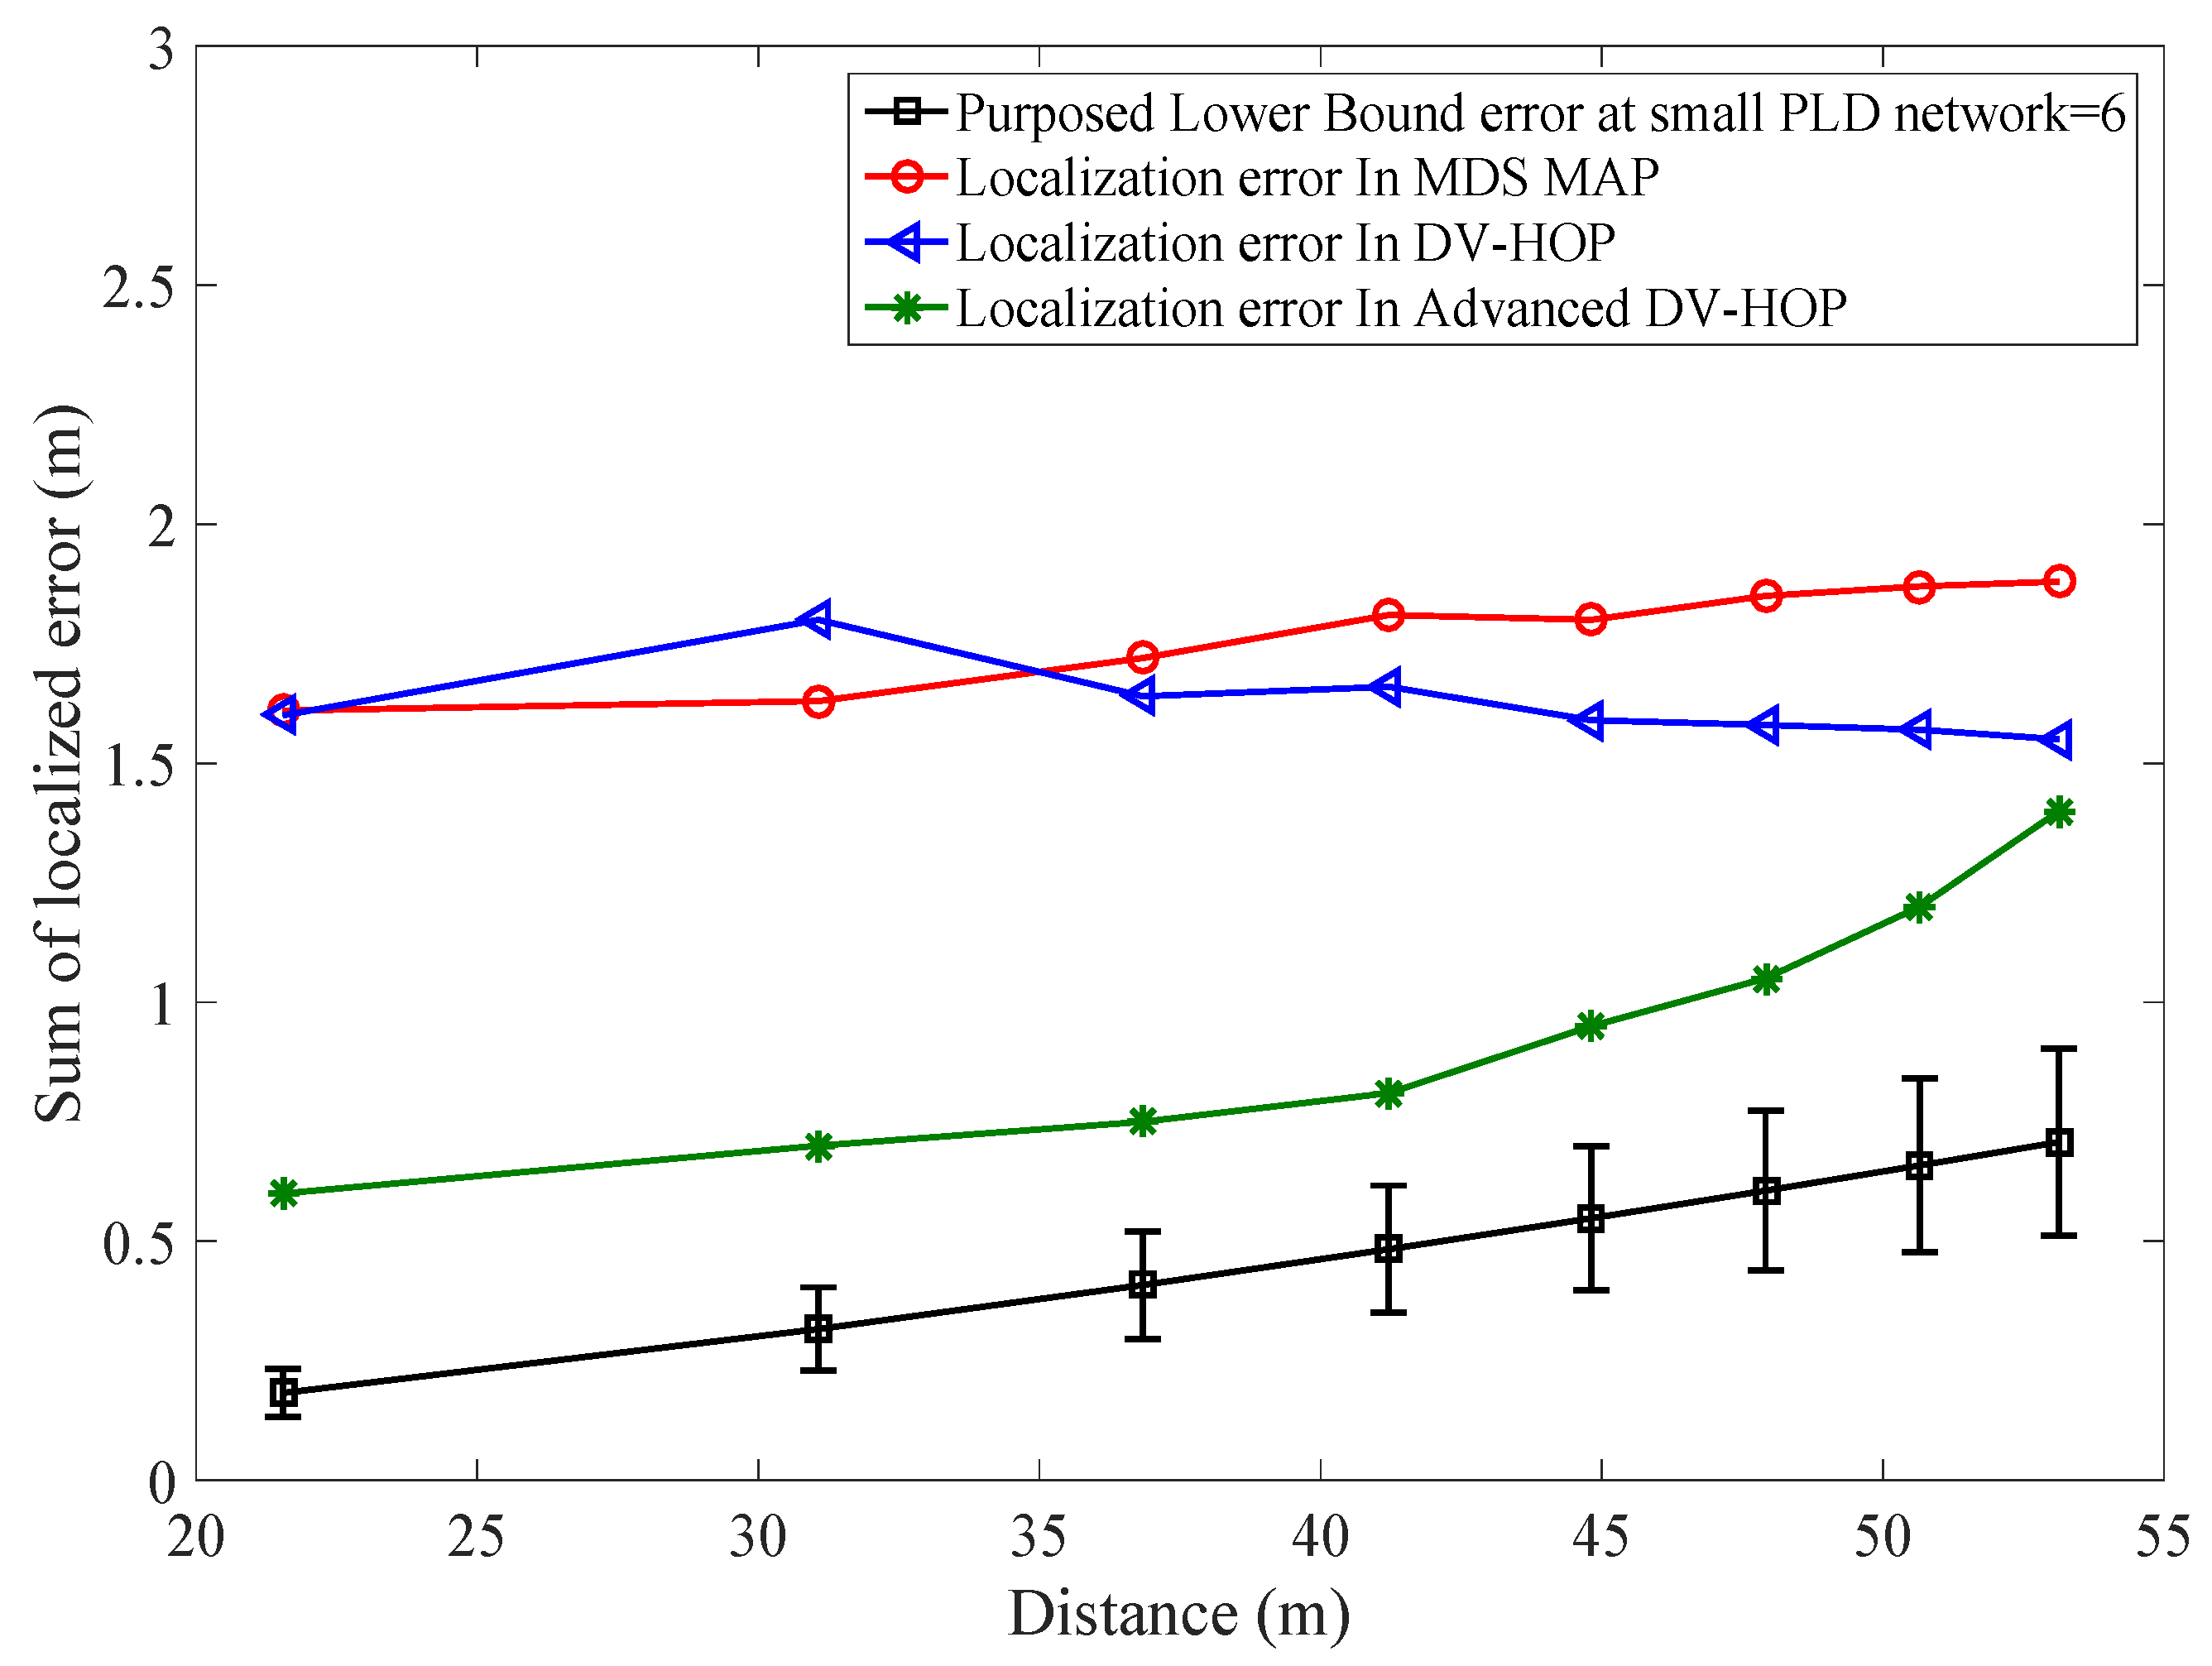
Figure 14.
Comparison of lower bounds PLD network error to existing systems.
Figure 14.
Comparison of lower bounds PLD network error to existing systems.
Figure 15.
Comparison of the average position error of PLD with DV-Hop at 20% anchor nodes.
Figure 15.
Comparison of the average position error of PLD with DV-Hop at 20% anchor nodes.
Figure 16.
Comparison of the average position error of PLD with DV-Hop at 25% anchor nodes.
Figure 16.
Comparison of the average position error of PLD with DV-Hop at 25% anchor nodes.
Figure 17.
Comparison of the average position error of PLD with DV-Hop at 30% anchor nodes.
Figure 17.
Comparison of the average position error of PLD with DV-Hop at 30% anchor nodes.
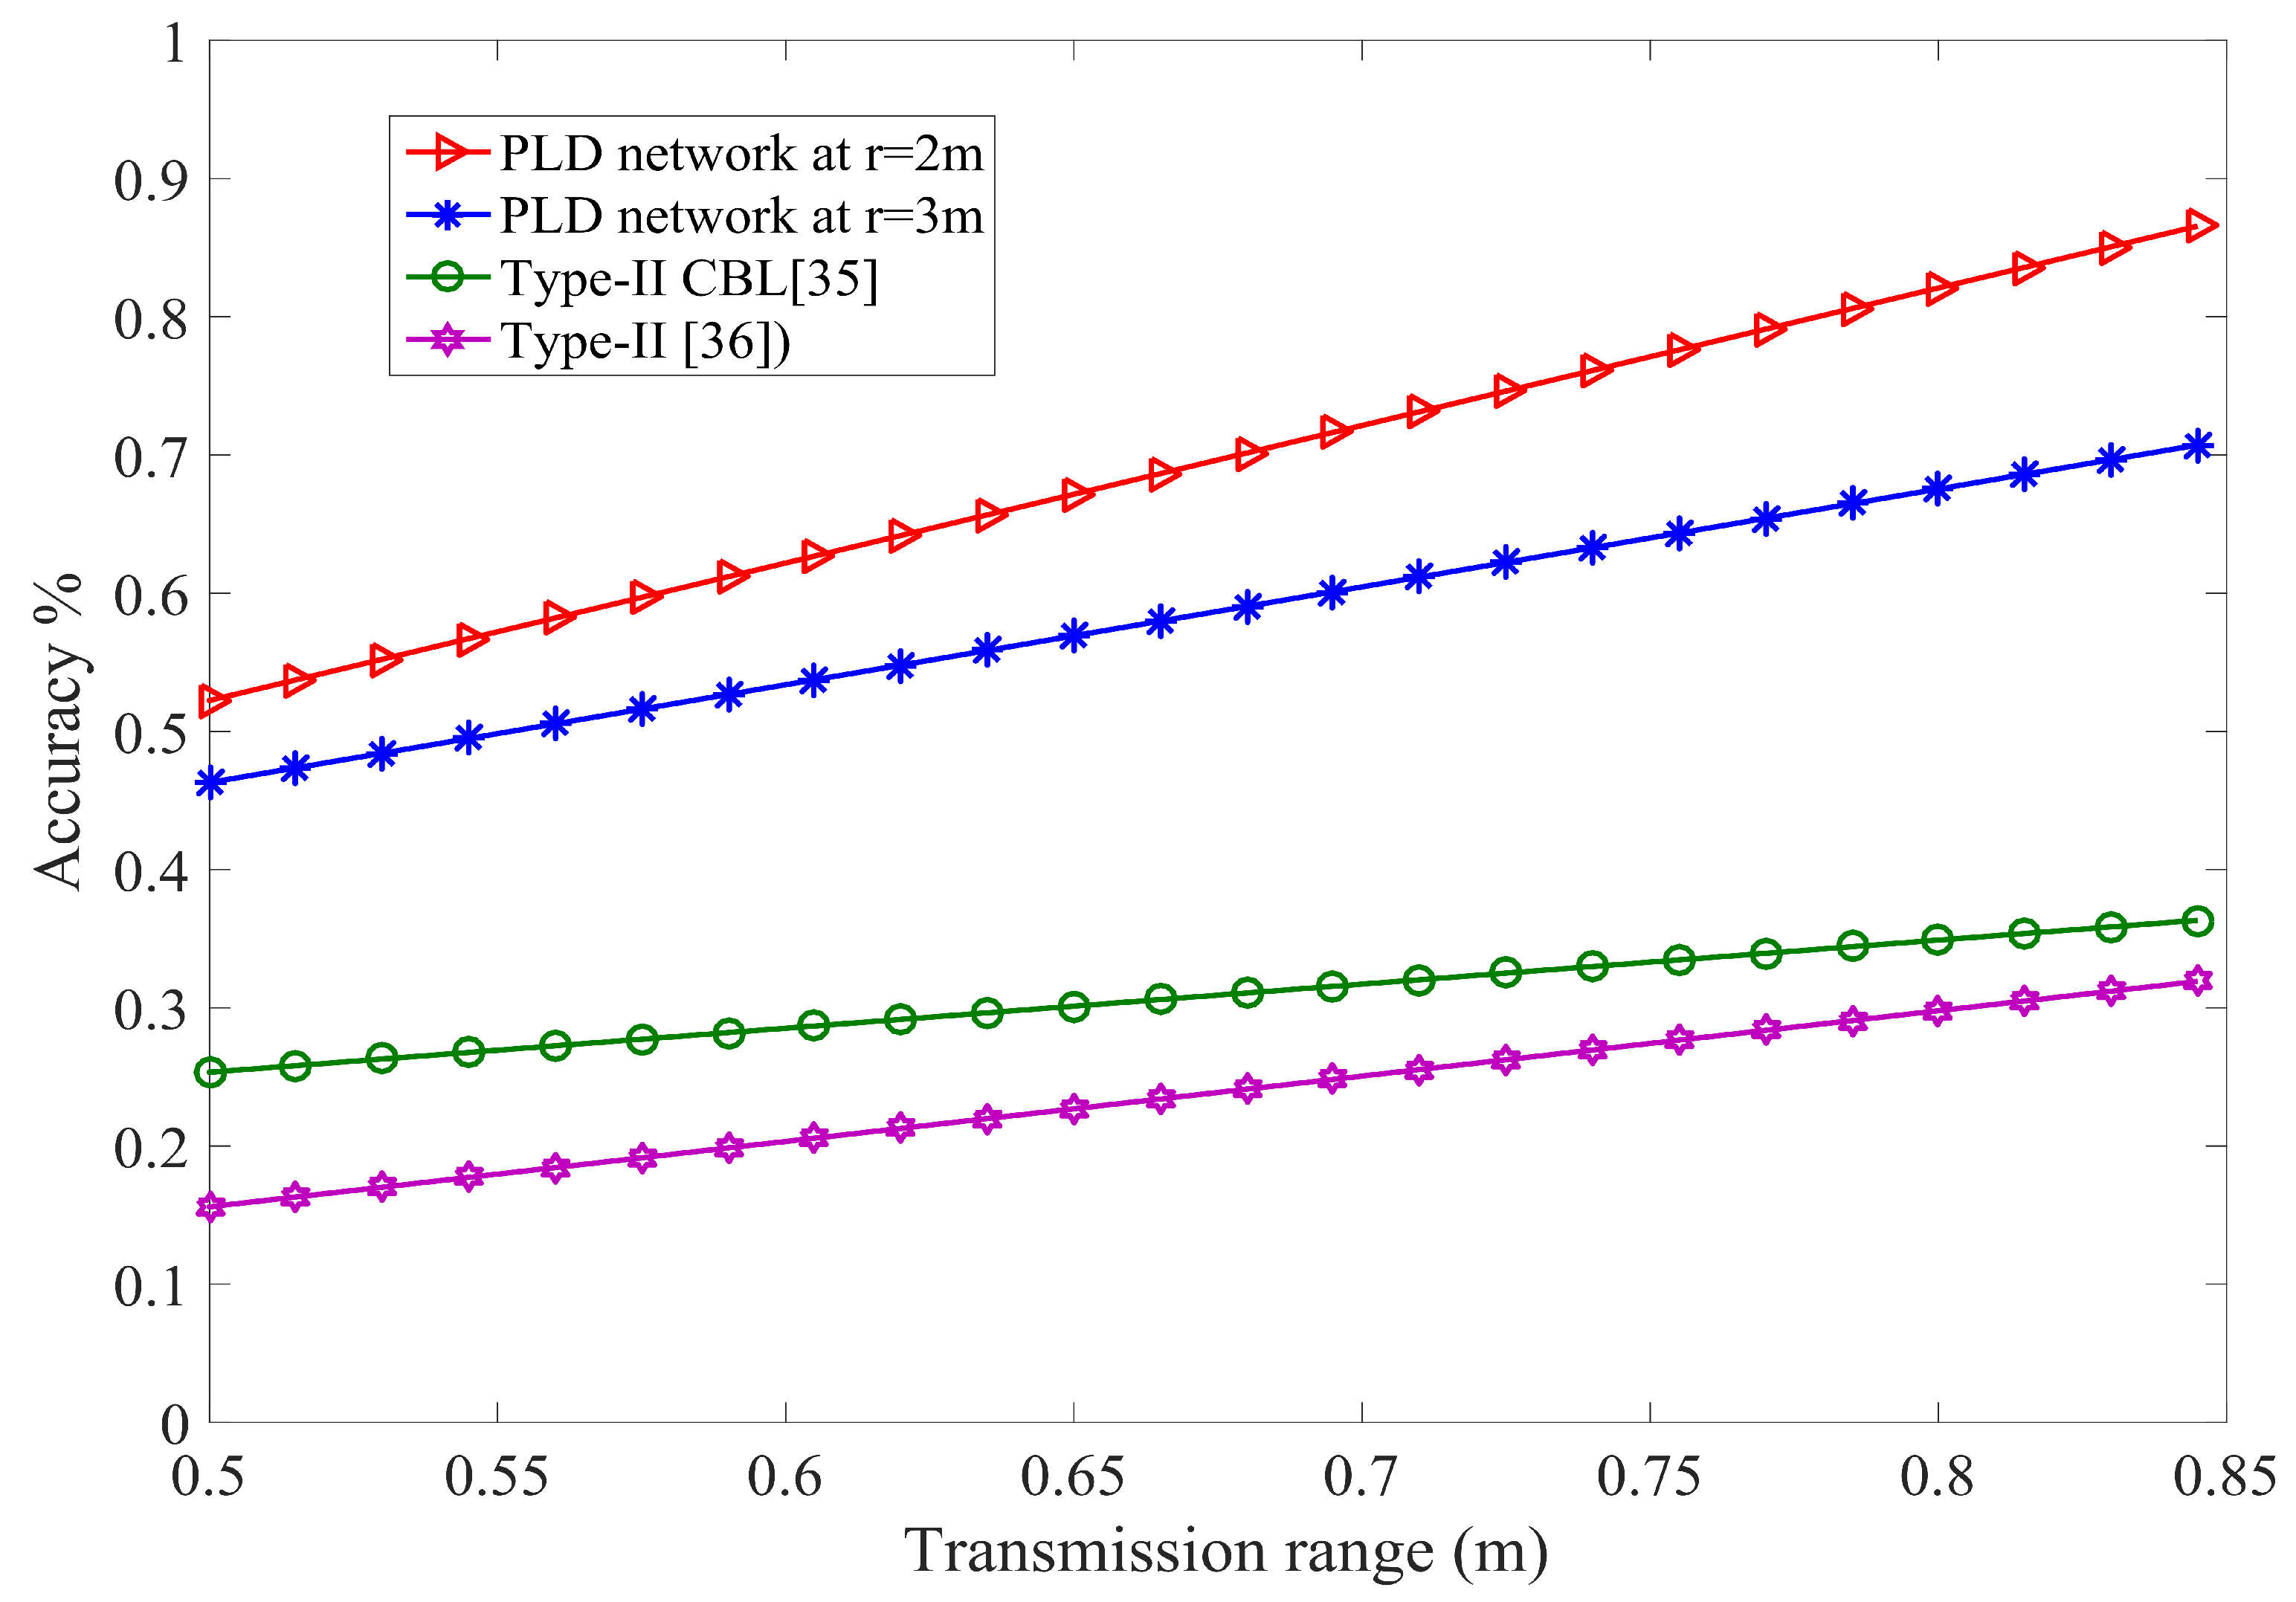
Figure 18.
Impact of transmission range and localization accuracy of PLD with different network size.
Figure 18.
Impact of transmission range and localization accuracy of PLD with different network size.
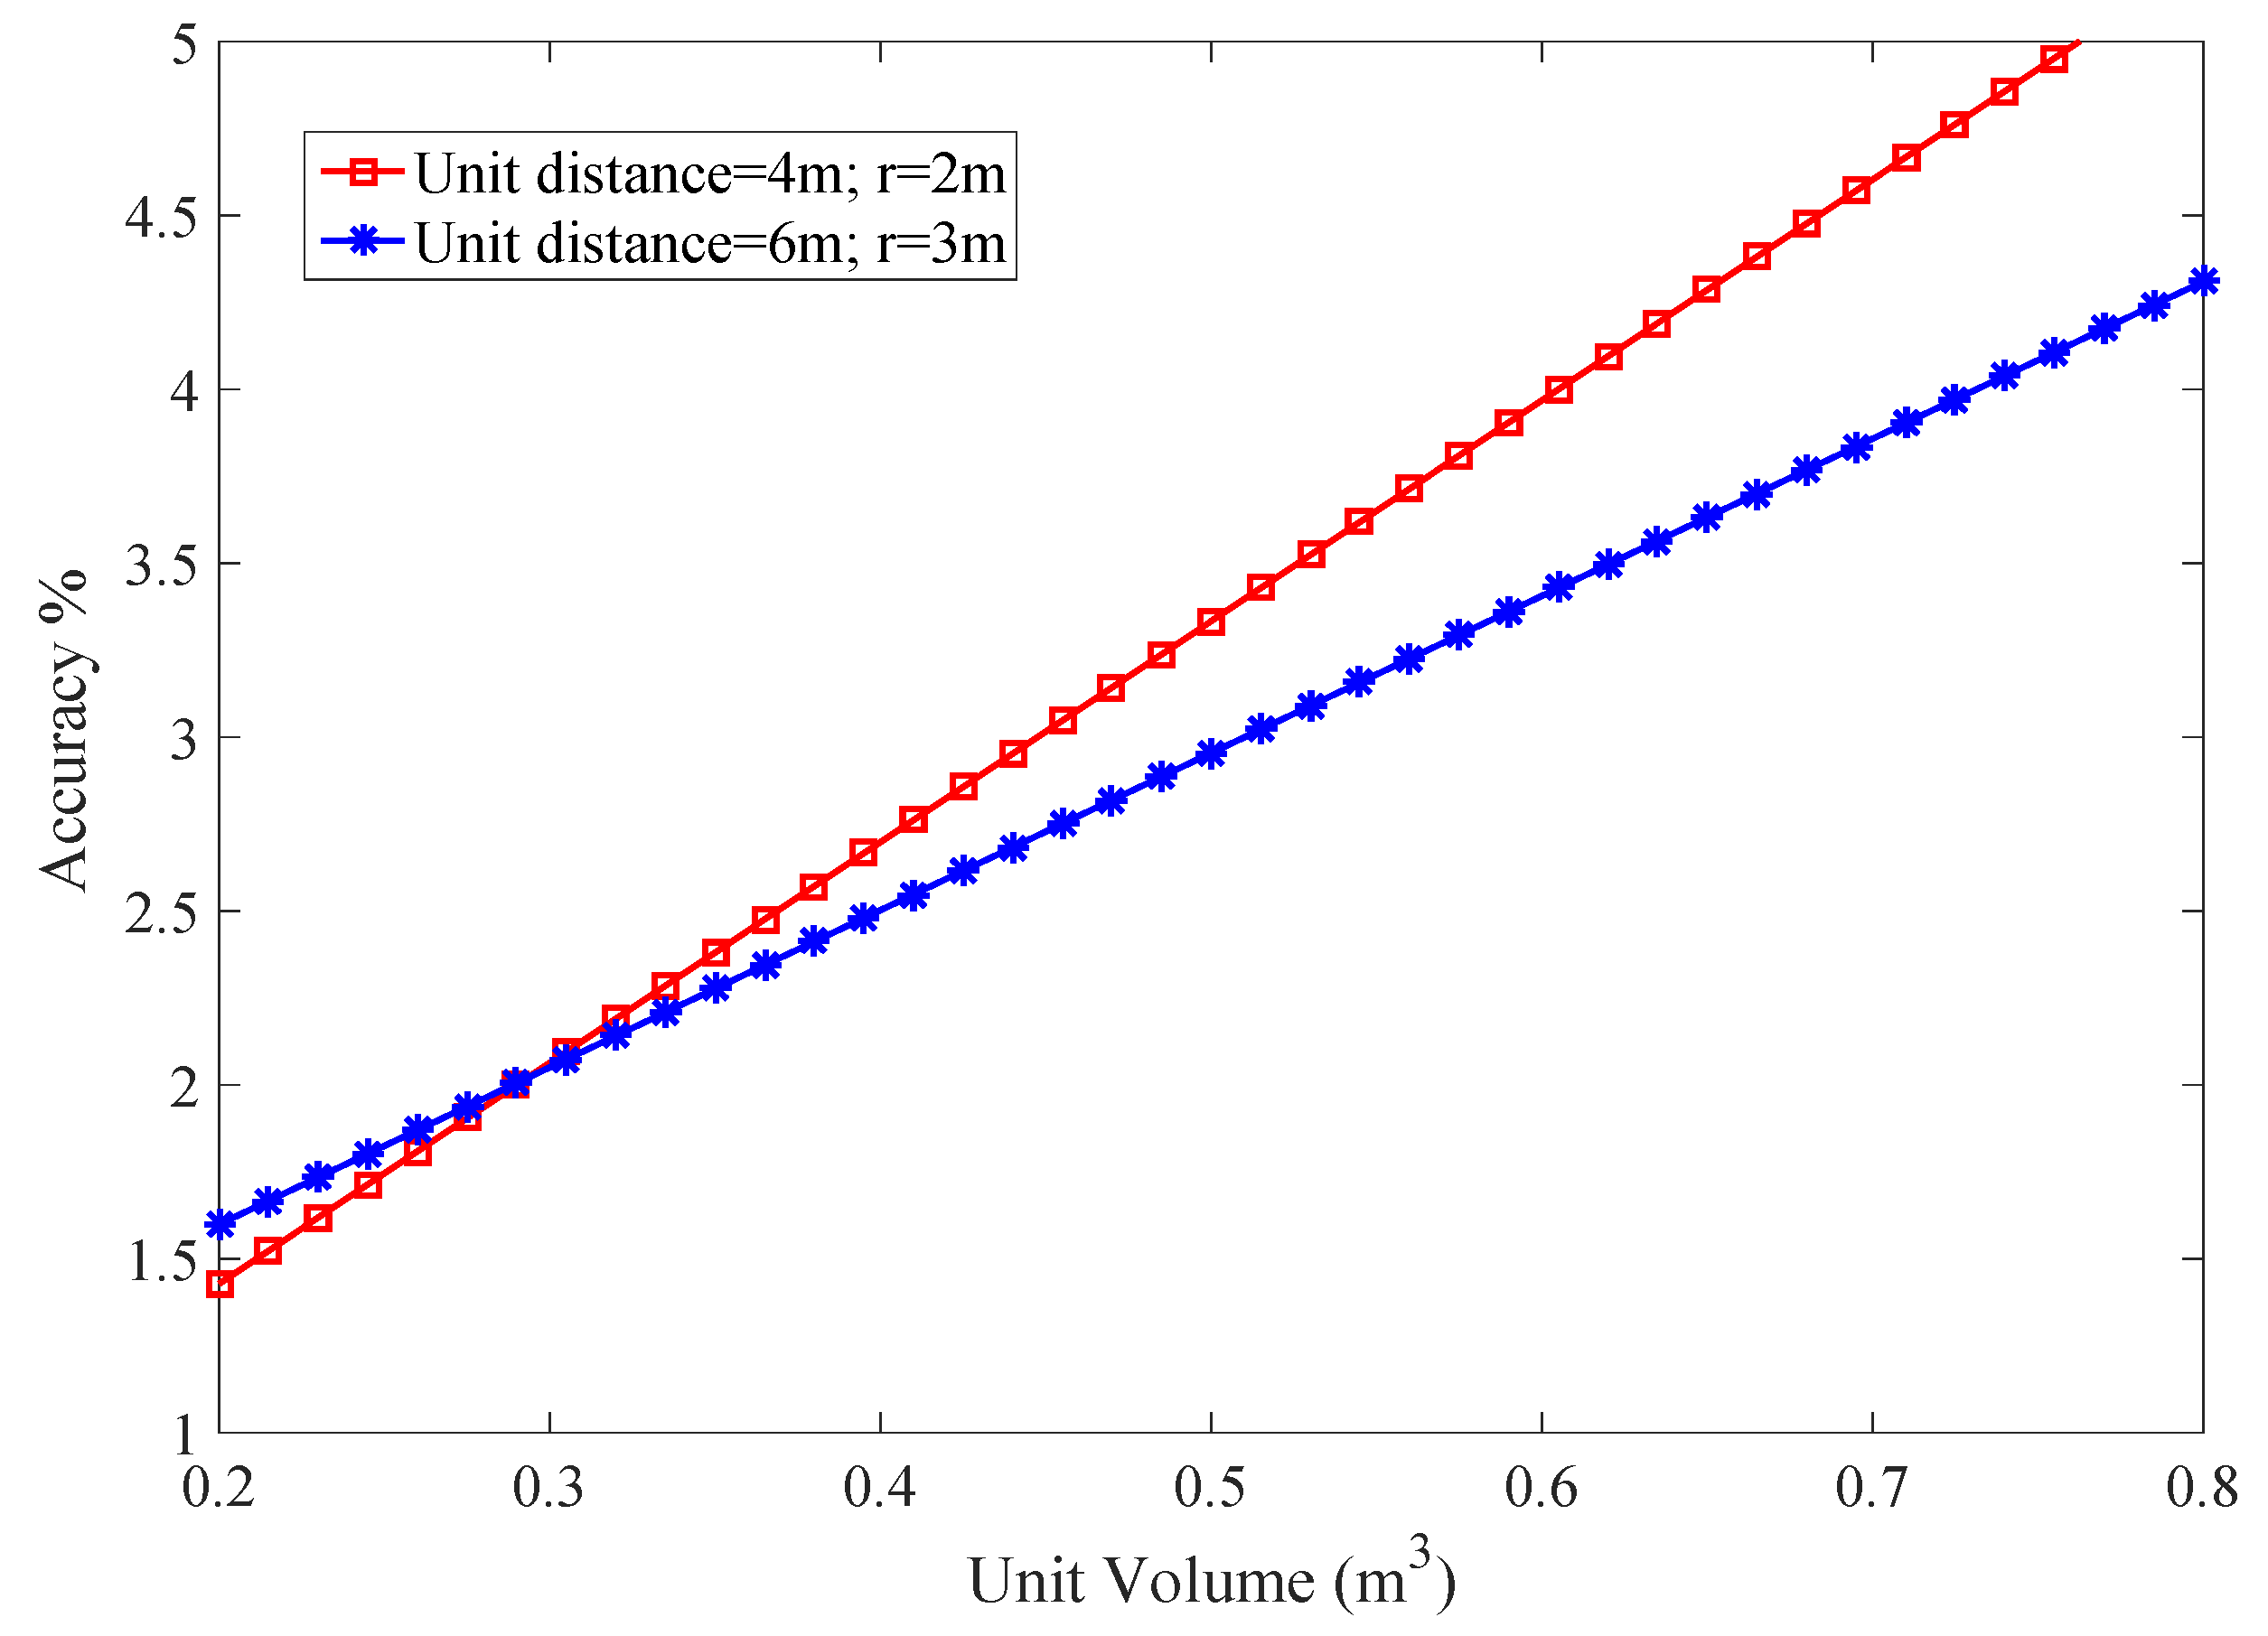
Figure 19.
Accuracy of PLD network with different volume of PLD network.
Figure 19.
Accuracy of PLD network with different volume of PLD network.
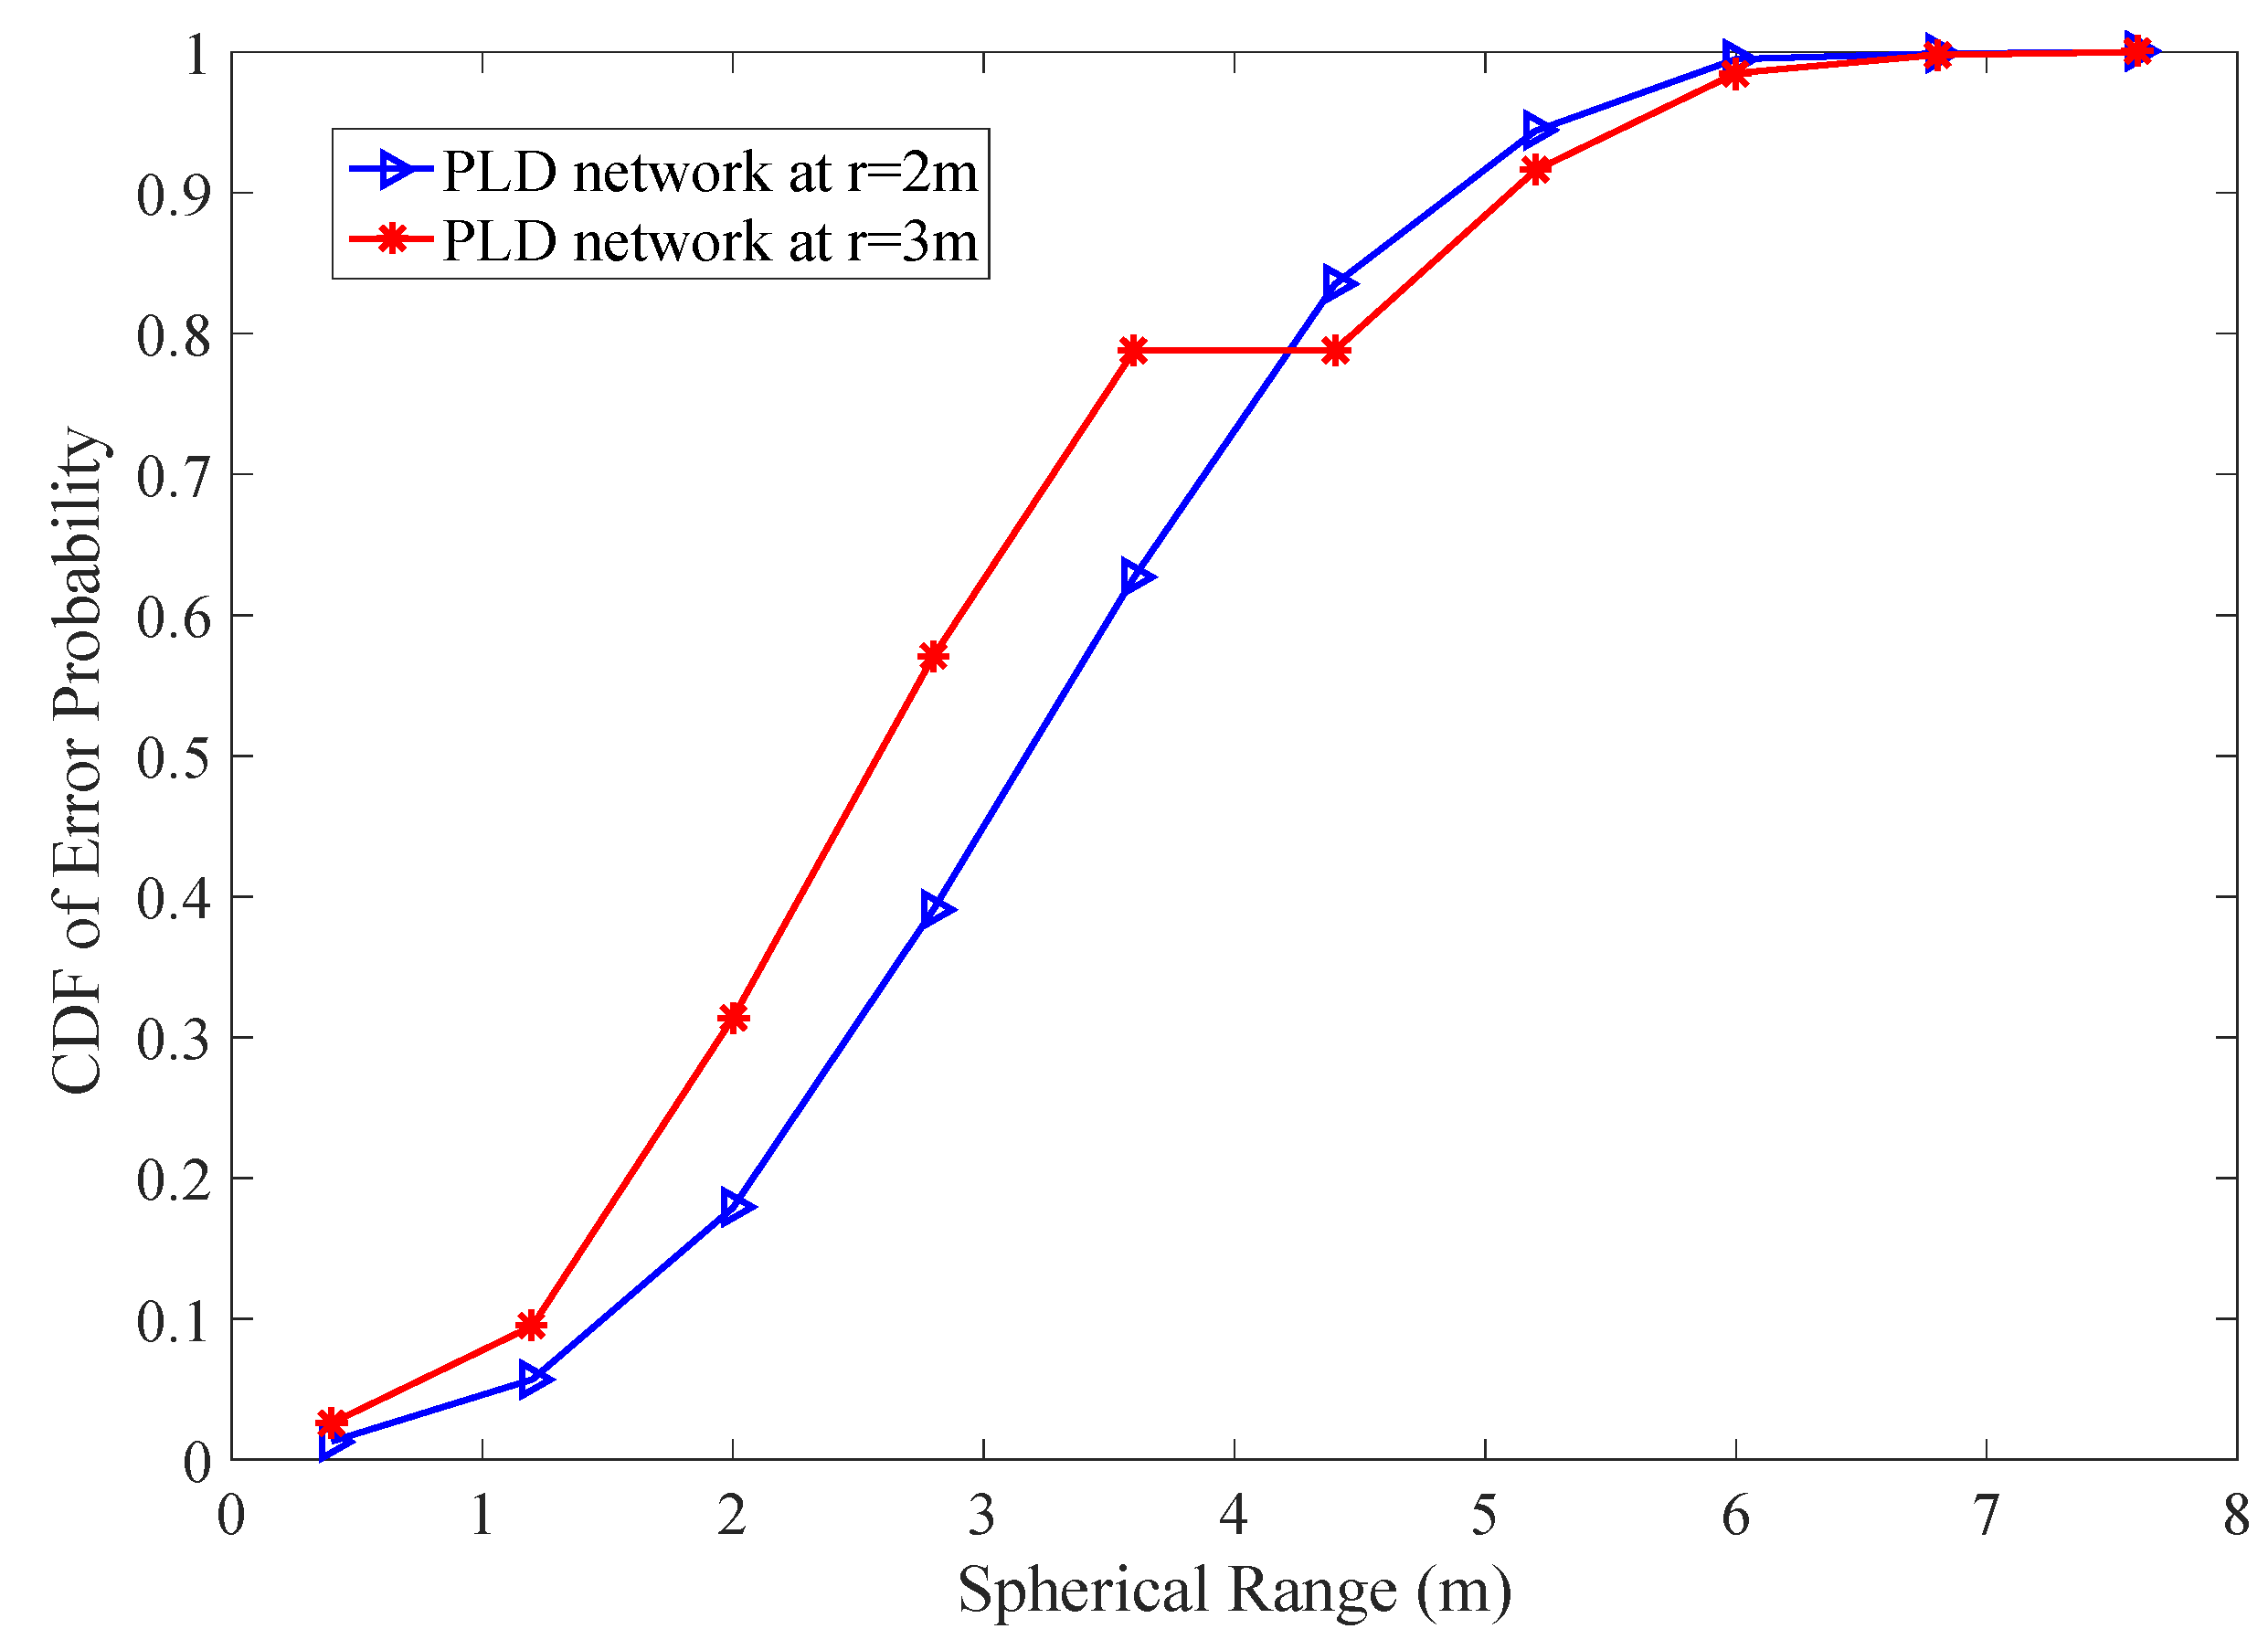
Figure 20.
Cumulative error probability in PLD network with m and m.
Figure 20.
Cumulative error probability in PLD network with m and m.
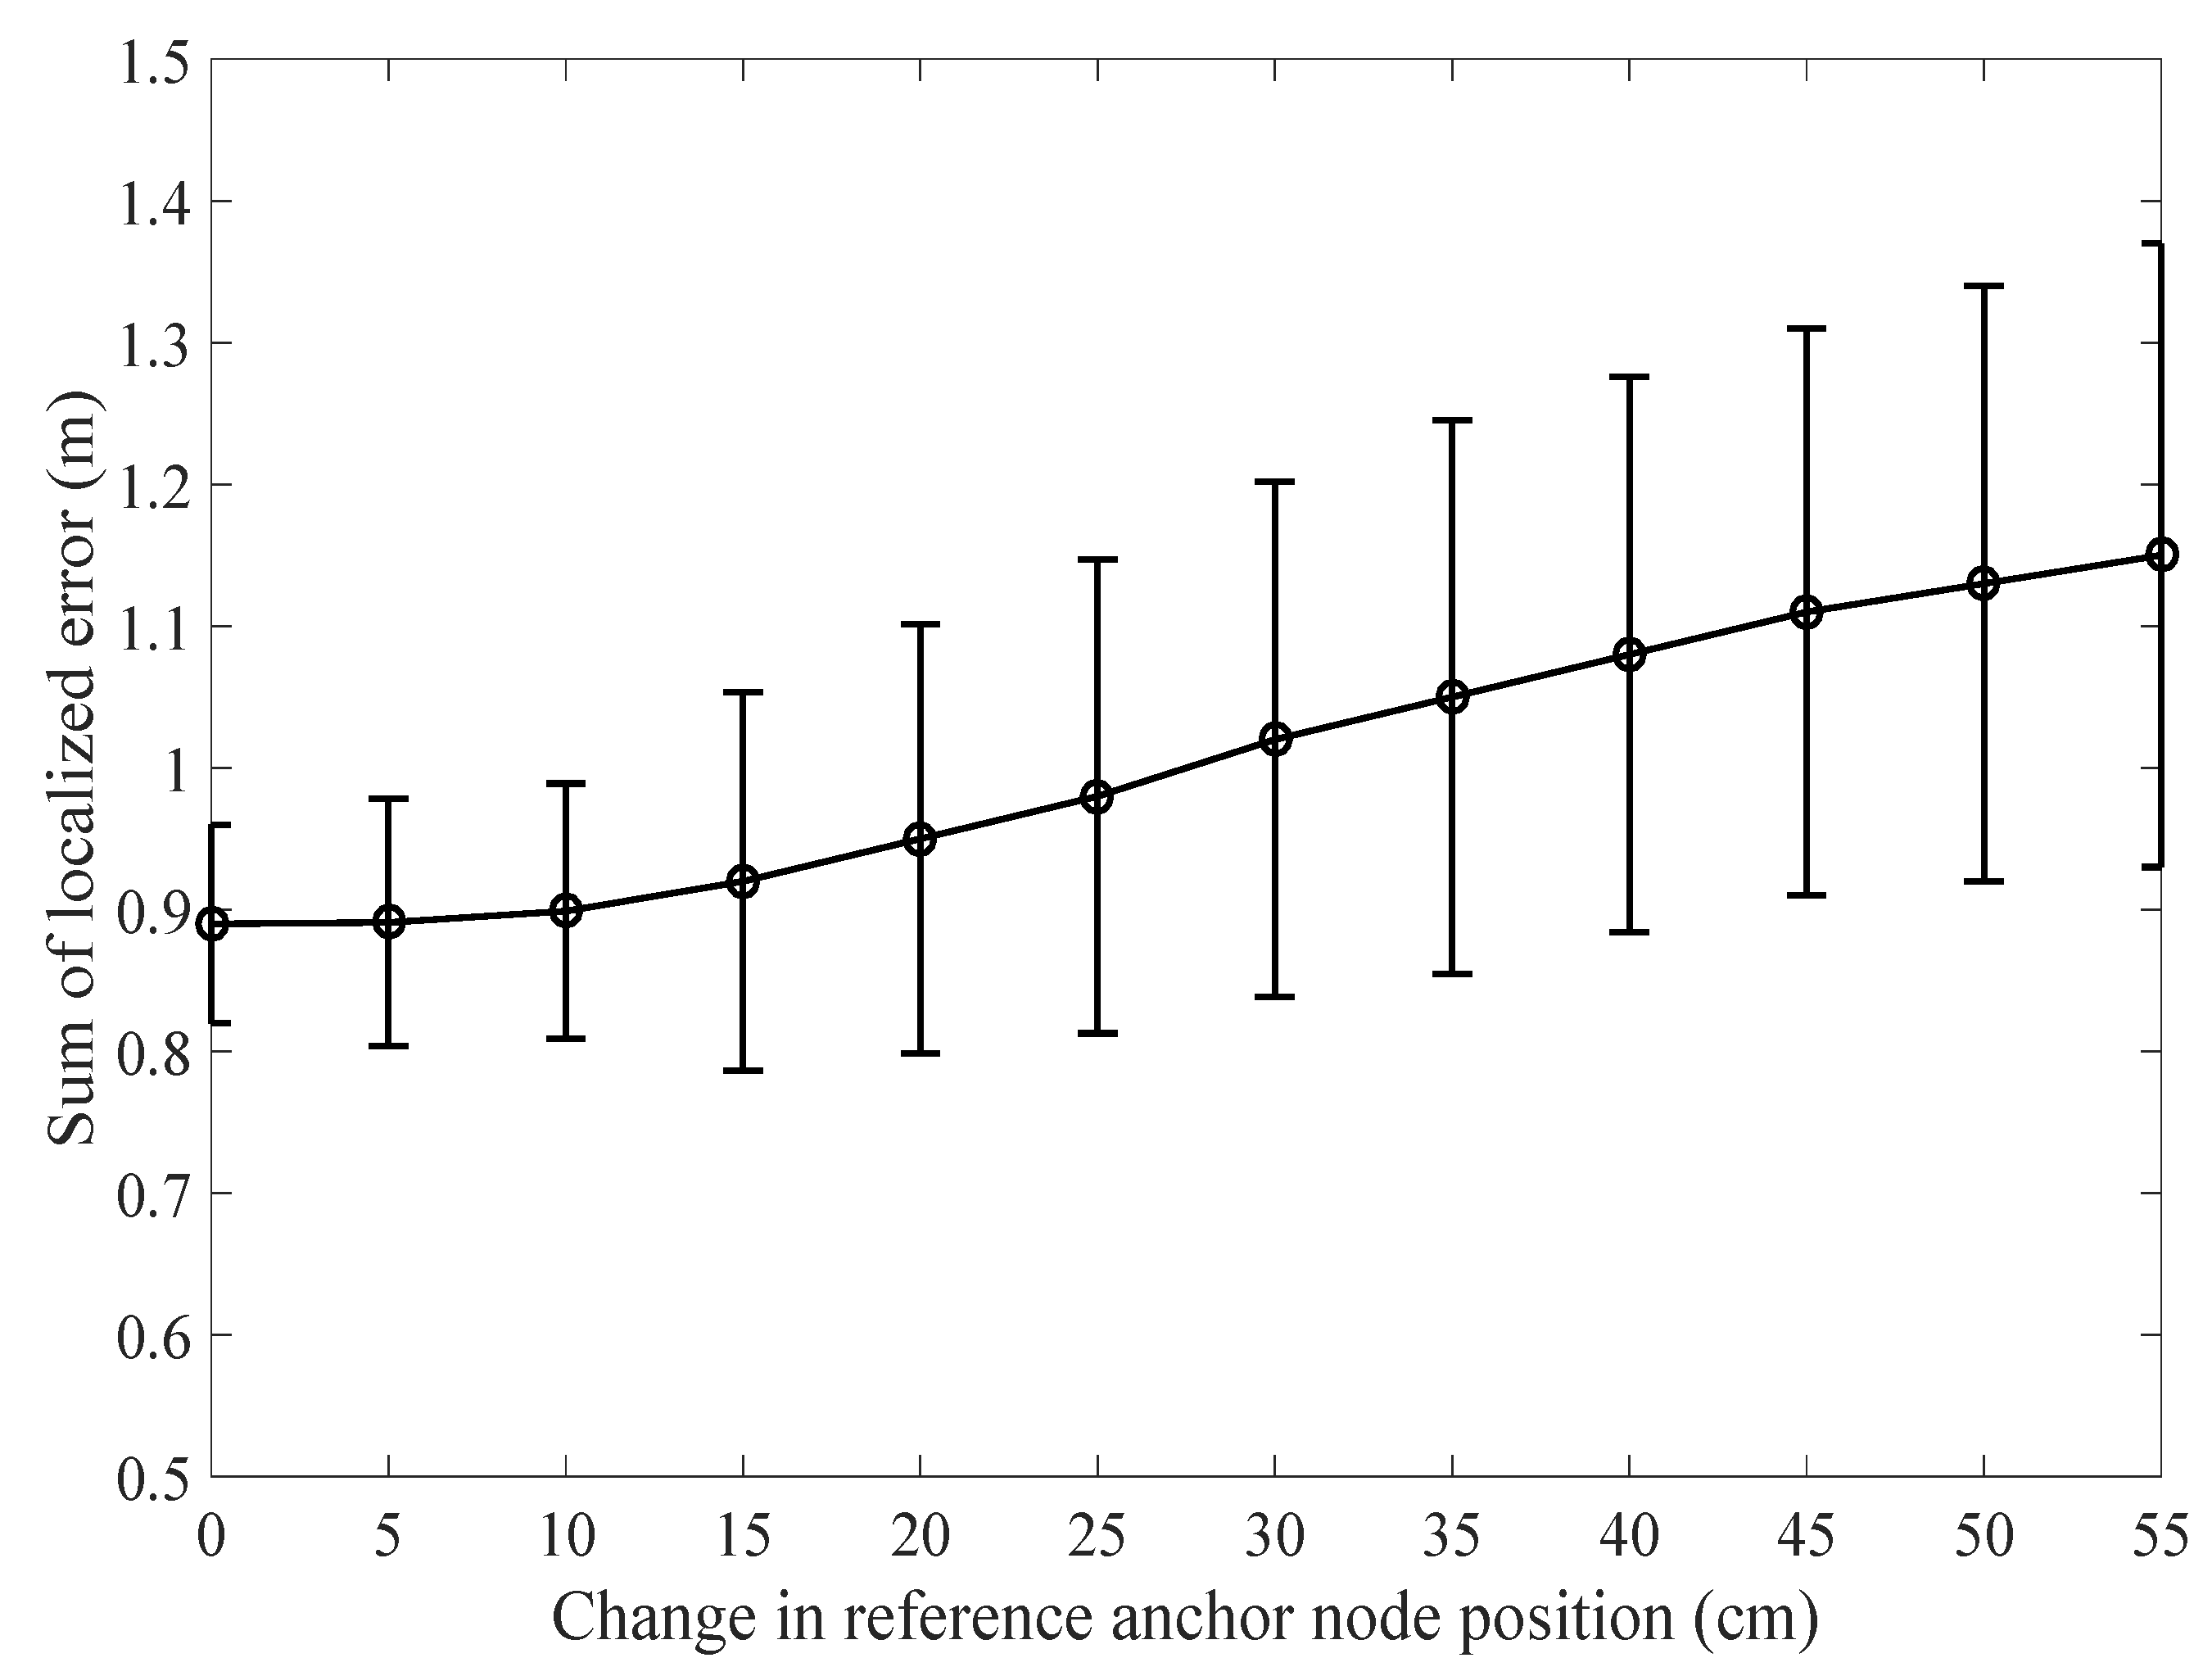
Figure 21.
Influence of reference anchor node position vs localization error.
Figure 21.
Influence of reference anchor node position vs localization error.
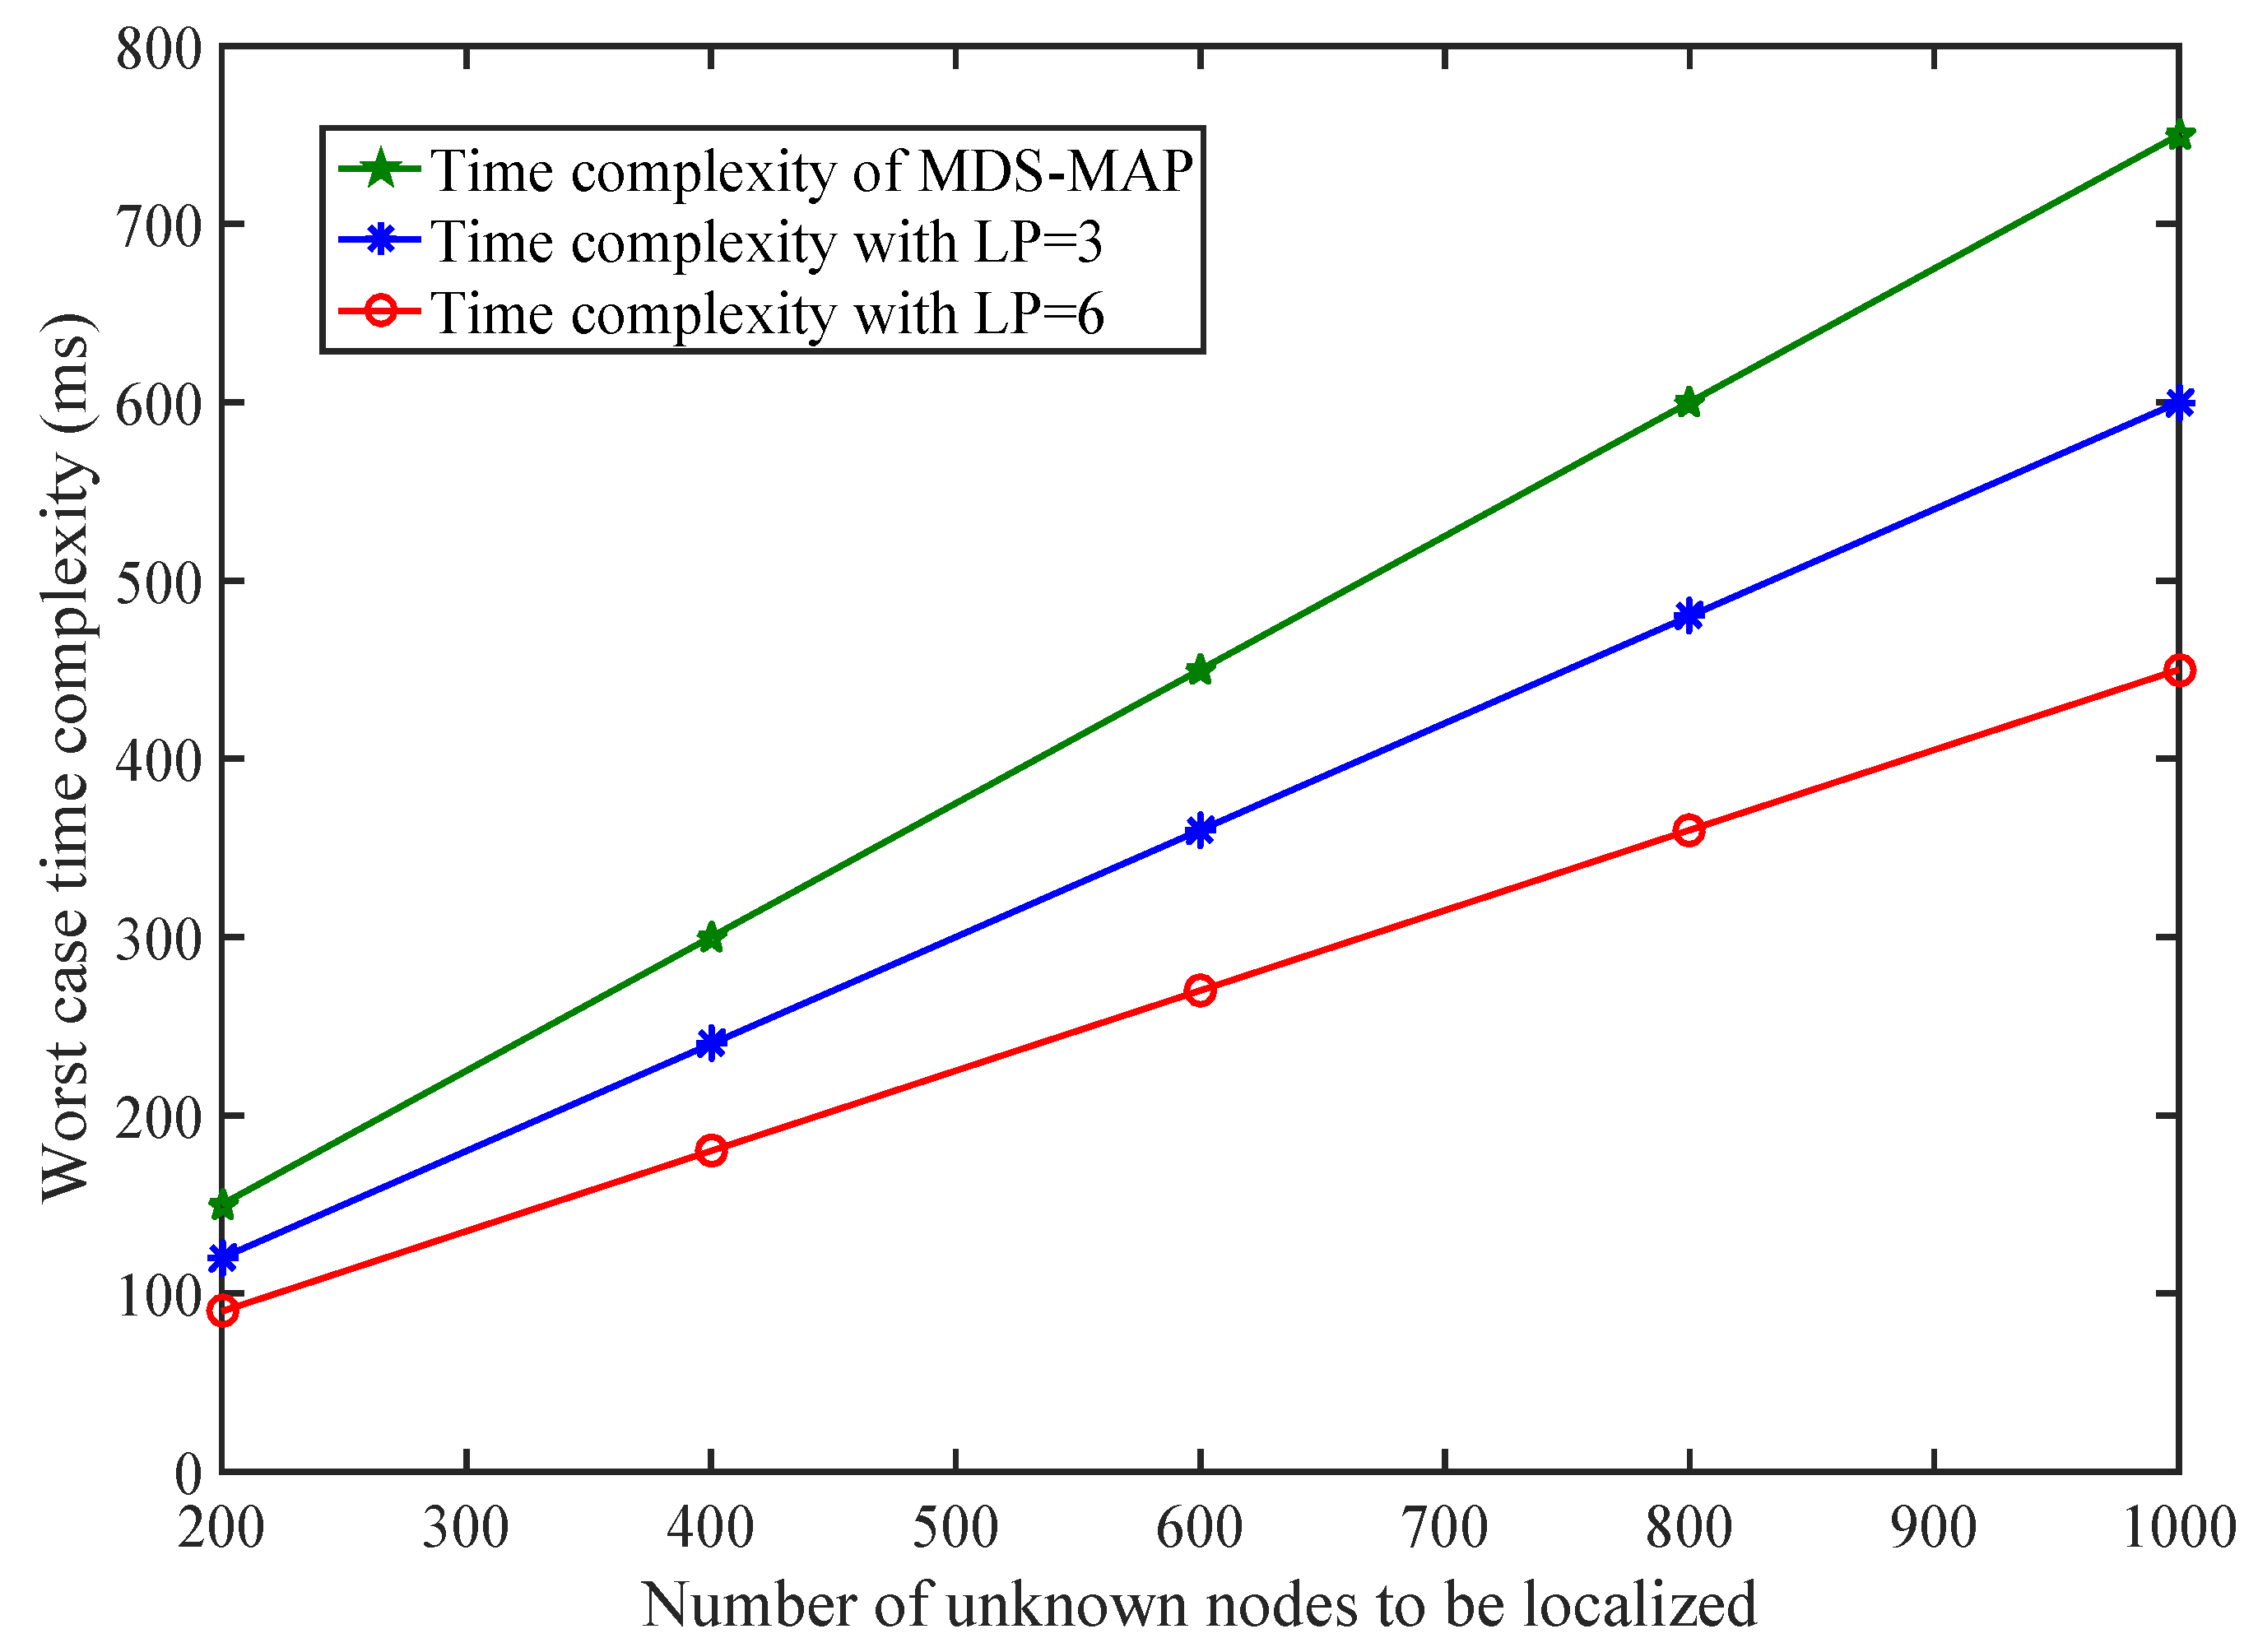
Figure 22.
Complexity comparison between PLD and multi-dimensional scaling (MDS)-MAP.
Figure 22.
Complexity comparison between PLD and multi-dimensional scaling (MDS)-MAP.
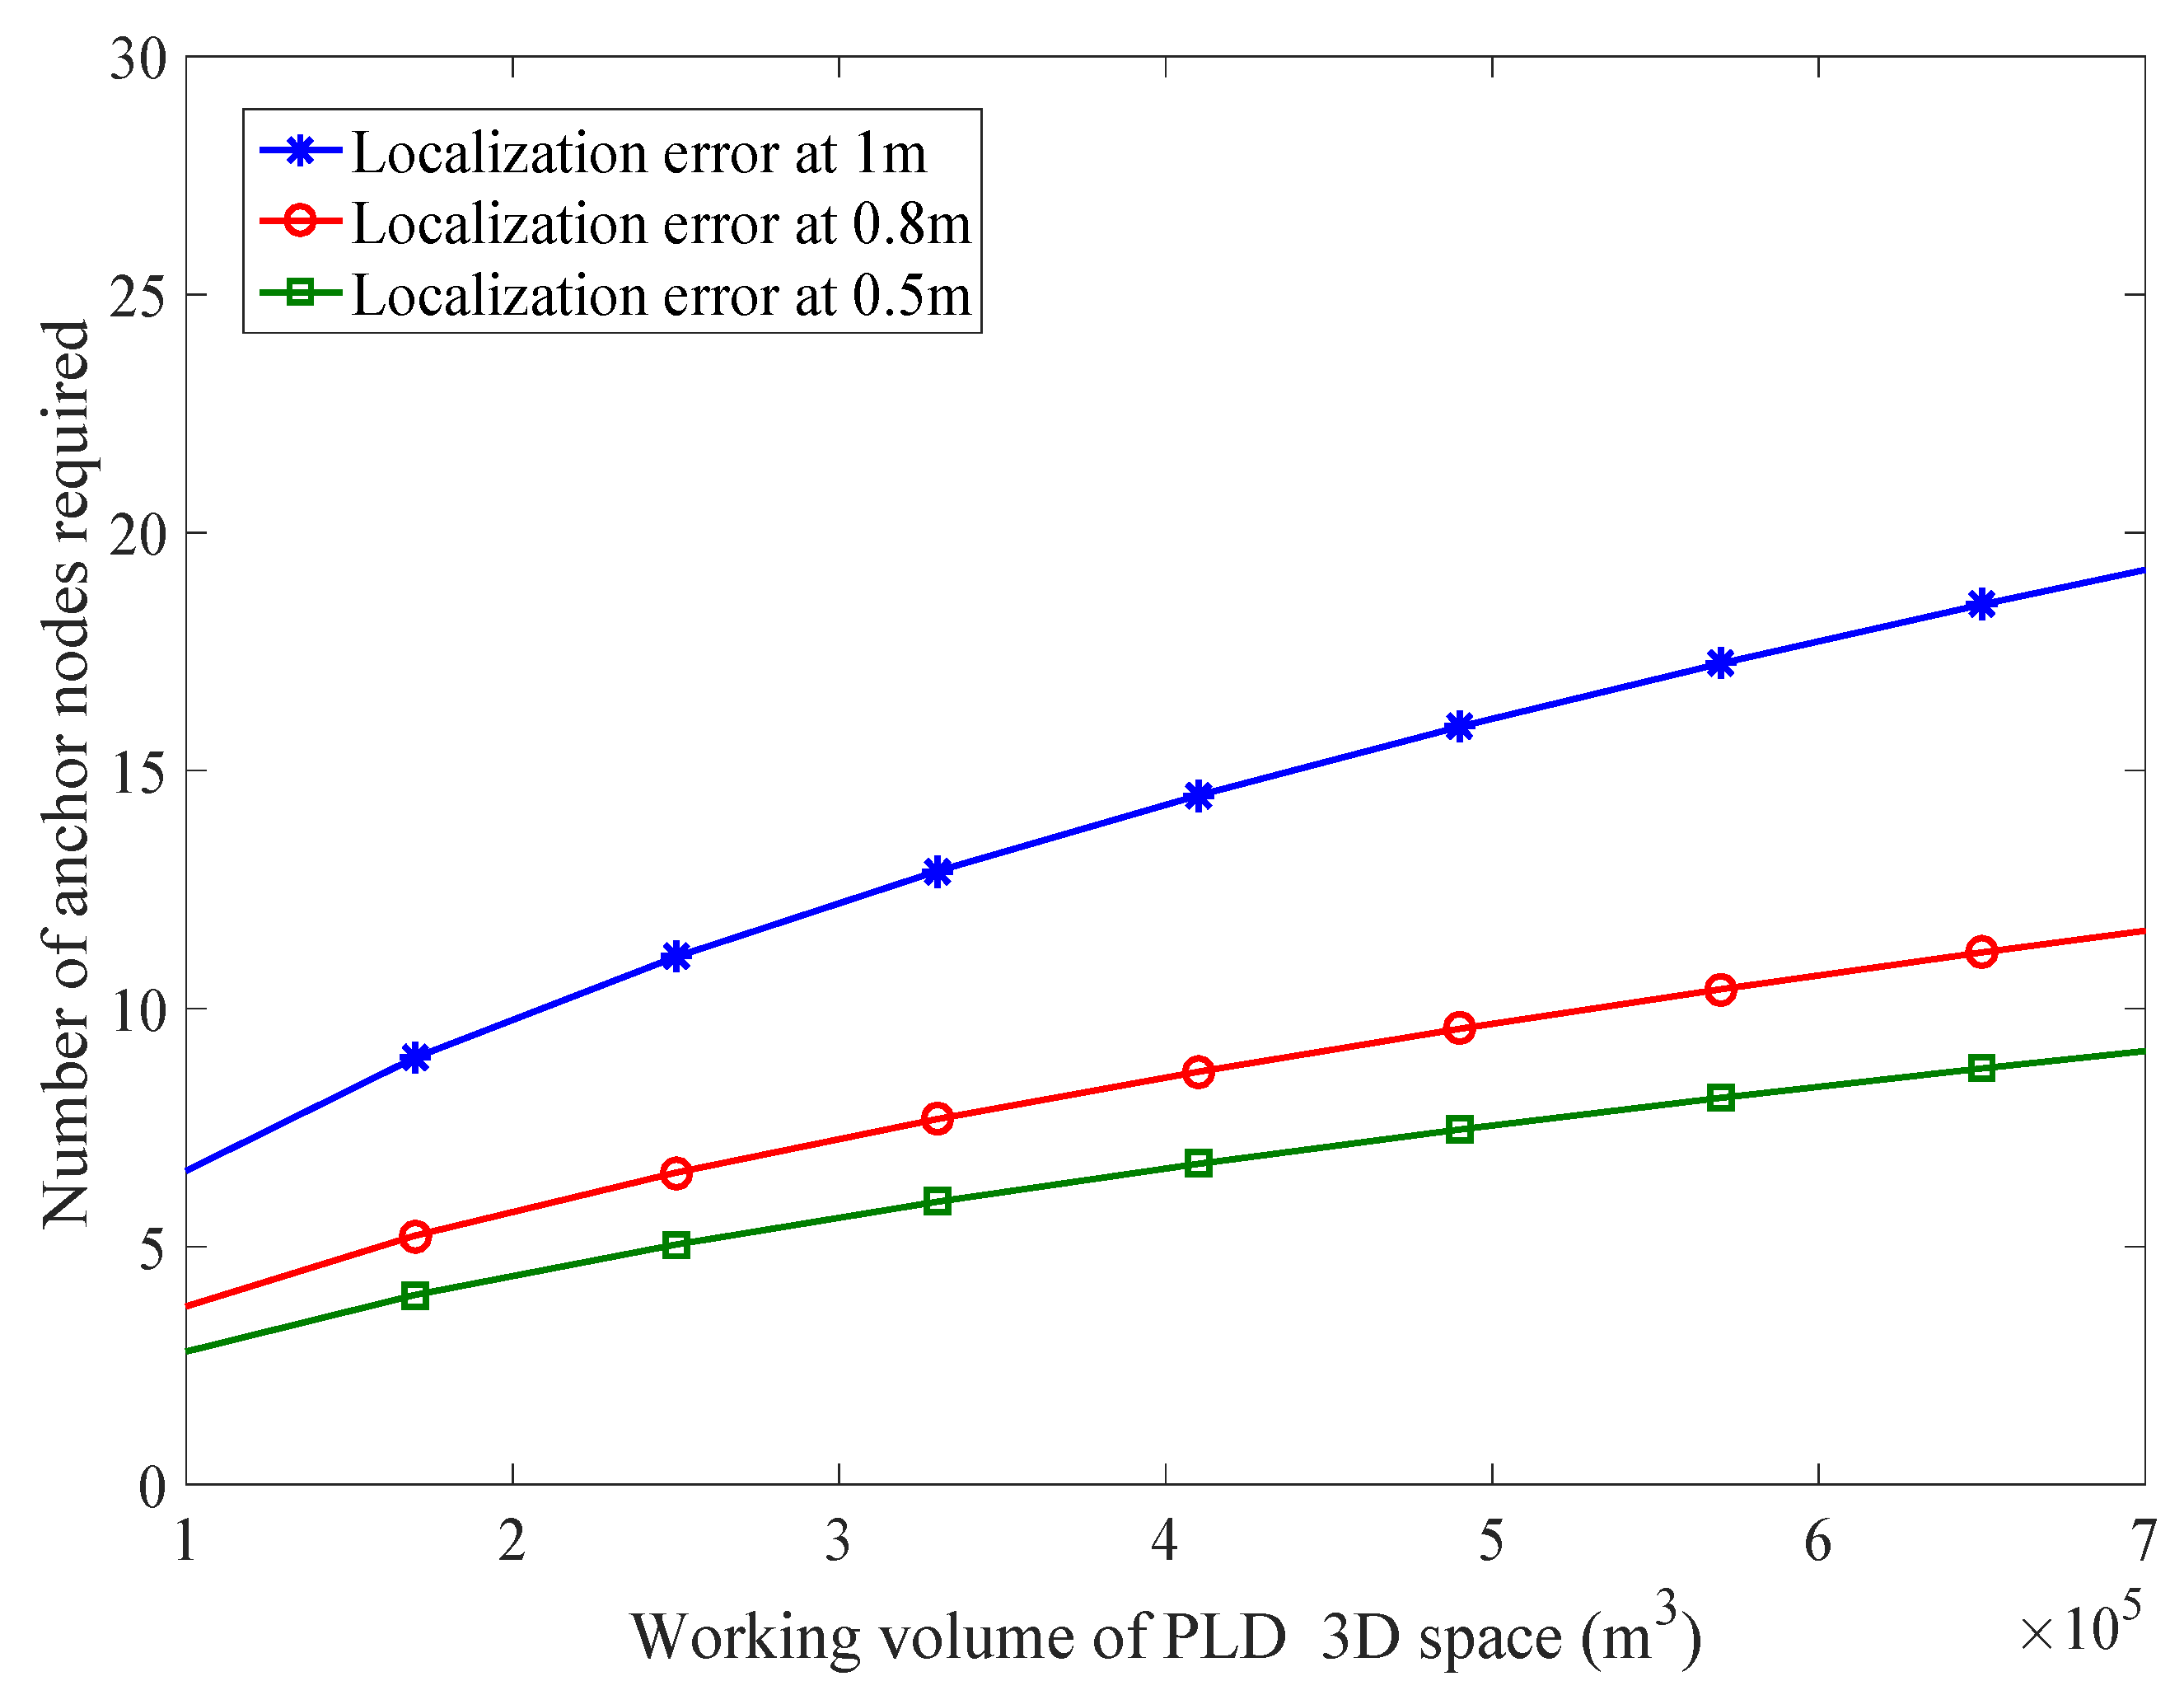
Figure 23.
Number of anchor nodes required and their corresponding lower bounds.
Figure 23.
Number of anchor nodes required and their corresponding lower bounds.
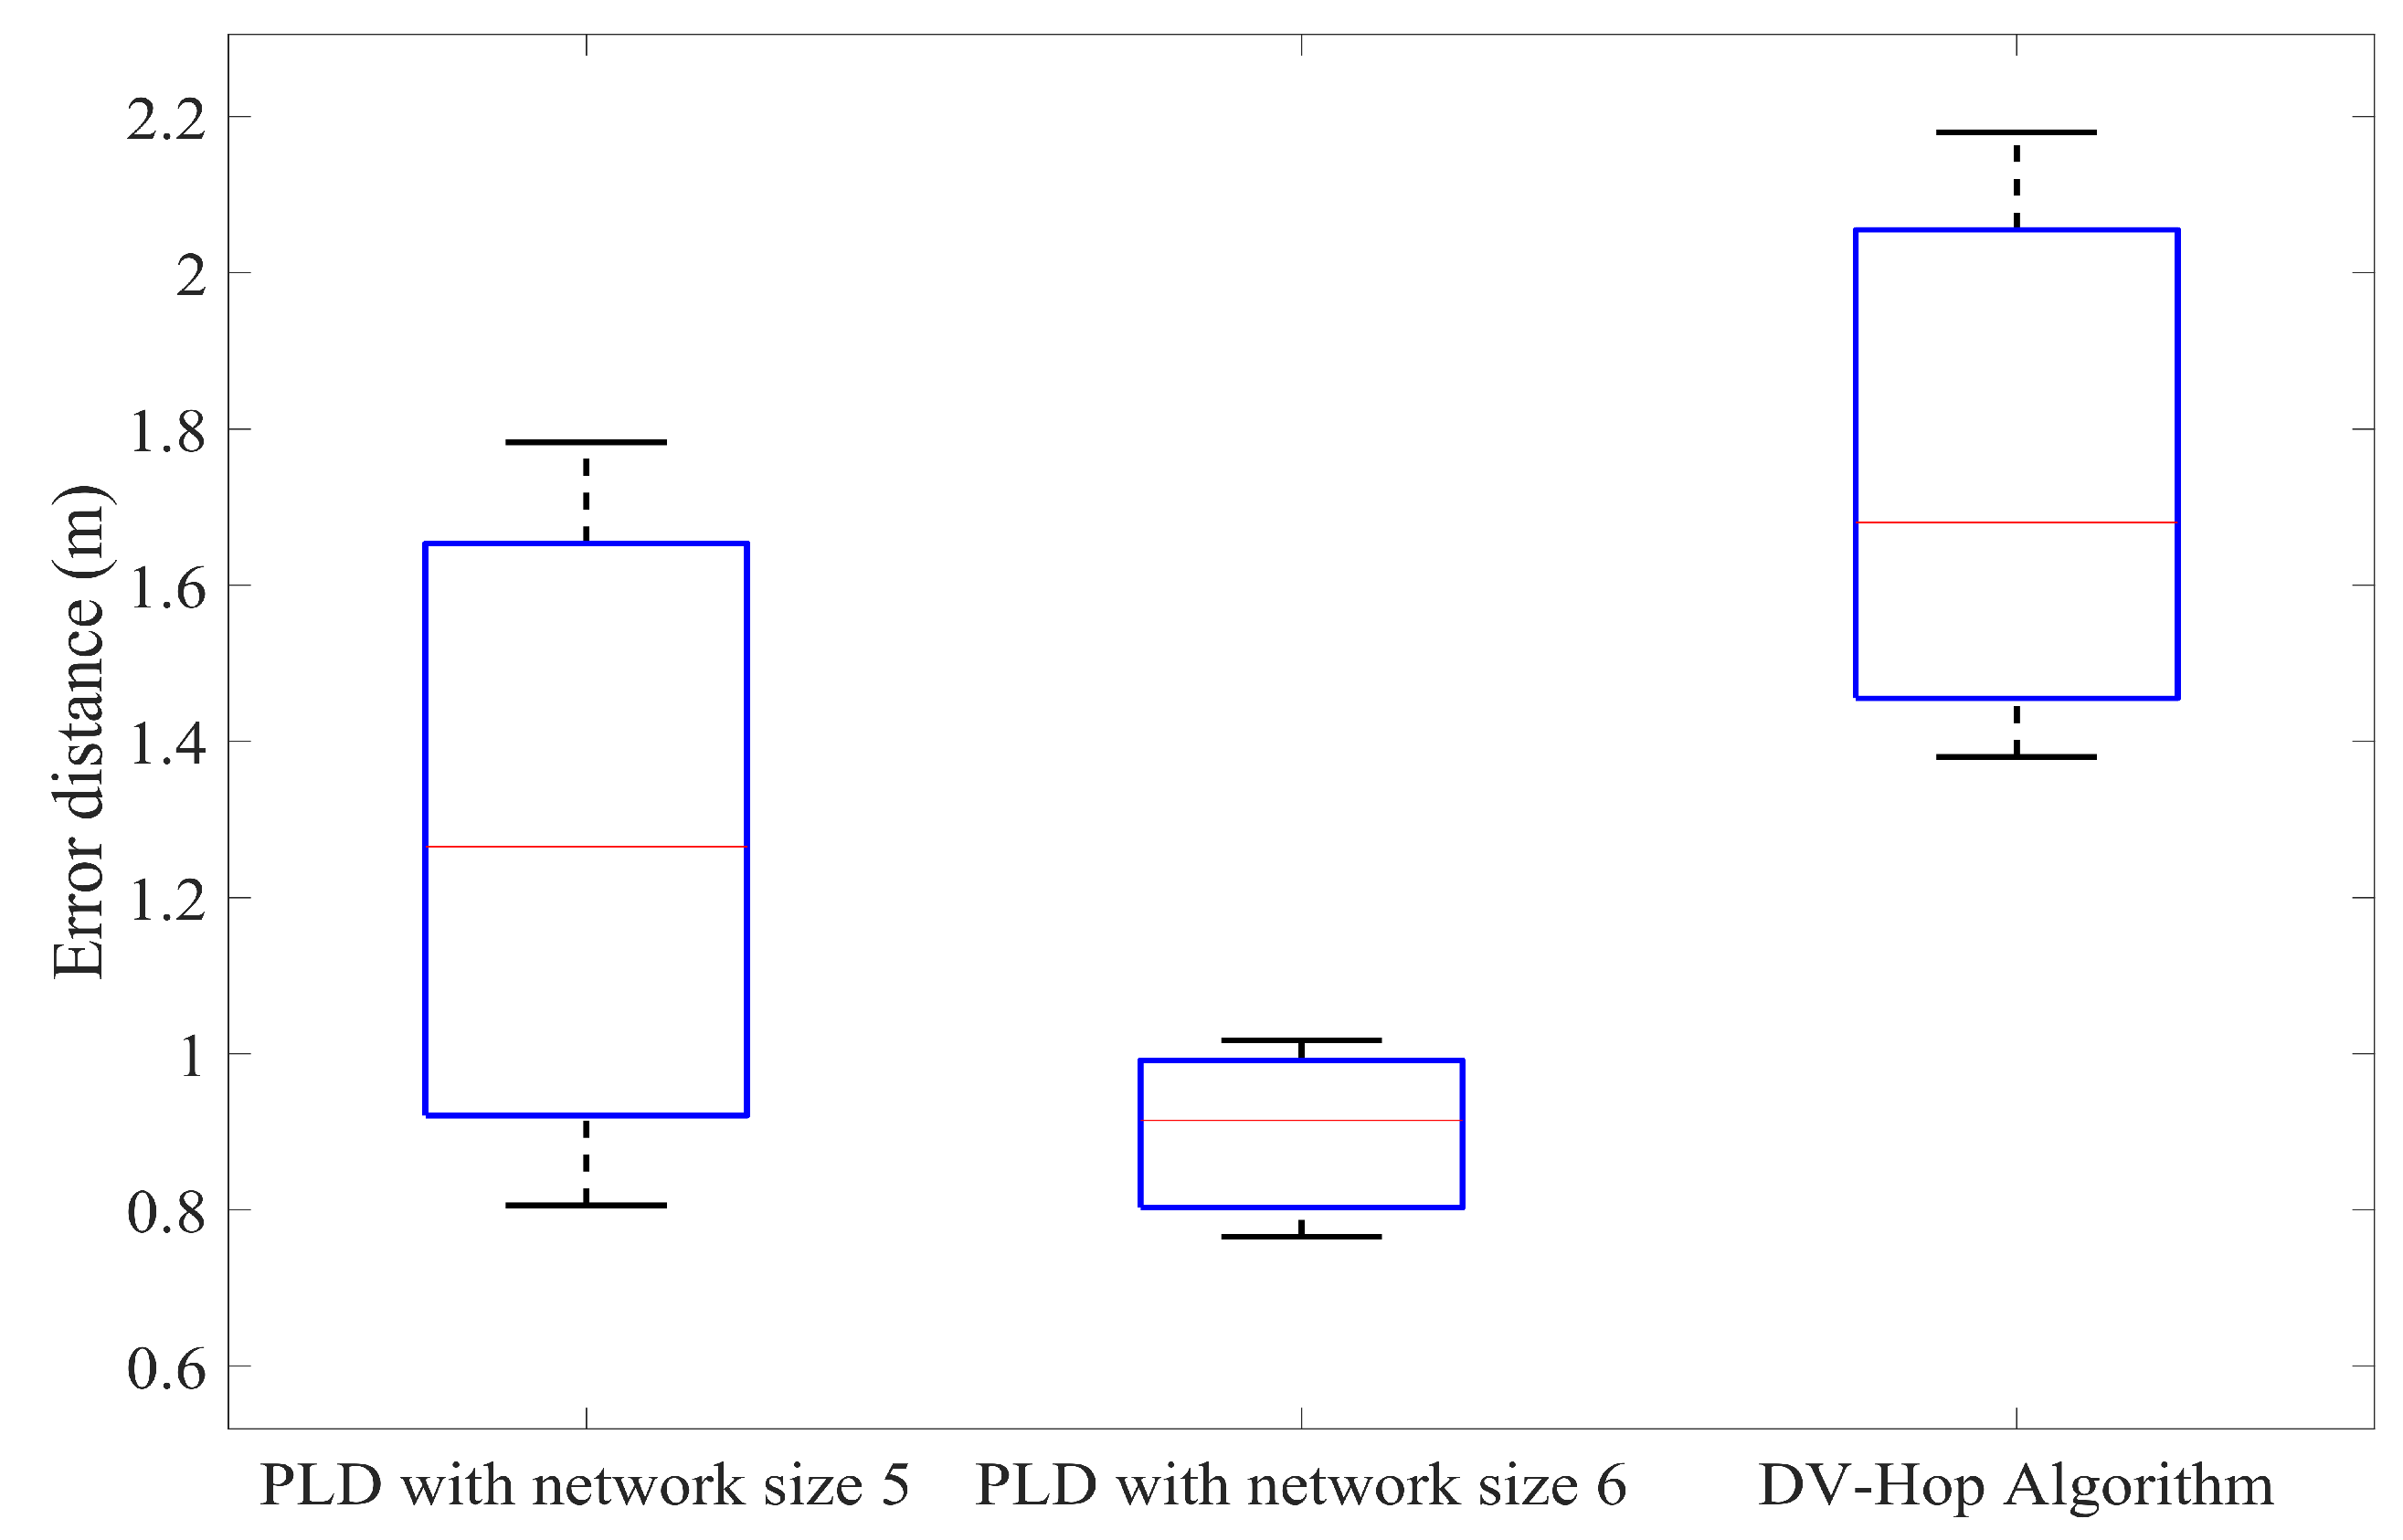
Figure 24.
Localization error distance of PLD with A = 5.
Figure 24.
Localization error distance of PLD with A = 5.
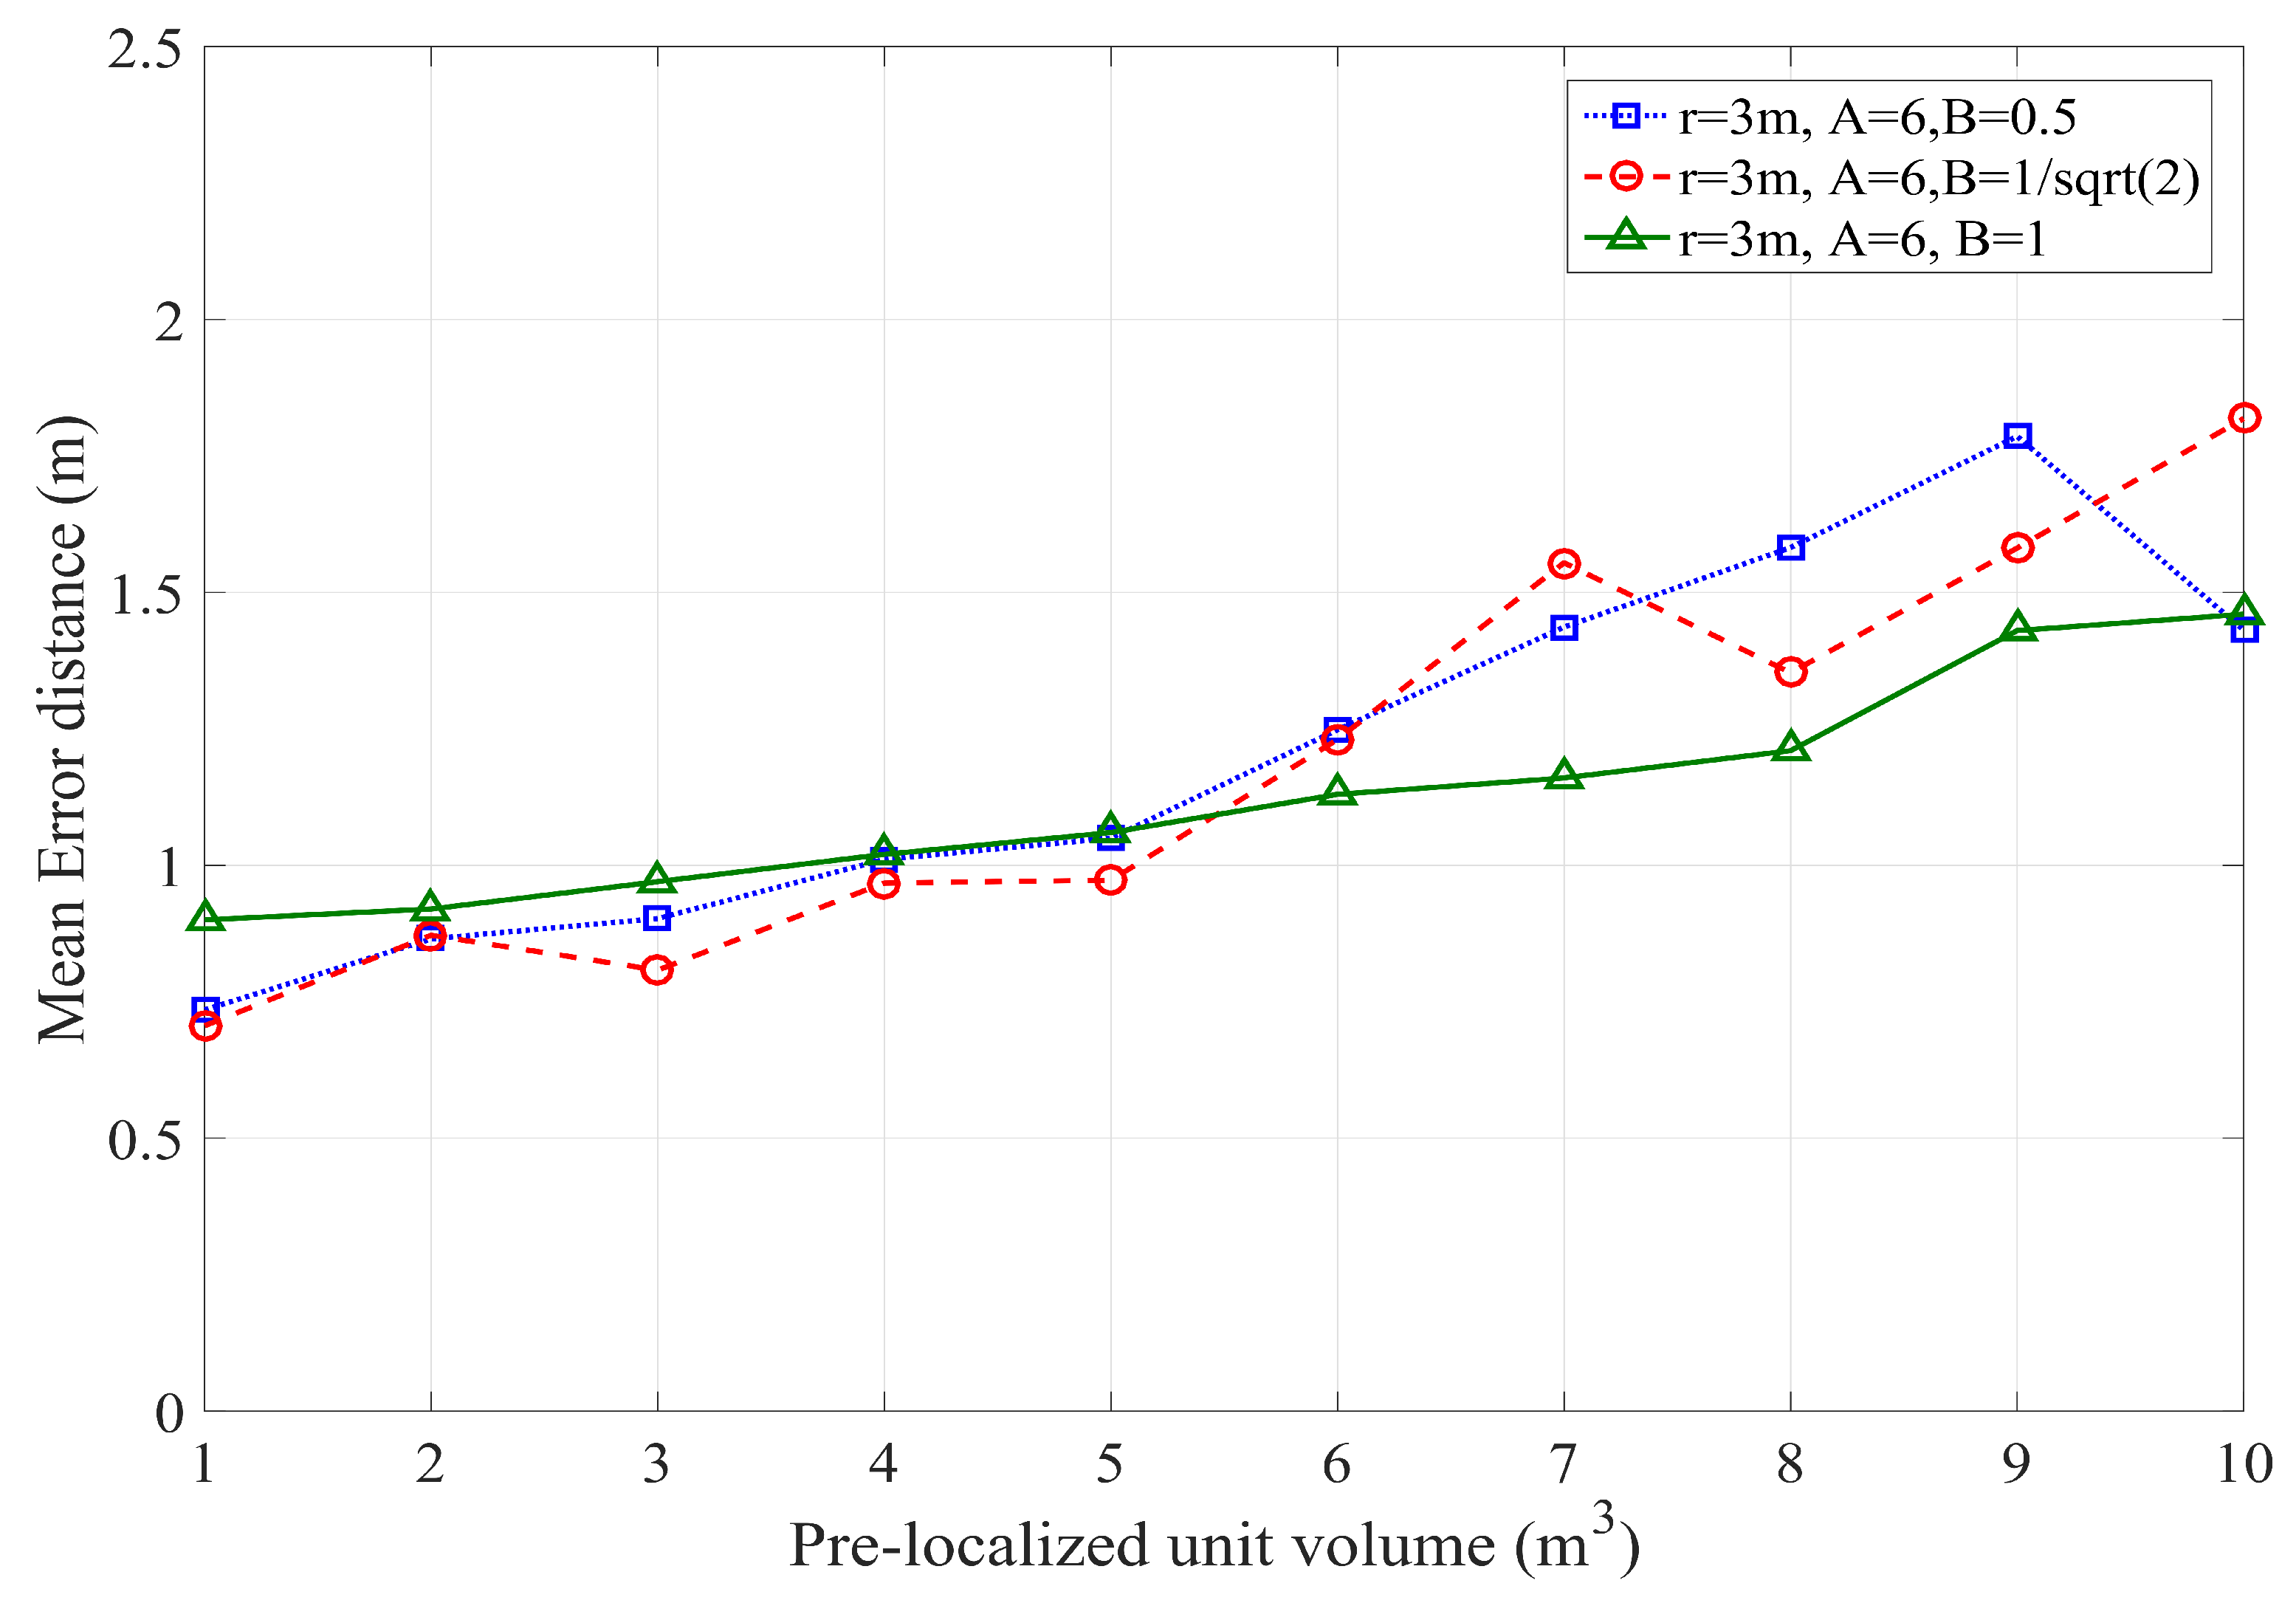
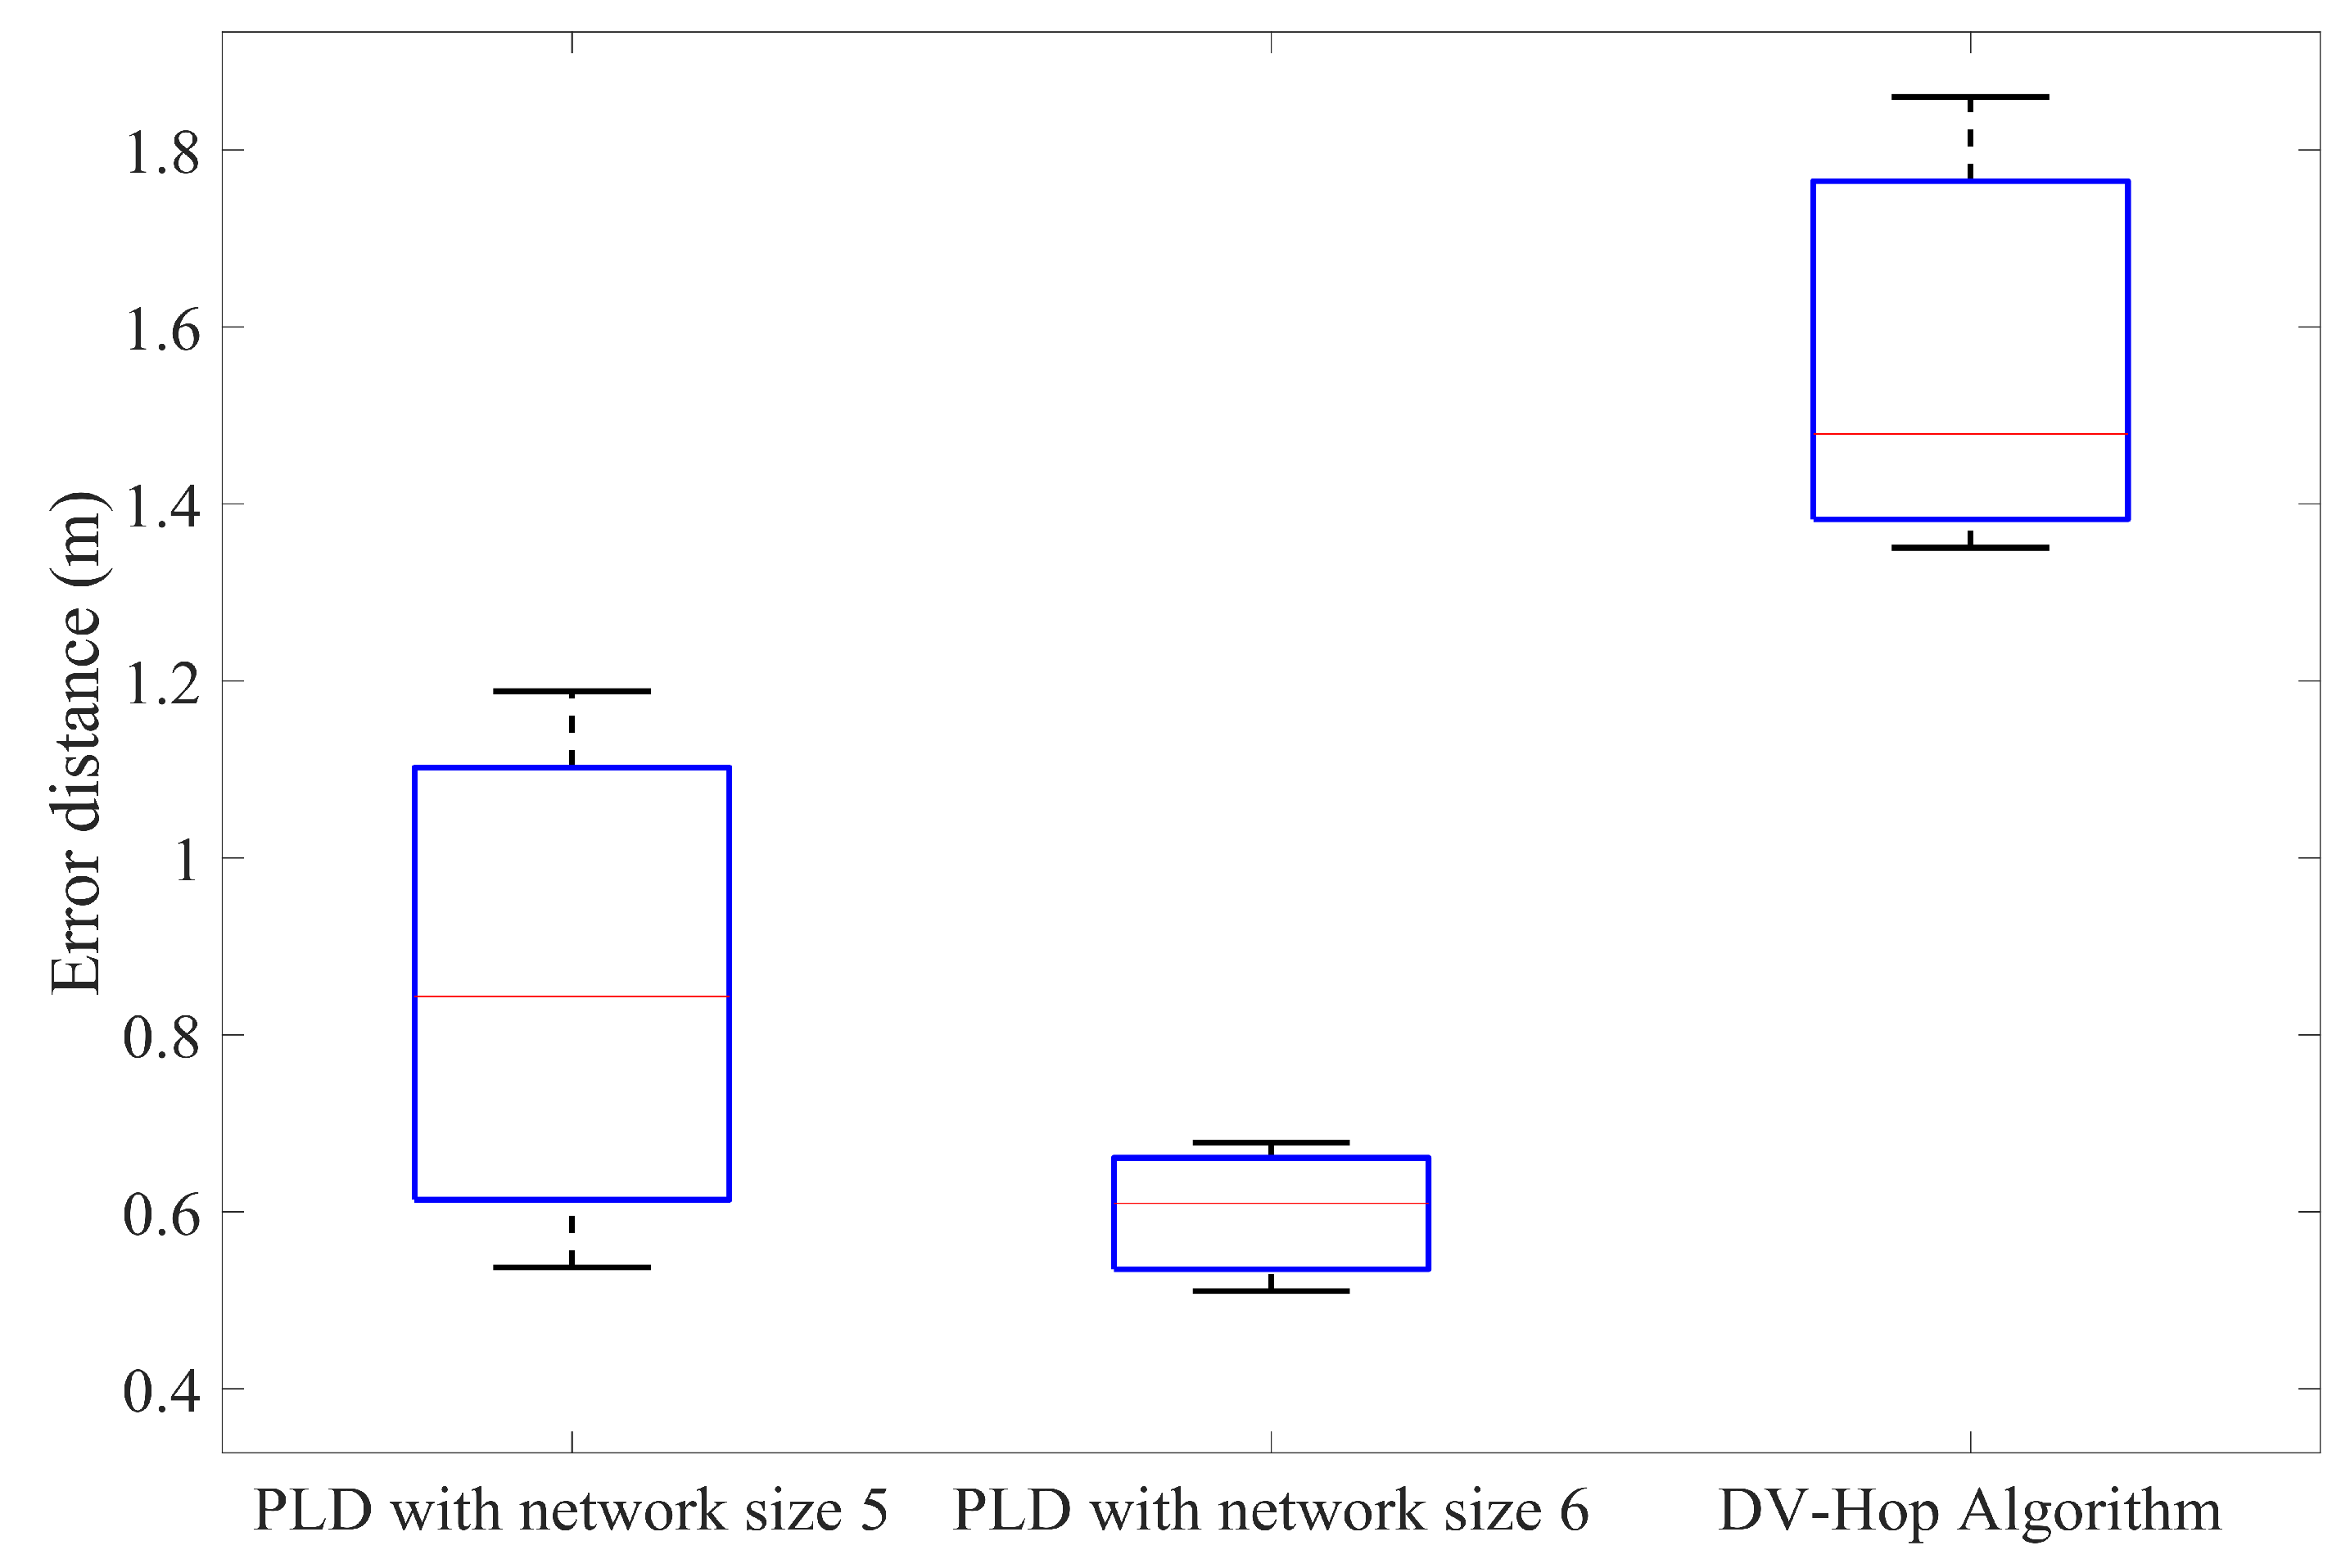
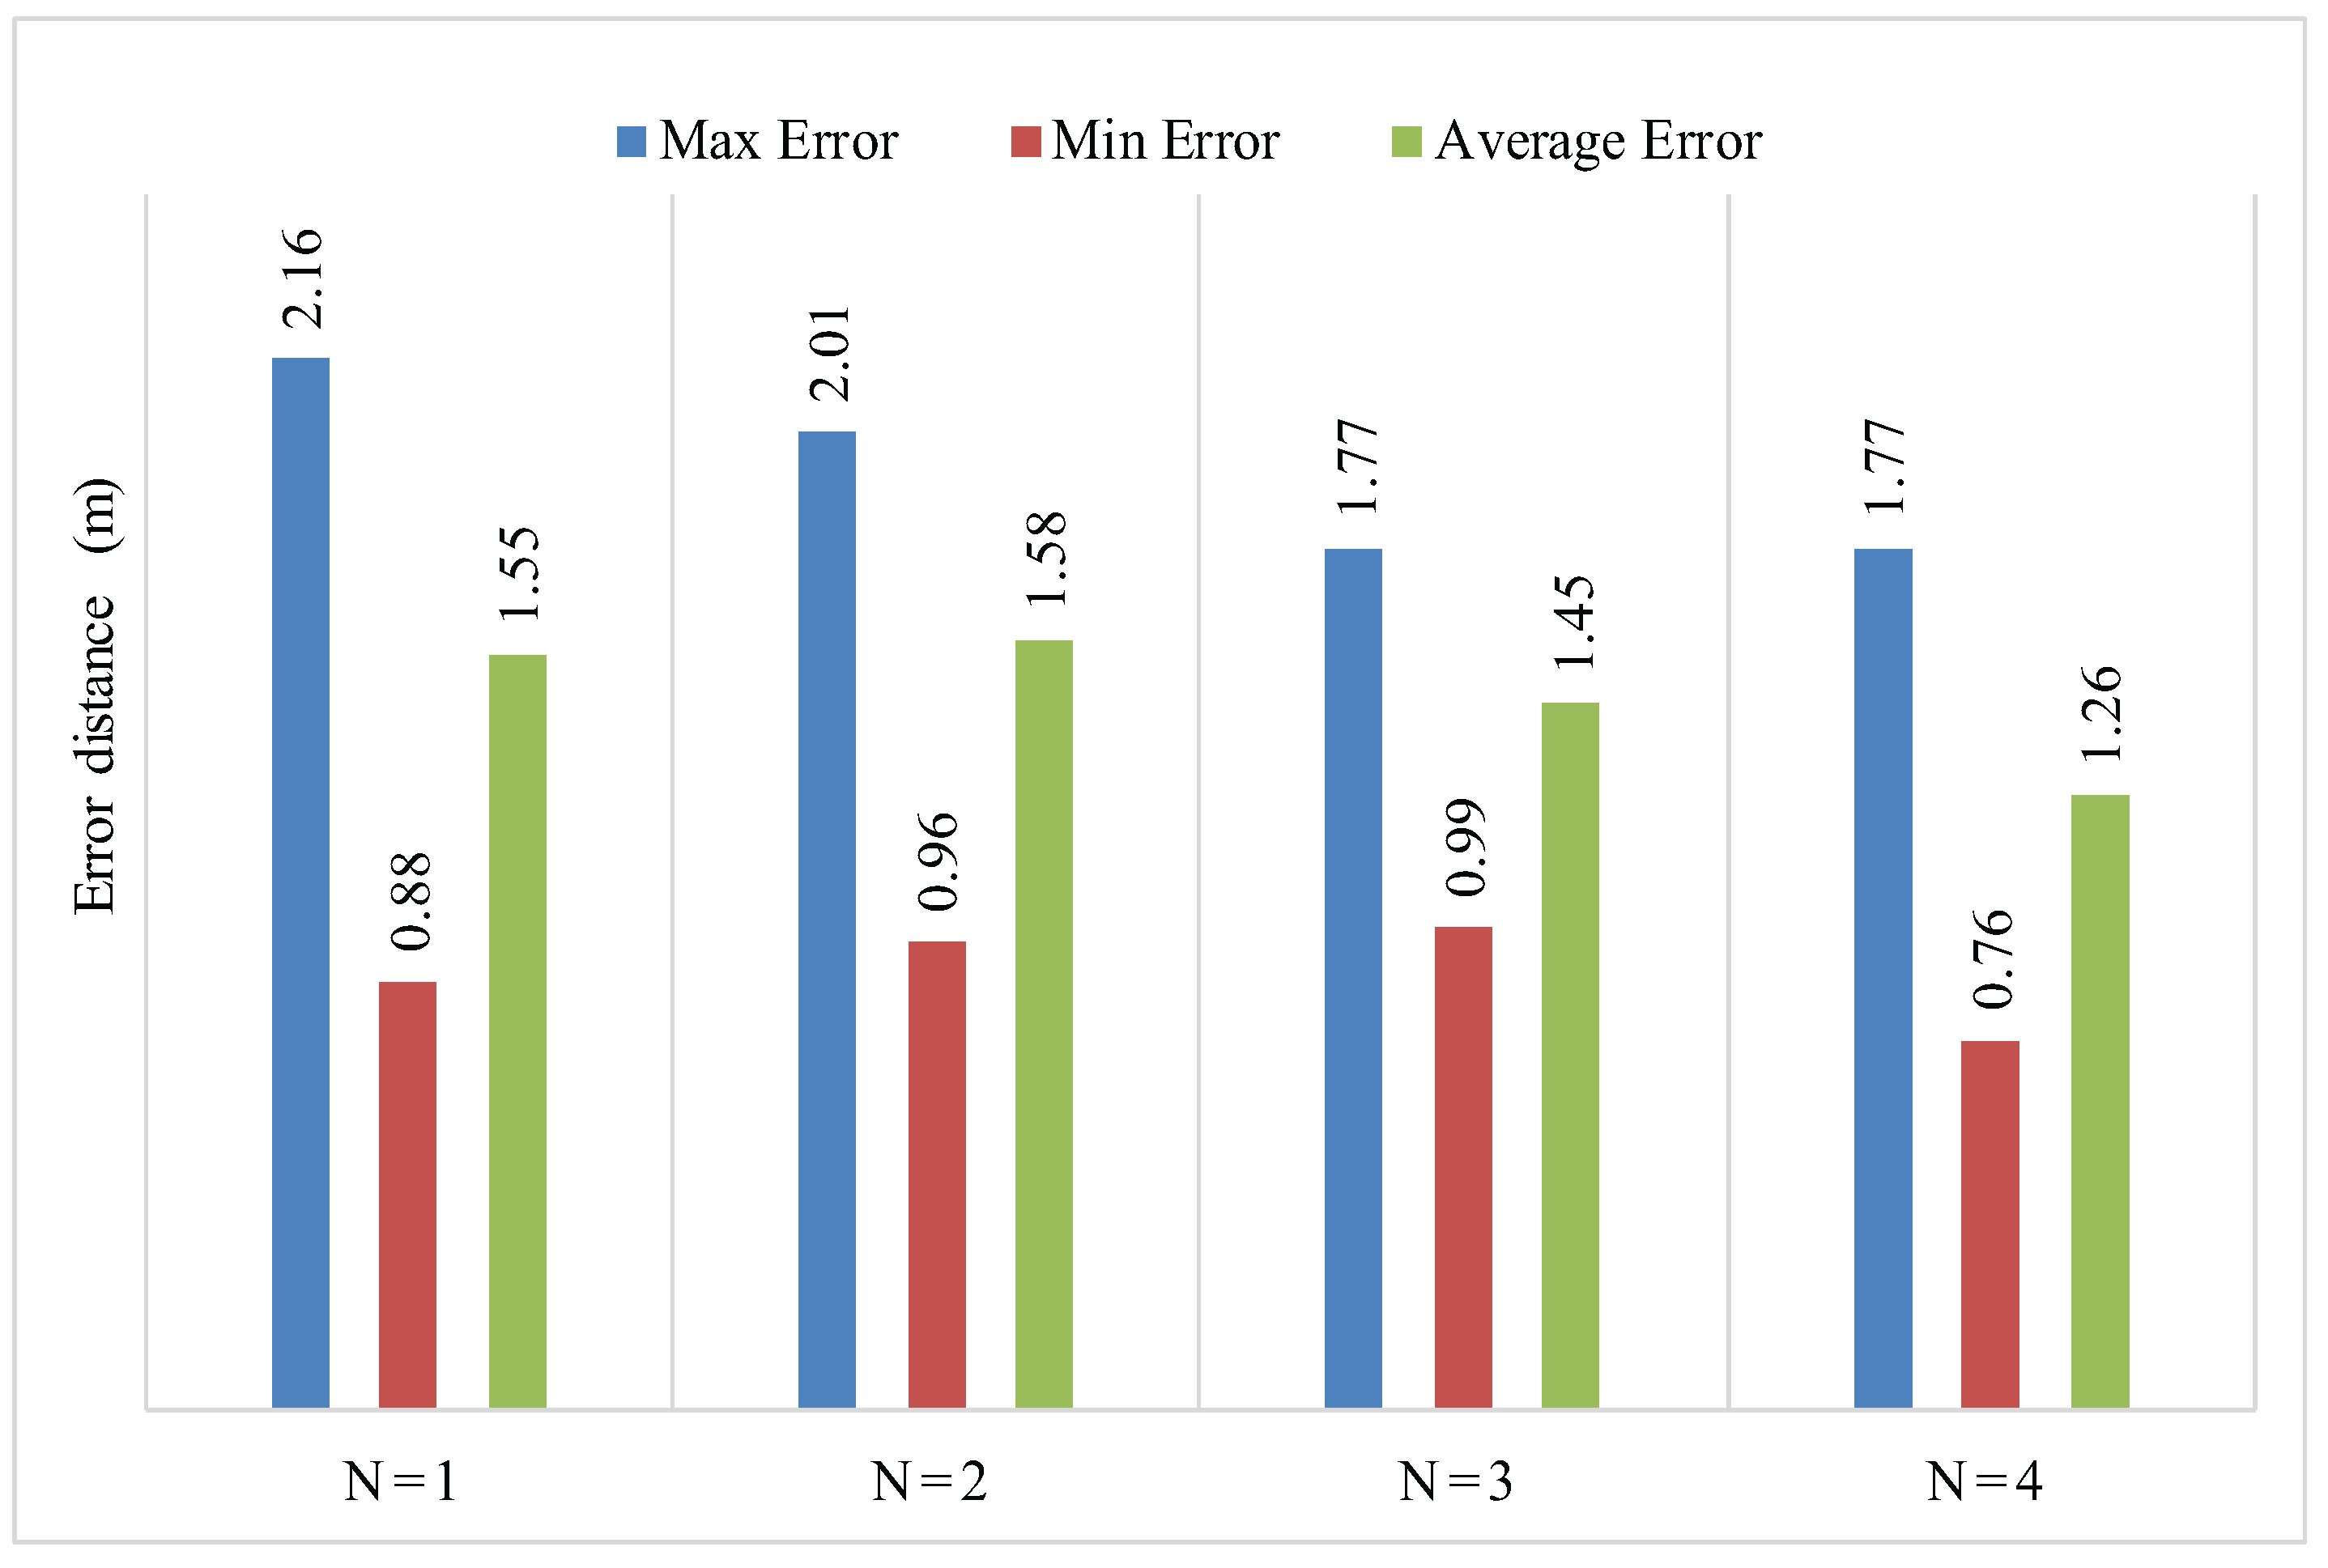
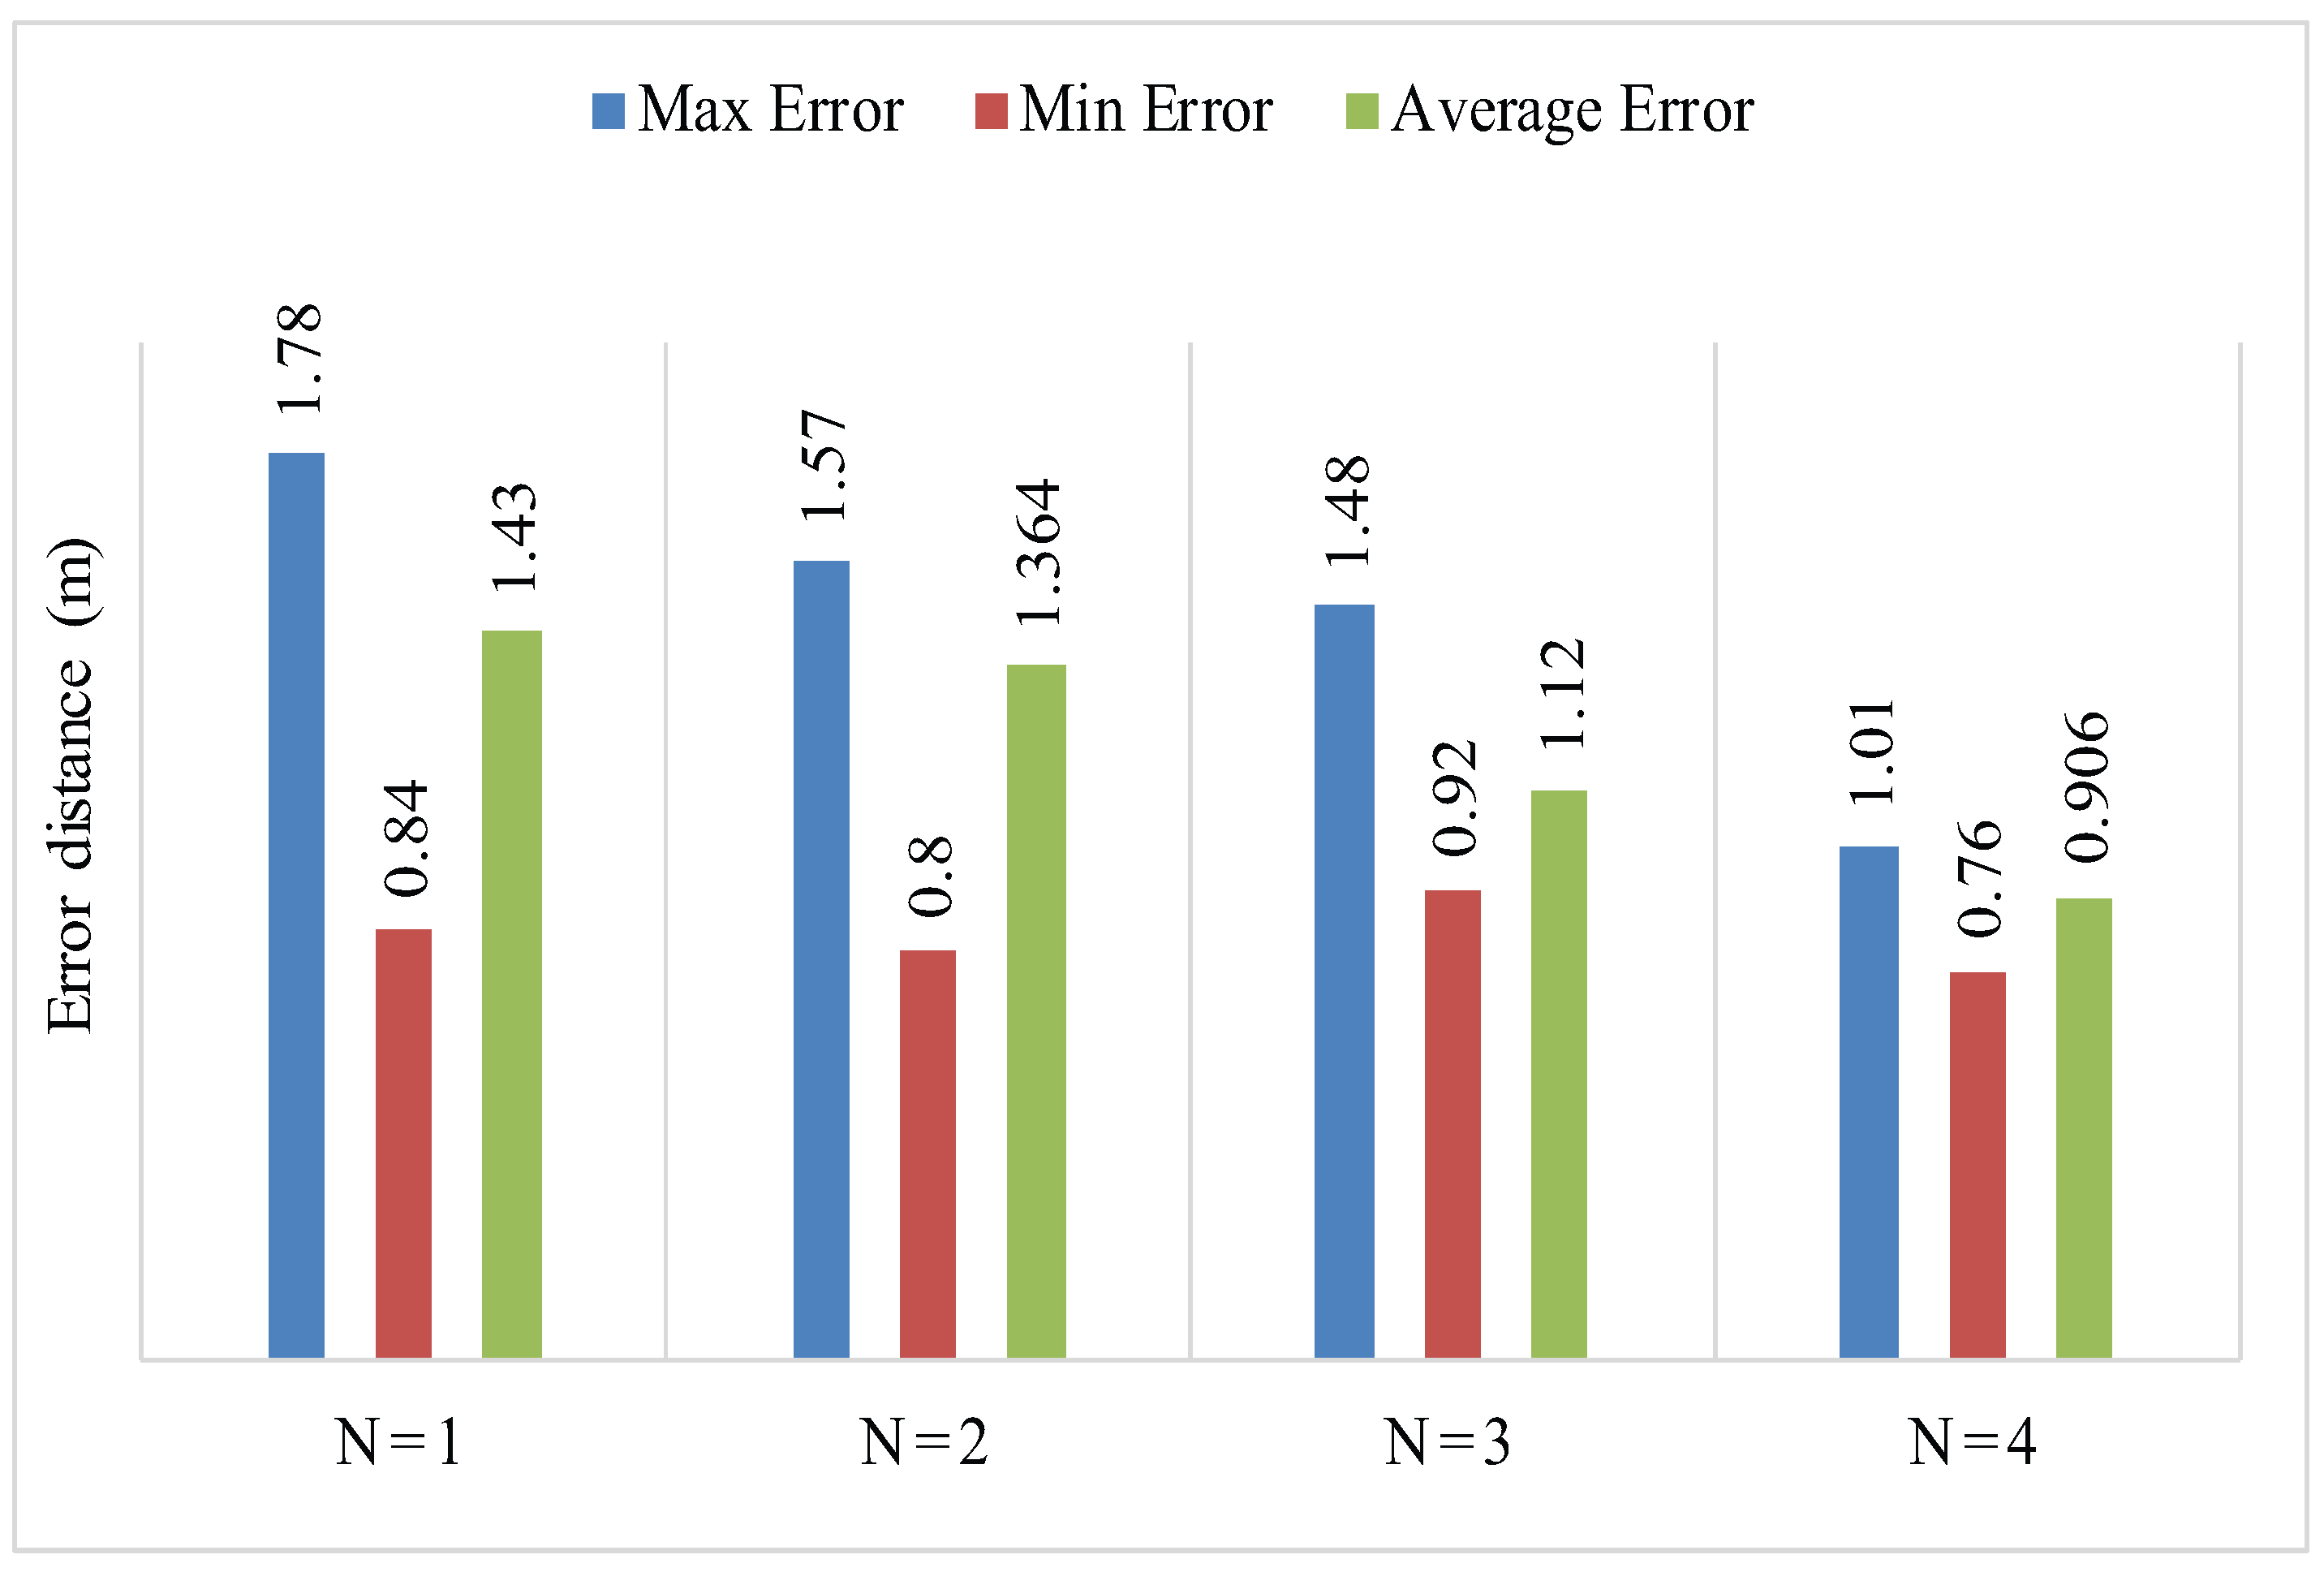
Figure 25.
Localization error distance of PLD with A = 6.
Figure 25.
Localization error distance of PLD with A = 6.
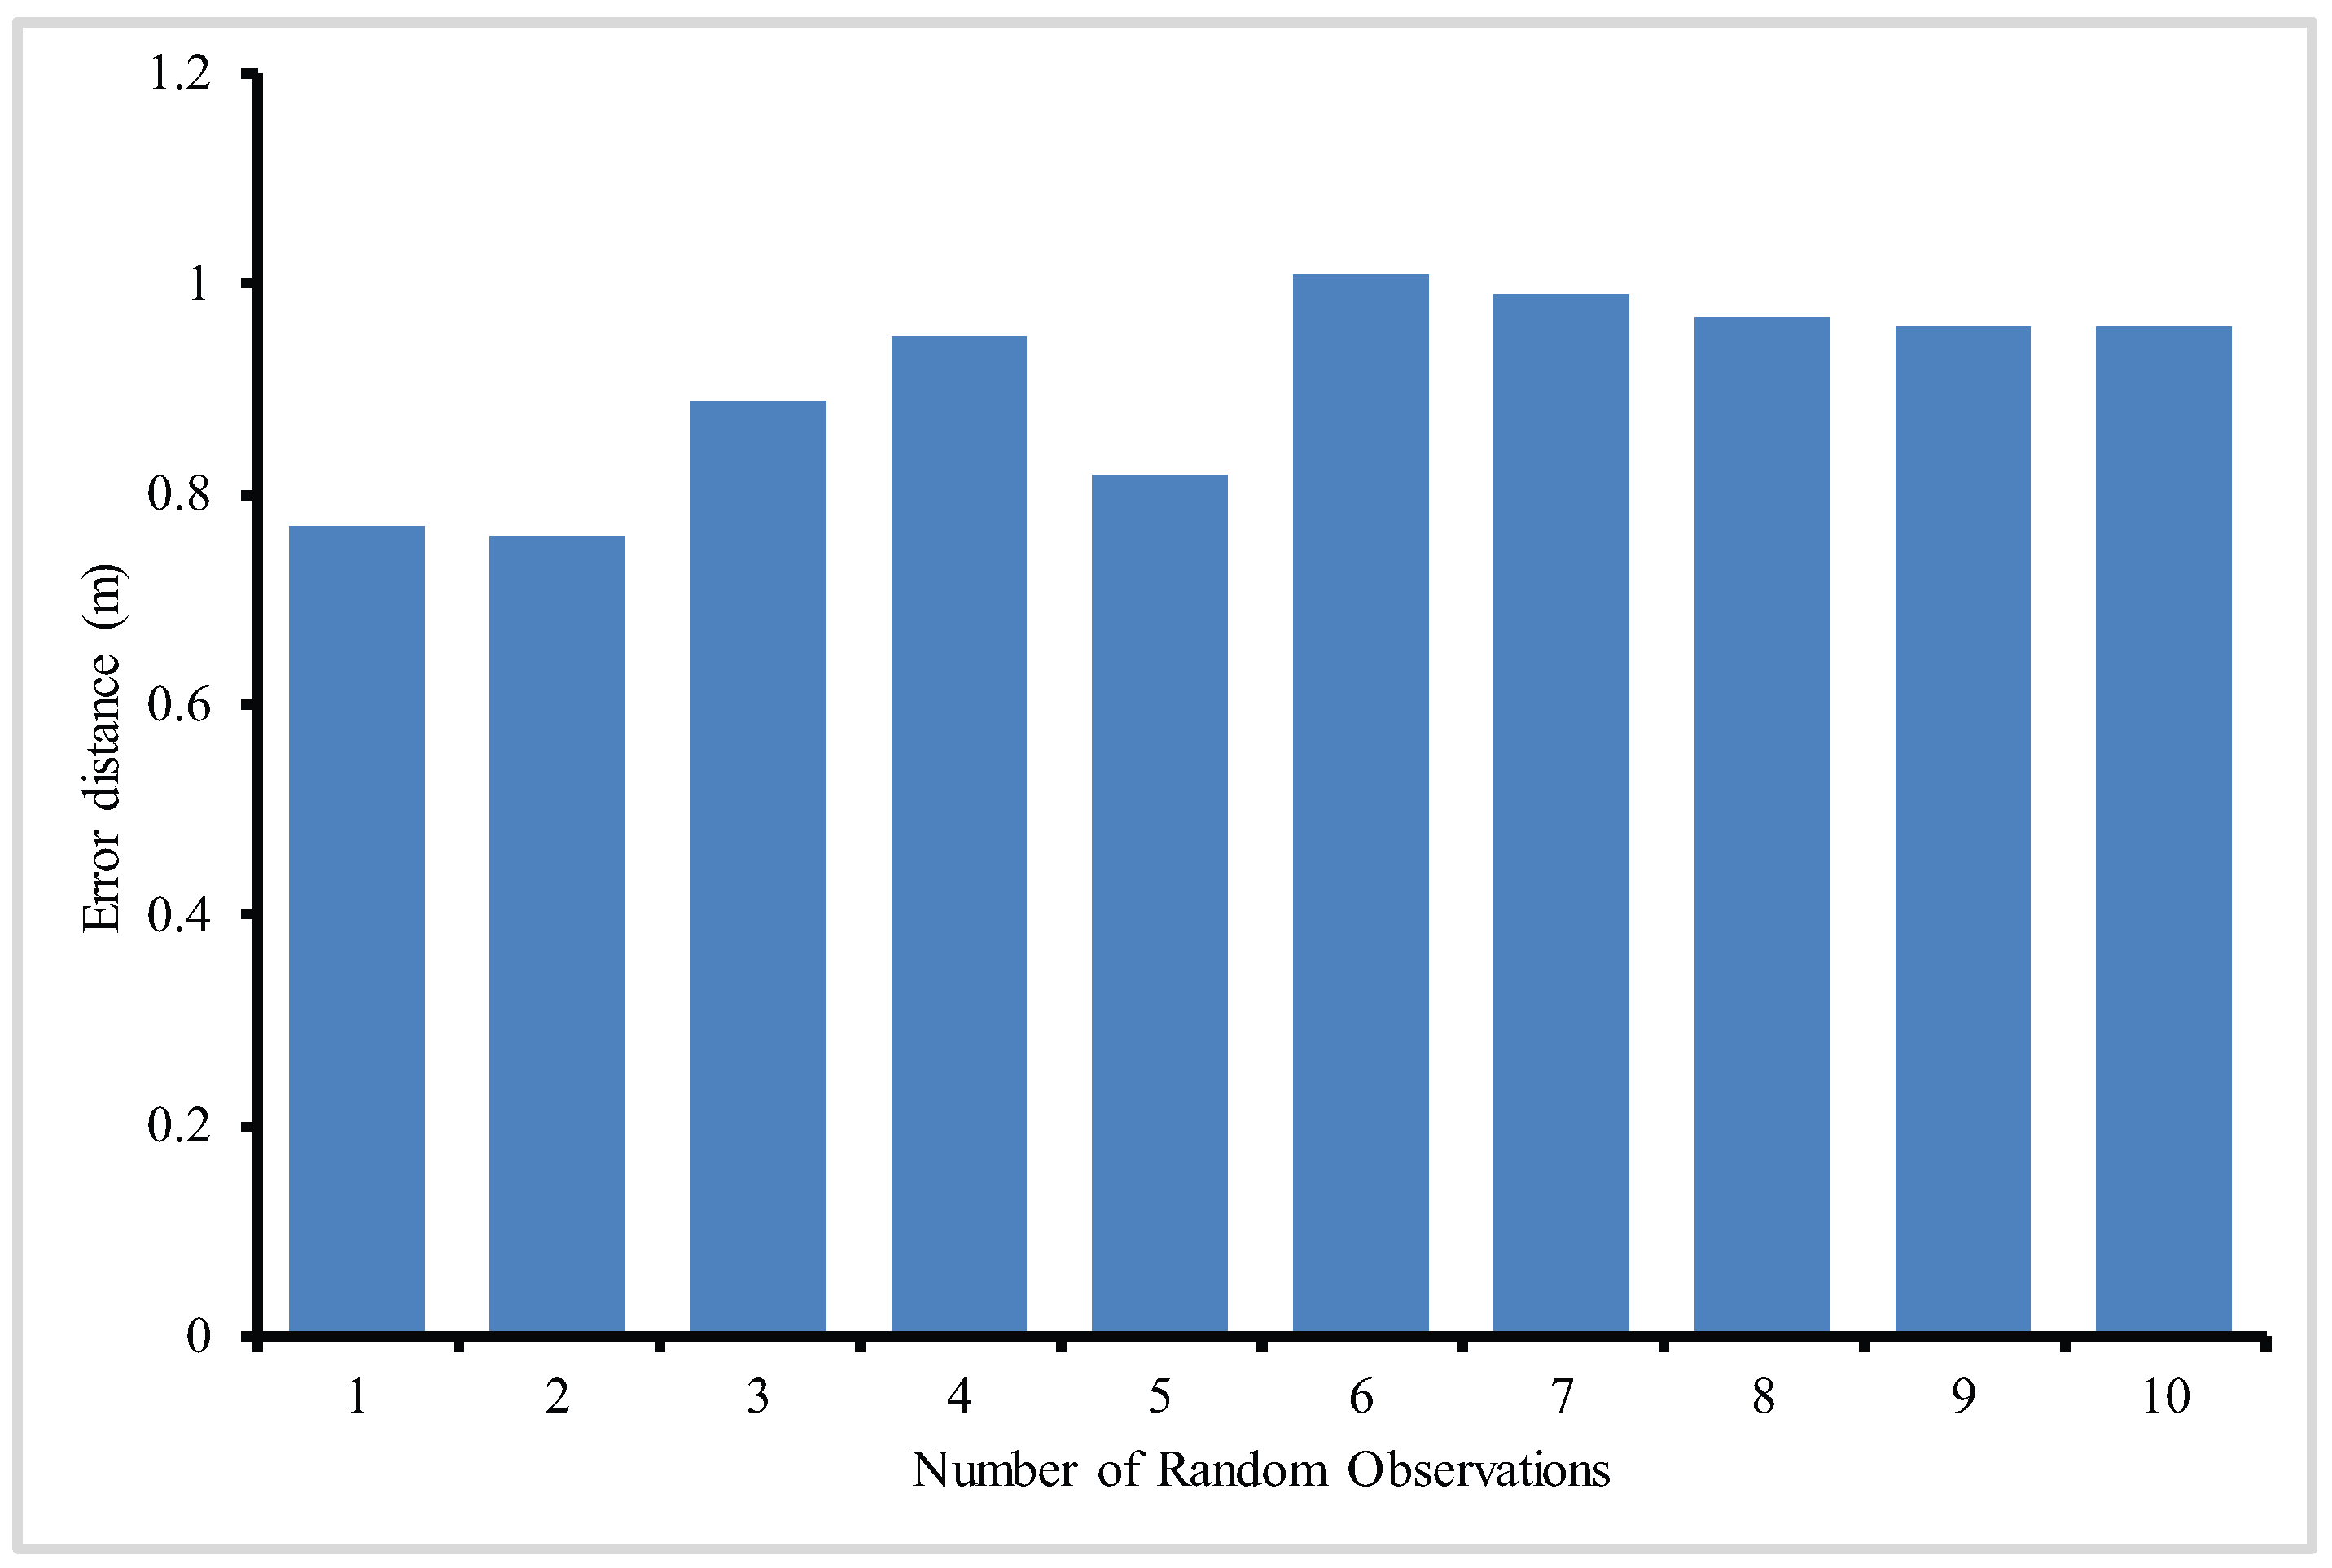
Figure 26.
Random experiment of localization error of PLD with six anchor nodes in each cluster.
Figure 26.
Random experiment of localization error of PLD with six anchor nodes in each cluster.
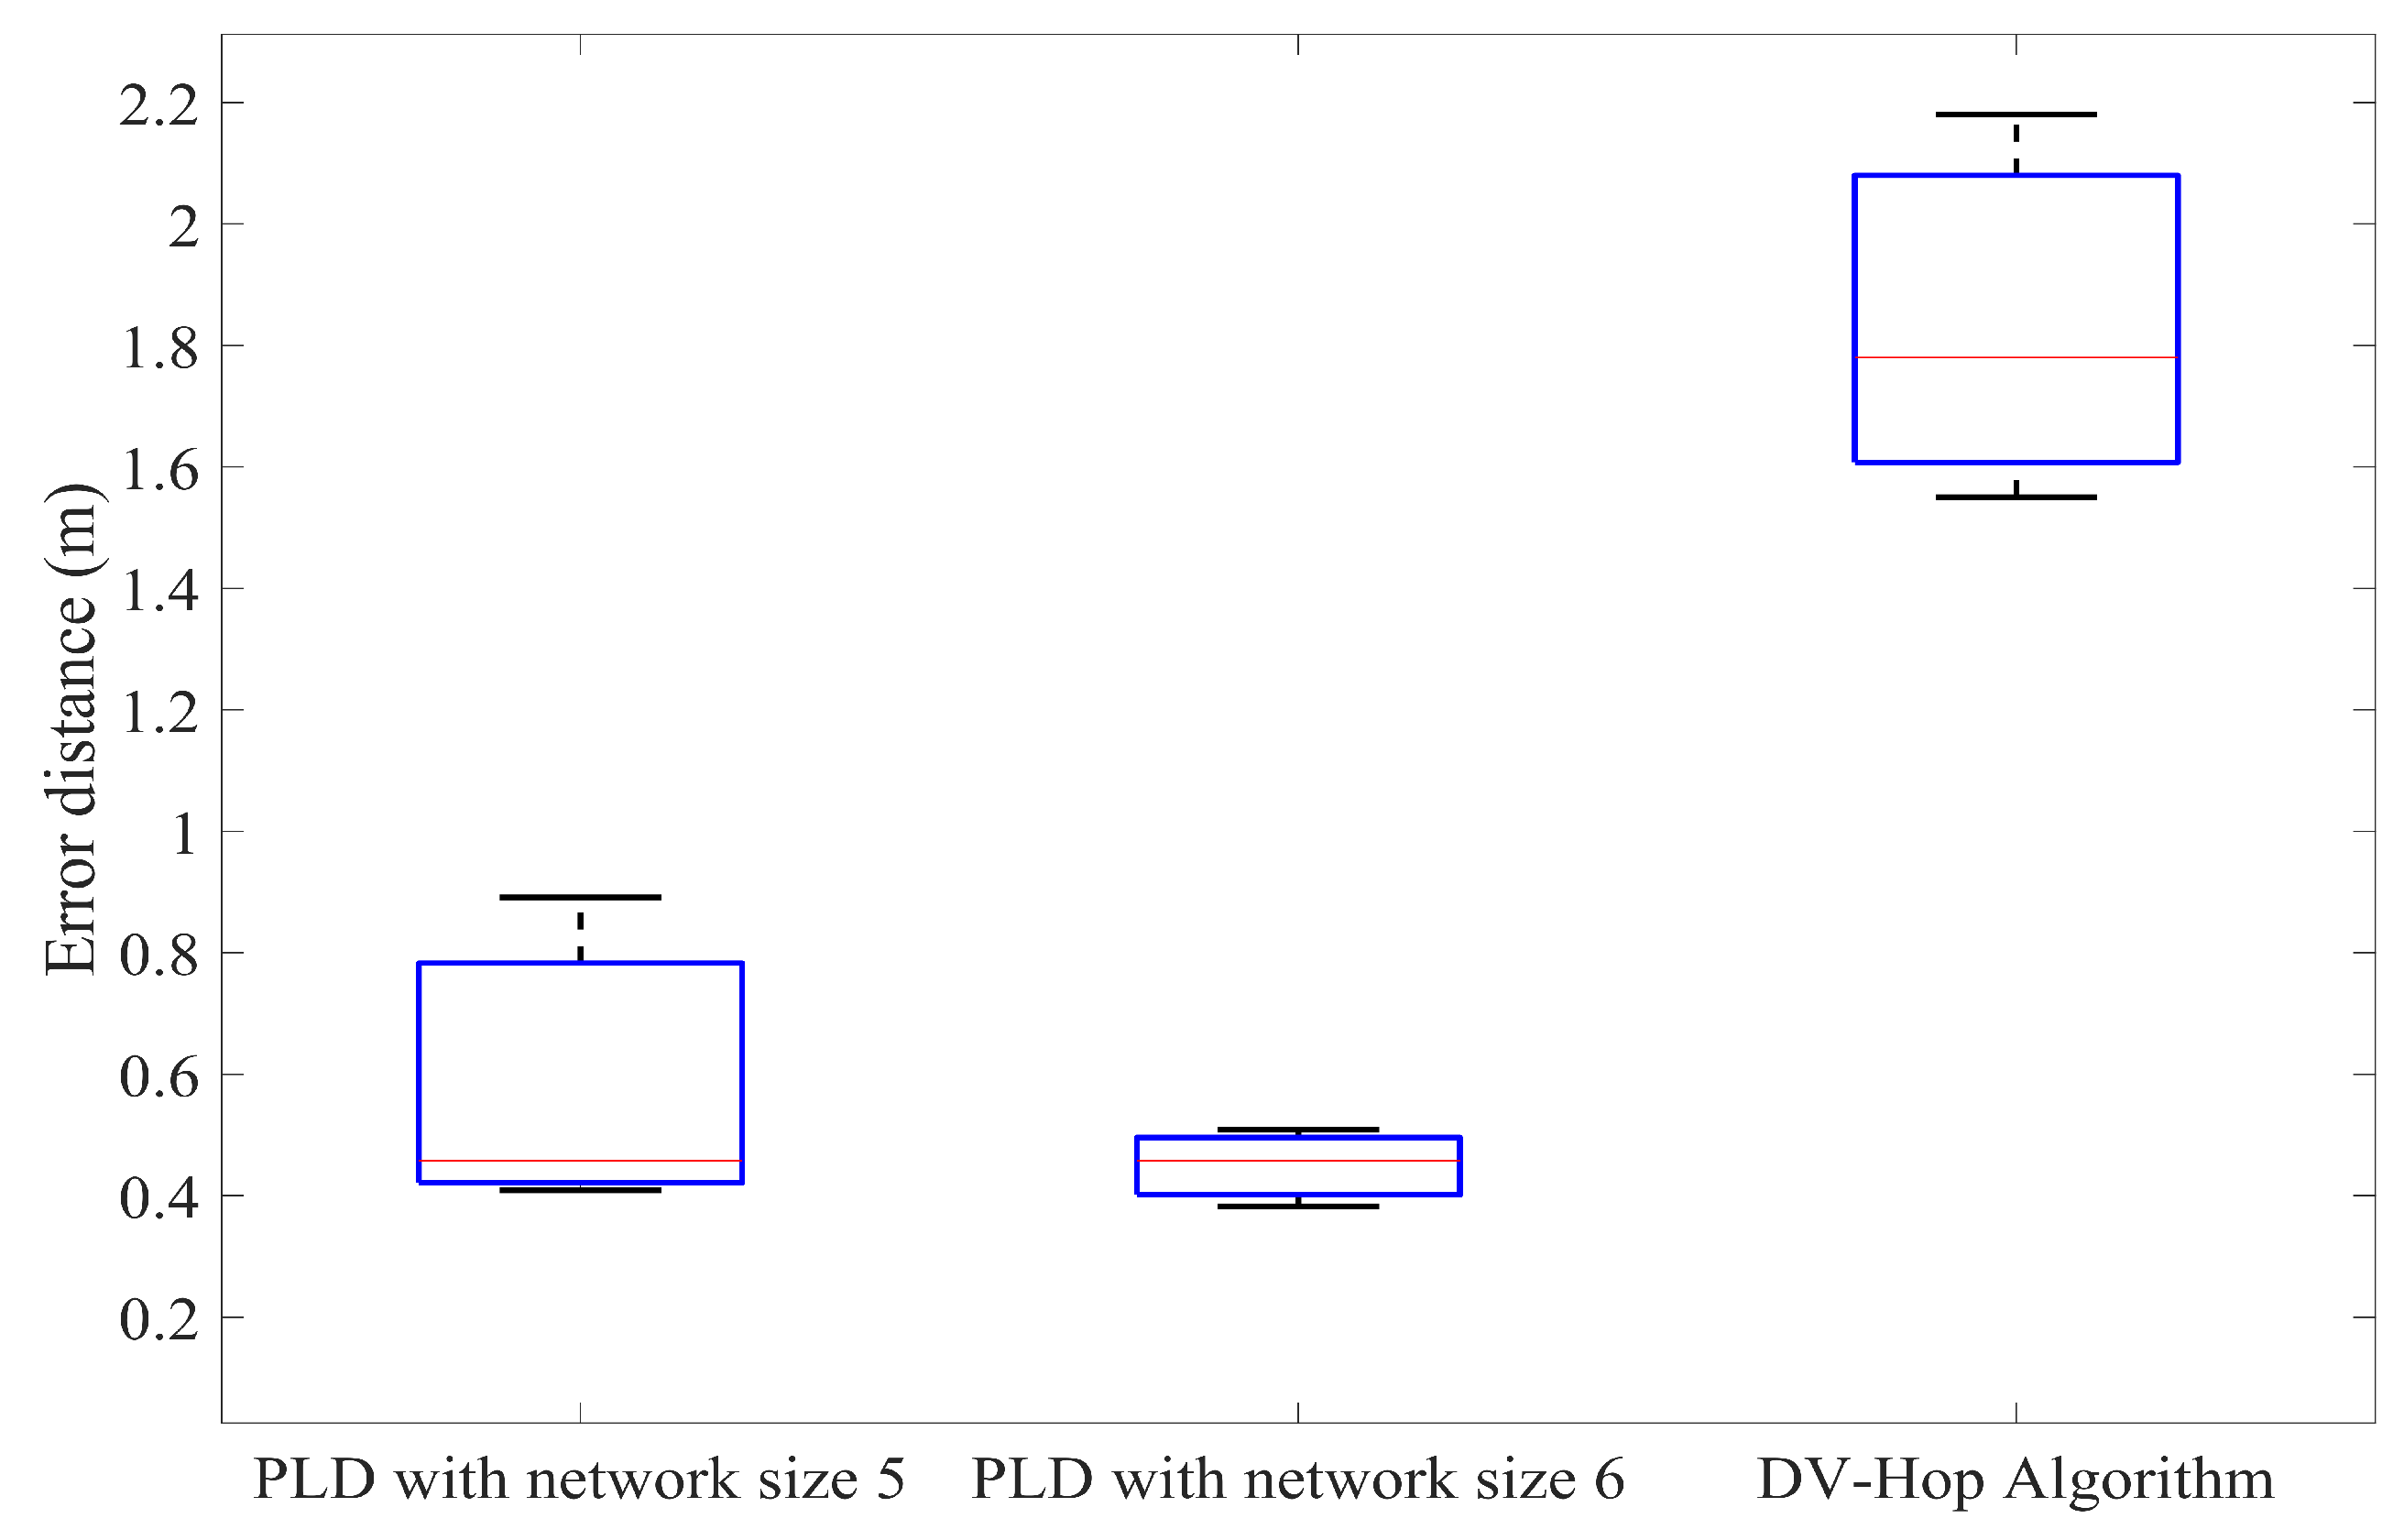
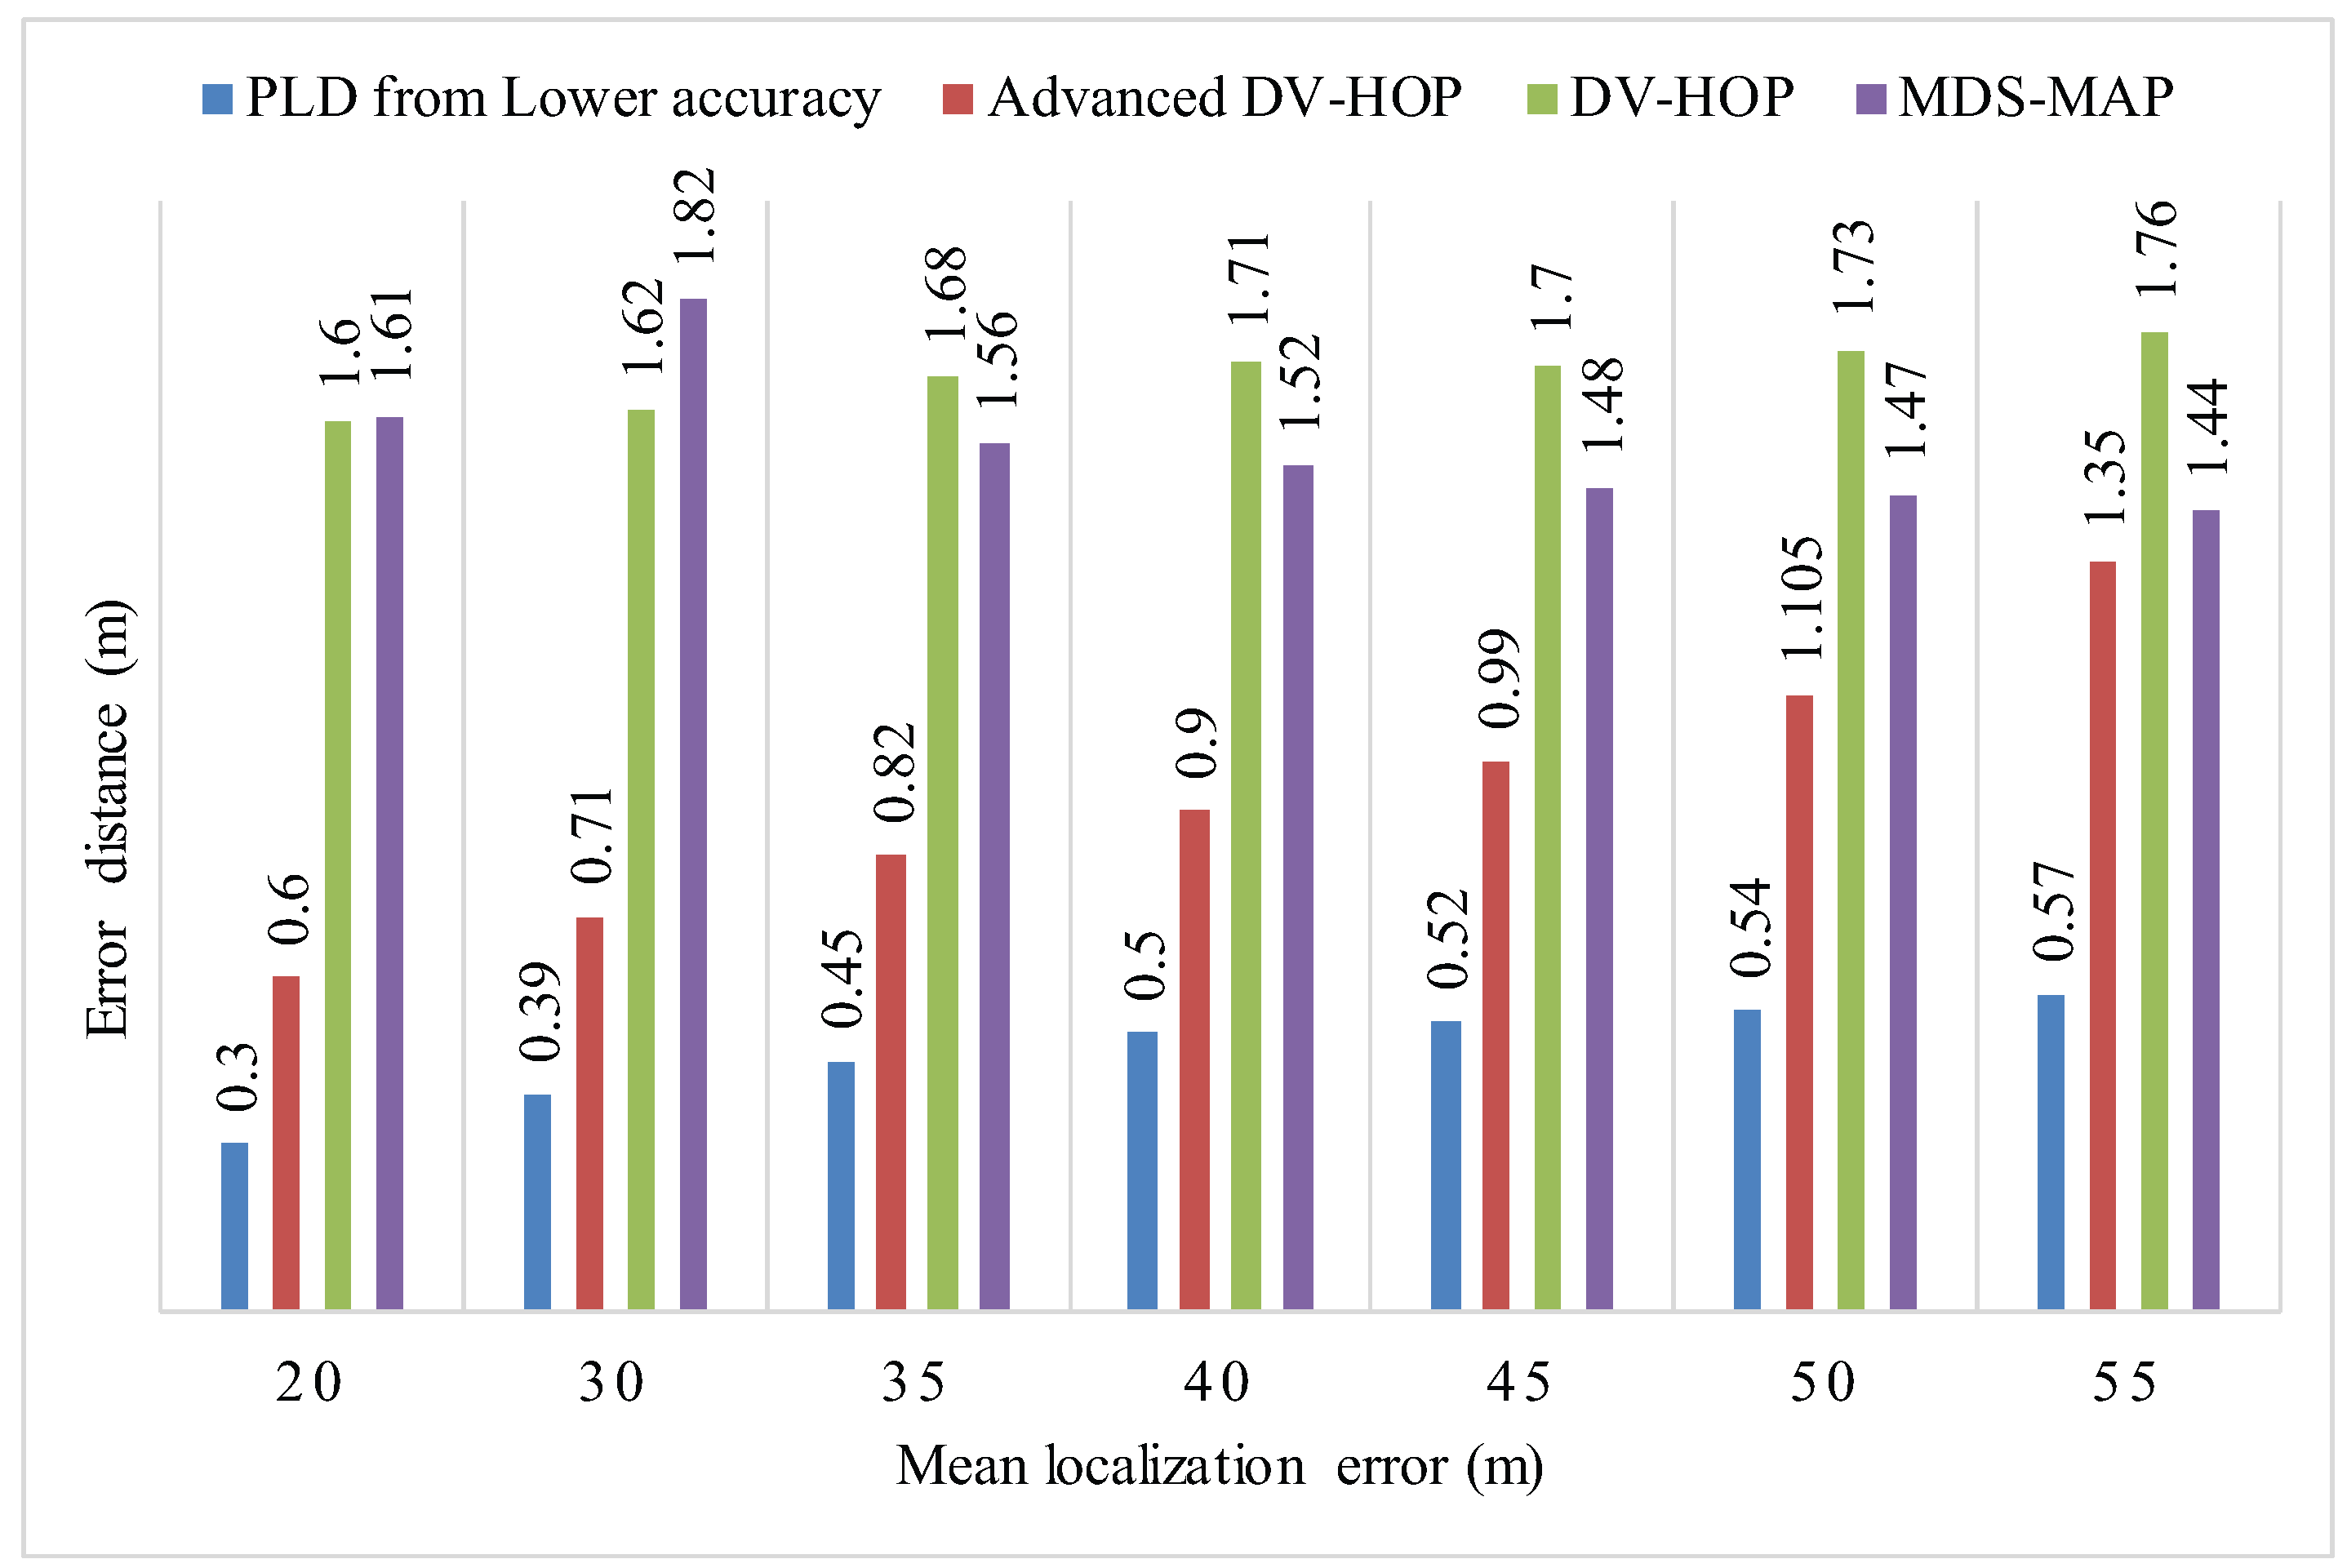
Figure 27.
Mean localization error of PLD, DV-Hop, Advanced DV-Hop and MDS-MAP.
Figure 27.
Mean localization error of PLD, DV-Hop, Advanced DV-Hop and MDS-MAP.
Table 1.
Indoor positioning technologies.
Table 1.
Indoor positioning technologies.
| Technology | Typical Accuracy | Typical Coverage (m) | Measurement Technique |
|---|
| Camera | 0.1 mm∼1 dm | 1∼10 | Angle measurements from images |
| Infrared | 1 cm∼1 dm | 1∼5 | Active beacons |
| Sound | 2 cm | 2∼10 | Time of Arrival (ToA) |
| Wi-Fi | 1 m | 20∼50 | Fingerprinting |
| RFID | 1 dm∼1 m | 1∼50 | Fingerprinting, proximity detection |
| UWB | 1 cm∼1 m | 1∼50 | ToA, body reflection |
| Pseudolites | 1 cm∼1 dm | 10∼1000 | Carrier phase ranging |
| Magnetic systems | 1 mm∼1 cm | 1∼20 | Fingerprinting and ranging technique |
| Zigbee | 1 m | 30∼60 | Centroid based techniques |
Table 2.
List of key notations.
Table 2.
List of key notations.
| Notation | Explanation |
|---|
| Mid-points of each PLD network |
| ith anchor node |
| ith parametric points produced after each iteration |
| Volume of ith parametric looped network |
| Non overlapped PLD networks |
| Distance matrix from a sensor node to all other sensors in a network |
| Distance matrix from a anchor node to all other sensors in a network |
| Targetted node in each network |
| Number of generated anchor nodes in network |
| Step size in PLD network |
| Parametric function of PLD network |
| Representation of change in center point |
| Working boundary |
| Cartesian coordinates of estimated node position. |
Table 3.
Localization error of four nodes in each PLD network.
Table 3.
Localization error of four nodes in each PLD network.
| x̂ | ŷ | ẑ | x | y | z | Error in (m) |
|---|
| 14.47 | 7.66 | 14.11 | 15.90 | 8.20 | 15.27 | 1.91 |
| 15.54 | 9.93 | 14.90 | 15.54 | 9.93 | 14.90 | 1.53 |
| 15.73 | 10.65 | 15.25 | 15.79 | 10.63 | 15.27 | 0.05 |
| 16.93 | 11.85 | 16.45 | 16.94 | 11.85 | 16.15 | 0.08 |
Table 4.
Mean error of 10 different trials of PLD network with m.
Table 4.
Mean error of 10 different trials of PLD network with m.
| N = 1 | N = 2 | N = 3 | N = 4 |
|---|
| A = 5 | A = 6 | A = 5 | A = 6 | A = 5 | A = 6 | A = 5 | A = 6 |
|---|
| 1.06 | 0.84 | 2.01 | 1.5 | 1.42 | 1.48 | 1.77 | 0.77 |
| 1.2 | 1.08 | 1.99 | 1.36 | 1.77 | 1.08 | 1.22 | 0.76 |
| 1.44 | 1.62 | 1.93 | 1.38 | 1.68 | 1.10 | 0.91 | 0.89 |
| 1.45 | 1.60 | 1.57 | 1.47 | 1.64 | 1.12 | 1.52 | 0.95 |
| 1.84 | 1.78 | 1.30 | 1.57 | 1.72 | 1.23 | 1.44 | 0.82 |
| 2.16 | 1.75 | 1.69 | 1.56 | 1.12 | 1.24 | 1.41 | 1.01 |
| 1.99 | 1.66 | 0.96 | 1.57 | 1.54 | 1.20 | 0.76 | 0.99 |
| 2.08 | 1.57 | 1.25 | 1.61 | 1.12 | 0.95 | 0.78 | 0.97 |
| 1.47 | 1.26 | 1.73 | 0.77 | 0.99 | 0.96 | 1.42 | 0.96 |
| 0.88 | 1.18 | 1.43 | 0.80 | 1.59 | 0.92 | 1.43 | 0.96 |
Table 5.
Avg, Max, and Min localization error at each PLD network with A = 5 and A = 6.
Table 5.
Avg, Max, and Min localization error at each PLD network with A = 5 and A = 6.
| Number of Localization Points | eavg | emax | emin |
|---|
| A = 5 | A = 6 | A = 5 | A = 6 | A = 5 | A = 6 |
|---|
| N = 1 | 1.55 | 1.43 | 2016 | 1.78 | 1.28 | 0.84 |
| N = 2 | 1.58 | 1.364 | 2.01 | 1.61 | 1.05 | 0.77 |
| N = 3 | 1.45 | 1.128 | 1.77 | 1.48 | 0.78 | 0.92 |
| N = 4 | 1.265 | 0.908 | 1.77 | 1.01 | 1.01 | 0.76 |


