
Predictive Machine Learning Models and Survival Analysis for COVID-19 Prognosis Based on Hematochemical Parameters

 ,
,  ,
,  ,
,  , , , ,
  , , , , , , and
Abstract
:1. Introduction
2. Related Works
3. Materials
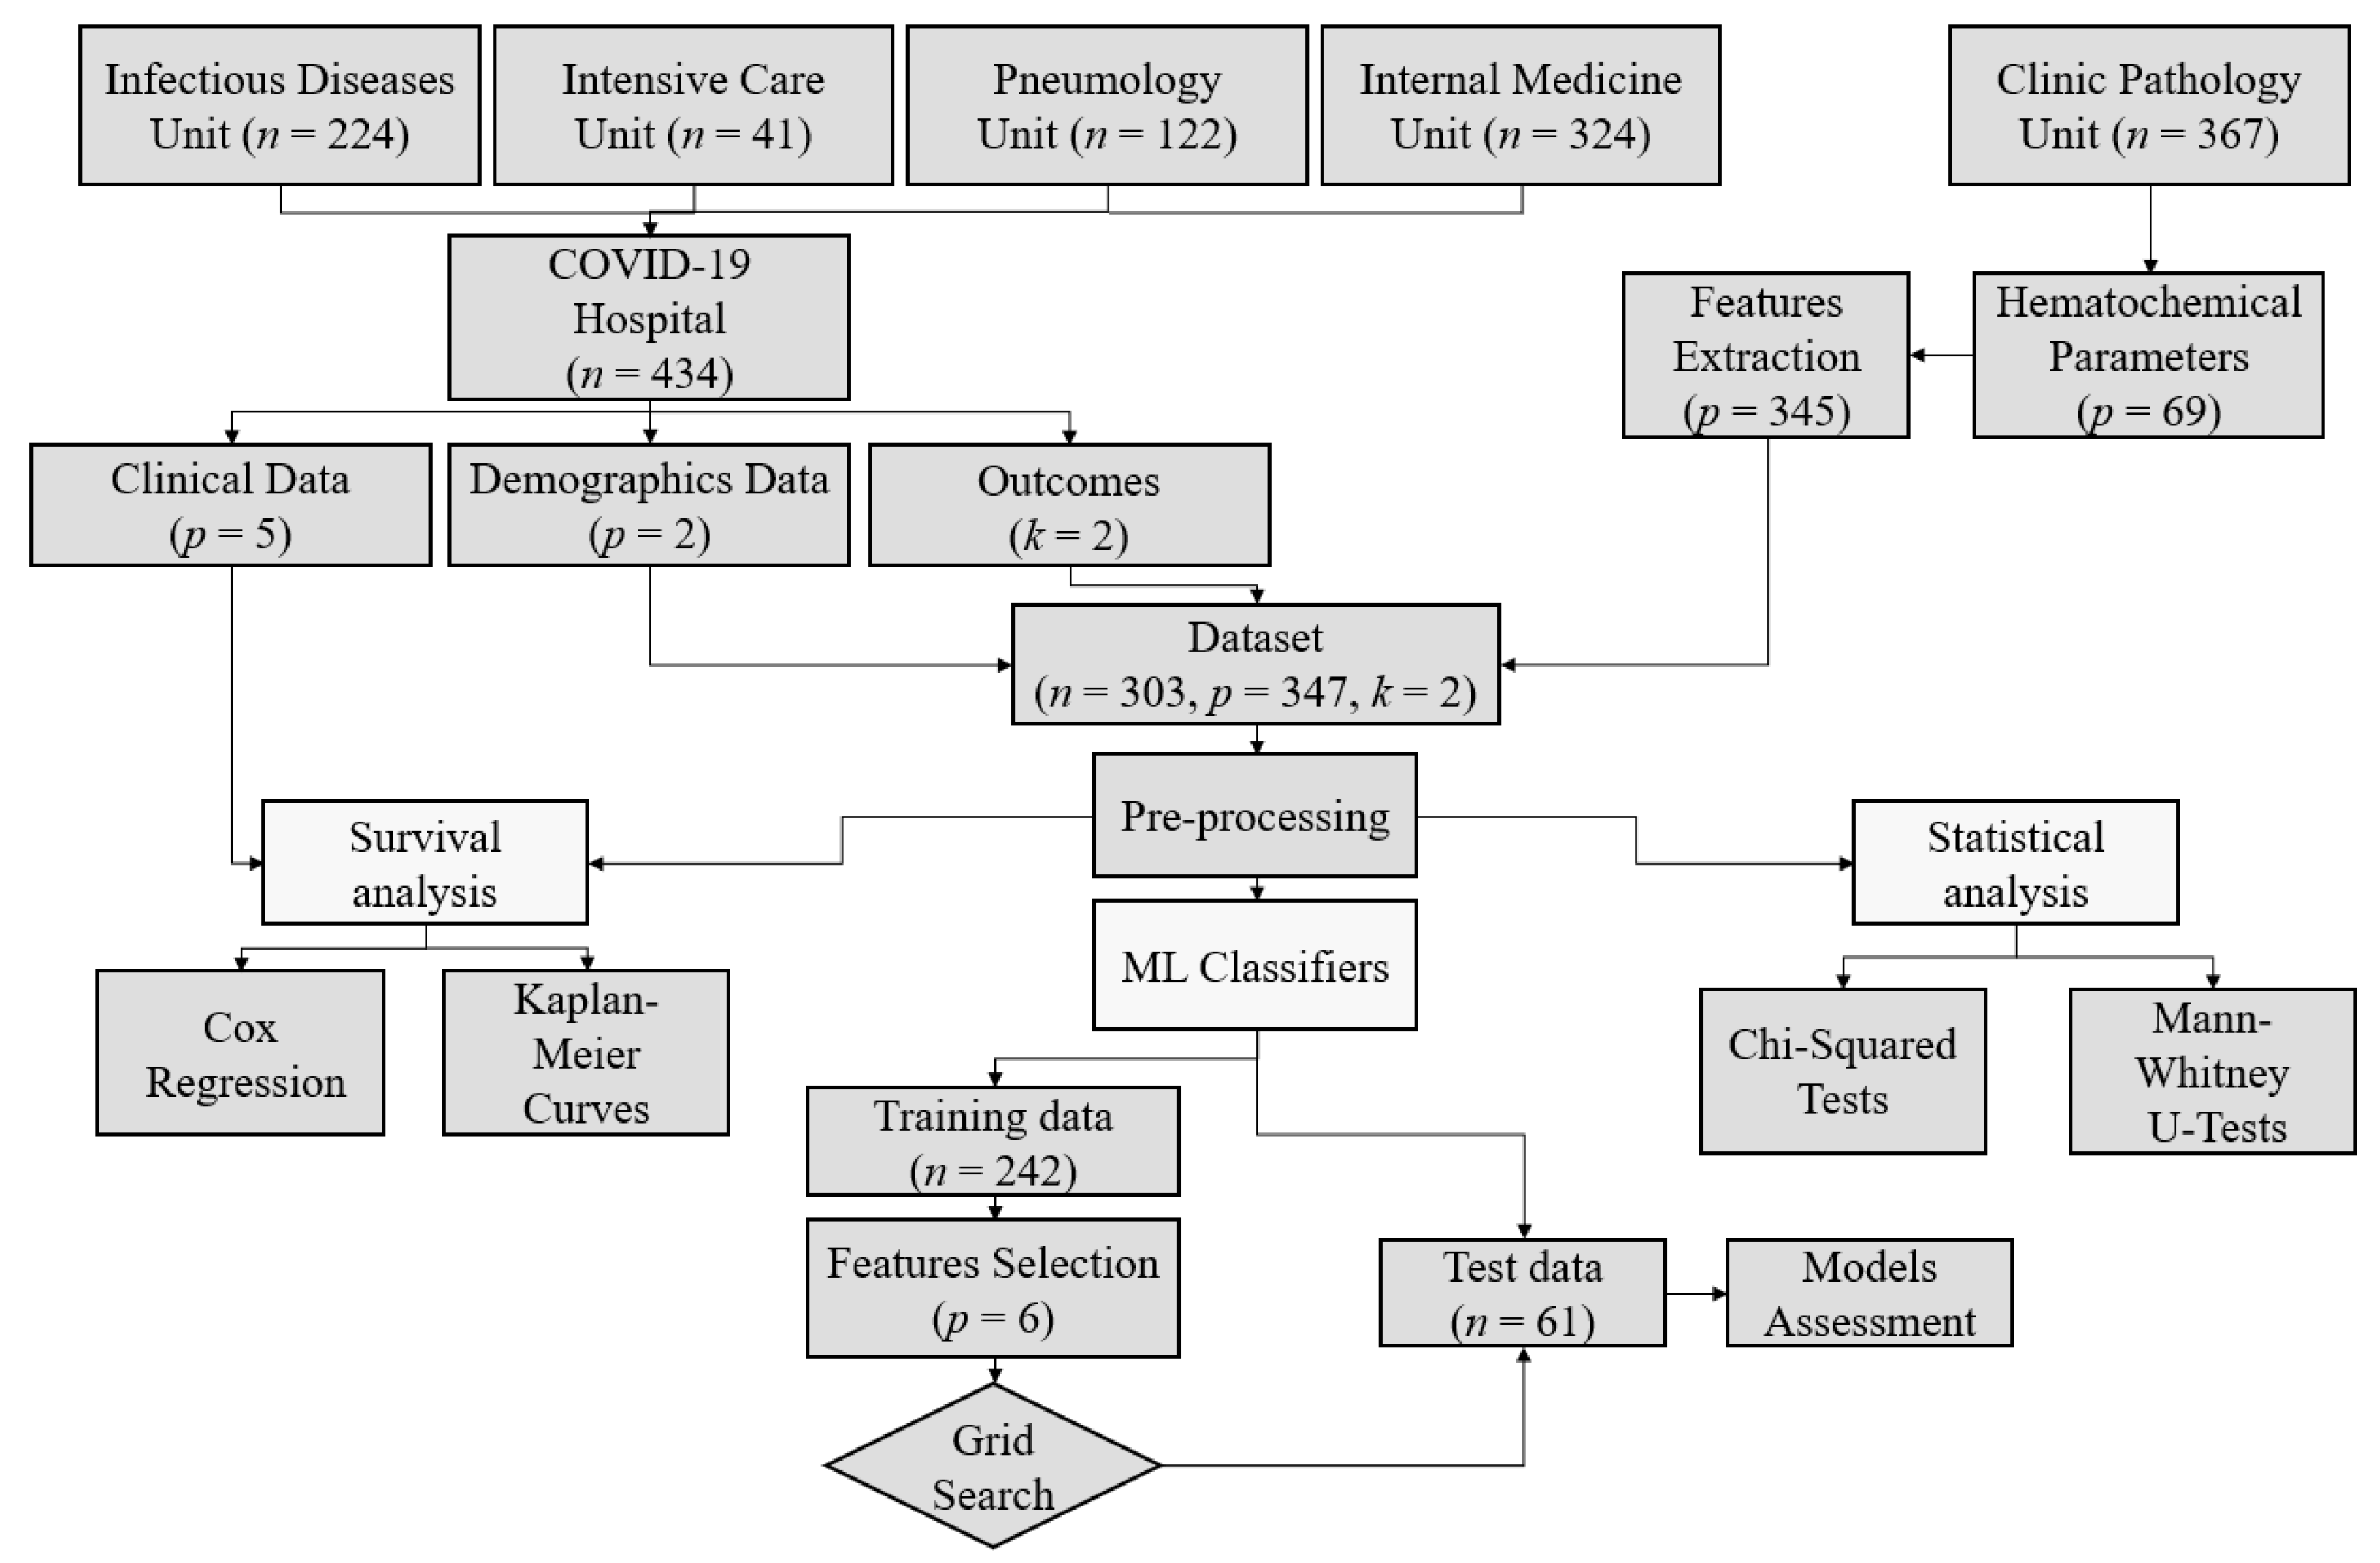
3.1. Data Collection
3.2. Cohort of Study
3.3. Analysis Framework
4. Methods
4.1. Data Pre-Processing and Data Cleaning
4.2. Statistical Analysis
4.3. Survival Analysis
4.4. Feature Selection
4.5. Predictive Models and Machine Learning Techniques
5. Results
5.1. Statistical and Survival Analyses
5.2. Hematochemical Parameters Analysis
5.3. Predictive Models
5.4. Discussion
6. Conclusions and Future Works
Supplementary Materials
Author Contributions
Funding
Institutional Review Board Statement
Informed Consent Statement
Data Availability Statement
Conflicts of Interest
Abbreviations
| ARDS | acute respiratory distress syndrome |
| AST | aspartate aminotransferase |
| AUC | area under the curve |
| CI | confidence interval |
| COVID-19 | Coronavirus disease 2019 |
| CRP | C-reactive protein |
| DL | deep learning |
| DT | decision tree |
| FN | false negative |
| FP | false positive |
| GNB | Gaussian naive Bayes |
| GRU | gated recurrent unit |
| HR | hazard ratio |
| ICU | intensive care unit |
| IQR | interquartile range |
| ISTS | irregularly sampled time series |
| KNN | K-nearest neighbors |
| LSTM | long short-term memory |
| ML | machine learning |
| PCA | principal component analysis |
| RBC | red blood cells |
| RF | random Forest |
| RNN | recurrent neural network |
| ROC | receiver operating characteristic |
| RT-PCR | reverse transcription-polymerase chain reaction |
| SARS-CoV-2 | Severe acute respiratory syndrome coronavirus 2 |
| SVM | Support vector machine |
| T-LSTM | time aware long-short term memory |
| t-SNE | t-distributed stochastic neighbor embedding |
| TN | true negative |
| TP | true positive |
Appendix A. Implementation Details
- Death outcome best configuration:
- –
- DT—criterion: gini; max_depth: 2; splitter: best.
- –
- GNB—var_smoothing: 0.001.
- –
- SVM—C: 1000; kernel: rbf; gamma: 0.001.
- –
- KNN—metric: euclidean; n_neighbors: 5.
- –
- RF—bootstrap: true; criterion: gini; max_depth: 7.
- –
- AdaBoost—learning_rate: 0.01; n_estimators: 70.
- Admission to ICU outcome best configuration:
- –
- DT—criterion: entropy; max_depth: 2; splitter: best.
- –
- GNB—var_smoothing: 0.01. SVM – C: 1000; kernel: linear.
- –
- KNN—metric: euclidean; n_neighbors: 5.
- –
- RF—bootstrap: true; criterion: gini; max_depth: 7.
- –
- AdaBoost—learning_rate: 0.1; n_estimators: 80.
References
- Ciotti, M.; Angeletti, S.; Minieri, M.; Giovannetti, M.; Benvenuto, D.; Pascarella, S.; Sagnelli, C.; Bianchi, M.; Bernardini, S.; Ciccozzi, M. COVID-19 outbreak: An overview. Chemotherapy 2019, 64, 215–223. [Google Scholar] [CrossRef] [PubMed]
- Li, X.; Xu, S.; Yu, M.; Wang, K.; Tao, Y.; Zhou, Y.; Shi, J.; Zhou, M.; Wu, B.; Yang, Z.; et al. Risk factors for severity and mortality in adult COVID-19 inpatients in Wuhan. J. Allergy Clin. Immunol. 2020, 146, 110–118. [Google Scholar] [CrossRef]
- World Health Organization. COVID-19 Weekly Epidemiological Update; World Health Organization: Geneva, Switzerland, 2020. [Google Scholar]
- Booth, A.L.; Abels, E.; McCaffrey, P. Development of a prognostic model for mortality in COVID-19 infection using machine learning. Mod. Pathol. 2021, 34, 522–531. [Google Scholar] [CrossRef]
- Liu, Q.; Xu, K.; Wang, X.; Wang, W. From SARS to COVID-19: What lessons have we learned? J. Infect. Public Health 2020, 13, 1611–1618. [Google Scholar] [CrossRef] [PubMed]
- Du, R.H.; Liang, L.R.; Yang, C.Q.; Wang, W.; Cao, T.Z.; Li, M.; Guo, G.Y.; Du, J.; Zheng, C.L.; Zhu, Q.; et al. Predictors of mortality for patients with COVID-19 pneumonia caused by SARS-CoV-2: A prospective cohort study. Eur. Respir. J. 2020, 55, 2000524. [Google Scholar] [CrossRef] [PubMed] [Green Version]
- Yadaw, A.S.; Li, Y.C.; Bose, S.; Iyengar, R.; Bunyavanich, S.; Pandey, G. Clinical features of COVID-19 mortality: Development and validation of a clinical prediction model. Lancet Digit. Health 2020, 2, e516–e525. [Google Scholar] [CrossRef]
- Yoshida, Y.; Gillet, S.A.; Brown, M.I.; Zu, Y.; Wilson, S.M.; Ahmed, S.J.; Tirumalasetty, S.; Lovre, D.; Krousel-Wood, M.; Denson, J.L.; et al. Clinical characteristics and outcomes in women and men hospitalized for coronavirus disease 2019 in New Orleans. Biol. Sex Differ. 2021, 12, 1–11. [Google Scholar] [CrossRef] [PubMed]
- Nachtigall, I.; Lenga, P.; Jóźwiak, K.; Thürmann, P.; Meier-Hellmann, A.; Kuhlen, R.; Brederlau, J.; Bauer, T.; Tebbenjohanns, J.; Schwegmann, K.; et al. Clinical course and factors associated with outcomes among 1904 patients hospitalized with COVID-19 in Germany: An observational study. Clin. Microbiol. Infect. 2020, 26, 1663–1669. [Google Scholar] [CrossRef]
- Banoei, M.M.; Dinparastisaleh, R.; Zadeh, A.V.; Mirsaeidi, M. Machine-learning-based COVID-19 mortality prediction model and identification of patients at low and high risk of dying. Crit. Care 2021, 25, 1–14. [Google Scholar] [CrossRef]
- Zuccaro, V.; Celsa, C.; Sambo, M.; Battaglia, S.; Sacchi, P.; Biscarini, S.; Valsecchi, P.; Pieri, T.C.; Gallazzi, I.; Colaneri, M.; et al. Competing-risk analysis of coronavirus disease 2019 in-hospital mortality in a Northern Italian centre from SMAtteo COvid19 REgistry (SMACORE). Sci. Rep. 2021, 11, 1137. [Google Scholar] [CrossRef]
- Tjendra, Y.; Al Mana, A.F.; Espejo, A.P.; Akgun, Y.; Millan, N.C.; Gomez-Fernandez, C.; Cray, C. Predicting disease severity and outcome in COVID-19 patients: A review of multiple biomarkers. Arch. Pathol. Lab. Med. 2020, 144, 1465–1474. [Google Scholar] [CrossRef]
- Zhou, Y.H.; Li, H.; Qin, Y.Y.; Yan, X.F.; Lu, Y.Q.; Liu, H.L.; Ye, S.K.; Wan, Y.; Zhang, L.; Harypursat, V.; et al. Predictive factors of progression to severe COVID-19. Open Med. 2020, 15, 805–814. [Google Scholar] [CrossRef] [PubMed]
- Niu, Y.; Zhan, Z.; Li, J.; Shui, W.; Wang, C.; Xing, Y.; Zhang, C. Development of a predictive model for mortality in hospitalized patients with COVID-19. Disaster Med. Public Health Prep. 2021, 1–9. [Google Scholar] [CrossRef] [PubMed]
- Bevilacqua, V.; Altini, N.; Prencipe, B.; Brunetti, A.; Villani, L.; Sacco, A.; Morelli, C.; Ciaccia, M.; Scardapane, A. Lung Segmentation and Characterization in COVID-19 Patients for Assessing Pulmonary Thromboembolism: An Approach Based on Deep Learning and Radiomics. Electronics 2021, 10, 2475. [Google Scholar] [CrossRef]
- Deif, M.A.; Solyman, A.A.A.; Alsharif, M.H.; Uthansakul, P. Automated Triage System for Intensive Care Admissions during the COVID-19 Pandemic Using Hybrid XGBoost-AHP Approach. Sensors 2021, 21, 6379. [Google Scholar] [CrossRef] [PubMed]
- Khan, M.A.; Alhaisoni, M.; Tariq, U.; Hussain, N.; Majid, A.; Damaševičius, R.; Maskeliūnas, R. COVID-19 Case Recognition from Chest CT Images by Deep Learning, Entropy-Controlled Firefly Optimization, and Parallel Feature Fusion. Sensors 2021, 21, 7286. [Google Scholar] [CrossRef] [PubMed]
- Youssef Ali Amer, A.; Wouters, F.; Vranken, J.; Dreesen, P.; de Korte-de Boer, D.; van Rosmalen, F.; van Bussel, B.C.T.; Smit-Fun, V.; Duflot, P.; Guiot, J.; et al. Vital Signs Prediction for COVID-19 Patients in ICU. Sensors 2021, 21, 8131. [Google Scholar] [CrossRef] [PubMed]
- Shorten, C.; Khoshgoftaar, T.M.; Furht, B. Deep Learning applications for COVID-19. J. Big Data 2021, 8, 18. [Google Scholar] [CrossRef]
- Sun, C.; Hong, S.; Song, M.; Li, H. A review of deep learning methods for irregularly sampled medical time series data. arXiv 2020, arXiv:2010.12493. [Google Scholar]
- Yan, L.; Zhang, H.T.; Goncalves, J.; Xiao, Y.; Wang, M.; Guo, Y.; Sun, C.; Tang, X.; Jing, L.; Zhang, M.; et al. An interpretable mortality prediction model for COVID-19 patients. Nat. Mach. Intell. 2020, 2, 283–288. [Google Scholar] [CrossRef]
- Baytas, I.M.; Xiao, C.; Zhang, X.; Wang, F.; Jain, A.K.; Zhou, J. Patient subtyping via time-aware LSTM networks. In Proceedings of the 23rd ACM SIGKDD International Conference on Knowledge Discovery and Data Mining, Halifax, NS, Canada, 13–17 August 2017; pp. 65–74. [Google Scholar]
- Che, Z.; Purushotham, S.; Cho, K.; Sontag, D.; Liu, Y. Recurrent neural networks for multivariate time series with missing values. Sci. Rep. 2018, 8, 6085. [Google Scholar] [CrossRef] [PubMed] [Green Version]
- Johnson, A.E.; Dunkley, N.; Mayaud, L.; Tsanas, A.; Kramer, A.A.; Clifford, G.D. Patient specific predictions in the intensive care unit using a Bayesian ensemble. In Proceedings of the 2012 Computing in Cardiology, Krakow, Poland, 9–12 September 2012; pp. 249–252. [Google Scholar]
- Troyanskaya, O.; Cantor, M.; Sherlock, G.; Brown, P.; Hastie, T.; Tibshirani, R.; Botstein, D.; Altman, R.B. Missing value estimation methods for DNA microarrays. Bioinformatics 2001, 17, 520–525. [Google Scholar] [CrossRef] [Green Version]
- Pedregosa, F.; Varoquaux, G.; Gramfort, A.; Michel, V.; Thirion, B.; Grisel, O.; Blondel, M.; Prettenhofer, P.; Weiss, R.; Dubourg, V.; et al. Scikit-learn: Machine learning in Python. J. Mach. Learn. Res. 2011, 12, 2825–2830. [Google Scholar]
- Di Leo, G.; Sardanelli, F. Statistical significance: P value, 0.05 threshold, and applications to radiomics—Reasons for a conservative approach. Eur. Radiol. Exp. 2020, 4, 1–8. [Google Scholar] [CrossRef] [Green Version]
- Jager, K.J.; Van Dijk, P.C.; Zoccali, C.; Dekker, F.W. The analysis of survival data: The Kaplan–Meier method. Kidney Int. 2008, 74, 560–565. [Google Scholar] [CrossRef] [Green Version]
- Van Dijk, P.C.; Jager, K.J.; Zwinderman, A.H.; Zoccali, C.; Dekker, F.W. The analysis of survival data in nephrology: Basic concepts and methods of Cox regression. Kidney Int. 2008, 74, 705–709. [Google Scholar] [CrossRef] [Green Version]
- Kumar, V.; Minz, S. Feature selection: A literature review. SmartCR 2014, 4, 211–229. [Google Scholar] [CrossRef]
- Bonney, G.E. Logistic regression for dependent binary observations. Biometrics 1987, 43, 951–973. [Google Scholar] [CrossRef]
- Yoo, S.H.; Geng, H.; Chiu, T.L.; Yu, S.K.; Cho, D.C.; Heo, J.; Choi, M.S.; Choi, I.H.; Cung Van, C.; Nhung, N.V.; et al. Deep learning-based decision-tree classifier for COVID-19 diagnosis from chest X-ray imaging. Front. Med. 2020, 7, 427. [Google Scholar] [CrossRef] [PubMed]
- Rochmawati, N.; Hidayati, H.B.; Yamasari, Y.; Yustanti, W.; Rakhmawati, L.; Tjahyaningtijas, H.P.; Anistyasari, Y. Covid Symptom Severity Using Decision Tree. In Proceedings of the 2020 Third International Conference on Vocational Education and Electrical Engineering (ICVEE), Surabaya, Indonesia, 3–4 October 2020; pp. 1–5. [Google Scholar]
- Iwendi, C.; Bashir, A.K.; Peshkar, A.; Sujatha, R.; Chatterjee, J.M.; Pasupuleti, S.; Mishra, R.; Pillai, S.; Jo, O. COVID-19 patient health prediction using boosted random forest algorithm. Front. Public Health 2020, 8, 357. [Google Scholar] [CrossRef]
- Wang, L. C-reactive protein levels in the early stage of COVID-19. Med. Mal. Infect. 2020, 50, 332–334. [Google Scholar] [CrossRef] [PubMed]
- Sudirman, I.; Nugraha, D. Naive Bayes classifier for predicting the factors that influence death due to covid-19 in China. J. Theor. Appl. Inf. Technol. 2020, 98, 1686–1696. [Google Scholar]
- Guhathakurata, S.; Kundu, S.; Chakraborty, A.; Banerjee, J.S. A novel approach to predict COVID-19 using support vector machine. In Data Science for COVID-19; Elsevier: Amsterdam, The Netherlands, 2021; pp. 351–364. [Google Scholar]
- Theerthagiri, P.; Jeena Jacob, I.; Usha Ruby, A.; Yendapalli, V. Prediction of COVID-19 Possibilities using K-Nearest Neighbour Classification Algorithm. Int. J. Cur. Res. Rev. Vol. 2021, 13, 156. [Google Scholar] [CrossRef]
- Chung, H.; Ko, H.; Kang, W.S.; Kim, K.W.; Lee, H.; Park, C.; Song, H.O.; Choi, T.Y.; Seo, J.H.; Lee, J. Prediction and Feature Importance Analysis for Severity of COVID-19 in South Korea Using Artificial Intelligence: Model Development and Validation. J. Med. Internet Res. 2021, 23, e27060. [Google Scholar] [CrossRef] [PubMed]
- Nemati, M.; Ansary, J.; Nemati, N. Machine-learning approaches in COVID-19 survival analysis and discharge-time likelihood prediction using clinical data. Patterns 2020, 1, 100074. [Google Scholar] [CrossRef] [PubMed]
- Liashchynskyi, P.; Liashchynskyi, P. Grid search, random search, genetic algorithm: A big comparison for NAS. arXiv 2019, arXiv:1912.06059. [Google Scholar]
- Wenwen, L.; Xiaoxue, X.; Fu, L.; Yu, Z. Application of improved grid search algorithm on SVM for classification of tumor gene. Int. J. Multimed. Ubiquitous Eng. 2014, 9, 181–188. [Google Scholar]
- Mullin, M.D.; Sukthankar, R. Complete Cross-Validation for Nearest Neighbor Classifiers; ICML’00: Proceedings of the Seventeenth International Conference on Machine Learning; Morgan Kaufmann Publishers Inc.: San Francisco, CA, USA, 2000; pp. 639–646. [Google Scholar] [CrossRef]
- Van der Maaten, L.; Hinton, G. Visualizing data using t-SNE. J. Mach. Learn. Res. 2008, 9, 2579–2605. [Google Scholar]
- Pepys, M.B. C-reactive protein predicts outcome in COVID-19: Is it also a therapeutic target? Eur. Heart J. 2021, 42, 2280–2283. [Google Scholar] [CrossRef] [PubMed]
- Stringer, D.; Braude, P.; Myint, P.K.; Evans, L.; Collins, J.T.; Verduri, A.; Quinn, T.J.; Vilches-Moraga, A.; Stechman, M.J.; Pearce, L.; et al. The role of C-reactive protein as a prognostic marker in COVID-19. Int. J. Epidemiol. 2021, 50, 420–429. [Google Scholar] [CrossRef]
- Taneri, P.E.; Gómez-Ochoa, S.A.; Llanaj, E.; Raguindin, P.F.; Rojas, L.Z.; Roa-Díaz, Z.M.; Salvador, D.; Groothof, D.; Minder, B.; Kopp-Heim, D.; et al. Anemia and iron metabolism in COVID-19: A systematic review and meta-analysis. Eur. J. Epidemiol. 2020, 35, 763–773. [Google Scholar] [CrossRef]
- Reva, I.; Yamamoto, T.; Rasskazova, M.; Lemeshko, T.; Usov, V.; Krasnikov, Y.; Fisenko, A.; Kotsyurbiy, E.; Tudakov, V.; Tsegolnik, E.; et al. Erythrocytes as a target of sars cov-2 in pathogenesis of COVID-19. Arch. Euromedica 2020, 10, 5–11. [Google Scholar] [CrossRef]
- Mortaz, E.; Malkmohammad, M.; Jamaati, H.; Naghan, P.A.; Hashemian, S.M.; Tabarsi, P.; Varahram, M.; Zaheri, H.; Chousein, E.G.U.; Folkerts, G.; et al. Silent hypoxia: Higher NO in red blood cells of COVID-19 patients. BMC Pulm. Med. 2020, 20, 269. [Google Scholar]
- Paliogiannis, P.; Zinellu, A. Bilirubin levels in patients with mild and severe Covid-19: A pooled analysis. Liver Int. 2020, 40, 1787–1788. [Google Scholar] [CrossRef]
- Liu, Z.; Li, J.; Long, W.; Zeng, W.; Gao, R.; Zeng, G.; Chen, D.; Wang, S.; Li, Q.; Hu, D.; et al. Bilirubin levels as potential indicators of disease severity in coronavirus disease patients: A retrospective cohort study. Front. Med. 2020, 7, 598870. [Google Scholar] [CrossRef]
- Lv, X.H.; Yang, J.L.; Deng, K. Letter to the Editor: COVID-19–Related Liver Injury: The Interpretation for Aspartate Aminotransferase Needs to Be Cautious. Hepatology 2021, 73, 874. [Google Scholar] [CrossRef]
- Wang, D.; Hu, B.; Hu, C.; Zhu, F.; Liu, X.; Zhang, J.; Wang, B.; Xiang, H.; Cheng, Z.; Xiong, Y.; et al. Clinical characteristics of 138 hospitalized patients with 2019 novel coronavirus–infected pneumonia in Wuhan, China. JAMA 2020, 323, 1061–1069. [Google Scholar] [CrossRef]
- Pal, R.; Ram, S.; Zohmangaihi, D.; Biswas, I.; Suri, V.; Yaddanapudi, L.N.; Malhotra, P.; Soni, S.L.; Puri, G.D.; Bhalla, A.; et al. High prevalence of hypocalcemia in non-severe COVID-19 patients: A retrospective case-control study. Front. Med. 2020, 7, 590805. [Google Scholar] [CrossRef] [PubMed]
- Cappellini, F.; Brivio, R.; Casati, M.; Cavallero, A.; Contro, E.; Brambilla, P. Low levels of total and ionized calcium in blood of COVID-19 patients. Clin. Chem. Lab. Med. (CCLM) 2020, 58, e171–e173. [Google Scholar] [CrossRef] [PubMed]
- Sun, J.K.; Zhang, W.H.; Zou, L.; Liu, Y.; Li, J.J.; Kan, X.H.; Dai, L.; Shi, Q.K.; Yuan, S.T.; Yu, W.K.; et al. Serum calcium as a biomarker of clinical severity and prognosis in patients with coronavirus disease 2019. Aging (Albany NY) 2020, 12, 11287. [Google Scholar] [CrossRef] [PubMed]
- Osman, W.; Al Fahdi, F.; Al Salmi, I.; Al Khalili, H.; Gokhale, A.; Khamis, F. Serum Calcium and Vitamin D levels: Correlation with severity of COVID-19 in hospitalized patients in Royal Hospital, Oman. Int. J. Infect. Dis. 2021, 107, 153–163. [Google Scholar] [CrossRef] [PubMed]
- Delanghe, J.; Speeckaert, M.; De Buyzere, M. On the use of lymphocyte to neutrophil ratios in laboratory medicine. Clin. Chim. Acta 2020, 510, 26–27. [Google Scholar] [CrossRef] [PubMed]
- Zeng, Z.Y.; Feng, S.D.; Chen, G.P.; Wu, J.N. Predictive value of the neutrophil to lymphocyte ratio for disease deterioration and serious adverse outcomes in patients with COVID-19: A prospective cohort study. BMC Infect. Dis. 2021, 21, 80. [Google Scholar] [CrossRef]
- Qin, C.; Zhou, L.; Hu, Z.; Zhang, S.; Yang, S.; Tao, Y.; Xie, C.; Ma, K.; Shang, K.; Wang, W.; et al. Dysregulation of immune response in patients with coronavirus 2019 (COVID-19) in Wuhan, China. Clin. Infect. Dis. 2020, 71, 762–768. [Google Scholar] [CrossRef]
- Williams, R.J.; Zipser, D. A learning algorithm for continually running fully recurrent neural networks. Neural Comput. 1989, 1, 270–280. [Google Scholar] [CrossRef]
- Hochreiter, S.; Schmidhuber, J. Long short-term memory. Neural Comput. 1997, 9, 1735–1780. [Google Scholar] [CrossRef]
- Sun, C.; Hong, S.; Song, M.; Li, H.; Wang, Z. Predicting COVID-19 disease progression and patient outcomes based on temporal deep learning. BMC Med. Inform. Decis. Mak. 2021, 21, 45. [Google Scholar] [CrossRef] [PubMed]


| Authors | Materials | Methods | ||||
|---|---|---|---|---|---|---|
| Sample Size | Location | Period | Predictors | Outcomes | Techniques | |
| Yoshida et al. | 776 patients | New Orleans, LA | 27 February– 15 July 2020 | Demographics, comorbidities, presenting symptoms, laboratory results | ICU admission, invasive mechanical ventilation, in-hospital death | Chi-square test, Fischer’s exact test, two tailed t test; univariate and multivariate logistic regression. |
| Nachtigall et al. | 1904 patients | Network of Germany Hospitals | 12 February– 12 June 2020 | Demographics, comorbidities | ICU admission, invasive mechanical ventilation, in-hospital death | Descriptive statistics; survival analysis, multivariate proportional hazard models. |
| Banoei et al. | 250 patients | Miami, FL, USA | since June 2020 | Clinical features, comorbidities, blood markers | In-hospital death | SIMPLS (statistically inspired modification of partial least square), PCA, Clustering, Latent class analysis (LCA) |
| Zuccaro et al. | 426 patients | Lombardy, Italy | 21 February– 30 March 2020 | Demographics, comorbidities, blood markers, treatment, time of hospital admission | In-hospital death, discharge | Student t test, Mann–Whitney U test, Chi-square test, DeLong method; Fine and Gray model |
| Zhou et al. | 116 patients | Chongqing, China | 24 January– 7 February 2020 | Demographics, epidemiological information, clinical manifestation, laboratory test results | Disease progression from milder to severe COVID-19 | Chi-square test, Fischer’s exact test, Mann–Whitney U test; Kaplan- Meier; Cox regression. |
| Niu et al. | 150 patients | Huanggang, China | 23 January– 5 March 2020 | Epidemiological and demographic characteristics, underlying diseases, clinical manifestations, laboratory findings, chest computed tomography (CT) imaging | In-hospital death | Chi-square test, Fischer’s exact test, Mann–Whitney U test; multivariate logistic analysis; nomogram. |
| Total | Deceased | Survived | Admitted to the ICU | p-Value (Mortality) | p-Value (ICU) | |
|---|---|---|---|---|---|---|
| Patients | 303 | 85 (28.1) | 218 (71.9) | 74 (24.4) | ||
| Sex | 0.6220 | 0.0384 | ||||
| Male | 184 (60.7) | 54 (29.3) | 130 (70.7) | 53 (28.8) | ||
| Female | 119 (39.3) | 31 (26.1) | 88 (73.9) | 21 (17.6) | ||
| Age Classes | <0.001 | <0.001 | ||||
| Under 55 | 90 (29.7) | 10 (11.1) | 80 (88.9) | 13 (14.4) | ||
| 55–65 | 72 (23.8) | 10 (13.9) | 62 (86.1) | 19 (26.4) | ||
| 65–80 | 74 (24.4) | 36 (48.6) | 38 (51.4) | 34 (45.9) | ||
| Over 80 | 67 (22.1) | 29 (43.3) | 38 (56.7) | 8 (11.9) |
| Hematochemical Test | Survived | Deceased | Not Admitted to ICU | Admitted to ICU | |
|---|---|---|---|---|---|
| Ionized calcium max | <4.6 mg/dL | 170 (90.4) | 66 (82.5) | 185 (94.9) | 51 (69.9) |
| 4.6–5.3 mg/dL | 17 (9.0) | 13 (16.2) | 9 (4.6) | 21 (28.8) | |
| >5.3 mg/dL | 1 (0.5) | 1 (1.2) | 1 (0.5) | 1 (1.4) | |
| 188 | 80 | 195 | 73 | ||
| CRP mean | ≤2.9 mg/L | 18 (8.3) | 0 (0.0) | 17 (7.5) | 1 (1.4) |
| >2.9 mg/L | 199 (91.7) | 84 (100.0) | 211 (92.5) | 72 (98.6) | |
| 217 | 84 | 228 | 73 | ||
| CRP min | ≤2.9 mg/L | 127 (58.5) | 3 (3.6) | 113 (49.6) | 17 (23.3) |
| >2.9 mg/L | 90 (41.5) | 81 (96.4) | 115 (50.4) | 56 (76.7) | |
| 217 | 84 | 228 | 73 | ||
| Total bilirubin min | <0.20 mg/dL | 4 (1.9) | 0 (0.0) | 4 (1.8) | 0 (0.0) |
| 0.20–1.00 mg/dL | 206 (97.2) | 76 (90.5) | 213 (95.5) | 69 (94.5) | |
| >1.00 mg/dL | 2 (0.9) | 8 (9.5) | 6 (2.7) | 4 (5.5) | |
| 212 | 84 | 223 | 73 | ||
| Erythrocytes max | <4.54 (M) <3.85 (F) | 52 (23.9) | 38 (45.2) | 60 (26.2) | 30 (41.1) |
| 4.54–5.78 (M) 3.85–5.16 (F) | 155 (71.1) | 39 (46.4) | 154 (67.2) | 40 (54.8) | |
| >5.78 (M) >5.16 (F) | 11 (5.0) | 7 (8.3) | 15 (6.6) | 3 (4.1) | |
| 218 | 84 | 229 | 73 | ||
| AST min | <15 U/L | 37 (17.1) | 7 (8.3) | 31 (13.7) | 13 (17.8) |
| 15–37 U/L | 160 (74.1) | 47 (56.0) | 164 (72.2) | 43 (58.9) | |
| >37 U/L | 19 (8.8) | 30 (35.7) | 32 (14.1) | 17 (23.3) | |
| 216 | 84 | 227 | 73 | ||
| Hematochemical Test | Mean ± Std | Median ± IQR | Min–Max | N | p-Value U Test | Logit Coeff | |
|---|---|---|---|---|---|---|---|
| Ionized calcium max | Overall | 4.2 ± 0.4 | 4.1 ± 0.3 | 3.2–7.7 | 268 | ||
| Survived | 4.2 ± 0.3 | 4.1 ± 0.3 | 3.2–5.4 | 188 | 0.304 | −3.178 | |
| Deceased | 4.2 ± 0.5 | 4.2 ± 0.5 | 3.5–7.7 | 80 | |||
| Not admitted to ICU | 4.1 ± 0.3 | 4.1 ± 0.2 | 3.2–5.4 | 195 | 0.003 | 5.629 | |
| Admitted to ICU | 4.4 ± 0.5 | 4.3 ± 0.4 | 3.6–7.7 | 73 | |||
| CRP mean | Overall | 66.9 ± 69.7 | 42.5 ± 76.4 | 2.9–332.0 | 301 | ||
| Survived | 36.8 ± 32.9 | 30.2 ± 38.8 | 2.9–169.4 | 217 | <0.001 | 4.670 | |
| Deceased | 144.7 ± 79.0 | 137.0 ± 94.9 | 3.9–332.0 | 84 | |||
| Not admitted to ICU | 47.3 ± 53.0 | 31.4 ± 49.8 | 2.9–332.0 | 228 | <0.001 | 4.169 | |
| Admitted to ICU | 128.1 ± 79.9 | 119.5 ± 92.3 | 2.9–330.2 | 73 | |||
| CRP min | Overall | 29.1 ± 52.5 | 4.6 ± 19.9 | 2.9–301.0 | 301 | ||
| Survived | 8.0 ± 15.2 | 2.9 ± 3.9 | 2.9–142.0 | 217 | <0.001 | 3.252 | |
| Deceased | 83.4 ± 72.2 | 63.8 ± 119.2 | 2.9–301.0 | 84 | |||
| Not admitted to ICU | 19.4 ± 41.2 | 3.1 ± 7.8 | 2.9–301.0 | 228 | <0.001 | 7.854 | |
| Admitted to ICU | 59.2 ± 70.2 | 19.8 ± 93.5 | 2.9–295.0 | 73 | |||
| Total bilirubin min | Overall | 0.47 ± 0.40 | 0.40 ± 0.20 | 0.10–5.90 | 296 | ||
| Survived | 0.41 ± 0.20 | 0.40 ± 0.20 | 0.10–1.60 | 212 | <0.001 | 2.999 | |
| Deceased | 0.62 ± 0.66 | 0.50 ± 0.30 | 0.20–5.90 | 84 | |||
| Not admitted to ICU | 0.43 ± 0.24 | 0.40 ± 0.20 | 0.10–1.60 | 223 | 0.009 | 4.104 | |
| Admitted to ICU | 0.58 ± 0.69 | 0.40 ± 0.20 | 0.20–5.90 | 73 | |||
| Erythrocytes max | Overall | 4.5 ± 0.6 | 4.6 ± 0.8 | 2.6–6.8 | 302 | ||
| Survived | 4.6 ± 0.5 | 4.6 ± 0.6 | 3.1–6.6 | 218 | 0.005 | 2.908 | |
| Deceased | 4.4 ± 0.8 | 4.3 ± 0.9 | 2.6–6.8 | 84 | |||
| Not admitted to ICU | 4.6 ± 0.6 | 4.6 ± 0.7 | 2.6–6.8 | 229 | 0.588 | 4.105 | |
| Admitted to ICU | 4.5 ± 0.6 | 4.5 ± 0.8 | 3.3–6.2 | 73 | |||
| AST min | Overall | 26.8 ± 15.0 | 23.0 ± 15.0 | 7.0–115.0 | 300 | ||
| Survived | 23.5 ± 10.5 | 21.0 ± 11.3 | 7.0–74.0 | 216 | <0.001 | 3.313 | |
| Deceased | 35.3 ± 20.7 | 31.0 ± 22.3 | 8.0–115.0 | 84 | |||
| Not admitted to ICU | 25.9 ± 14.0 | 22.0 ± 14.0 | 9.0–115.0 | 227 | 0.279 | 7.477 | |
| Admitted to ICU | 29.4 ± 17.6 | 24.0 ± 20.0 | 7.0–89.0 | 73 | |||
| Hematochemical Test | Normality Range | log(HR) | 95% CI log(HR) | HR | 95% CI HR | p |
|---|---|---|---|---|---|---|
| CRP mean | <2.9 mg/L | Not significant | ||||
| 1.061 | [−0.957, 3.080] | 2.890 | [0.384, 21.757] | 0.303 | ||
| CRP min | <2.9 mg/L | 2.888 | [1.879, 3.897] | 17.963 | [6.548, 49.277] | <0.001 |
| 0.582 | [0.000, 1.163] | 1.789 | [1.000, 3.200] | 0.050 | ||
| Erythrocytes max | 4.54–5.78 (M) 3.85–5.16 (F) | 0.568 | [0.132, 1.004] | 1.765 | [1.141, 2.729] | 0.011 |
| 0.393 | [−0.111, 0.897] | 1.481 | [0.895, 2.452] | 0.127 | ||
| Total bilirubin min | 0.20–1.00 mg/dL | 0.435 | [−0.317, 1.188] | 1.545 | [0.728, 3.279] | 0.257 |
| 0.321 | [−0.712, 1.355] | 1.379 | [0.491, 3.876] | 0.542 | ||
| AST min | 15–37 U/L | 0.281 | [−0.161, 0.722] | 1.324 | [0.851, 2.059] | 0.213 |
| 0.192 | [−0.290, 0.674] | 1.211 | [0.748, 1.962] | 0.436 | ||
| Ionized calcium max | 4.6–5.3 mg/dL | 0.098 | [−0.497, 0.692] | 1.103 | [0.609, 1.998] | 0.747 |
| −1.293 | [−1.843, −0.744] | 0.274 | [0.158, 0.475] | <0.001 | ||
Publisher’s Note: MDPI stays neutral with regard to jurisdictional claims in published maps and institutional affiliations. |
© 2021 by the authors. Licensee MDPI, Basel, Switzerland. This article is an open access article distributed under the terms and conditions of the Creative Commons Attribution (CC BY) license (https://creativecommons.org/licenses/by/4.0/).
Share and Cite
Altini, N.; Brunetti, A.; Mazzoleni, S.; Moncelli, F.; Zagaria, I.; Prencipe, B.; Lorusso, E.; Buonamico, E.; Carpagnano, G.E.; Bavaro, D.F.; et al. Predictive Machine Learning Models and Survival Analysis for COVID-19 Prognosis Based on Hematochemical Parameters. Sensors 2021, 21, 8503. https://doi.org/10.3390/s21248503
Altini N, Brunetti A, Mazzoleni S, Moncelli F, Zagaria I, Prencipe B, Lorusso E, Buonamico E, Carpagnano GE, Bavaro DF, et al. Predictive Machine Learning Models and Survival Analysis for COVID-19 Prognosis Based on Hematochemical Parameters. Sensors. 2021; 21(24):8503. https://doi.org/10.3390/s21248503
Chicago/Turabian StyleAltini, Nicola, Antonio Brunetti, Stefano Mazzoleni, Fabrizio Moncelli, Ilenia Zagaria, Berardino Prencipe, Erika Lorusso, Enrico Buonamico, Giovanna Elisiana Carpagnano, Davide Fiore Bavaro, and et al. 2021. "Predictive Machine Learning Models and Survival Analysis for COVID-19 Prognosis Based on Hematochemical Parameters" Sensors 21, no. 24: 8503. https://doi.org/10.3390/s21248503
APA StyleAltini, N., Brunetti, A., Mazzoleni, S., Moncelli, F., Zagaria, I., Prencipe, B., Lorusso, E., Buonamico, E., Carpagnano, G. E., Bavaro, D. F., Poliseno, M., Saracino, A., Schirinzi, A., Laterza, R., Di Serio, F., D’Introno, A., Pesce, F., & Bevilacqua, V. (2021). Predictive Machine Learning Models and Survival Analysis for COVID-19 Prognosis Based on Hematochemical Parameters. Sensors, 21(24), 8503. https://doi.org/10.3390/s21248503