1. Introduction
As reconstruction efforts in Afghanistan continue, the need for an accounting of the country's water balance is necessary to address current and future water use scenarios. One aspect of the water balance equation involves an assessment of the water demands by irrigated agricultural lands. Since large and widely dispersed populations depend on rainfed and irrigated agriculture and pastoralism, large-area monitoring and forecasting are important inputs to such assessments. The Famine Early Warning Systems Network (FEWS NET), an activity funded by the United States Agency for International Development (USAID), employs a crop water-balance model (based on the water demand and supply at a given location) to monitor the performance of rainfed agriculture and forecast relative production before the end of the crop growing season. Although a crop water-balance approach is effective for monitoring rainfed agriculture [
1,
2], irrigated agriculture is best monitored by other methods since the supply (water used for irrigation) is usually generated from upstream areas, which are distant from the demand location.
The surface energy balance method has been successfully applied by several researchers [
3-
6] to estimate crop water use in irrigated areas. Their approach requires solving the energy balance equation at the surface (
Equation 1) where the actual evapotranspiration (ETa) is calculated as the residual of the difference between the net radiation to the surface and losses due to the sensible heat flux (energy used to heat the air) and ground heat flux (energy stored in the soil and vegetation).
LE = Latent heat flux (energy consumed by evapotranspiration) (W/m2)
Rn = Net radiation at the surface (W/m2)
G = Ground heat flux (W/ m2)
H = Sensible heat flux (W/ m2)
The estimation of each of these terms from remotely sensed imagery requires high quality data sets. Allen et al. [
3] described the several steps required to estimate actual ET using the surface energy-balance method that employs the
hot and
cold pixel approach of Bastiaanssen et al. [
4]. In summary, for the net radiation term, data on incoming and outgoing radiation and the associated surface albedo and emissivity fractions for shortwave and long wave bands are required. The ground heat flux is estimated using surface temperature, albedo, and normalized difference vegetation index (NDVI). The sensible heat flux is estimated as a function of the temperature gradient above the surface, surface roughness, and wind speed.
Although solving the full energy-balance approach has been shown to give good results in many parts of the world, the data and skill requirements to solve for the various terms in the equation are prohibitive for operational applications where year-to-year differences and long term anomalies are more useful than absolute values. In this study, we developed and implemented a simplified version of the surface energy-balance approach to estimate actual ET while maintaining and extending the major assumptions in the Surface Energy Balance Algorithm for Land (SEBAL, Bastiaanssen et al. [
4]) and the Mapping Evapotranspiration at High Resolution using Internalized Calibration (METRIC, Allen et al. [
3]) method. Both methods assume that the temperature difference between the land surface and the air (near-surface temperature difference) varies linearly with land surface temperature. They derive this relationship based on two anchor pixels known as the
hot and
cold pixels, representing dry and bare agricultural fields and wet and well-vegetated fields, respectively. The SEBAL and METRIC methods use the linear relationship between the near-surface temperature difference and the land surface temperature to estimate the sensible heat flux which varies as a function of the near-surface temperature difference, by assuming that the
hot pixel experiences no latent heat, i.e., ET = 0.0, whereas the
cold pixel achieves maximum ET. Similarly, Su et al. [
7] have developed a Surface Energy Balance System (SEBS) that refers to the
hot and
cold extreme conditions as “dry” and “wet”, respectively.
In this study, we extended this assumption with a simplification by stating that the latent heat flux (actual evapotranspiration) also varies linearly between the
hot and
cold pixels. This assumption is based on the logic that the temperature difference between soil surface and air is linearly related to soil moisture [
8]. Furthermore, crop soil water-balance methods estimate actual ET using a linear reduction from the potential ET depending on soil moisture [
12,
1]. Therefore, we argue that actual ET can be estimated by the near-surface temperature difference, which in turn is estimated from the land surface temperatures of the
hot and
cold pixels in the study area. In other words, while the
hot pixel of a bare agricultural area experiences little ET and the
cold pixel of a well-watered irrigated field experiences maximum ET, and the remaining pixels in the study area will experience ET in proportion to their land surface temperature in relation to the
hot and
cold pixels. This approach can be compared to the crop water stress index (CWSI) first developed by Jackson [
9]. The CWSI is derived from the temperature difference between the crop canopy and the air. Dividing the current temperature difference (canopy vs air) by known upper and lower canopy air temperature difference values creates a ratio index varying between 0 and 1. The lower limiting canopy temperature is reached when the crop transpires without water shortage, and the upper limiting canopy temperature is reached when the plant transpiration is zero, owing to water shortage, Qiu et al. [
10]. In this study, the
cold and
hot anchor land surface temperature pixel values are the equivalent of the lower and upper limiting canopy temperatures of the CWSI method.
The main objective of this study was to produce actual evapotranspiration estimates using a combination of a simplified surface energy balance (SSEB) approach and remotely-sensed MODIS thermal imagery and global reference ET over known irrigated fields in Afghanistan.
2. Methods
2.1. Study sites
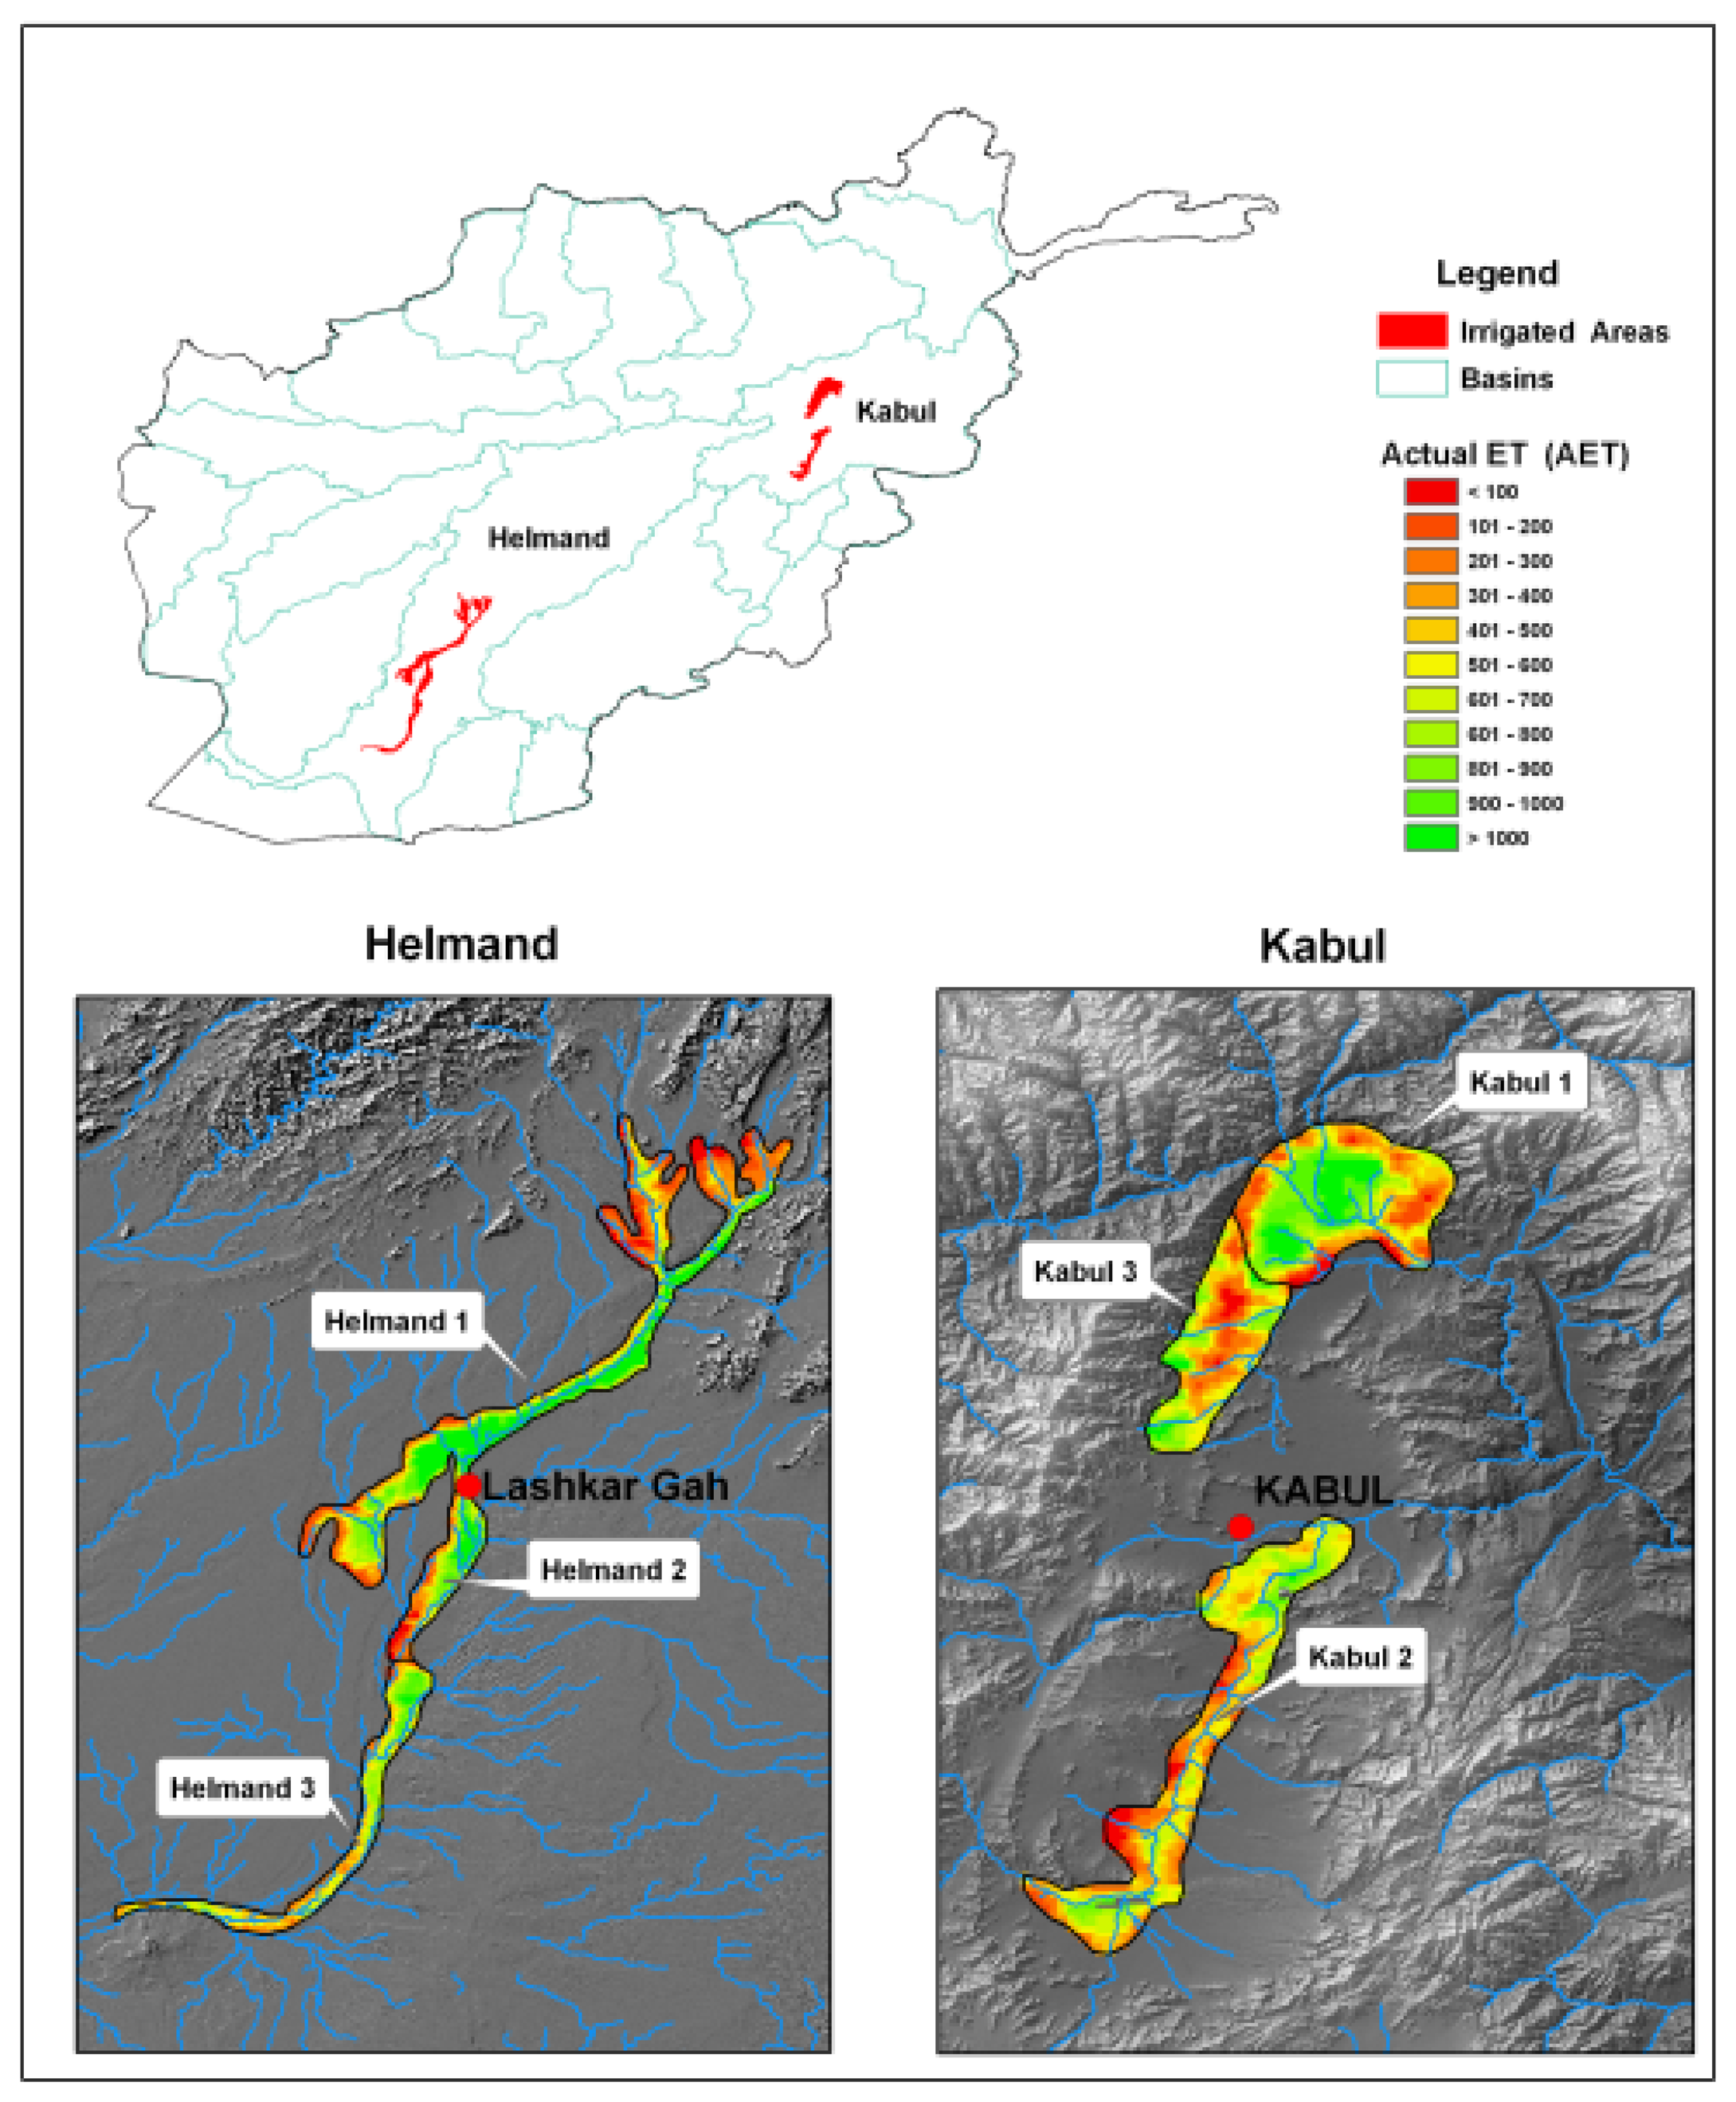
The study focuses on two major expanses of irrigation in the Helmand and Kabul basins (
Figure 1). As mentioned, the water use by irrigated agricultural lands is one aspect of the total water balance in these areas. This work was done as part of a larger Afghanistan water project that identified these two basins as those of primary concern. Because this method relies heavily on temperature variability, each of these areas was further sub-divided into 3 sections of irrigated cropland in order to minimize the effects of elevation differences on surface temperature measures.
Table 1 illustrates differences in area and median elevation for each of the sub-divisions. For each sub-division, a polygon was defined around the irrigated fields using a combination of Landsat, Advanced Spaceborne Thermal Emission and Reflection Radiometer (ASTER), and Moderate Resolution Imaging Spectroradiometer (MODIS) data sets. The irrigated areas consist of both well-vegetated and sparsely vegetated areas, with some arid/semi-arid areas at the periphery. In the case of the Helmand basin, Helmand 1 is comprised of the area upstream of Lashkar Gah, Helmand 2 is an approximately 35km stretch of irrigated land south of Lashkar Gah along the main river channel, and Helmand 3 is the remainder of the irrigated area along the channel extending to the south and west. The Kabul basin sub-divisions consist of an extensive irrigated area north of Kabul and a narrower band of irrigation along the river south and west of Kabul. The latter area, Kabul 2, is adjacent to one of the primary stream channels feeding the city and could have significant impacts on municipal water supply. Kabul 1 and Kabul 3 include the large area of irrigated agriculture that is found near the headwaters of the Panjir River. Wheat is the primary cultivated crop in all areas.
2.2. Data Set Characteristics
The primary data sets for this study were derived from the MODIS sensor flown onboard the Terra satellite. MODIS Land Surface Temperature (LST) data were used to calculate the crucial evapotranspiration (ET) fractions explained in the procedures section of this manuscript. Additionally, MODIS NDVI data were used for irrigated area delineation and identifying highly-vegetated versus sparsely vegetated areas within the agricultural zone. The global reference ET data were obtained from the archives of USGS/FEWS NET operational model outputs. Each data set is further described below.
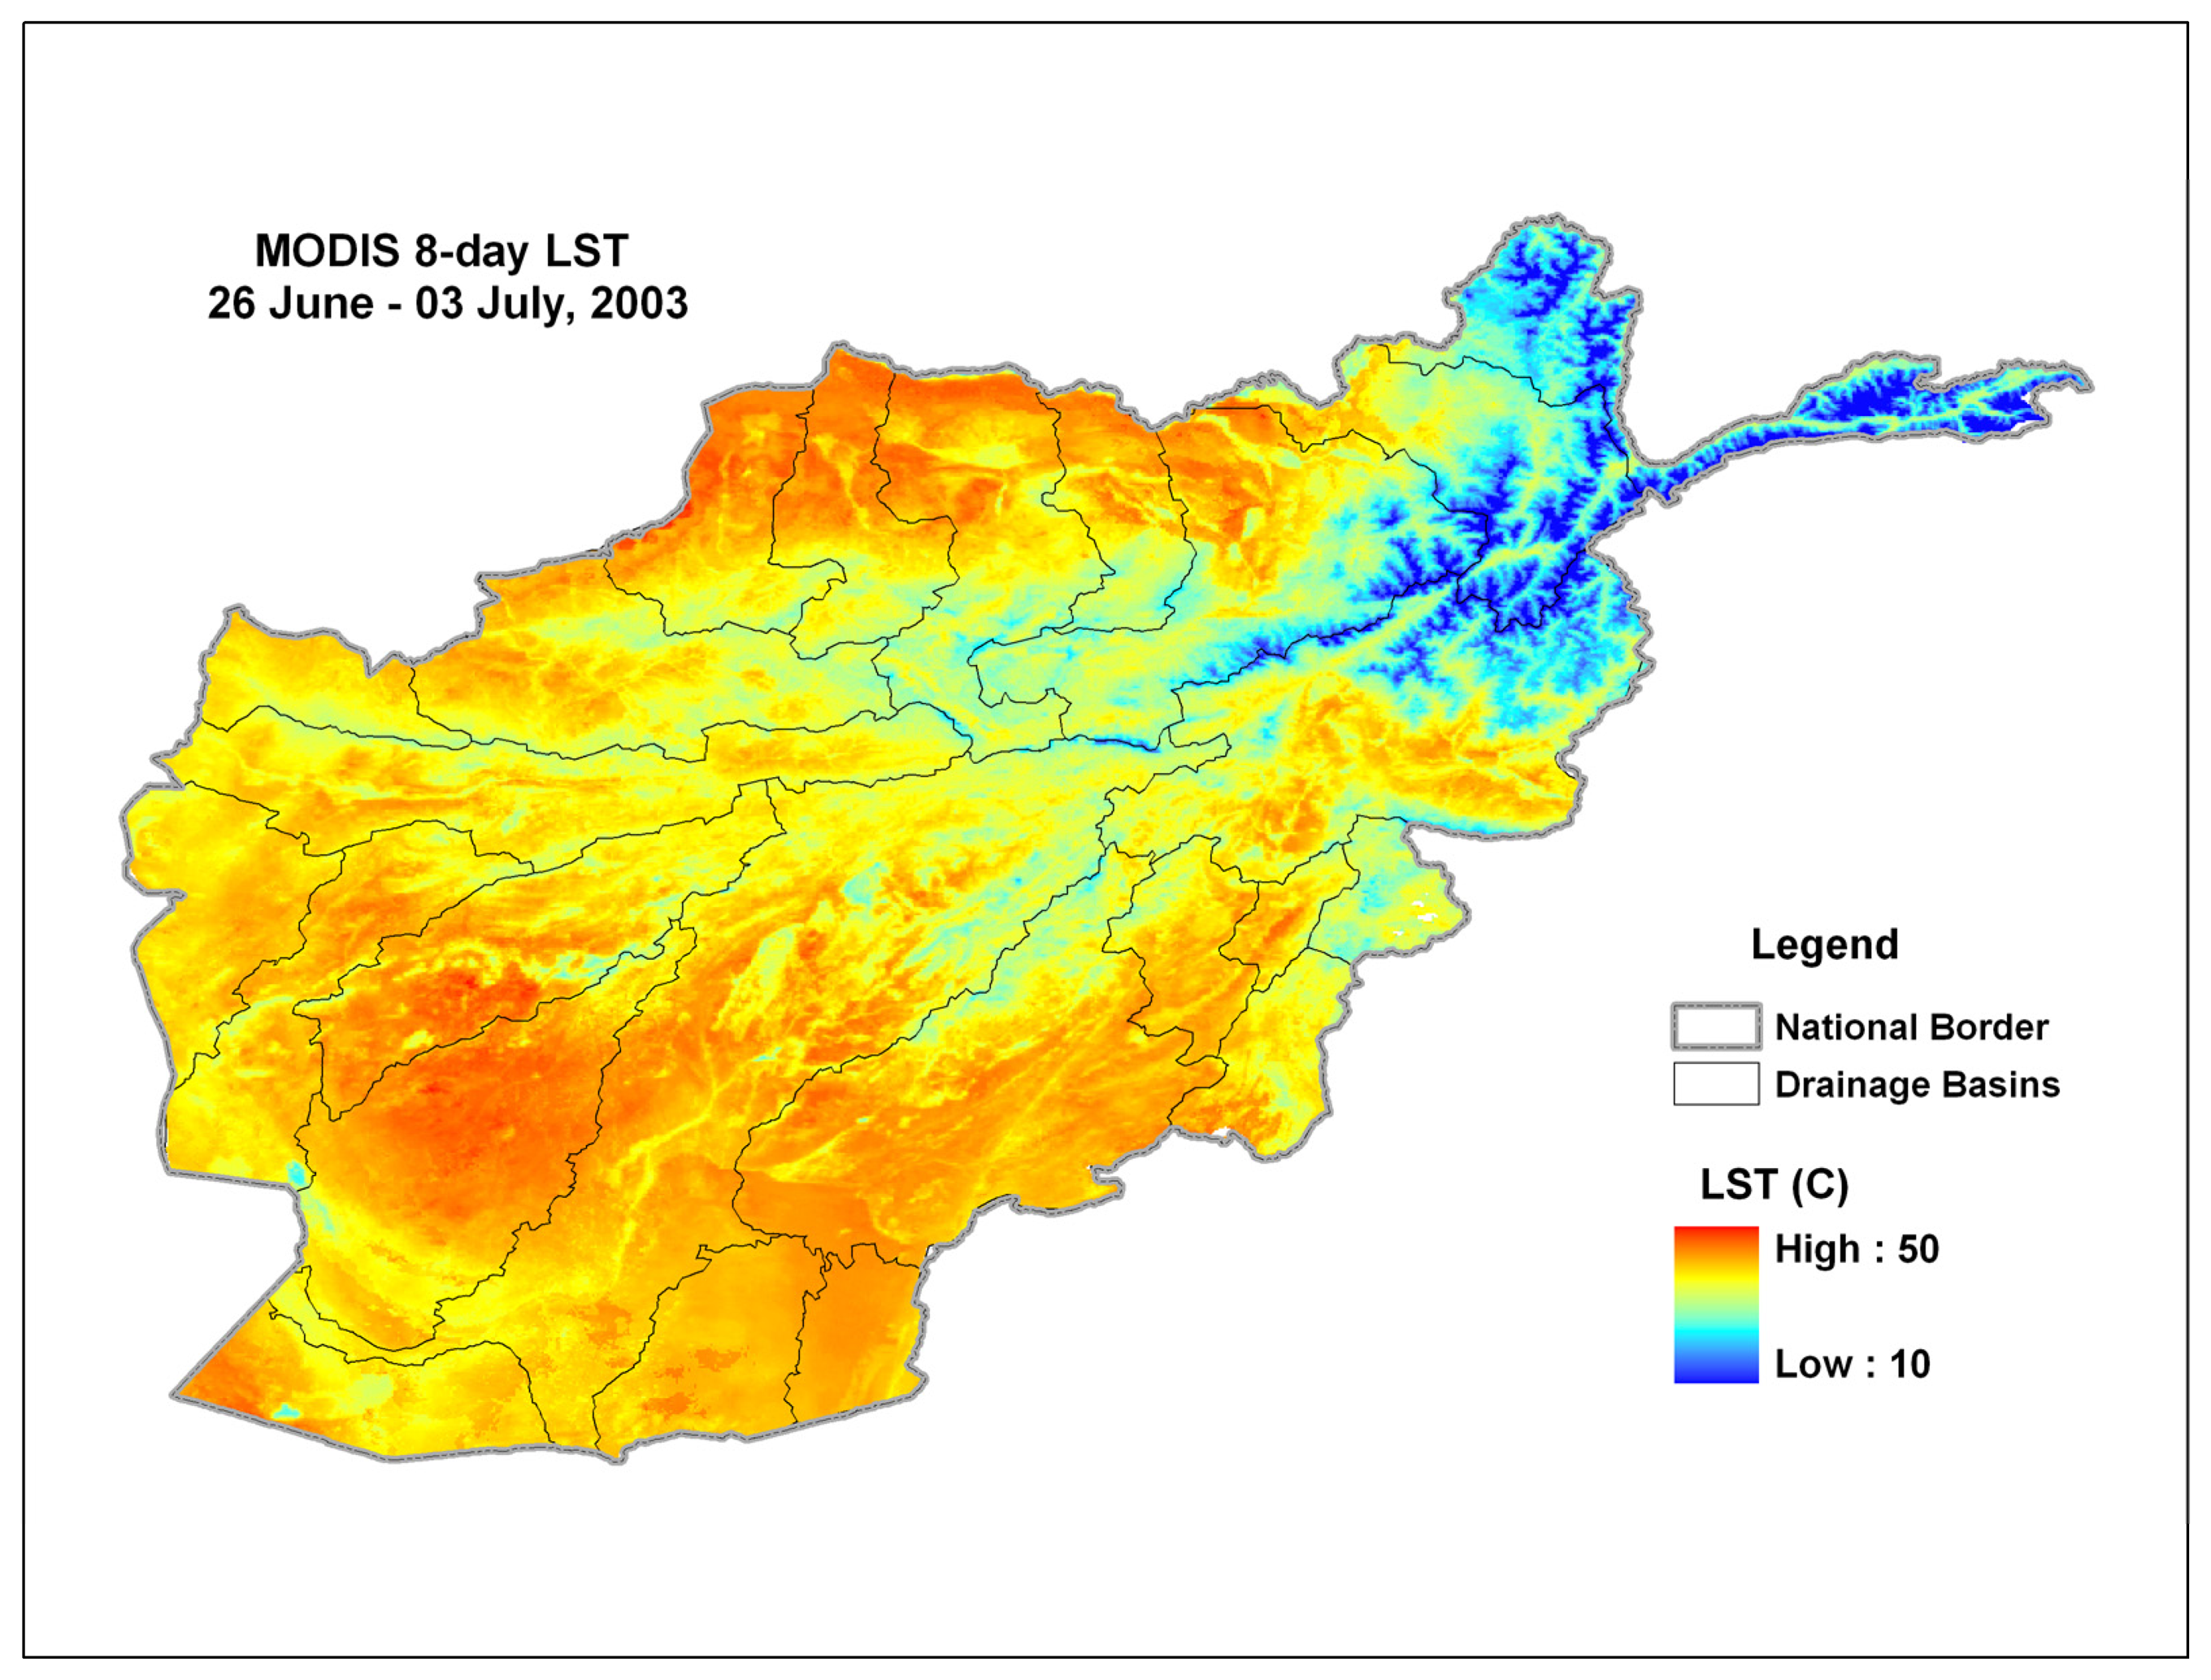
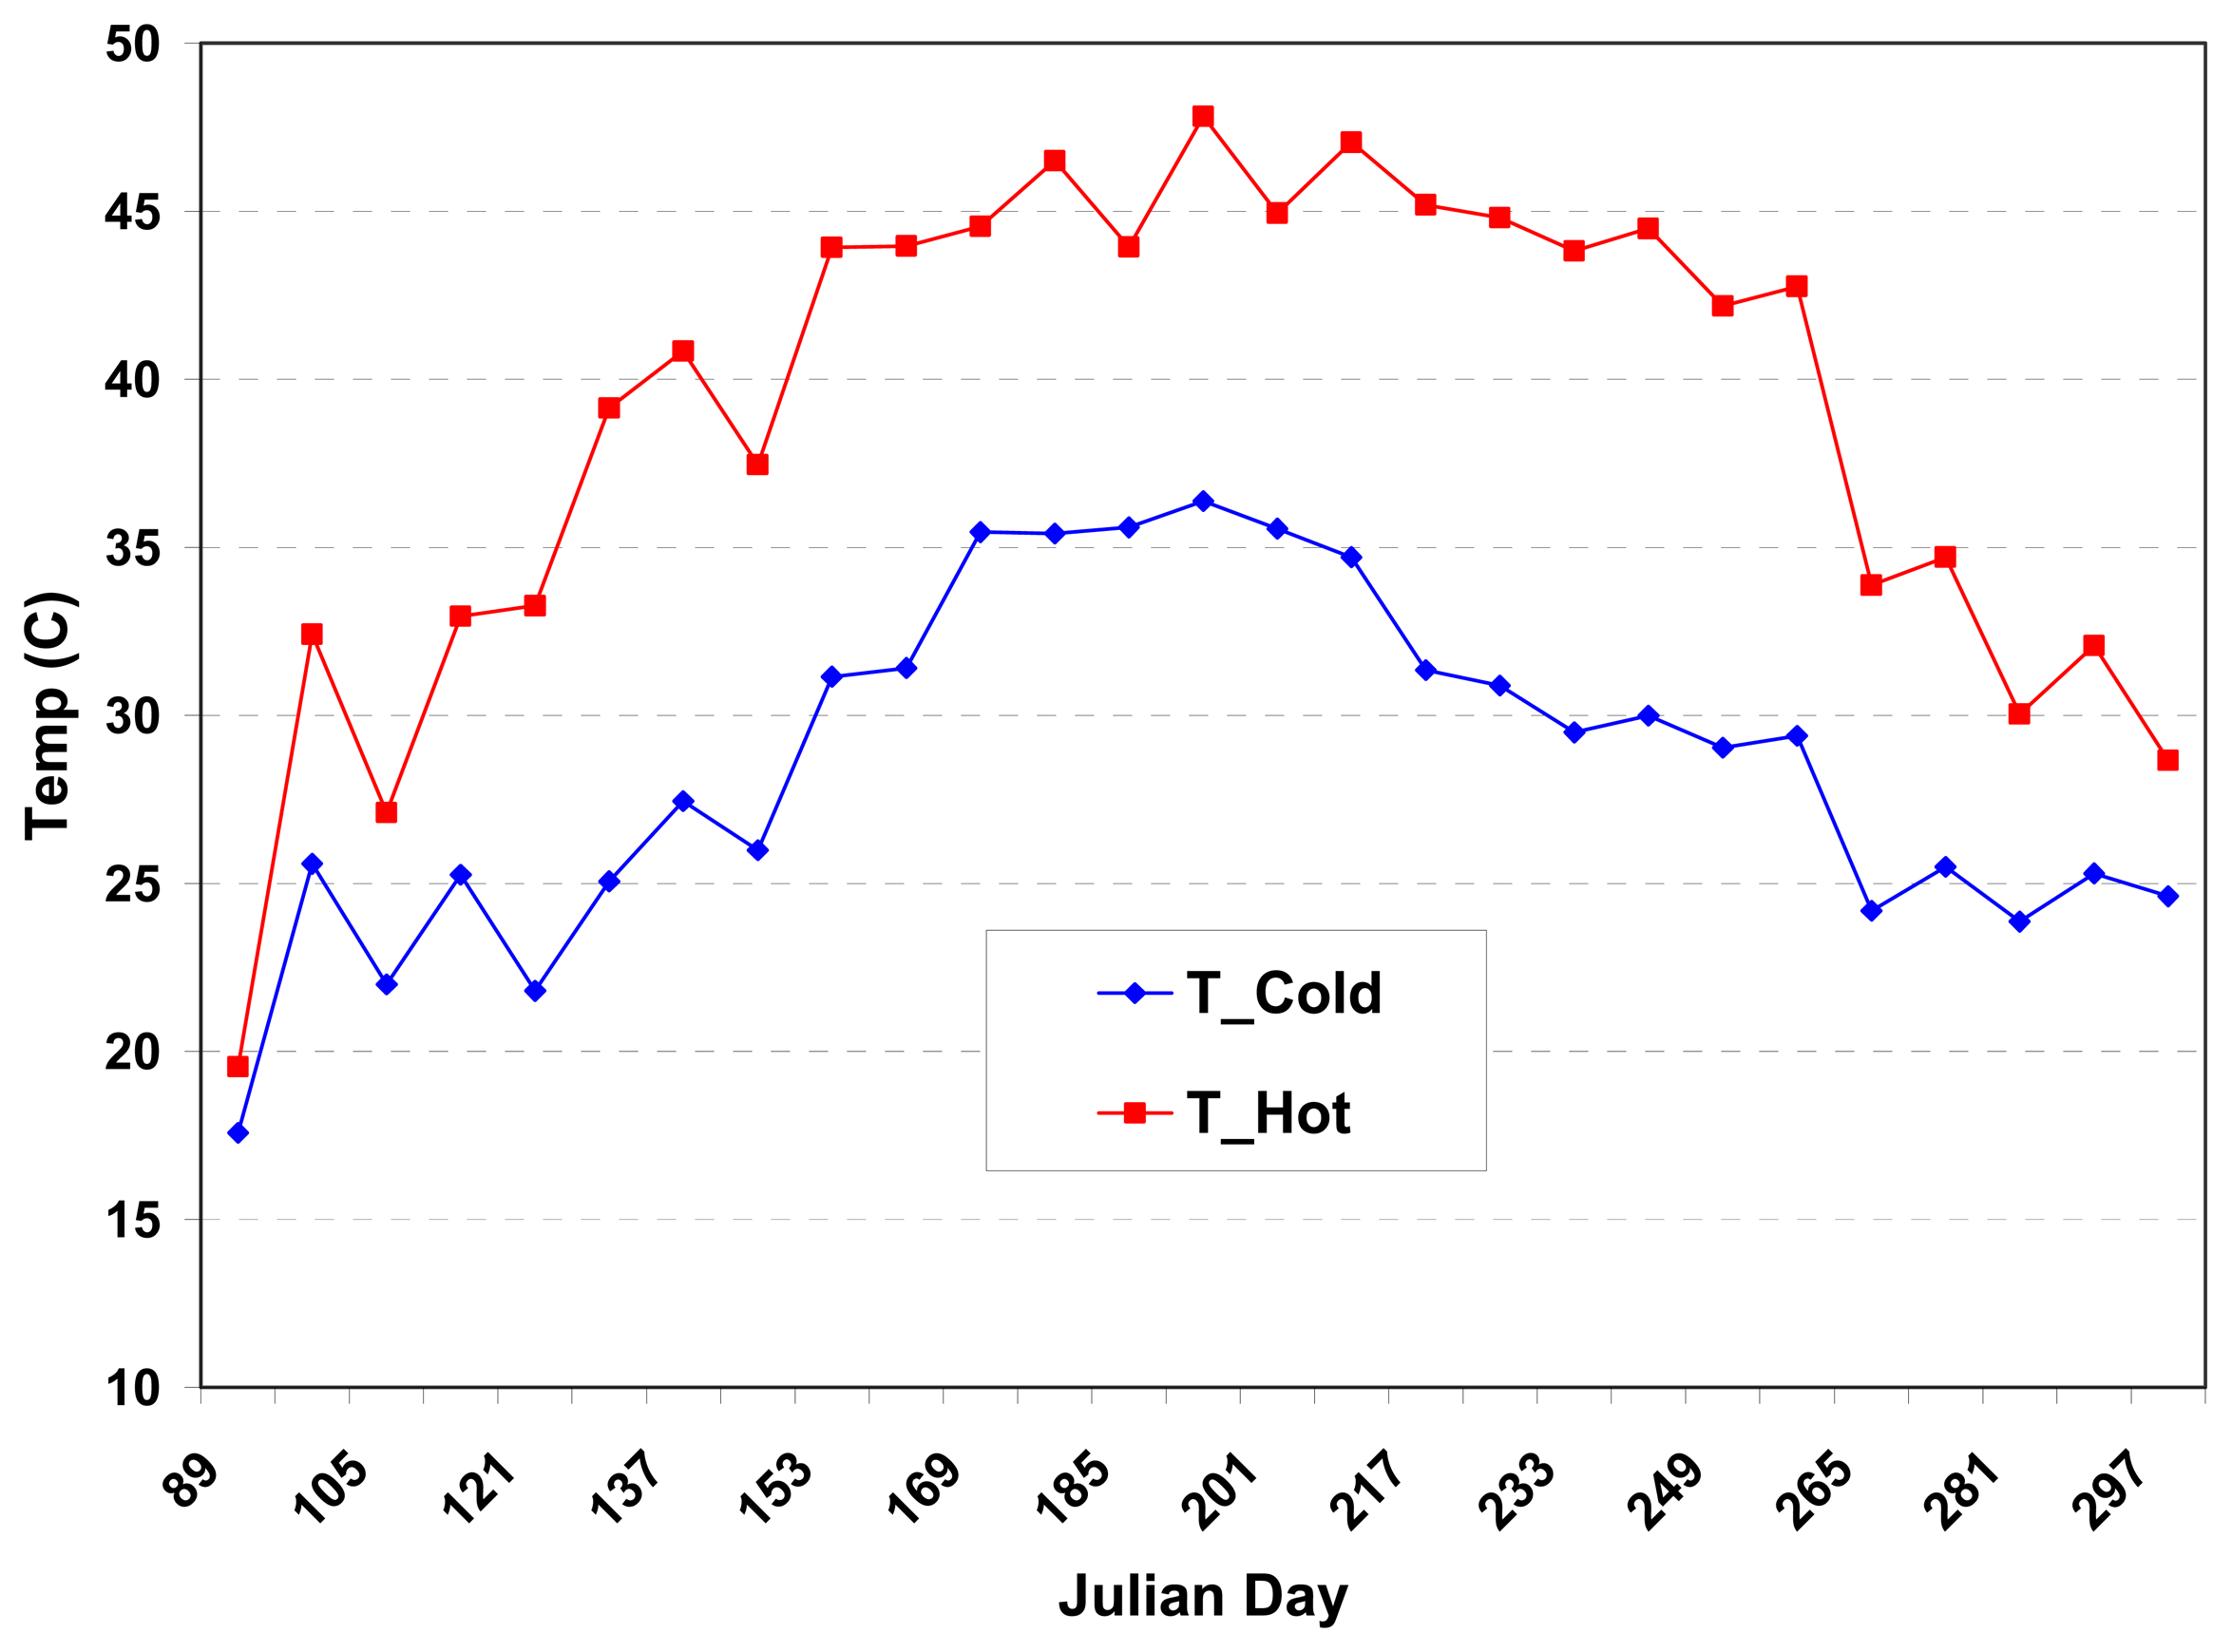
MODIS Land Surface Temperature: Thermal surface measurements were collected from the MODIS 8-day Land Surface Temperature/Emissivity (LST/E) product (MOD11A2). The MODIS instrument provides 36 spectral bands, including 16 in the thermal portion of the spectrum. The LST/E images provide per-pixel temperature and emissivity values at 1-km spatial resolution for the 8-day composite product. Temperatures are extracted in degrees Kelvin with a view-angle dependent algorithm applied to direct observations. This study utilized average daytime land surface temperature measurements for 8-day composite periods throughout the growing season (
Figure 2). More than twenty five 8-day periods beginning in early April through the end of October were processed.
Table 2 shows the MODIS day of year representing the first day of the 8-day MODIS LST composite period and corresponding calendar dates for all years.
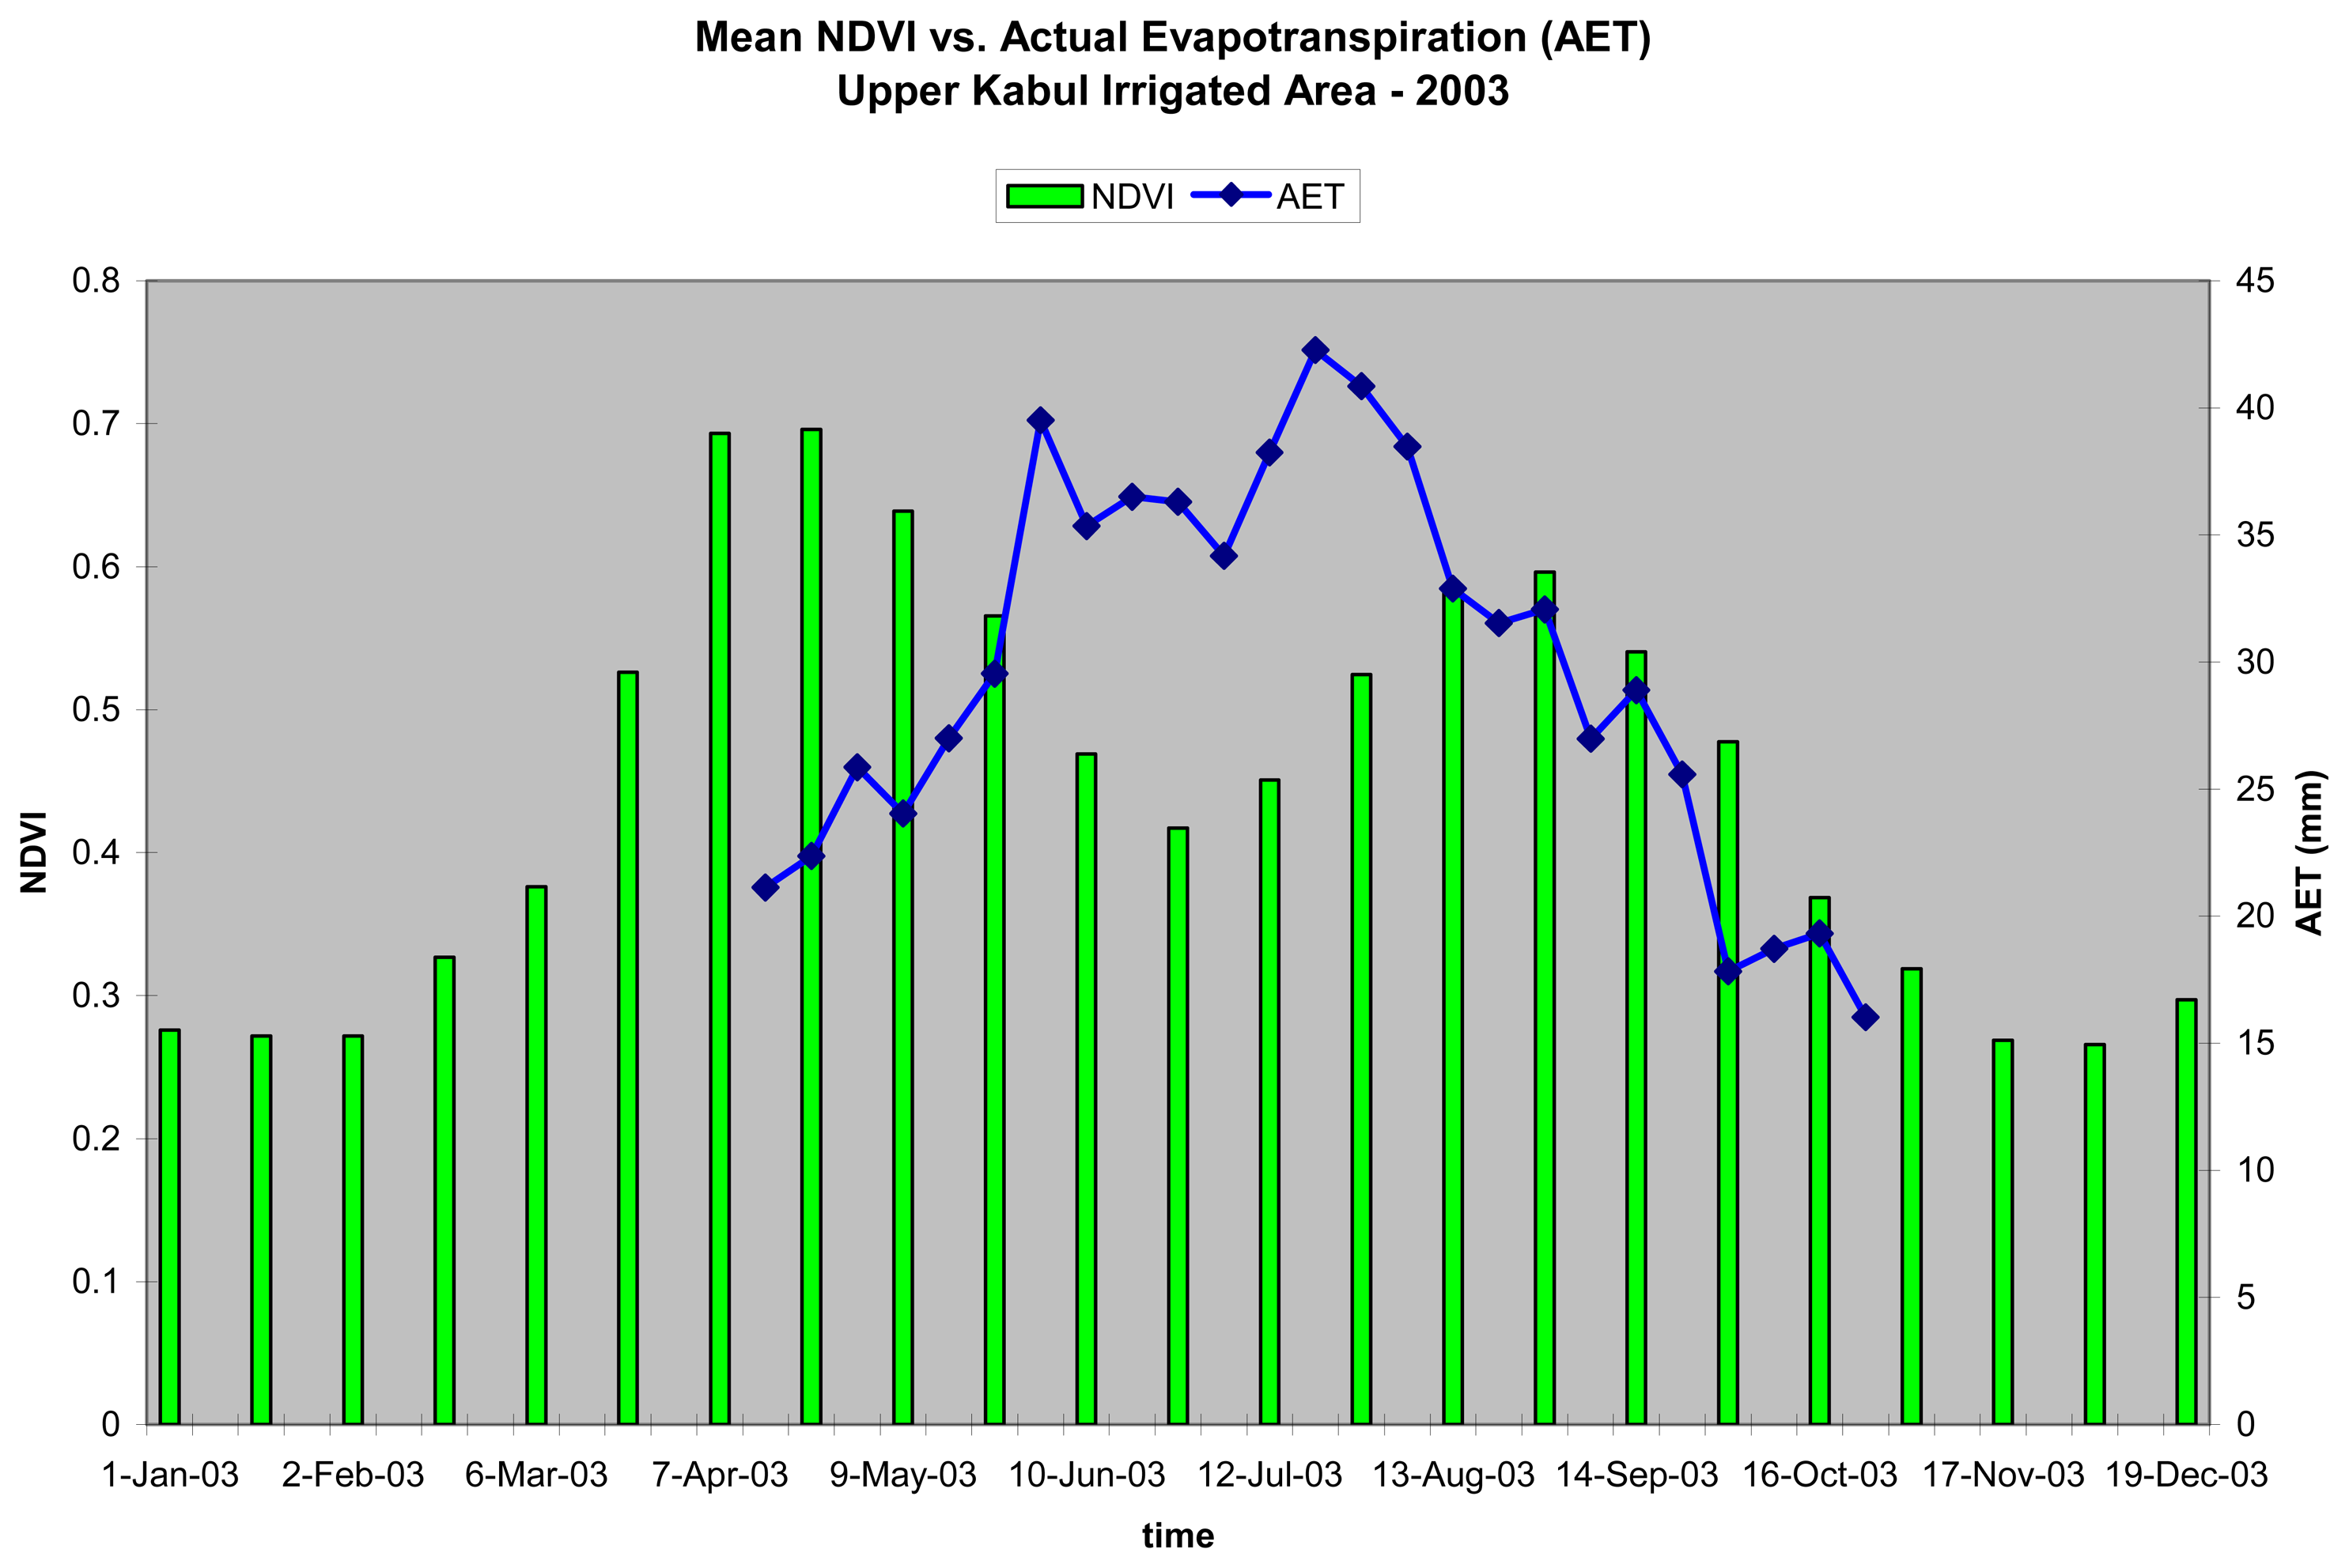
MODIS Vegetation Index: MODIS Vegetation Index (VI) products use reflectance measures in the red (620 – 670 nm), near infrared (841 – 876 nm), and blue (459 – 479 nm) bands to provide spectral measures of vegetation vigor. The MODIS VI products include the standard normalized difference vegetation index (NDVI) and the enhanced vegetation index (EVI). Both indices are available at 250-m, 500-m, and 1-km spatial resolution. The primary difference between the two indices is that EVI uses blue reflectance to provide better sensitivity in high biomass regions. Because this study was concentrated on irrigated agriculture in an otherwise dry land environment, we used the standard 16-day NDVI product at 250-m resolution for this analysis (
Figure 3).
The MODIS vegetation index and land surface temperature data are distributed, at no cost, by the Land Processes Distributed Active Archive Center (LPDAAC), located at the USGS Center for Earth Resources Observation and Science (EROS) Center (
http://LPDAAC.usgs.gov).
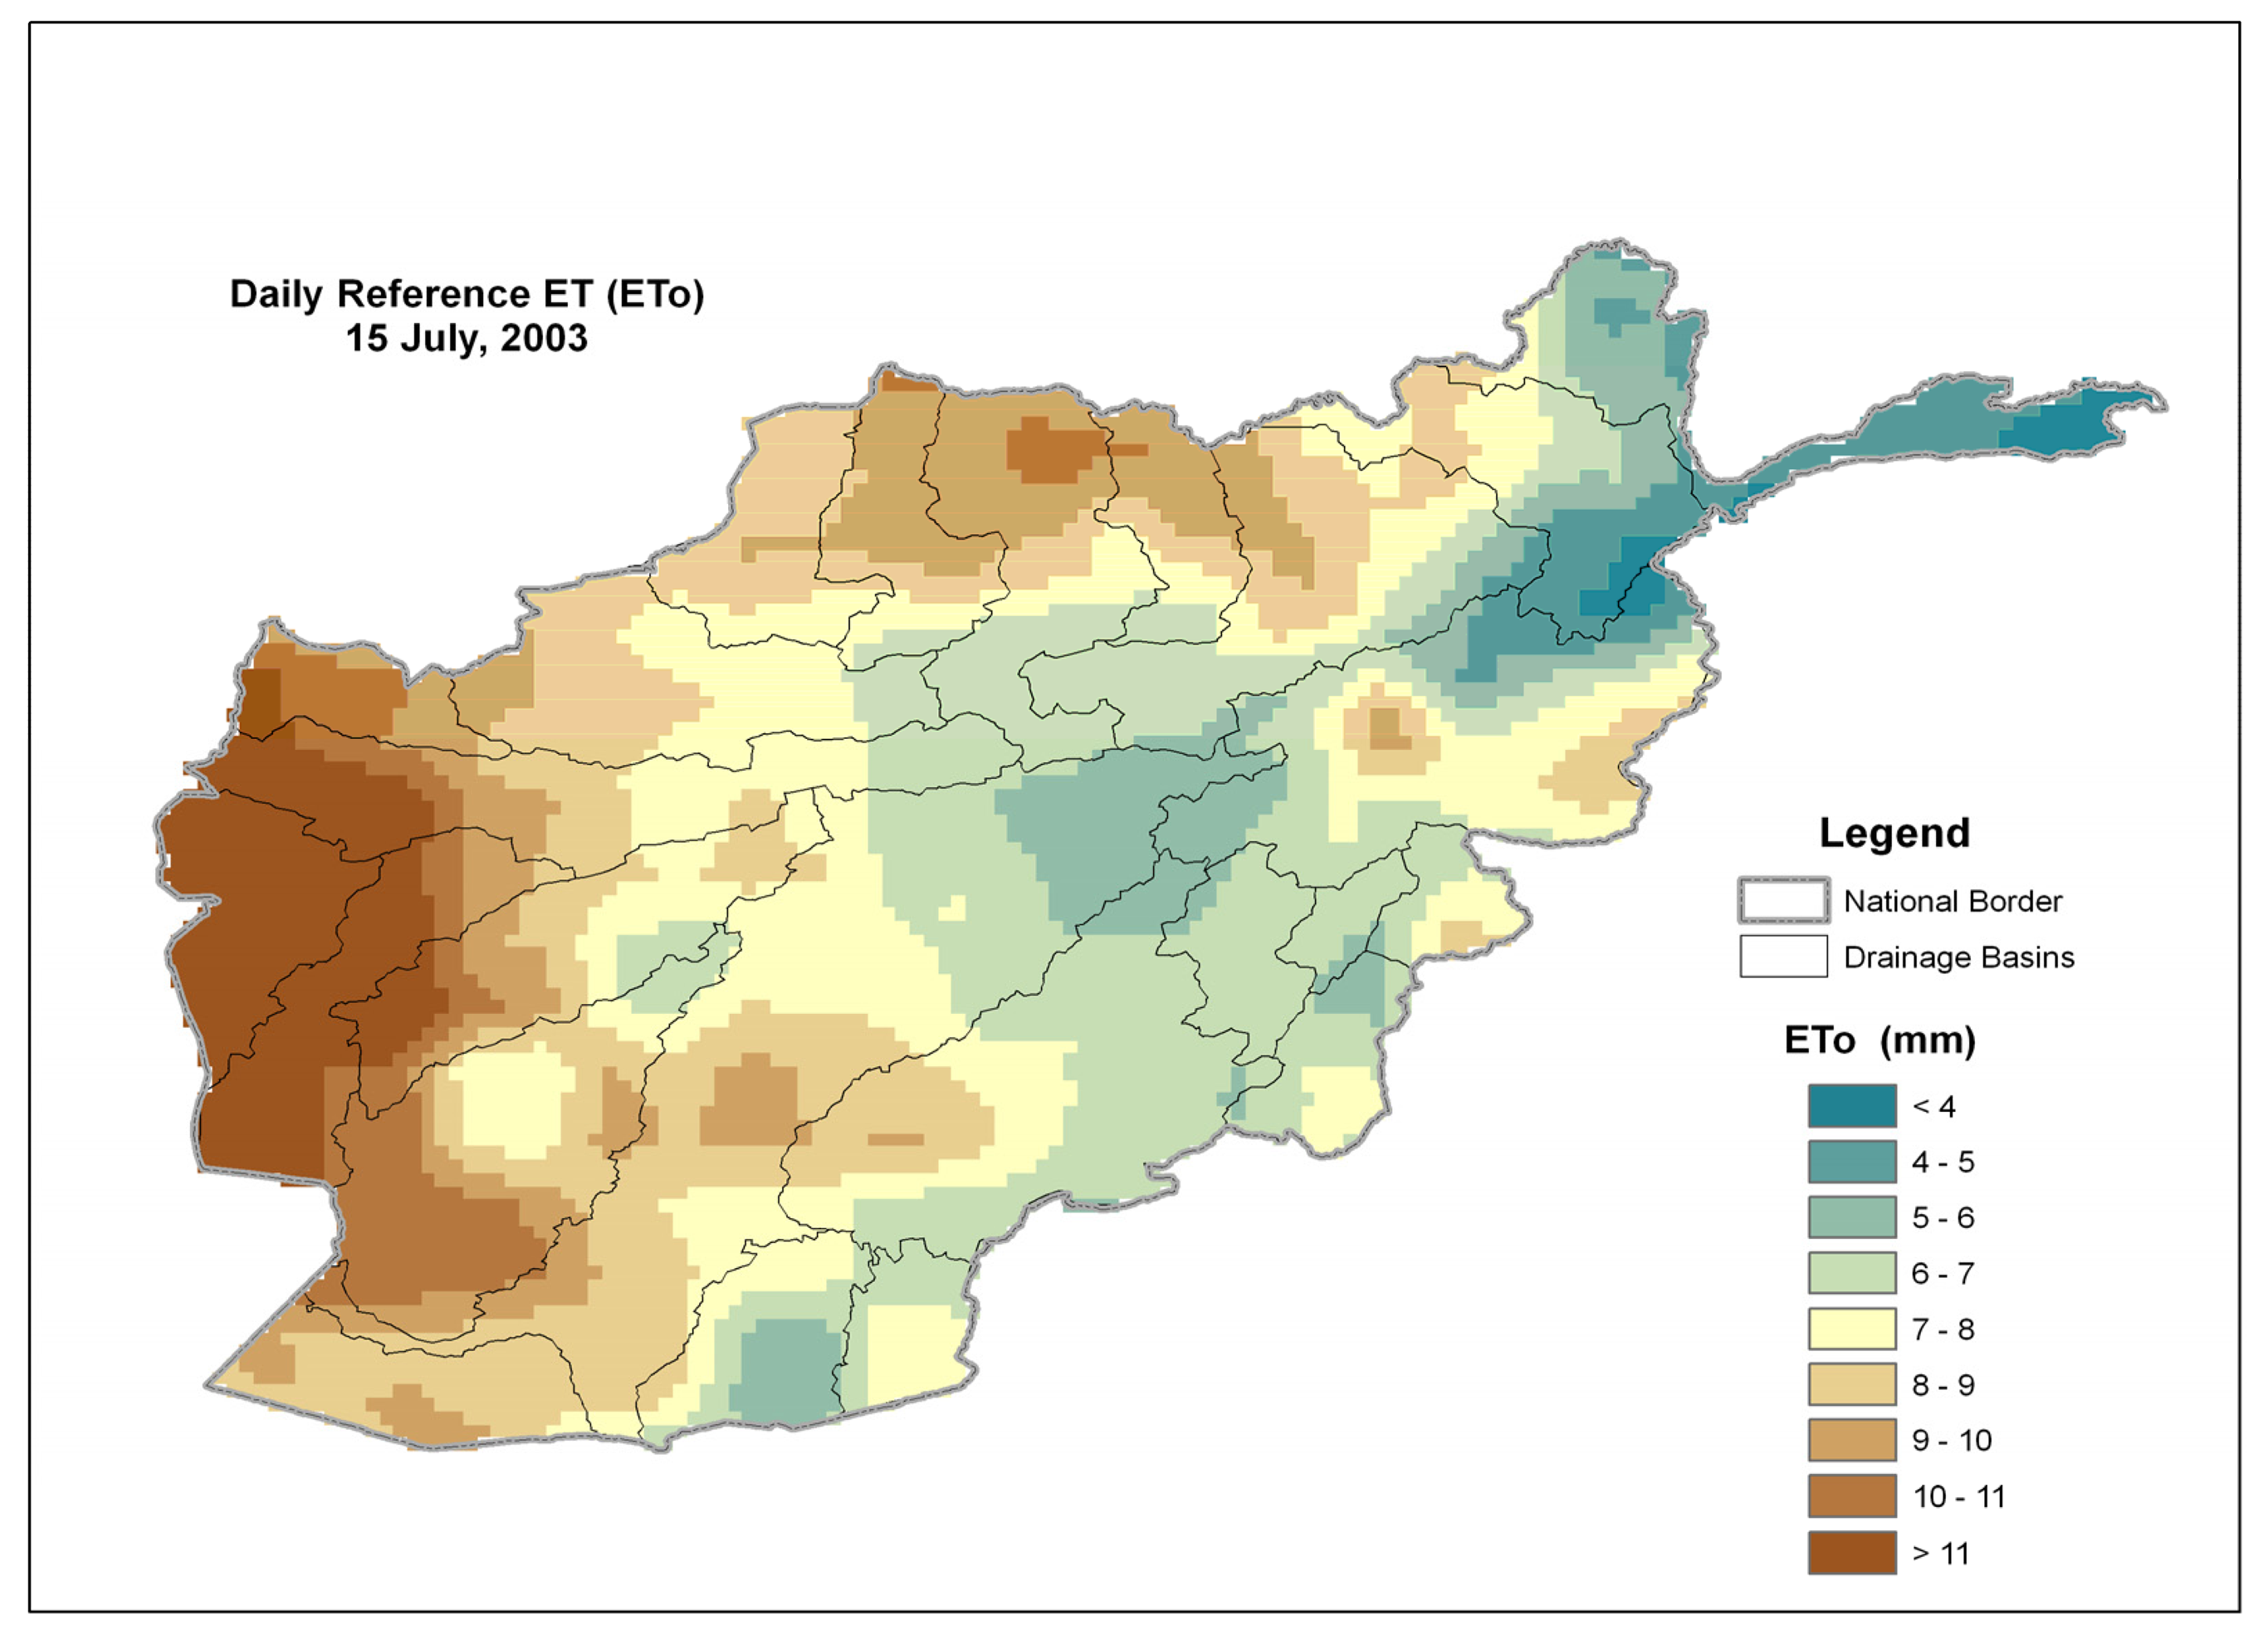
Reference ET: The global 1-degree reference ET (ETo), based on the 6-hourly Global Data Assimilation Systems (GDAS) model output, is calculated daily at EROS (Senay and Verdin [
11]). The GDAS ETo (
Figure 4) uses the standard Penman-Monteith equation as outlined in the FAO publication for short-grass ETo by Allen et al. [
12]. The feasibility of using the GDAS ETo for such applications was recommended by Senay and Verdin [
11] after a comparison with station-based daily ETo showed encouraging results with r
2 values exceeding 0.90. Daily global ETo values were available for all days between 2001 and 2005. For 2000, the daily ETo values were not complete. For the missing time periods, the average daily ETo from 2001 to 2005 was used.
Prior to using these data for our analysis, a downscaling of the GDAS 1-degree data was performed to produce a 10-km GDAS ETo. The approach utilized the International Water Management Institute (IWMI) historical (1961-90) potential evapotranspiration (PET). The IWMI data set is based on data originally compiled at 16-km spatial resolution that has been disaggregated to 10-km. The downscaling technique utilized the 10-km historical IWMI PET data to create a fractional relationship, on a per pixel basis, between each 10-km IWMI pixel (x) and the corresponding 100-km IWMI pixel (y) value (artificially created to simulate the 100-km GDAS). This fractional relationship was then applied back to the 100-km GDAS pixels to downscale these data to a spatial resolution of 10-km (
Equation 2). The resulting 10-km ETo grids were used in this analysis (
Figure 4). The downscaling method was developed and validated by the authors using similar IWMI data to develop the fractions over the conterminous US and the results compared favorably with station-based ETo in California. Thus, the method was proven to be an effective technique to downscale the Global GDAS ETo. A manuscript is being prepared to publish the validation of the downscaling technique.
Where, “x” represents 10-km IWMI PET and “y” is the 100-km IWMI PET
2.3. Procedures/Analysis
Sets of three hot and three cold pixels were selected for each 8-day composite period for each year of growing season data. An average of the 3 pixels was used to represent the hot and cold values in each of the six study areas. The study area was divided into 6 irrigation areas to reduce elevation differences that are large enough to cause land surface temperature differences since the premise of the existing model is based on the assumption that surface temperature differences are only caused by differences in moisture availability and water use. For a given time period, cold pixels, representing well vegetated and well watered crops, were selected based on a combination of low LST values and high values in the MODIS NDVI. Similarly, hot pixels, representing low density vegetation and relatively dry land, were identified by high LST values and very low NDVI values.
Land surface temperature values for each of the six pixels (3
hot, 3
cold) were extracted using ArcGIS 9.0 software [
13]. The resulting database files were imported into an Excel spreadsheet where average
hot and
cold pixel values were calculated.
With the assumption that
hot pixels experience very little ET and
cold pixels represent maximum ET throughout the study area, the average temperature of
hot and
cold pixels could be used to calculate proportional fractions of ET on a per pixel basis. The ET fraction (ET
f) was calculated for each pixel by applying the following equation (
Equation 3) to each of the 8-day MODIS land surface temperature grids.
where TH is the average of the three
hot pixels selected for a given scene; TC is the average of the three
cold pixels selected for that scene; and Tx is the land surface temperature value for any pixel in the composite scene.
The ETf equation was applied to each 8-day average composite for each year, resulting in a series of more than 25 images per season. The images contained ET fractions for each pixel that were used to estimate actual ET throughout the growing season.
The ET
f is used in conjunction with ETo to calculate the per pixel actual ET (ETa) values in a given scene (
Equation 4). The calculation procedure is similar to the use of a crop coefficient (Kc) and soil stress coefficient (Ks) in crop water-balance-based ET modeling where a ETo is adjusted in a multiplicative manner using Kc that is dependent on crop type and stage, and Ks which is dependent on soil moisture [
1]. Daily ETo values were used to create average 8-day ETo corresponding to the LST composite periods.
This simplified approach in SSEB allowed us to use modeled ETo at a coarse spatial resolution to derive spatially distributed high-resolution ETa values based on land surface temperature variability at 1-km resolution. Knowledge of ETa at a higher spatial resolution during the growing season provides important insight into the extent of irrigated cropland, the quality of the growing season, and associated seasonal water use.
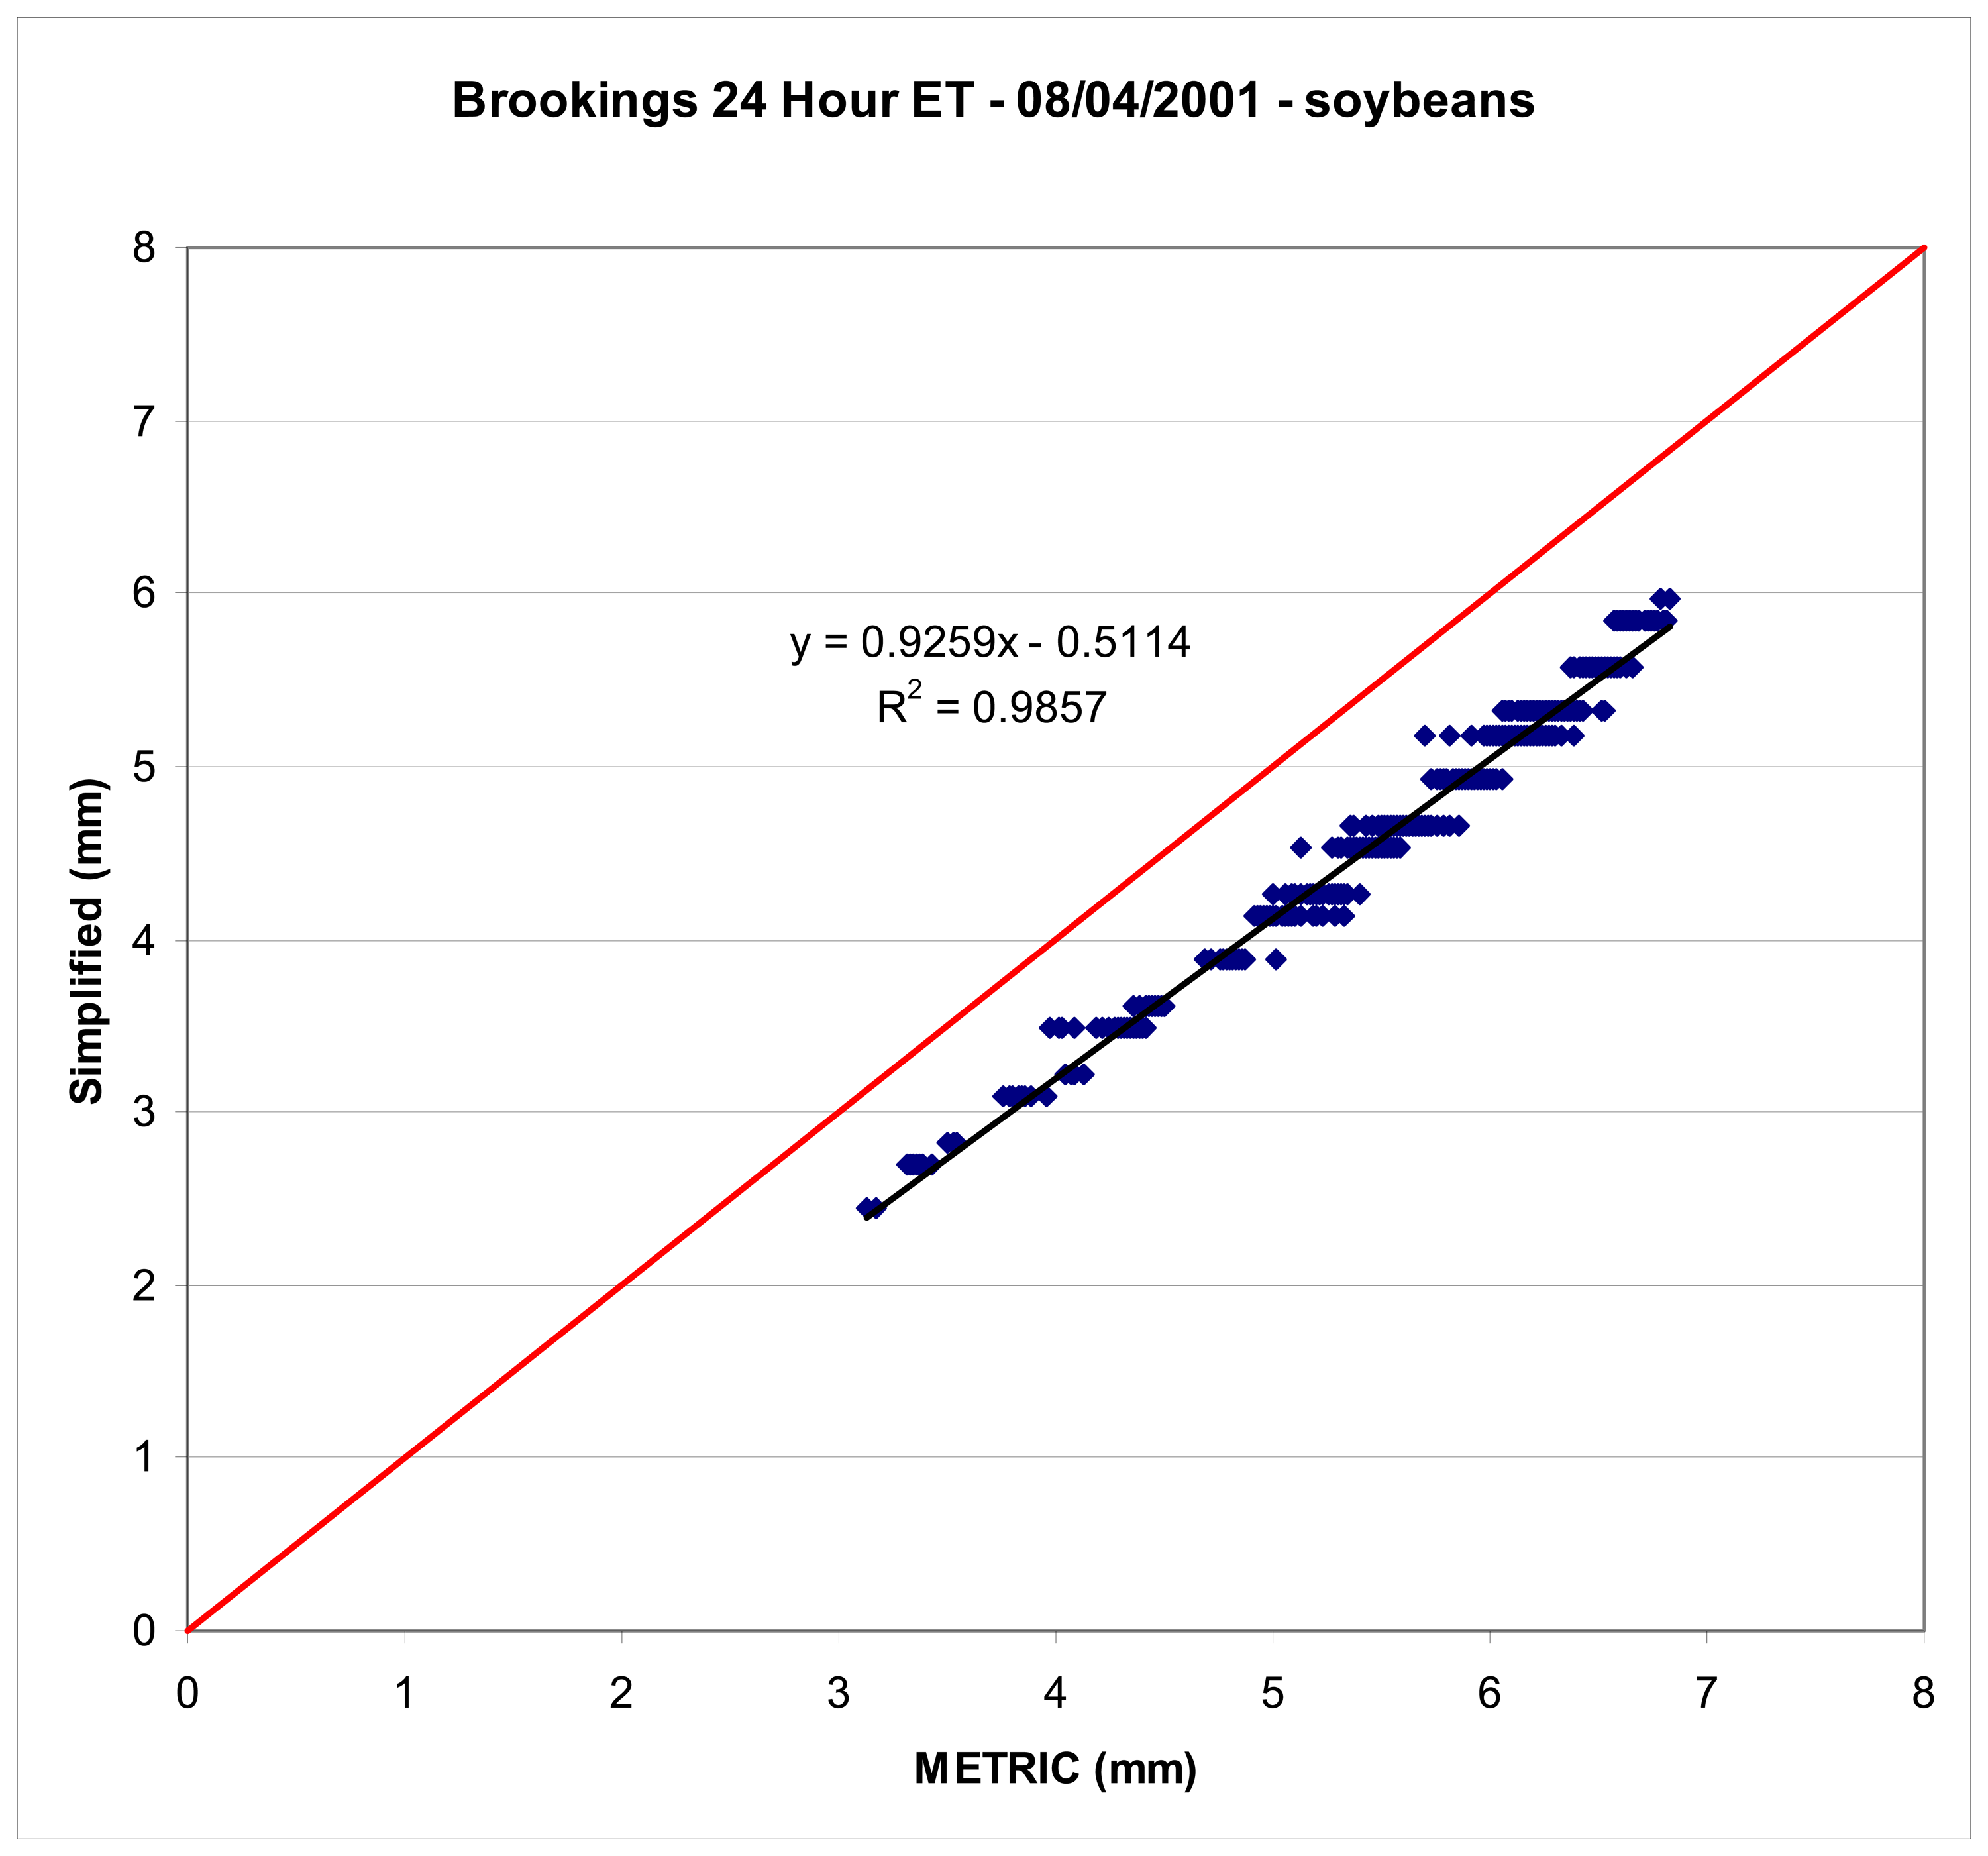
Preliminary validation of the performance of SSEB was undertaken using crop fields in the north central United States. Corn and soybean fields in two South Dakota counties, Brookings and Moody, were used to compare model results with the SEBAL and METRIC methods. Landsat thermal scenes from August 1, 2000 and August 4, 2001 were used to assess the performance of the simplified energy balance method (SSEB). Depending on the crop type and year, the correlation coefficient (R
2) between SSEB and METRIC varied from 0.94 to 0.99 and with SEBAL from 0.55 to 0.79 (unpublished work by Swanson and Trooien, 2007, personal communication). A sample scatter plot of the validation work between SSEB and METRIC is shown in
Figure 5.
The lack of field data in Afghanistan precludes a quantitative validation of the results in an absolute manner. However, quantitative analysis of the findings can be made by studying the year-to-year variability in relative terms. To this effect, actual crop ET for the six-year period, 2000 – 2005, was used to assess the quality of each growing season in the Helmand and Kabul study areas. Using masks of the irrigated crop area, described earlier in
Figure 1, we used the 1-km gridded actual ET values to calculate spatially averaged actual ET for each season. The results and implications of these comparisons are outlined in detail in the following section.
4. Discussion
Although the simplified surface energy balance (SSEB) approach has produced convincing results with encouraging comparisons with other established energy balance models, the model needs to be validated using actual field data. Further comparison with other more robust models will help identify its limitations and potential for different regions. Due to the prohibitive nature of collecting field data in this region of the world, we lack a good measure against which to validate our results. However, a recent comparison with the SEBAL model using Landsat Thermal data in China produced promising results with a coefficient of determination (R
2) of 0.89 (Cai Xueliang, 2007, personal communication).
Figure 5 shows a similar comparison work in the US with the METRIC and SEBAL models where strong correlations have been exhibited. The authors intend to carry out a more detailed validation of the model in the United States using a combination of field measurements and results from water balance and other energy balance models. Currently, the model is appropriate to apply in a relatively homogeneous landscape where surface temperature variation is primarily caused by differences in water use. Therefore, major differences due to elevation, aspect, latitude, etc., should be taken into consideration before applying the method on the entire landscape. Furthermore, this method is somehow optimized to estimate actual ET (ETa) on crop surfaces since the albedo magnitude (0.23) embedded in the ETo is based on the grass reference ET. This is, however, a lesser problem than differences in elevation. Future improvement of the model will plan to take into account difference in albedo from other land cover types so that the model can be applied irrespective of land cover. In addition, the model may provide a high end estimate of the seasonal ET because it assumes the presence of well-watered, full-canopy, actively-growing vegetation during the early and late season of the crop cycle for the cold pixel. Again, further refinements of the model will include the use of NDVI to correct for vegetation cover condition to better estimate the actual ET at the wet pixel, based on a recommendation from Rick Allen (personal communication, 2006). Since an accurate estimation of the bare soil evaporation (Hot pixel) requires a water balance method, an integrated modeling framework that couples SSEB with a water-balance-based landscape ET model (VegET) is being developed at the Geographic Information Science Center of Excellence (GIScCE), a joint collaborative center between USGS/EROS and South Dakota State University.
5. Conclusions
The main objective of this study was achieved with the demonstration of the successful coupling of remotely sensed data and a simplified surface energy balance (SSEB) approach in producing estimates actual ET in irrigated agricultural areas of the Kabul and Helmand basins in Afghanistan. The ET fractions are comparable to the commonly used crop coefficient (Kc) (with a soil water stress factor, Ks) and thus are directly multiplied with ETo values to obtain actual ET estimates. A major advantage of the energy-balance approach is that it can be used to quantify spatial extent of irrigated fields and their water-use dynamics without a reference to source of water as opposed to a water-balance model which requires knowledge of both the magnitude and temporal distribution of rainfall and irrigation applied to fields.
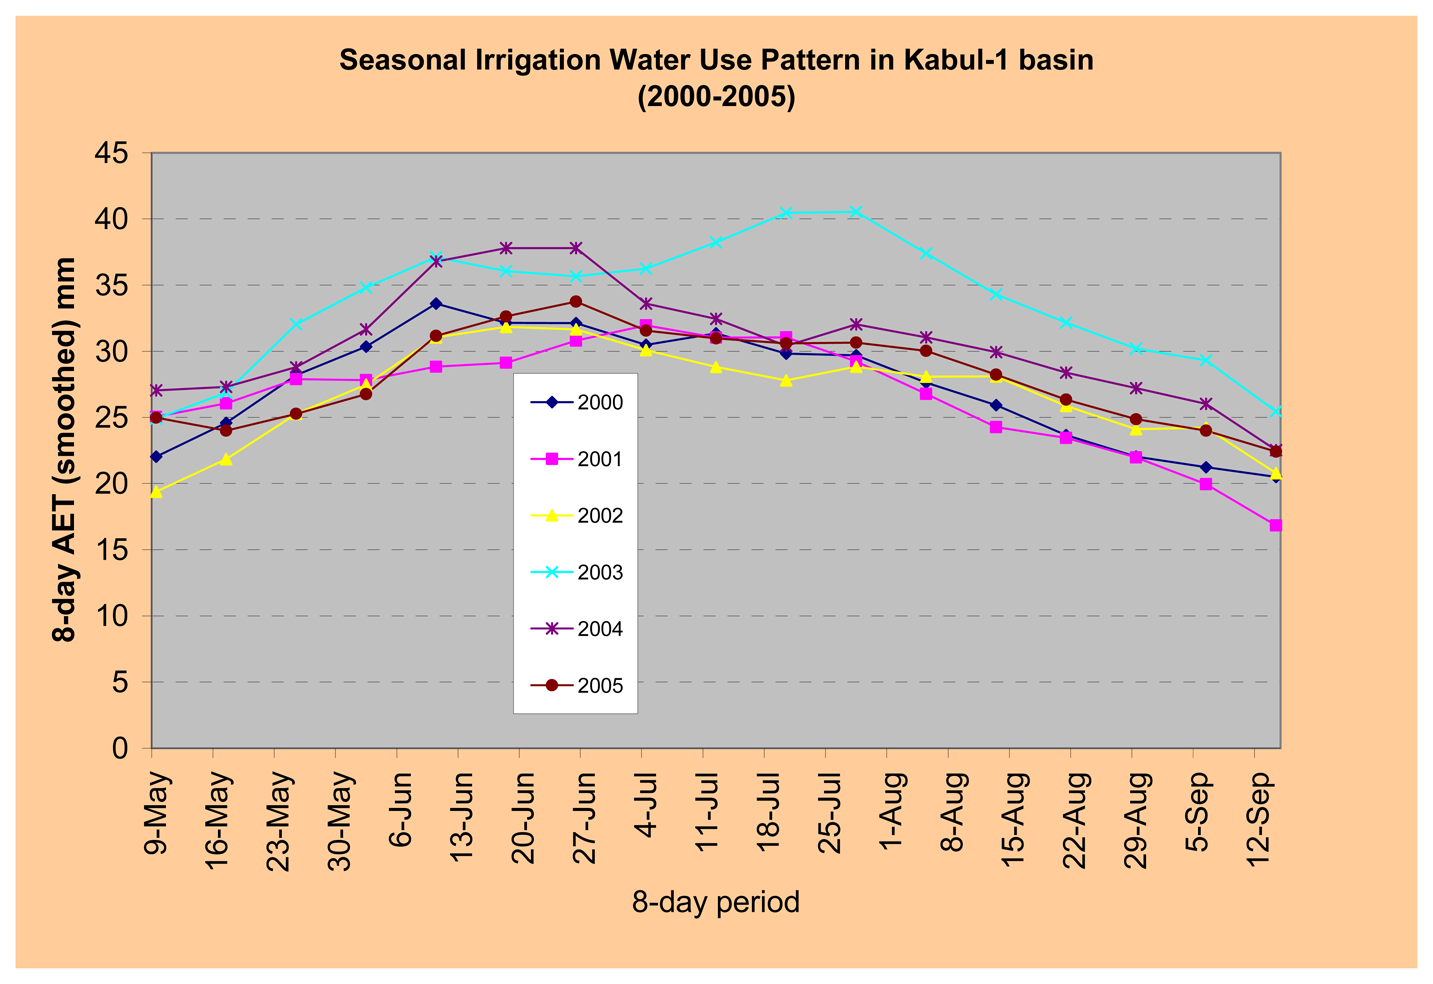
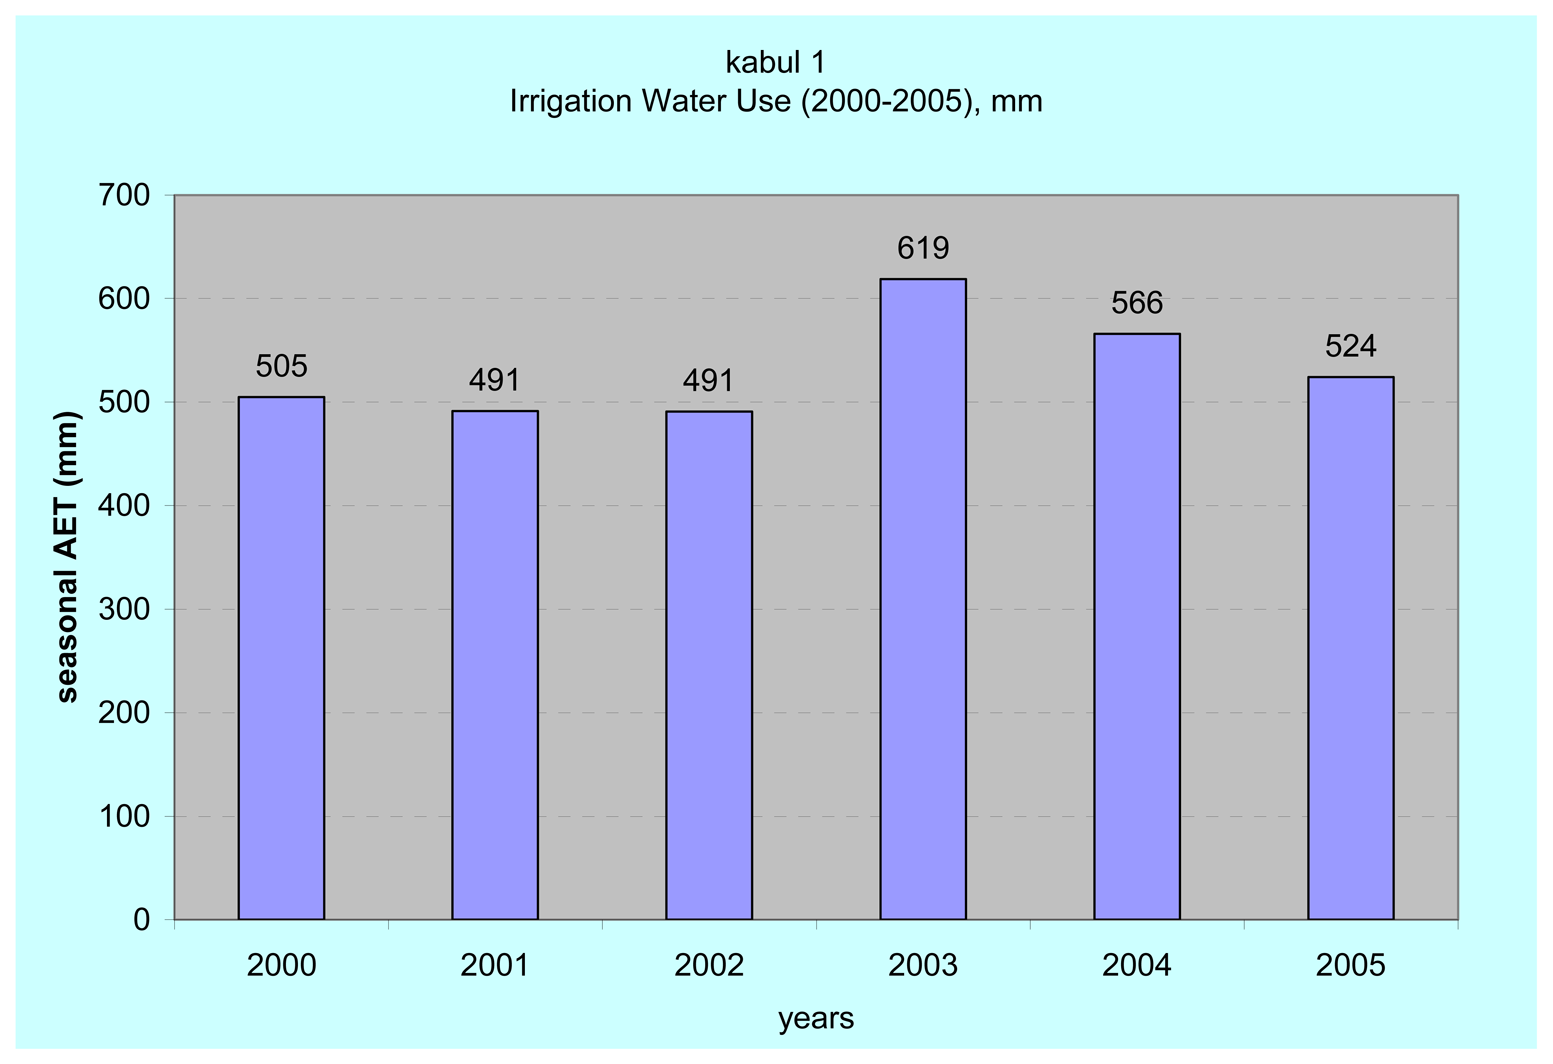
The actual ET values of the irrigated fields in the study area varied from year to year in a way that was consistent with field reports and other independent data sets such as the seasonal maximum NDVI and output from an irrigation supply/demand water balance model. The 2003 seasonal actual ET of the study area was much higher than the rest of the studied years, and about 20 percent higher than the average of the 5 years. This was in agreement with published reports [
14] and news sources stating that 2003 precipitation appeared to have broken the sequence of preceding consecutive dry years in Afghanistan.
A close examination of the spatial distribution of the actual ET estimates during the six years revealed that the reduction in area of high actual ET values during less intense water use years was primarily in an area further from the main stream channels. Because this corresponds to a common practice in which water is generally used first by those upstream, the result reinforces the reliability of this approach and points to the potential application of this method for spatially estimating cropped area in irrigated fields. The method also captured probable water management scenarios where a unique year-to-year variability was identified in addition to water use difference between upstream and downstream areas. The existence of a variable temporal pattern between the hot and cold pixels during the crop season is also believed to be potentially useful in detecting time of start of season for crop monitoring activities. However, further examination of the relationship between time series of ETa and NDVI is needed.
Although the results obtained from the thermal-based ET fraction approach in SSEB are encouraging for applications in remote locations where field-based information is not readily available, it is recommended that the method needs to be further investigated and validated using more detailed surface energy balance methods and field data under different hydro-climatic conditions.


