Impact of Macroeconomic, Governance and Risk Factors on FDI Intensity—An Empirical Analysis


Abstract
:1. Introduction
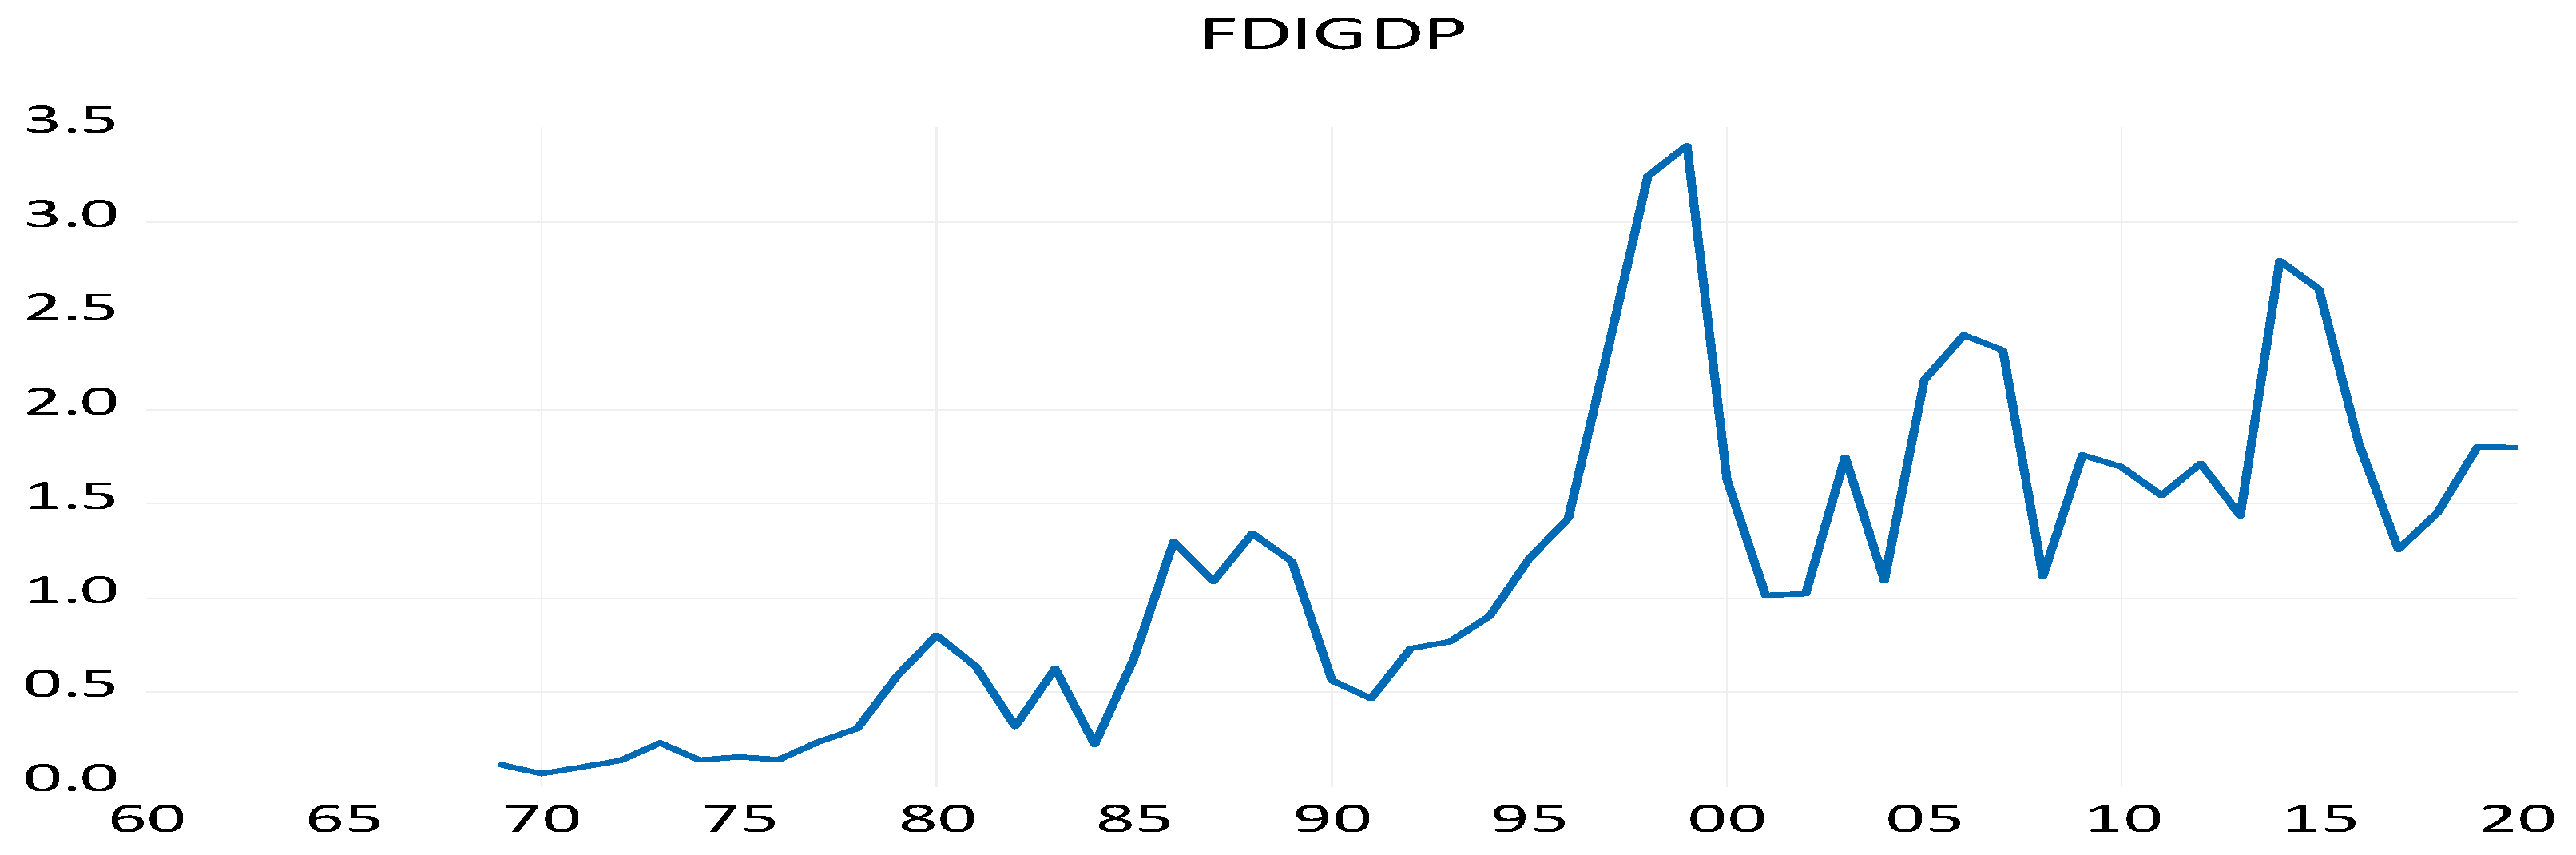
1.1. FDI in US
1.2. Objective of the Study
2. Review of Literature
3. Data and Methodology
3.1. General Model
3.2. Analysis and Interpretation
3.3. Unit Root Test for Stationarity
3.4. Unit Root Break in FDIGDP
4. Regression Results
5. Conclusions
6. Limitations
Author Contributions
Funding
Conflicts of Interest
References
- Alfaro, Laura. 2003. Foreign Direct Investment and Growth: Does the Sector Matter? Boston: Harvard Business School, p. 32. [Google Scholar]
- Aliber, Robert Z. 1970. A theory of direct foreign investment. In The International Corporation. Edited by Charles P. Kindleberger. Cambridge: MIT Press. [Google Scholar]
- Anderson, John, and Dylan Sutherland. 2015. Developed economy investment promotion agencies and emerging market foreign direct investment: The case of Chinese FDI in Canada. Journal of World Business 50: 815–25. [Google Scholar]
- Baltagi, Badi, Peter Egger, and Michael Pfaffermayr. 2008. Estimating regional trade agreement effects on FDI in an interdependent world. Journal of Econometrics 145: 194–208. [Google Scholar]
- Bergstrand, Jeffrey H., and Peter Egger. 2006. Trade Costs and Intra-Industry Trade. Review of World Economics 142: 433–58. [Google Scholar]
- Bermejo Carbonell, Jorge, and Richard A. Werner. 2018. Does Foreign Direct Investment Generate Economic Growth? A New Empirical Approach Applied to Spain. Economic Geography 94: 425–56. [Google Scholar] [CrossRef]
- Bilgili, Faik, Nadide Sevil, Halici Tuluce, and Ibrahim Dogan. 2012. The determinants of FDI in Turkey: A Markov Regime-Switching approach. Economic Modelling 29: 1161–69. [Google Scholar]
- Cavallari, Lilia, and Stefano D’Addona. 2013. Business cycle determinants of US foreign direct investments. Applied Economics Letters 20: 966–70. [Google Scholar]
- Cushman, David O. 1988. Exchange rate uncertainty and foreign direct investments in the United States. Review of World Economics (Weltwirtshaftlihes Archiv) 124: 322–35. [Google Scholar]
- De Mello, Luiz R. 1999. Foreign direct investment-led growth: Evidence from time series and panel data. Oxford Economic Papers 51: 133–51. [Google Scholar]
- Demirhan, Erdal, and Mahmut Masca. 2008. Determinants of foreign direct investment flows to developing countries: A cross-sectional analysis. Prague Economic Papers 4: 356–69. [Google Scholar]
- Diana, N., Peline Kombui, and Richard Angelous Kotey. 2019. Foreign Direct Investment in an Emerging Economy: Exploring the Determinants and Causal Linkages. Academic Journal of Economic Studies 5: 51–62. [Google Scholar]
- Dickey, David A., and Wayne A. Fuller. 1979. Distribution of the Estimators for Autoregressive Time Series with a Unit Root. Journal of the American Statistical Association 74: 427–31. [Google Scholar]
- Elliott, Graham, Thomas J. Rothenberg, and James H. Stock. 1996. Efficient Test for Autoregressive Unit root. Econometrica 64: 813–36. [Google Scholar]
- Fung, K. C., Alicia Garcia-Herrero, and Alan Siu. 2009. A comparative empirical examination of outward foreign direct investment from four Asian economies: People’s Republic of China; Japan; Republic of Korea; and Taipei, China. Asian Development Review 26: 86–101. [Google Scholar]
- Gheorghe, Zaman, and Valentina Vasile. 2012. Macroeconomic impact of FDI in Romania. Procedia Economic and Finance 3: 3–11. [Google Scholar]
- Goldberg, Linda S., and Charles D. Kolstad. 1995. Foreign direct investment, exchange rate variability and demand uncertainty. International Economic Review 36: 855–73. [Google Scholar]
- Grosse, Robert, and Len J. Trevino. 1996. Foreign Direct Investment in the United States: An Analysis by Country of Origin. Journal of International Business Studies 27: 139–55. [Google Scholar]
- Gujarati, Damodar N. 2002. Basic Econometrics. New York: McGraw-Hill Higher Education. [Google Scholar]
- Herzer, Dierk. 2012. How does foreign direct investment really affect developing countries’ growth? Review of International Economics 20: 396–414. [Google Scholar]
- Hiratsuka, Daisuke. 2006. Outward FDI from and Intraregional FDI in ASEAN: Trends and Drivers. Discussion Paper No. 77. Chiba: Institute of Developing Economies (IDE), JETRO. [Google Scholar]
- Jang, Yong Joon. 2011. The impact of bilateral free trade agreements on bilateral foreign direct investment among developed countries. World Economy 34: 1628–51. [Google Scholar]
- Jyun-Yi, Wu, and Hsu Chih-Chiang. 2008. Does Foreign Direct Investment Promote Economic Growth? Evidence from a Threshold Regression Analysis. Economics Bulletin 15: 1–10. [Google Scholar]
- Kisto, Medha. 2017. Determinants of Foreign Direct Investment in Mauritius: Evidence from Time Series Data. International Journal of Scientific and Technology Research 6: 367–77. [Google Scholar]
- Kyrkilis, Dimitrios, and Pantelis Pantelidis. 2003. Macroeconomic determinants of outward foreign direct investment. International Journal of Social Economics 30: 827–36. [Google Scholar]
- Leong, Shi Ting, and Chew Ging Lee. 2019. The determinants of Singapore’s outward foreign direct investment to China and Hong Kong. The Journal of Developing Areas 53: 95–108. [Google Scholar]
- Lin, Steven. 1996. Causes of Japanese firms’ direct investments in US manufacturing industries. Applied Economics 28: 1143–51. [Google Scholar]
- MacKinnon, James G. 1991. Critical Values of Cointegration Tests. In Long-Run Economic Relationships: Readings in Cointegration. Edited by Robert E. Engle and Clive W. J. Granger. New York: Oxford University Press, chp.13. [Google Scholar]
- Moreira, Sandrina Berthault. 2009. The determinants of foreign direct investment: What is the evidence for Africa? Magazine of the Graduate Program in Education 3: 83–104. [Google Scholar]
- Mugableh, Mohamed Ibrahim. 2015. Time Series Analysis of Inward Foreign Direct Investment Function in Malaysia. Procedia - Social and Behavioral Sciences 172: 679–85. [Google Scholar]
- Nguyen, Thi Tuong Anh, and Quang Hung Doan. 2016. Chinese Outward Foreign Direct Investment: Is ASEAN a New Destination? SECO/WTI Academic Cooperation Project Working Paper Series 2016/06; Bern, Switzerland: World Trade Centre Institute, University of Bern. [Google Scholar]
- Olofsdotter, K. 1998. Foreign direct investment, country capabilities and economic growth. Review of World Economics 134: 534–47. [Google Scholar]
- Onyeiwu, Steve, and Hemanta Shrestha. 2004. Determinants of Foreign Direct Investment in Africa. Journal of Developing Societies 20. Available online: http://journals.sagepub.com/doi/abs/10.1177/0169796X04048305 (accessed on 10 June 2020).
- Pelinescu, Elena, and Magdalena Radulescu. 2009. The impact of foreign direct investment on the economic growth and countries’ export potential. Romanian Journal of Economic Forecasting 4: 153–69. [Google Scholar]
- Pugel, Thoma. 1981. The Determinants of Foreign Direct Investment: An Analysis of US Manufacturing Industries. Managerial and Decision Economics 2: 220–28. [Google Scholar]
- Sandhu, Namrata, and Neha Gupta. 2016. Determinants of Inward Foreign Direct Investment. SCMS Journal of Indian Management 13: 83–94. [Google Scholar]
- Singhania, Monica, and Akshay Gupta. 2011. Determinants of foreign direct investment in India. Journal of International Trade Law and Policy 10: 64–82. [Google Scholar]
- Stevens, Guy. 1998. Exchange rates and foreign direct investments: A note. Journal of Policy Modeling 20: 393–401. [Google Scholar]
- Tan, Bee Wah, Koi Nyen Wong, and Soo Khon Goh. 2018. The surge in INTRA-ASEAN Outward foreign direct investment and its key determinants: Evidence using pooled mean group approach. International Journal of Business & Society 19: 47–362. [Google Scholar]
- Travalini, Joanna Robin. 2009. Foreign Direct Investment in the United States: Achieving a Balance between National Economy Benefits and National Security Interests. Northwestern Journal of International Law & Business 29: 778–800. [Google Scholar]
- Wei, Song Zan Chiou, and Zhen Zhu. 2007. A revisit to the outward FDI determinants: Further evidence from count panel data models with fixed effects. Applied Economics Letters 14: 809–12. [Google Scholar]
- Yeaple, Stephen. 2003. The role of skill endowments in the structure of US outward foreign direct investment. Review of Economics and Statistics 85: 726–34. [Google Scholar]
- Zhang, Lawrence Huiyan. 2003. Did European Integration Attract More FDI Inflows? Baltimore: Mimeo, John Hopkins University. [Google Scholar]
- Zvezdanovic, Jelena. 2013. Analyzing FDI Economic Effects and Determinants in SEE Economies: Comparative Approaches. Our Economy 59: 67–75. [Google Scholar]
| 1 | Doing Business-2020 report, World Bank Group, https://www.doingbusiness.org/content/dam/doingBusiness/country/u/united-states/USA.pdf. |
| 2 | World Investment Report, 2020, United Nations Conference on Trade and Development, 30th anniversary edition, United Nations. https://unctad.org/system/files/official-document/wir2020_en.pdf. |


| Sl. No. | Variable Code | Explanation about Variable | Type of Variable |
|---|---|---|---|
| 1 | FDIGDP | FDI net inflows as per cent of GDP. | Dependent |
| 2 | LTGB10 | 10 year long term government bond yield for US in Percent Annual | Macroeconomic |
| 3 | EMPLOY | Employment level, log of thousands of persons self-employed in all industries. | |
| 4 | EURDEX | Euro dollar exchange rate | |
| 5 | INFLA | Annual inflation based on consumer prices in Percent | |
| 6 | INFRA | Infrastructural proxy based on mobile cellular subscriptions in the US, number per 100 people. | |
| 7 | POPUGR | Population growth in USA, percent change at annual rate | |
| 8 | RGDICFC | Log of consumption value of fixed capital under the category of real gross domestic investment in billions of dollars. | |
| 9 | RDI | Log of research and development investment in billion dollars. | |
| 10 | CPGDI | Corporate profits as share of gross domestic income, percent annual. | |
| 11 | NETEXPGDP | Net exports of goods and services as percent of shares of gross domestic product, annual | |
| 12 | NETIMGDP | Net imports of goods and services as percent of shares of gross domestic product, annual | |
| 13 | SMCAPGDP | Stock market capitalization to GDP for USA, percent, annual | |
| 14 | NFCI | National Financial Condition Index | Financial and Risk |
| 15 | CBOE VIX | Chicago Board of Equity Volatility Index | |
| 16 | EMVTI | Equity Market Volatility Tracker Index | |
| 17 | Voice and Accountability (VA) | Reflects the perceptions of the extent to which a country’s citizens are able to participate in selecting their government as well as freedom of expression, freedom of association and free media | Governance Indicator |
| 18 | PS | Political stability and absence of violence measures the perception of likelihood of political instability and /or politically motivated violence. | |
| 19 | GOVTEFF | Reflects the perception of the quality of public services, the quality of the civil service and the degree of its independence from political pressures, the quality of policy formulation and implementation and the credibility of the government’s commitment to such policies. | |
| 20 | REGQUA | Reflects the perceptions of the ability of the government to formulate and implement sound policies and regulations that permit and promote private sector development. | |
| 21 | CCORRUP | Reflects the perceptions of the extent to which public power is exercised for private gain which includes both petty and grand forms of corruption as well as capture of the state by elites and private interests. | |
| 22 | RULELAW | Reflections the perceptions of the extent to which agents have confidence in and abide by the rules of society, and in particular the quality of contract enforcement, property rights, the right police, and the courts, as well as the likelihood of crime and violence. | |
| 23 | CCORRUP | Reflects the perceptions of the extent to which public power is exercised for private gain which includes both petty and grand forms of corruption as well as capture of the state by elites and private interests. | |
| 24 | RULELAW | Reflections the perceptions of the extent to which agents have confidence in and abide by the rules of society, and in particular the quality of contract enforcement, property rights, the right police, and the courts, as well as the likelihood of crime and violence. |
| Mean | Median | Standard Deviation | Sample Variance | Kurtosis | Skewness | Range | Minimum | Maximum | Count | |
|---|---|---|---|---|---|---|---|---|---|---|
| FDIGDP | 1.19 | 1.10 | 0.85 | 0.72 | −0.05 | 0.67 | 3.34 | 0.07 | 3.41 | 52 |
| LTGB10 | 5.99 | 5.65 | 2.87 | 8.24 | 0.28 | 0.76 | 12.11 | 1.80 | 13.91 | 61 |
| EURDEX | 1.20 | 1.21 | 0.16 | 0.03 | −0.55 | −0.33 | 0.58 | 0.90 | 1.47 | 22 |
| EMPLOY | 3.96 | 3.98 | 0.06 | 0.00 | −0.56 | −0.81 | 0.18 | 3.85 | 4.03 | 61 |
| INFLA | 3.71 | 2.95 | 2.76 | 7.60 | 3.10 | 1.70 | 13.90 | −0.36 | 13.55 | 61 |
| INFRA | 44.52 | 22.75 | 48.05 | 2309.15 | −1.21 | 0.60 | 136.60 | 0.00 | 136.60 | 46 |
| POPUGR | 1.00 | 0.96 | 0.24 | 0.06 | 0.44 | 0.22 | 1.18 | 0.47 | 1.66 | 60 |
| RGDICFC | 2.45 | 2.50 | 0.19 | 0.04 | −1.21 | −0.22 | 0.65 | 2.07 | 2.72 | 61 |
| RDI | 2.09 | 2.22 | 0.52 | 0.27 | −1.20 | −0.36 | 1.73 | 1.10 | 2.83 | 61 |
| CPGDI | 8.17 | 8.20 | 1.45 | 2.09 | −0.67 | 0.20 | 5.90 | 5.50 | 11.40 | 61 |
| NETEXPGDP | −1.70 | −1.30 | 1.82 | 3.31 | −0.82 | −0.33 | 6.60 | −5.60 | 1.00 | 61 |
| NETIMGDP | 10.66 | 10.50 | 4.13 | 17.02 | −1.10 | −0.15 | 13.40 | 4.00 | 17.40 | 61 |
| SMCAPGDP | 126.14 | 130.96 | 16.70 | 279.05 | −0.85 | −0.42 | 60.45 | 92.76 | 153.21 | 25 |
| VA | 1.58 | 1.60 | 0.06 | 0.00 | 0.36 | −1.11 | 0.20 | 1.44 | 1.64 | 25 |
| PS | 0.53 | 0.49 | 0.33 | 0.11 | 0.05 | −0.27 | 1.31 | −0.23 | 1.08 | 25 |
| GOVTEFF | 1.59 | 1.55 | 0.11 | 0.01 | −0.60 | 0.85 | 0.34 | 1.46 | 1.80 | 25 |
| REGQA | 1.52 | 1.57 | 0.15 | 0.02 | −0.93 | −0.34 | 0.50 | 1.26 | 1.76 | 25 |
| CCORRUP | 1.46 | 1.40 | 0.17 | 0.03 | −0.74 | 0.57 | 0.61 | 1.22 | 1.83 | 25 |
| RULELAW | 1.58 | 1.60 | 0.06 | 0.00 | 0.36 | −1.11 | 0.20 | 1.44 | 1.64 | 25 |
| NFCI | 0.00 | −0.33 | 0.91 | 0.84 | 1.95 | 1.64 | 3.60 | −0.97 | 2.63 | 50 |
| CBOE VIX | 19.59 | 17.54 | 6.25 | 39.04 | −0.47 | 0.69 | 21.79 | 11.09 | 32.88 | 31 |
| EMVTI | 19.97 | 18.63 | 5.59 | 31.23 | 0.72 | 0.95 | 25.14 | 10.32 | 35.46 | 36 |
| Variable | ADF | PP | DF-GLS (Max Lag Length 4) | |||
|---|---|---|---|---|---|---|
| With Drift and Trend | With Drift and Trend | Tau | Lag Length | |||
| I(0) | I(0) with Lag1 | I(0) | I(0) with Lag1 | |||
| FDIGDP | −3.59 ** | −4.22 * | −3.59 ** | −3.78 ** | −4.18 * | 1 |
| LTGB10 | −1.79 | −2.07 | −1.79 | −1.86 | −1.63 | 3 |
| EURDEX | −1.26 | −1.82 | −1.26 | −1.35 | −1.27 | 1 |
| EMPLOY | −1.16 | −1.55 | −1.16 | −1.35 | −1.26 | 1 |
| INFLA | −2.8 | −3.54 ** | −2.8 | −2.98 | −2.99 | 2 |
| INFRA | −2.07 | −1.89 | −2.07 | −1.92 | −1.92 | 4 |
| POPUGR | −2.22 | −2.78 | −2.22 | −2.44 | −2.21 | 1 |
| RGDICFC | −1.23 | −3.66 ** | −1.23 | −1.5 | −3.46 ** | 3 |
| RDI | −0.48 | −1.08 | −0.48 | −0.68 | −0.89 | 3 |
| CPGDI | −2.34 | −3.25 ** | −2.34 | −2.65 | −3.33 ** | 1 |
| NETEXPGDP | −1.72 | −2.14 | −1.72 | −1.96 | −2.26 | 1 |
| NETIMGDP | −2.11 | −1.68 | −2.11 | −2.06 | −2.07 | 1 |
| SMCAPGDP | −2.46 | −3.04 | −2.46 | −2.63 | −3.12 *** | 3 |
| VA | −3.55 ** | −3.32 *** | −3.55 ** | −3.54 ** | −2.71 | 1 |
| PS | −2.02 | −2.34 | −2.02 | −2.13 | −2.45 | 1 |
| GOVTEFF | −3.76 ** | −4.69 * | −3.76 ** | −3.76 ** | −2.85 | 1 |
| REGQA | −2.45 | −2.81 | −2.45 | −2.56 | −2.77 | 1 |
| CCORRUP | −2.24 | −2.68 | −2.24 | −2.31 | −2.28 | 4 |
| RULELAW | −3.55 ** | −3.32 *** | −3.55 ** | −3.54 ** | −2.71 | 1 |
| NFCI | −3.45 ** | −4.17 * | −3.45 ** | −3.67 ** | −4.033 * | 1 |
| CBOE VIX | −2.2 | −2.79 | −2.2 | −2.44 | −2.93 | 1 |
| EMVTI | −2.82 | −2.86 | −2.82 | −2.06 | −2.38 | 1 |
| Variable | ADF | PP | ||
|---|---|---|---|---|
| With Drift and Trend | With Drift and Trend | |||
| I(1) with no Lag | I(1) with 1 Lag | I(1) with no Lag | I(1) with 1 Lag | |
| FDIGDP | −6.79 * | −5.76 * | −6.79 * | −6.79 * |
| Ltgb10 | −6.68 * | −6.63 * | −6.68 * | −6.70 * |
| Eurdex | −4.31 * | −4.13 * | −4.31 * | −4.33 * |
| Employ | −4.85 * | −3.96 ** | −4.85 * | −4.85 * |
| Infla | −6.41 * | −7.31 * | −6.41 * | −6.45 * |
| Infra | −3.87 ** | −3.33 ** | −3.87 * | −3.90 ** |
| Popugr | −5.05 * | −5.04 * | −5.05 * | −5.11 * |
| Rgdicfc | −1.7 | −2.98 | −1.7 | −2 |
| Rdi | −4.17 * | −3.70 ** | −4.17 * | −4.19 * |
| Cpgdi | −5.73 * | 5.99 * | −5.73 * | 5.80 * |
| Netexpgdp | −6.68 * | −4.71 * | −6.68 * | −6.68 * |
| Netimgdp | −8.77 * | −7 * | −8.77 * | −8.80 * |
| Smcapgdp | −3.69 ** | −3.80 ** | −3.69 ** | −3.69 ** |
| Va | −5.69 * | −4.32 * | −5.69 * | −5.71 * |
| Ps | −4.22 ** | −3.02 | −4.22 ** | −4.22 ** |
| Govteff | −6.02 * | −4.74 * | −6.02 * | −6.09 * |
| Regqa | −4.41 ** | −3.37 *** | −4.41 ** | −4.41 ** |
| Ccorrup | −4.56 * | 3.70 ** | −4.56 * | −4.56 * |
| Rulelaw | −5.69 * | −4.23 ** | −5.69 * | −5.71 * |
| Nfci | −6.47 * | −6.53 * | −6.47 * | 6.49 * |
| Cboe vix | −3.61 ** | −2.89 | −3.61 ** | −3.61 ** |
| Emvti | −5.34 * | −4.13 ** | −5.34 * | −5.32 * |
| Variables | Model-1 (Macroeconomic Variables) | Model-2 (Governance) | Model-3 (Financial Risk Factor) | Model-4 | Model-5 |
|---|---|---|---|---|---|
| C | −0.76 (−1.38) | −0.09 (−0.67) | 0.04 (0.36) | −0.44 (−1.81) | −0.57 (−1.79) |
| D(LTGB10) | −0.35 (−1.21) | ||||
| D(EURDEX) | 2.10 (1.21) | 2.65 (2.94) ** | 2.27 (2.46) ** | ||
| D(EMPLOY) | −13.74 (−0.61) | ||||
| D(INFLA) | −0.06 (−0.26) | −0.33 (−2.34) ** | −0.17 (−0.97) | ||
| D(INFRA) | 0.14 (2.31) ** | 0.10 (3.72) * | 0.11 (3.84) * | ||
| D(RGDICFC) | −107.03 (−1.91) *** | −111.54 (−3.93) * | −101.04 (−3.43) ** | ||
| D(POPUGR) | 0.50 (0.17) | ||||
| D(RDI) | 36.52 (1.79) | 33.24 (3.29) * | 33.55 (2.48) ** | ||
| D(CPGDI) | 0.87 (3.55) * | 0.72 (5.76) * | 0.74 (4.71) * | ||
| D(NETEXPGDP) | 1.32 (2.05) *** | 1.19 (4.01) * | 1.20 (3.73) * | ||
| D(NETIMGDP) | 0.40 (0.97) | 0.59 (2.96) ** | 0.47 (2.25) *** | ||
| D(SMCAPGDP) | −0.01 (−0.57) | −0.01 (−1.17) | −0.01 (−1.11) | ||
| D(VA) | 5.54 (2.53) ** | 4.34 (3.10) ** | 4.32 (3.15) ** | ||
| D(PS) | −0.76 (−1.18) | ||||
| D(GOVTEFF) | 0.97 (0.52) | 2.29 (2.02) *** | −2.13 (−1.69) | ||
| D(REGQA) | −2.76 (−1.90) *** | −1.23 (−1.26) | |||
| D(CCORRUP) | −3.13 (−1.79) *** | 0.29 (0.23) | |||
| D(NFCI) | −0.68 (−1.45) | ||||
| D(CBOE_VIX) | 0.06 (1.29) | ||||
| D(EMVTI) | −0.05 (−1.10) | ||||
| R-Squared | 0.74905 | 0.395944 | 0.117643 | 0.928631 | 0.947091 |
| Adjusted R-Squared | 0.372625 | 0.228151 | 0.015832 | 0.841402 | 0.848831 |
| Breusch–Godfrey Serial Correlation LM Test: Observed R-Square | 12.83 * | 2.79 | 1.48 | 9.63 * | 7.49 ** |
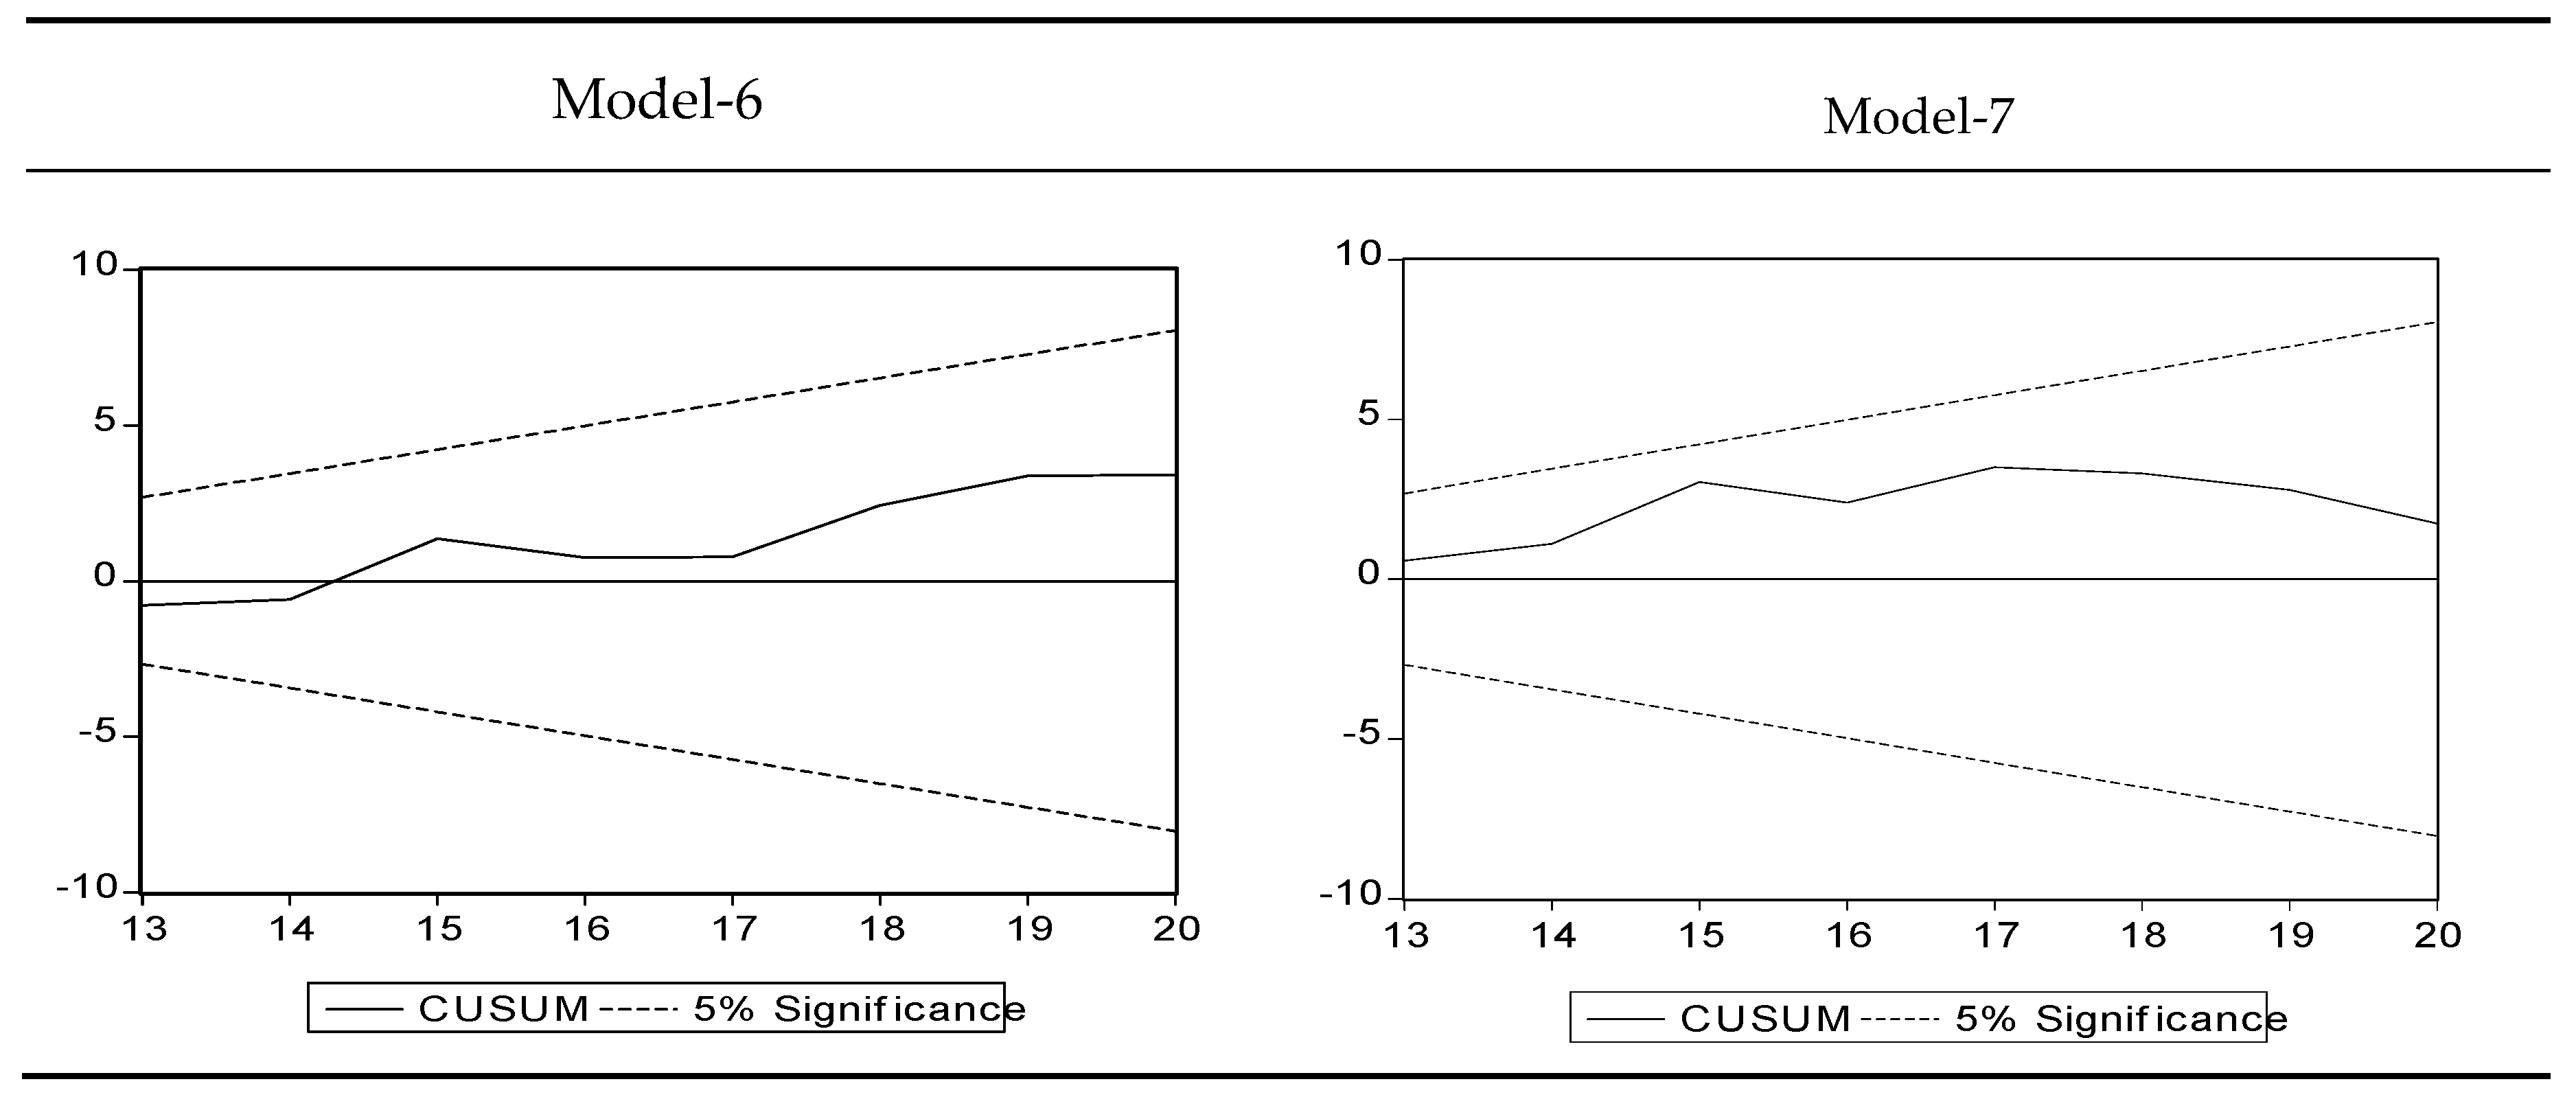
| Cusum Test for Stability |  |  |  |  |  |
| Variables | Model-6 | Model-7 |
|---|---|---|
| C | −0.52 (−2.07) *** | −0.56 (−2.15) *** |
| D(FDIGDP(−1)) | −0.29 (−1.83) | −0.10 (−0.89) |
| D(FDIGDP(−2)) | −0.22 (−1.38) | |
| D(FDIGDP(−3)) | −0.32 (−2.24) | |
| D(FDIGDP(−4)) | −0.11 (−1.05) | |
| D(EURDEX) | 0.90 (0.79) | 2.37 (2.41) ** |
| D(INFLA) | −0.37 (−2.32) *** | −0.20 (−1.08) |
| D(INFRA) | 0.10 (3.81) ** | 0.11 (3.72) * |
| D(RGDICFC) | −101.34 (−3.47) ** | −114.19 (−3.77) * |
| D(RDI) | 32.41 (3.34) ** | 38.19 (3.90) * |
| D(CPGDI) | 0.55 (3.63) ** | 0.80 (6.75) * |
| D(NETEXPGDP) | 1.26 (4.35) * | 1.23 (3.94) * |
| D(NETIMGDP) | 0.69 (3.31) ** | 0.51 (2.20) *** |
| D(SMCAPGDP) | −0.01 (−1.06) | −0.01 (−1.90) *** |
| D(VA) | 5.45 (3.62) ** | 5.68 (4.60) * |
| D(GOVTEFF) | −0.93 (−0.72) | |
| D(REGQA) | −1.67 (−1.81) | |
| R−squared | 0.9654 | 0.92979 |
| Adjusted R−squared | 0.8616 | 0.824476 |
| Breusch−Godfrey Serial Correlation LM Test: Observed R−square | 3.5 | 5.21 |
Publisher’s Note: MDPI stays neutral with regard to jurisdictional claims in published maps and institutional affiliations. |
© 2020 by the authors. Licensee MDPI, Basel, Switzerland. This article is an open access article distributed under the terms and conditions of the Creative Commons Attribution (CC BY) license (http://creativecommons.org/licenses/by/4.0/).
Share and Cite
Sujit, K.S.; Kumar, B.R.; Oberoi, S.S. Impact of Macroeconomic, Governance and Risk Factors on FDI Intensity—An Empirical Analysis. J. Risk Financial Manag. 2020, 13, 304. https://doi.org/10.3390/jrfm13120304
Sujit KS, Kumar BR, Oberoi SS. Impact of Macroeconomic, Governance and Risk Factors on FDI Intensity—An Empirical Analysis. Journal of Risk and Financial Management. 2020; 13(12):304. https://doi.org/10.3390/jrfm13120304
Chicago/Turabian StyleSujit, K. S., B. Rajesh Kumar, and Sarbjit Singh Oberoi. 2020. "Impact of Macroeconomic, Governance and Risk Factors on FDI Intensity—An Empirical Analysis" Journal of Risk and Financial Management 13, no. 12: 304. https://doi.org/10.3390/jrfm13120304
APA StyleSujit, K. S., Kumar, B. R., & Oberoi, S. S. (2020). Impact of Macroeconomic, Governance and Risk Factors on FDI Intensity—An Empirical Analysis. Journal of Risk and Financial Management, 13(12), 304. https://doi.org/10.3390/jrfm13120304