1. Introduction
Industrial activity development is unfortunately usually accompanied by pollution concerns [
1,
2]. This pollution is currently a major threat, negatively affecting human life and the environment [
3]. Wastewater constitutes a major part of industrial waste [
4,
5] and textile effluents are considered some of the major polluting aqueous effluents due to their content of significant amounts of toxic dyes and auxiliary chemicals [
6]. The water consumption for dyeing one kg of textile is around 70 L with 40% yield [
7,
8]. Therefore, as a consequence, the decolorization of textile wastewater has become required worldwide [
9]. During the last decades, several studies were performed for the treatment of textile effluents using biological and chemical treatment methods. Biological methods are extensively applied in the textile industry [
10] owing to their benefits such as low cost and ecofriendly concept, however, these treatments do not always meet the objectives due to the non-biodegradability of a wide range of textile dyes [
11]. Chemical treatments are the most widely used in the decolorization of textile effluents owing to its ease of application [
12,
13]. These methods are usually applied at high pH values using ozone, peroxide or permanganate as oxidizing agents. Nevertheless, the high cost of these techniques and the instability of the oxidizing agents are significant drawbacks. Activated carbon (AC) was also widely used in the decolorization of textile effluents. Commercial or synthesized ACs have been used in the retention of dye from wastewater thanks to their textural properties (physical adsorption) [
14] or chemical surface properties (chemical adsorption) [
15].
Cotton fiber, a lignocellulosic biomass, has been investigated to produce bio-sourced AC. Classical techniques were used to improve the specific surface area and the porosity of carbon materials derived from cotton fibers. Duan et al. [
16] used a mix of chemical and physical activation with H
3PO
4 and microwave treatment to develop the surface area of activated carbon fibers (ACF). Zheng et al. [
17] employed an acidic pretreatment of waste cotton woven as precursor of ACF which was chemically activated. However, the use of chemical or physical activation generates a carbon material with heterogeneous and random pore size distributions which can limit its adsorption capacity for specific application. It has been demonstrated that the heterogeneous distributions of both micro- and mesopore size of conventional carbon material affects its adsorption ability [
18]. To overcome this problem it is necessary to obtain carbon materials with controlled pore architectures in order to improve their adsorption capacity. There are two main types of template approaches—hard and soft-templates—which allow one to obtain carbon materials with controlled pore structures. The first attempt to prepare controlled porous carbon through the hard-template method was investigated by Kyotani et al. [
19]. The channels of a Y zeolite were used as a hard template and the Brunauer-Emmett-Teller (BET) surface area of the obtained carbon exceeded 2000 m
2∙g
−1. In other studies different forms of zeolitic frameworks like ammonium-form zeolite Y, mordenite and ZSM-5 were investigated, showing promising potential to produce suitable carbon material architectures for a wide range of application [
20,
21,
22]. However, the multiple step synthesis reactions along with the harsh conditions used to remove the hard-template have driven researchers to look for more convenient routes for carbon preparation.
In this regard, the use of the soft-template route as an alternative has become more suitable to produce controlled porous carbons. The use of soft templates presents many advantages like the reduction of the number of synthesis steps and the facility of removal of the templates by simple thermal annealing. Ghimbeu Matei et al. recently proposed a green approach to produce carbon materials with ordered architecture pores and controlled pore size distributions using environmentally friendly phenolic-resin precursors [
23]. He used melamine to produce honeycomb porous carbons for electrode material production [
24]. Shu prepared a nanoporous carbon for vanadium-based active electrode materials using polyvinylpyrrolidone (PVP) as soft template [
25]. Ma et al. elaborated a mesoporous carbon composite through a soft-template route for electrochemical methanol oxidation [
26]. Balach et al. employed a cationic polyelectrolyte as soft template to synthetize a porous carbon with a hierarchical nanostructure [
27]. In general, the soft-template approach consists in the use of specific molecules to produce carbon materials with desired porosity. During a calcination process these molecules are degraded, resulting in a regular pore size distribution [
28,
29,
30].
Recently, many research studies were focused on the utilization of bio-sourced AC as eco-friendly and low cost adsorbents for dyes from textile effluent. Regdi et al. used
Persea americana as a precursor of an AC to remove cationic dye from textile wastewater [
31]. Macedo et al. synthesized a mesoporous activated carbon derived from coconut coir to remove Remazol Yellow dye from textile effluent [
32]. Noorimothagh used an activated carbon prepared from Iranian milk vetch for the adsorption of Acid Orange 7 dye using a batch flow mode experimental reactor [
33]. Georgin et al.’s [
34] studies focused on the elaboration of activated carbon through a microwave irradiation-pyrolysis using peanut shell raw precursor which was further used as an adsorbent of Direct Black 38 organic dye.
The utilization of composite materials based on AC in the adsorption of dyes from textile effluents has received significant attention in recent years. Carbon composites were investigated as new potential materials that can increase the AC adsorption capacity. Singh et al. investigated the adsorption of Acid Red 131 dye using a TiO
2-activated carbon (TiO
2/AC) nanocomposite prepared through a sol-gel process [
35]. The adsorption behavior of Alizarin Red S (ARS) in aqueous solution was investigated by Fayazi et al. by means of an activated carbon/γ-Fe
2O
3 nanocomposite [
36]. Sandeman et al. examined the adsorption of anionic Methyl Orange, cationic Methylene Blue and Congo Red using a porous poly(vinyl alcohol)/AC composite [
37]. All these works highlight that the adsorption behavior of carbon materials is influenced by several parameters such as their surface chemical groups and their reactivity [
38,
39], textural characteristics [
40] and the composition of the lignocellulosic precursors [
41,
42].
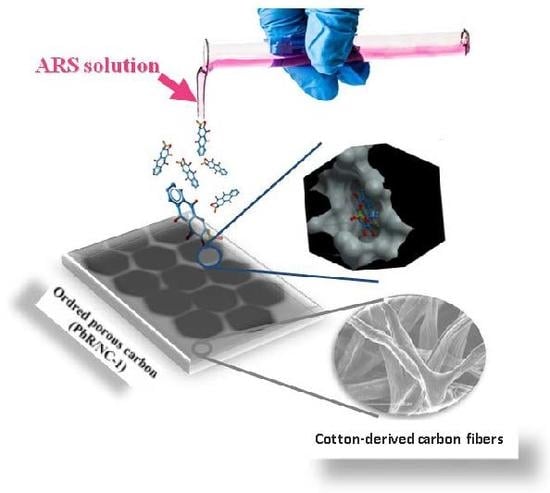
The main purpose of this work was to optimize the production of an eco-friendly composite carbon using a green phenolic resin as matrix and waste cotton fiber as reinforcement. The composite carbon morphology and textural properties were analyzed. Then, the optimized composite carbon was used to effectively remove ARS from aqueous solution. The impact of the experimental conditions such as temperature, pH, contact time, and initial dye concentration on the adsorption capacity was studied. The interactions of carbon composite network with the ARS dye were assessed by flow micro-calorimetry (FMC).
2. Materials and Methods
2.1. Phenolic Resin/Cotton Composite Carbon Preparation
Activated carbon (NC) was synthetized from waste cotton non-woven using the procedure as reported in our previous study [
43]. This material was used for comparison purposes. For the preparation of phenolic resin, phloroglucinol (1,3,5-benzenetriol, C
6H
6O
3), glyoxylic acid monohydrate (C
2H
2O
3·H
2O), Pluronic F127 triblock copolymer [poly(ethylene oxide)-block–poly (propylene oxide)-block–poly(ethylene oxide), PEO
106-PPO
70-PEO
106, M
w = 12,600 Da], and absolute ethanol (C
2H
5OH) were obtained from Sigma-Aldrich (Lyon, France). Briefly, the carbon precursors, phloroglucinol (0.41 g) and glyoxylic acid monohydrate (0.30 g) and the Pluronic F127 soft-template (0.80 g) were dissolved in a mixture of ethanol and distilled water in the proportion of 50/50 (10 mL/10 mL). The obtained solution was stirred until it became transparent [
23].
The preparation of the different composites was done by adding an appropriate quantity of non-woven waste cotton into 20 mL of resin solution in a rectangular smooth glass mold. The obtained composite was left for eight hours at room temperature in a fume hood in order to completely evaporate the ethanol/water solvent. Subsequently, the composite material received a thermo-polymerization treatment in an oven for 8 h at 80 °C, followed by 16 h at 150 °C in order to thermo-polymerize the phenolic resin. After this treatment, the sample was introduced in a horizontal oven and pyrolysed under a flow of argon by increasing the temperature from room temperature to 700 °C (heating rate of 5 °C/min, dwell time of 1 h).
As summarized in
Table 1, two composites and two references samples were prepared. NC refers to the carbon with 100 wt % cotton, PhR/NC-1 composite contains 30 wt % of phenolic resin, PhR/NC-2 composite contains 70 wt % of phenolic resin and PhR was phenolic resin-derived carbon.
2.2. Material Characterization
Various techniques were employed to characterize the raw materials and their composites. The thermal degradation behavior of the raw materials under an inert atmosphere was investigated using a thermo-gravimetric analyzer (TGA 851e, Mettler-Toledo, Columbus, OH, USA). A sample of 5 mg of was placed in an alumina crucible and a heating rate of 5 °C∙min−1 up to 800 °C under inert gas flow (nitrogen) was applied.
The materials’ morphology was analyzed by scanning electron microscopy (FEI model Quanta 400 SEM, Philips, Andover, MA, USA).
Transmission electron microscopy (TEM) was used in order to determine the structures of the carbon materials. A small and representative sample was tested with an ARM-200F instrument working at 200 kV (Jeol, Peabody, MA, USA).
The PhR and PhR/NC composite textural properties were investigated by recording the N2 adsorption isotherms at 77 K with an ASAP 2020 instrument (Micromeritics, Atlanta, GA, USA). Previous to analysis, carbon material was out-gassed overnight under vacuum at 623 K. The BET surface area (SBET) of PhR/NC composite carbon was determined from N2 adsorption isotherms in relative pressure (P/P0) range of 0.05–0.30. The micropore surface (Smic) area and the micropore volume (Vmicro) were investigated by the t-plot method. The average pore diameter (Dp) was obtained according to the Density Functional Theory (DFT) method.
2.3. Batch Adsorption Tests
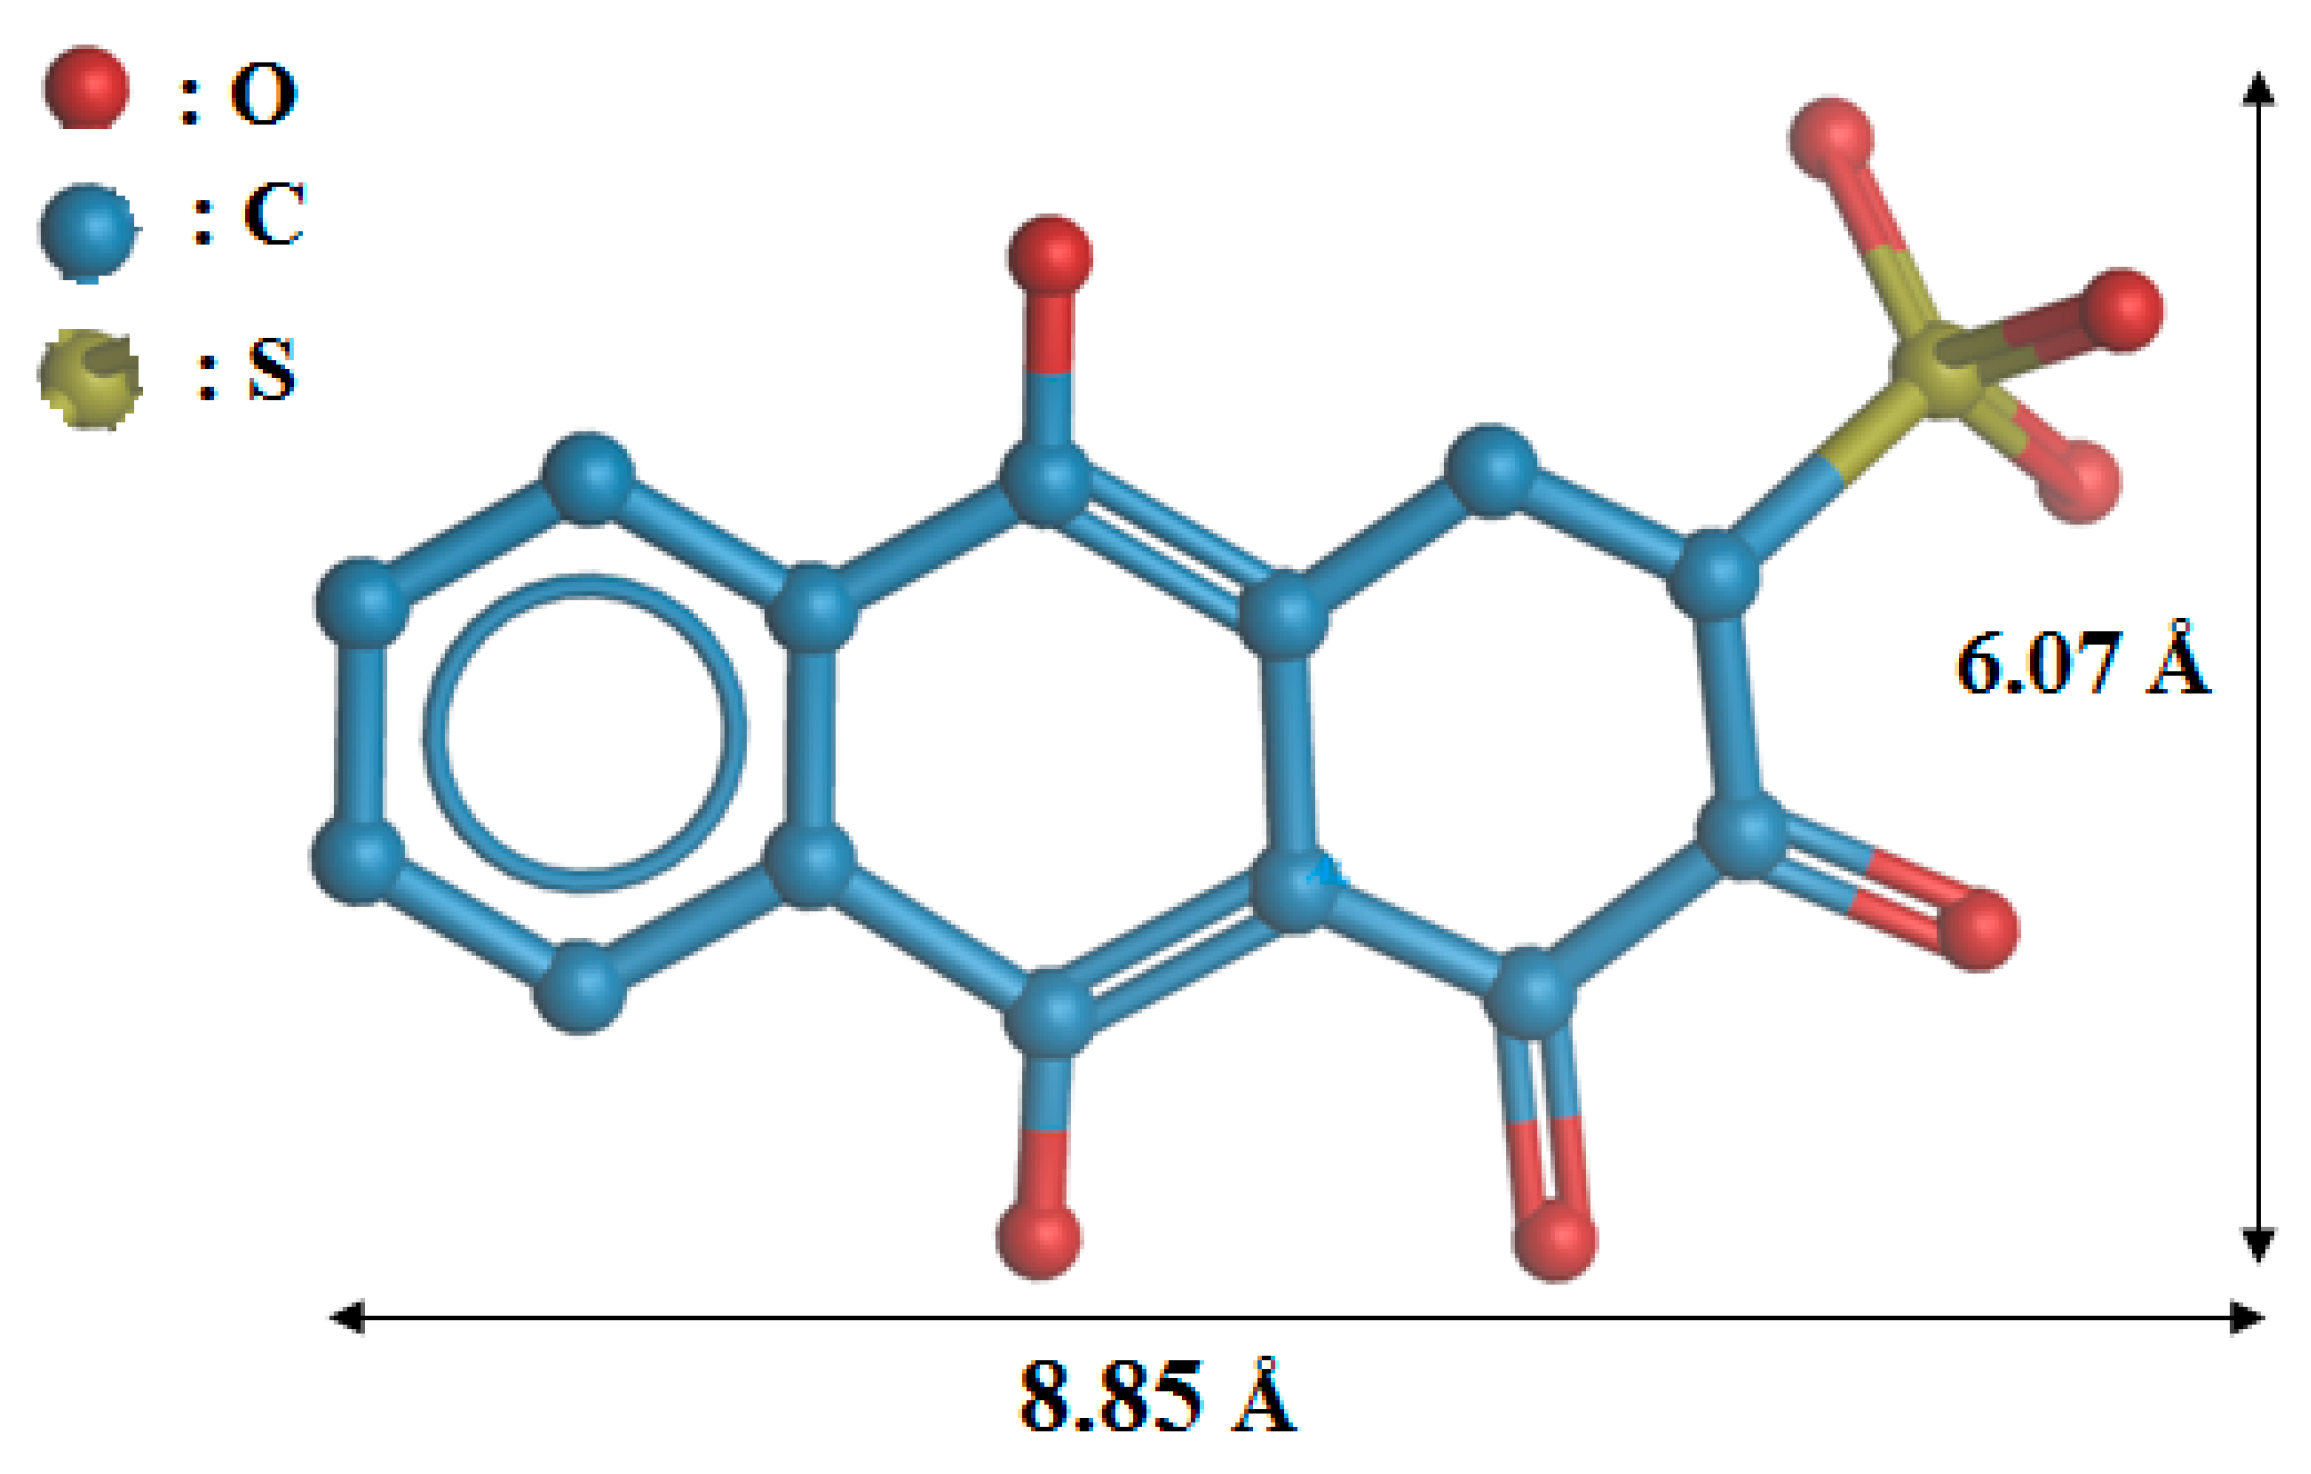
Adsorption tests were performed using ARS as a representative dye used in textile industry. The ARS was purchased from Sigma Aldrich (Lyon, France). Its chemical structure is shown in
Figure 1. For all experiments, the appropriate amount of ARS dye was dissolved in distilled water to obtain solutions with distinct concentrations. Adsorption tests were performed using a shaking thermostat water bath at a constant agitation speed of 200 rpm. The effect of the experimental conditions on the removal of ARS was studied by varying the pH of solution (3–8), the dye initial concentration (5–200 mg∙L
−1), the temperature of solution (18–40 °C) and the contact time (5–1440 min). The ARS concentration was measured with a double beam UV-visible spectrophotometer. All experiments were repeated three times to ensure good reproducibility. The ARS adsorption capacity was determined according to the Equation (1):
where: q (mg∙g
−1) is the carbon adsorption capacity, C
i (mg∙L
−1) represent the initial ARS concentration, C
e (mg∙L
−1) is the equilibrium concentration of ARS, V (L) is the volume of initial ARS solution while M (g) is the mass of carbon adsorbent.
2.4. Calorimetric Experiments
Calorimetric adsorption is a robust method for the thermodynamic characterization of liquid-solid interfacial phenomena, as well as for the characterization of the surface of carbonaceous materials. For the calorimetric study, a Microscal 3Vi Flow Micro-Calorimeter (FMC, London, UK) coupled with UV-visible spectrometer (SPD 20 A, Shimadzu, Kyoto, Japan) developed by Microscal Ltd. (London, UK) was used. The calorimetric cell (0.17 cm3) was delimited by two PTFE connectors allowing the supply and discharge of the solvent flow. It was filled in the most compact way possible with the carbon adsorbate. A permanent and controlled flow of solvent was carried out and the solution was injected into the flow via an injection loop of determined volume.
Carbon material (34 mg) was previously separated and placed in the cell for 15 min under vacuum. Then additional material was used to meet the filling and compacting conditions. A buffer solution (pH = 3) at a flow rate of 3.3 mL·h−1 was employed as vector solvent. The probe molecule used in this experiment was a solution of ARS (10 g·L−1) in the same buffer solution as the vector fluid. The experiments were performed at room temperature A UV-Visible downstream detector was used at a wavelength of λ = 339 nm corresponding to absorption maximum of ARS. Firstly the sample was placed under buffer solution flow (3.3 mL·h−1) in order to obtain equilibrium. The probe molecule (ARS) is injected in the flow thanks to a determined-volume loop. When the probe molecules (ARS) come into contact with the surface of the adsorbent (carbon material: NC and PhR/NC1), there will be a release of heat and the variation of adsorption enthalpy was measured. The heat detector is based on a Wheatstone bridge system with 2 thermistors (with sensitivity of 10−5 °C) and reference resistors. A heat change will make their electrical resistance vary, which will temporarily destabilize the Wheatstone bridge until extinction of the thermal effect. This destabilization will be observed by a change of the equilibrium electrical current (I = 0 without heat change) or electrical power in the Wheatstone bridge detector (P = U·I with a constant voltage).
FMC calibration has been realized via the resistance calibration (Pt-100). The total heating change during thermal phenomena corresponds to the integrated change in heating power. By varying the power and the emission time (E = P·∆t), we can simulate the energy release and calibrate the FMC. The uncertainly measurement of adsorption energy was estimated at ±3 mJ.
At the exit of FMC, the non-adsorbed part or/and desorbed part of ARS was measured by the associated UV-Visible spectrometer at λ = 339 nm. The calibration of the UV-Visible detector is realized by a series of loops directly connected to the apparatus and placed under the same flow conditions.
3. Results and Discussion
3.1. Morphology and Structure
After the carbonization process, the structure of obtained carbon materials can vary according to their initial composition. NC carbon, containing 100% of cotton fibers, was composed by a web of randomly oriented carbonized fibers (
Figure 2a). When the precursor was the mix of cotton fibers and phenolic resin the surface structure of the obtained carbon composite changed. It can be clearly seen that the phenolic resin coats the cotton fiber and fills up the cavities in the fiber web (
Figure 2b,c). The distribution of phenolic resins becomes more homogeneous as the ratio of phenolic resin increases. For PhR/NC-2 (
Figure 2c) the distribution is more homogeneous and occupies more cavities in the cotton web than PhR/NC-1 (
Figure 2b) composite carbon which the resin ratio is 70% and 30%, respectively. When only phenolic resin is used, no specific morphology was observed, the material is block-like and the particle size depends on the grinding conditions (data not shown).
Considering that an important component of the phenolic resin was the Pluronic F127 used as template, its increasing ratio favors the formation of ordered mesoporous structures around the carbonized cotton fibers. The structure of the carbonized phenolic resin zone was investigated in more detail by TEM. By direct observation, it can be seen clearly that the pure phenolic resin carbon (PhR) exhibit a highly ordered mesopore structure organization with hexagonal arrays (
Figure 3A). This result was in accord with previous studies [
23] concerning the use of a similar precursor. However, in the presence of both carbonized cotton fibers and phenolic resin, the pore organization become less ordered as the ratio of phenolic resin decreased. Indeed, in the presence of only 30 wt % of phenolic resin (PhR/NC-1) in the carbon material, a pore array discontinuity appears and the carbon surface is composed by a mix of fiber surfaces and organized pore distribution zones caused by the template (
Figure 3C). This particular structure organization was due to the fact of the fibers were somehow connected through a mesoporous carbon network. It is worth mention that the carbon fibers cannot be observed by TEM due to the limitations of this technique for thick materials.
3.2. Texture/Porosity
The N
2 adsorption/desorption isotherms plot of carbon materials prepared with different ratios of phenolic resin are presented in
Figure 4a. An increase of the quantity of nitrogen adsorbed is observed with the increase of the phenolic resin quantity in the composite material. The volume of micropores along with increasing phenolic resin proportion (
Figure 4b) is also higher in the case of PhR carbon which suggests that the phenolic resin present in the composite carbon PhR/NC-1 and PhR/NC-2 favors micropores formation. At the relative pressure range of 0.98–1.00, the isotherm of PhR/NC-1 and PhR/NC-2 composite presents a high adsorbed volume compared with NC [
43] carbon, highlighting an improvement in the pore volume.
It should be remarked that an increase of the phenolic resin ratio induces a change of isotherm type from the- type-I specific to microporous materials (the case of PhR/NC-1 carbon) to a mixture of type-I and type-IV, characteristic of micro and mesoporous materials (the case of both PhR/NC-2 and PhR carbon). Moreover, if phenolic resin was added to cotton fiber the hysteresis loop becomes H-1 type. This hysteresis type was probably due to the specific distributions of pore size exhibiting a narrow organization of relatively uniform (geometrical) pores. H-1 hysteresis is known as one of the intrinsic characteristics of regular pore structure materials [
44,
45]. In a previous study, a similar hysteresis has been shown in the presence of template in the phenolic resin and when the precursor mass exceeded the mass of template [
23].
The pore size distribution (
Figure 4b) shows for PhR/NC-1 materials only the presence of micropores (size < 2 nm). This is related to the low quantity of phenolic resin (30%) compared to carbon fibers (70%). This is not surprising taking into consideration that the pure NC carbon is predominantly microporous (see
Table 2). For the PhR/NC-2 composite, the increase in the phenolic resin content up to 70% allows the microporosity to increase and in addition the creation of mesoporosity. The mesopore size distribution (
Figure 4b) presents a maximum at ~10 nm. When only phenolic resin is used (PhR) the microporosity and mesoporosity further increase, and the pore size as well, reaching a maximum at 17 nm (
Figure 4b). Therefore, mixing of phenolic resin with cotton fiber as carbon precursor generates a mesoporous structure and improves the microporosity, due mainly to the phenolic resin incorporation.
The effect of resin ratio on the textural features of the obtained carbon material has been evaluated. It can be seen that when the ratio of phenolic resin increases from 30% to 70%, the BET surface area and the total pore volume (V
t) of PhR/NC-1 and PhR/NC-2 composite carbon increase from 394 m
2∙g
−1 to 436 m
2∙g
−1 and from 0.14 cm
3∙g
−1 to 0.18 cm
3∙g
−1, respectively (
Table 2). The increase in the specific surface area of carbon may be related to the presence of phenolic resin (which has a high specific surface area of 591 m
2∙g
−1) which covers and interconnects the cotton fibers. Indeed, the specific surface area of the composites was a mixture between that of the resin and the fiber. A compromise between the BET surface area of the materials and the amount of phenolic resin used for economic and environmental reasons, the study will be limited to the use of PhR/NC-1 (which contains 30% of phenolic resin) for the adsorption tests.
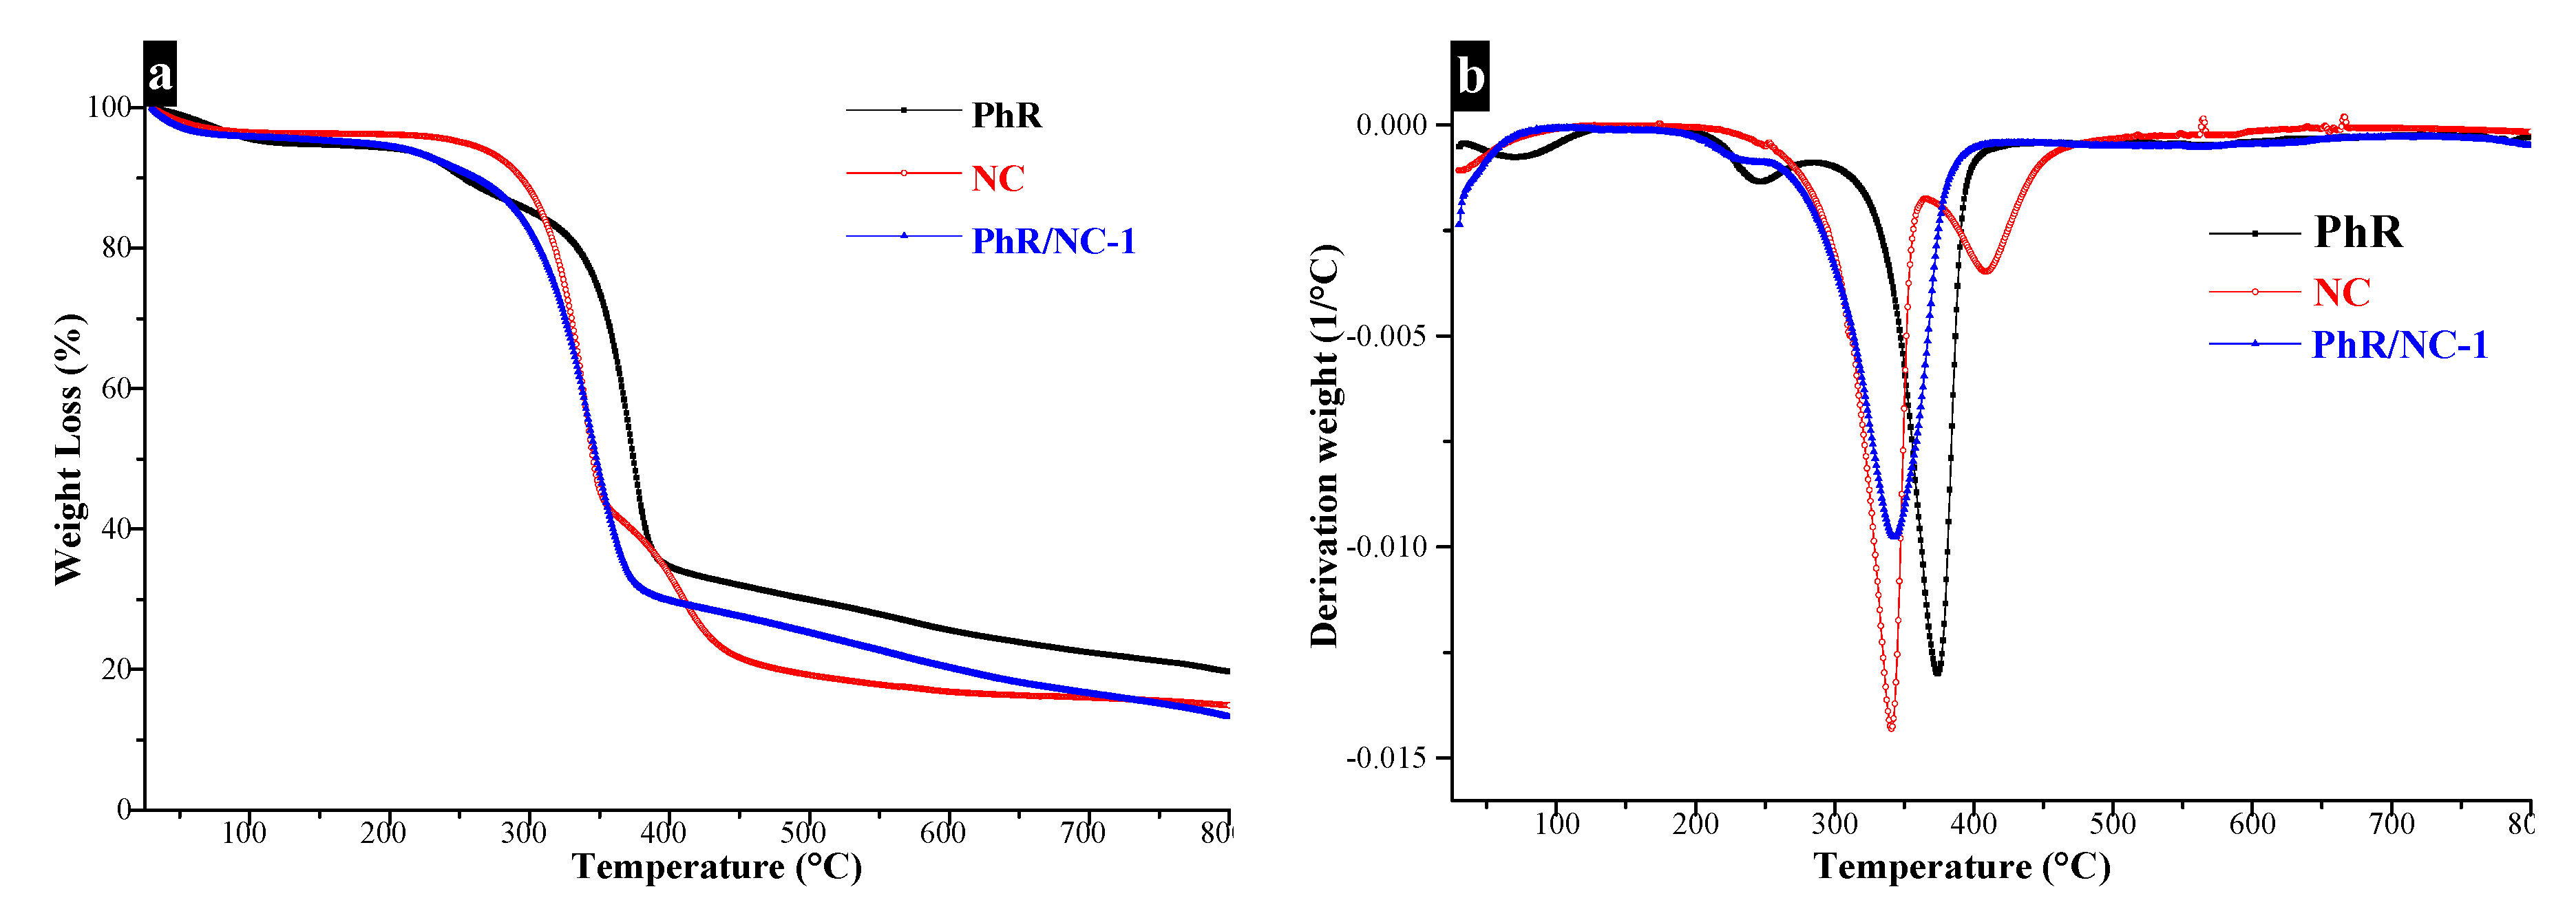
3.3. TGA Results
The TGA curves and their corresponding derivatives curves of PhR/NC-1non thermally treated composite compared with PhR and NC as reference materials are shown in
Figure 5. Below 100 °C a small weight loss for all materials corresponding to desorption of water, is noticed.
In the range of 100–450 °C, an intense weight loss of PhR/NC-1 is observed. This may be attributed to the pyrolysis of both cotton and phenolic resin and the remove of template which was previously demonstrated to occur around 400 °C [
23]. Indeed, cotton (NC) and phenolic resin (PhR) show also the highest weight loss in this range. On the other hand, the DTG curve of PhR/NC-1 shows only one peak, however the PhR polymer exhibits two well-defined peaks at 244 °C and 375 °C. This suggests an intimate mixture between the two pristine materials. Thus, the mixing of phenolic resin with cotton fibers can decrease the weight loss of composite on this range of temperature. A similar observation was shown by Cho et al. where the mix of phenolic resin with lignocellulosic fiber (bamboo fiber) can improve its carbon yield at high temperature [
46].
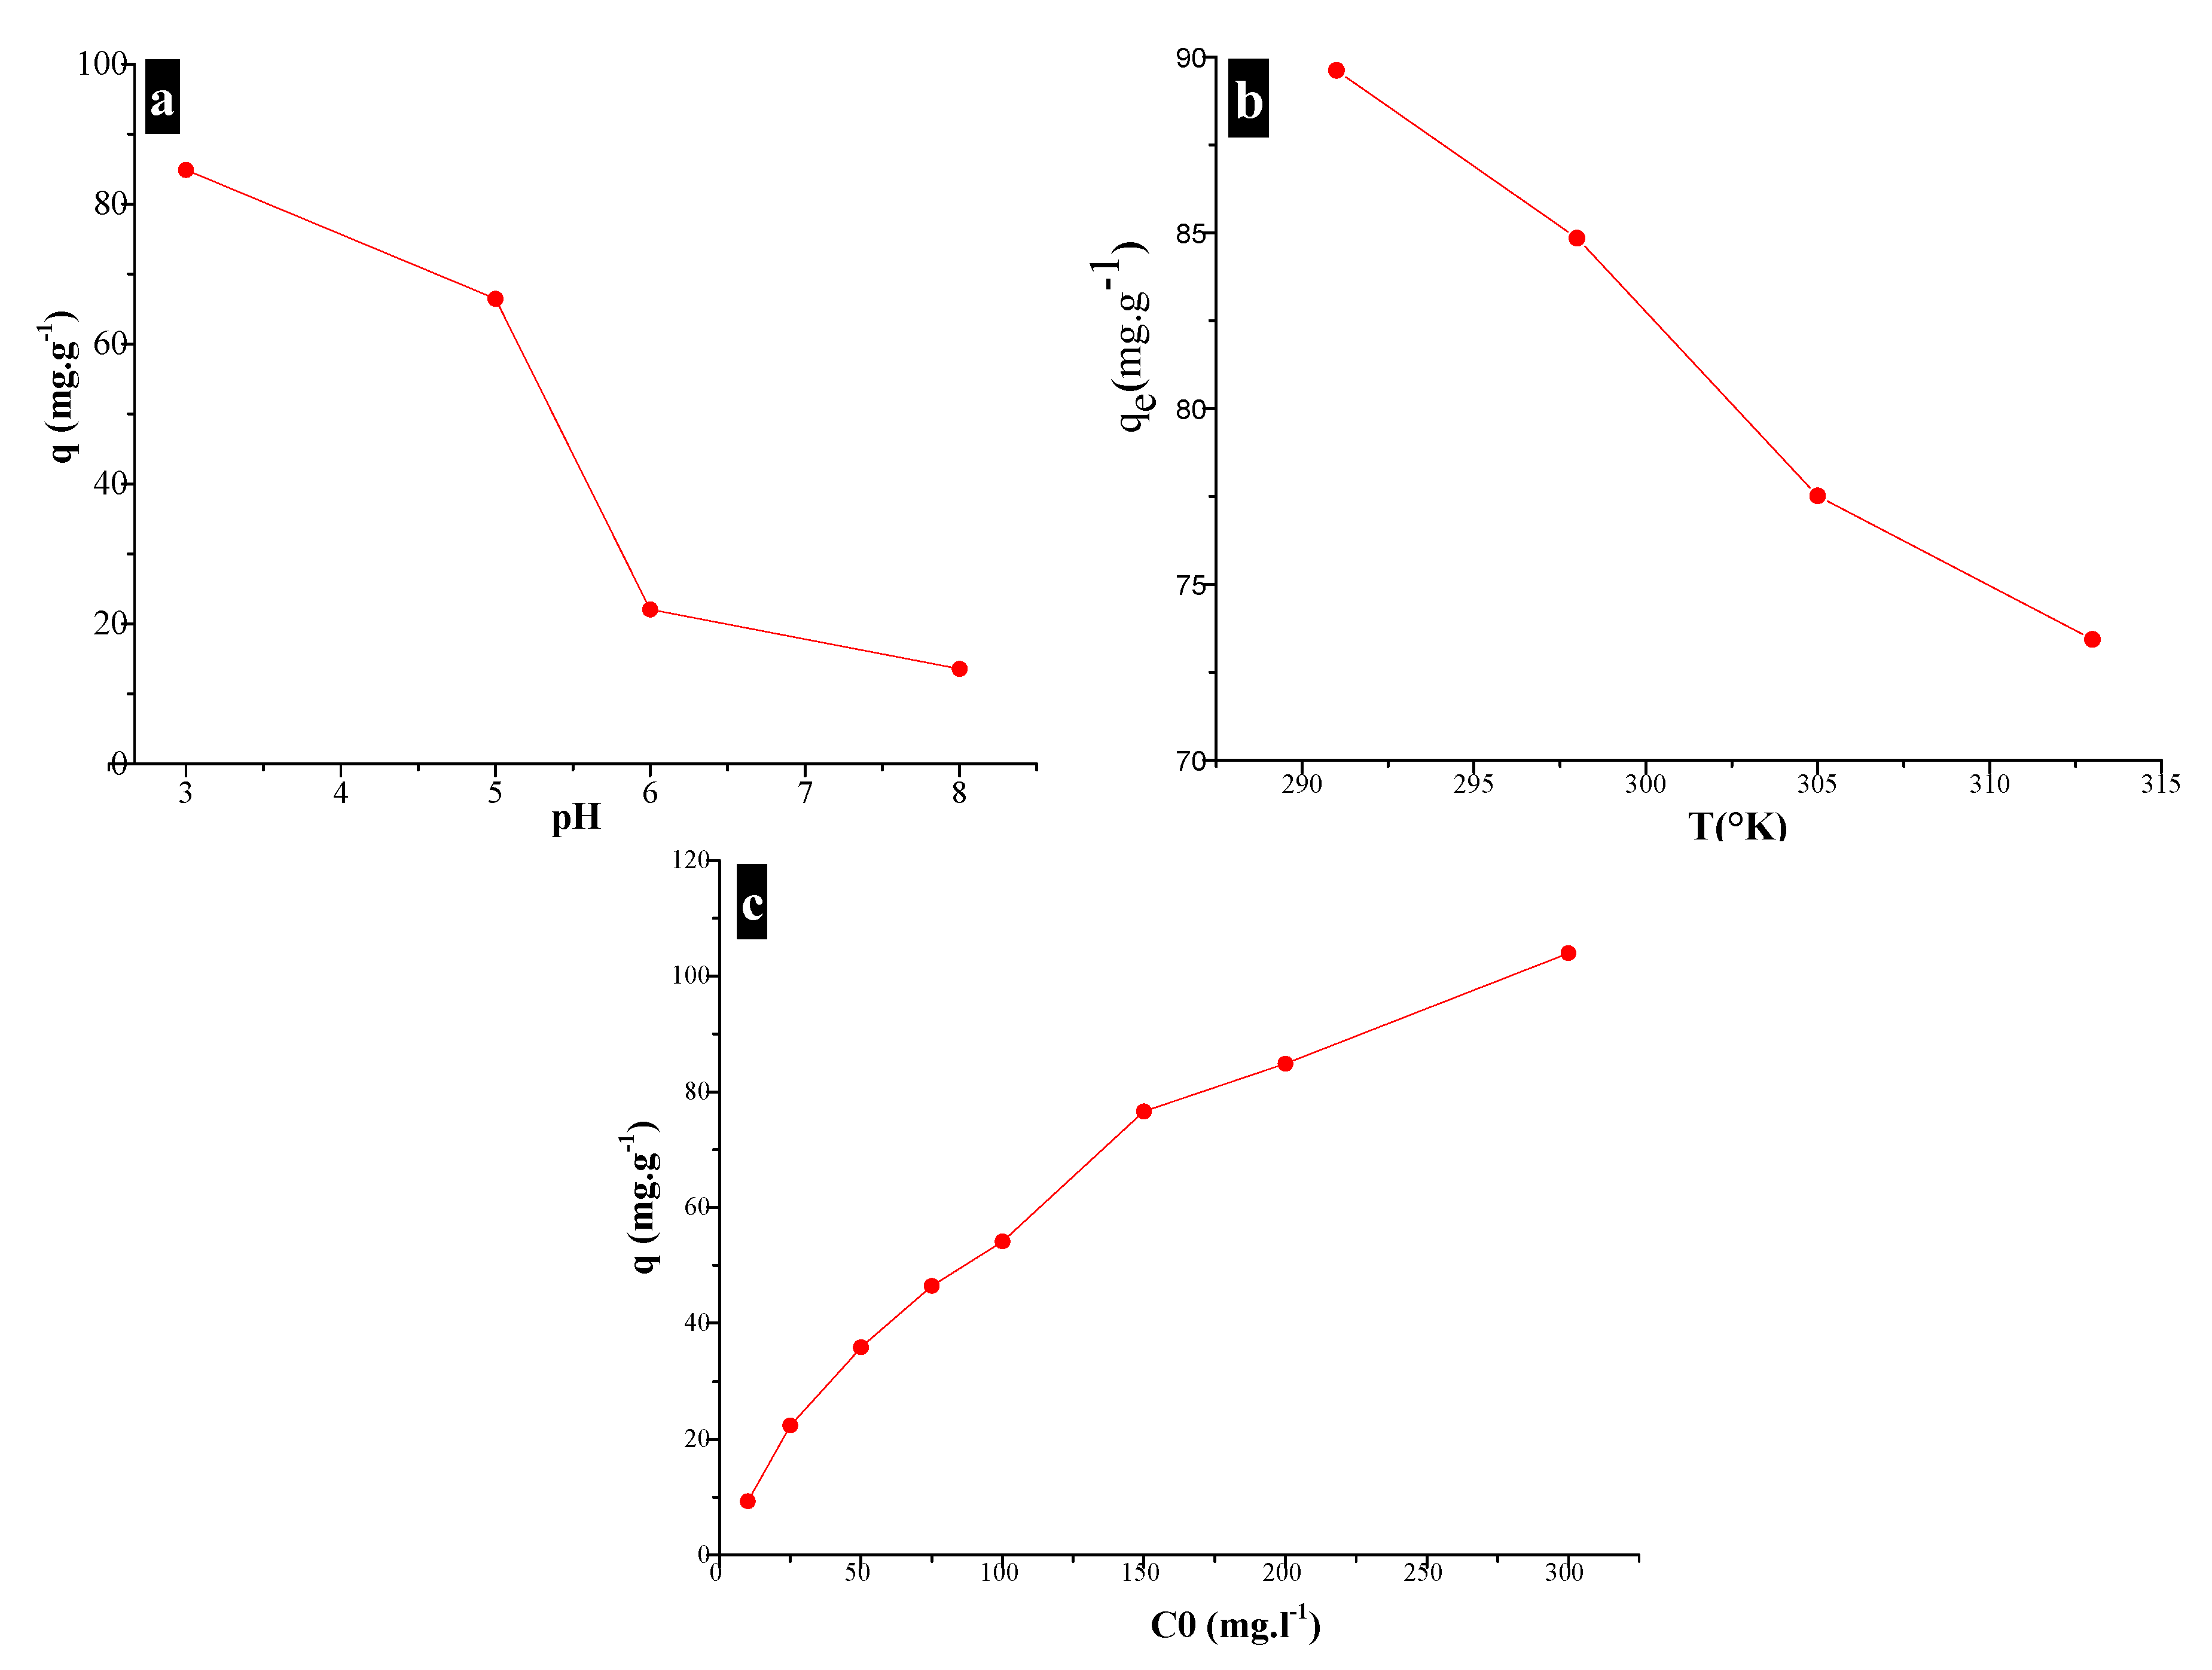
3.4. Influence of Adsorption Parameters on the Adsorption Capcity
Adsorption phenomena depend on several factors such as contact time, pH, temperature and initial concentration of dye.
Figure 6 shows the effect of those parameters on the adsorption capacity of ARS by PhR/NC-1 composite material. It can be seen that when both initial pH and the temperature of adsorption reaction increase, the adsorption capacity decrease (
Figure 6a,b). However, when the initial ARS concentration increases the adsorption capacity increases. It should be remarked that in all the cases, the adsorption capacity of PhR/NC-1 was higher than that of NC [
43] carbon as reference, which was 104 mg/g and 77 mg/g, respectively. This may be related to the improved textural properties (specific surface area and pore volume) of composite material compared to NC material.
The pH of ARS solution induces an important effect on adsorption capacity of composite carbon. Indeed, when the pH increases from 3 to 8, the PhR/NC-1 adsorption capacity decreases from 84.8 to 13.4 mg∙g−1. This result suggests that the adsorption capacity of composite carbon was closely depend on the electrostatic charge and the degree of ionization.
As regards the effect of temperature, a major difference between the adsorption capacities of PhR/NC-1 carbon is noticed. With an increase of temperature, the adsorption capacity of the composite carbon becomes less favorable.
With the increasing value of initial ARS concentration, there is a generation of more and more force that favors the mass transfer of ARS molecule into PhR/NC-1 carbon (
Figure 6c).
In summary, the interaction between ARS molecules and NC or PhR/NC-1 composite shows an important dependence on the electrostatic energy and the degree of ionization that was affected by the pH of the dye solution. The initial dye concentration and the temperature of reaction have a direct impact on the adsorption capacity of the composite carbons. The results were in agreement with previously reported data on ARS adsorption by Fayazi et al. [
36]. Thaking into account the obtained results, ARS adsorption at 25 °C, pH 3 and with initial concentration of 200 mg∙L
−1 was selected as optimum adsorption conditions for further investigation.
3.4.1. Kinetic Model
Kinetics models have been widely investigated to describe the adsorption of textile dyes by activated carbons. The Lagergren pseudo-first-order [
47], pseudo-second-order [
48] and intra-particle models [
49] were used in this study to evaluate the adsorption of ARS on PhR/NC-1 as composite carbon. The respective equations are reported in
Table 3, where q
e and q
t were the adsorption capacity of PhR/NC-1 at equilibrium and during a contact time t. K
1 and K
2 are the pseudo-first-order and pseudo-second-order kinetics constants, respectively. K
id was the intra-particle diffusion constant. All these constants are summarized in
Table 3. The correlation coefficient (R
2) was calculated in order to evaluate the correlation between predicted and experimental data.
The obtained correlation coefficients of the pseudo-first-order, pseudo-second-order and intra-particle-diffusion are 0.95, 0.99 and 0.96, respectively (
Table 3). This results suggest that both pseudo-first-order and intra-particle-diffusion models have a poor fit to the experimental data. However, the corresponding linear correlation coefficient R
2 of pseudo-second-order model is close to the unit (R
2 = 0.99~1), which suggest that this kinetic model is the best fit of the experimental data. This result indicates that there is an electrostatic attraction between ARS as an acidic dye and PhR/NC-1 carbon through chemisorption phenomena. In our previous study [
43], similar results were shown by using activated carbon as an adsorbent for ARS. As reported previously [
50] a pseudo-second-order model was the main kinetic model that fitted the adsorption of ARS dye by activated carbon.
3.4.2. Adsorption Isotherms of Synthesized Carbon
Experiments were performed at 25 °C, pH 3 and with initial dye concentrations of ARS between 5 and 300 mg∙L
−1. According to the linear regression factor R
2 (
Table 4), both Langmuir and Freundlich models show good agreement with the experimental results. However, the Langmuir model was the most suitable to fit experimental data (R
2 = 0.987). Such a model exhibited a maximum adsorption capacity of q
m = 132.63 mg∙g
−1. The best fit of the Langmuir model as the isotherm model in the present process shows that ARS molecule was attached to binding sites of PhR/NC-1 by homogeneous levels of energy which means a monolayer adsorption phenomenon. In our previous study about the adsorption of ARS by AC derived from cotton waste [
43], the Langmuir isotherm also showed the best agreement with the experimental data. As compared with the previous study, the Langmuir model was the most suitable mathematical isotherm model that describes both the adsorption of ARS by activated carbon [
43] and the adsorption of organic dye by mesoporous ordered carbon [
51]. The value of K
L as Langmuir constant is equal to 0.012 L∙mg
−1, which suggest that the adsorption of ARS by PhR/NC-1 was favorable and probably irreversible in nature. The ‘n’ value of the Freundlich model is 1.64, therefore laying between 1 and 2, meaning that the adsorption of ARS by PhR/NC-1 composite carbon was favorable.
3.5. Calorimetric Results
The release of heat of ARS adsorption is reported in
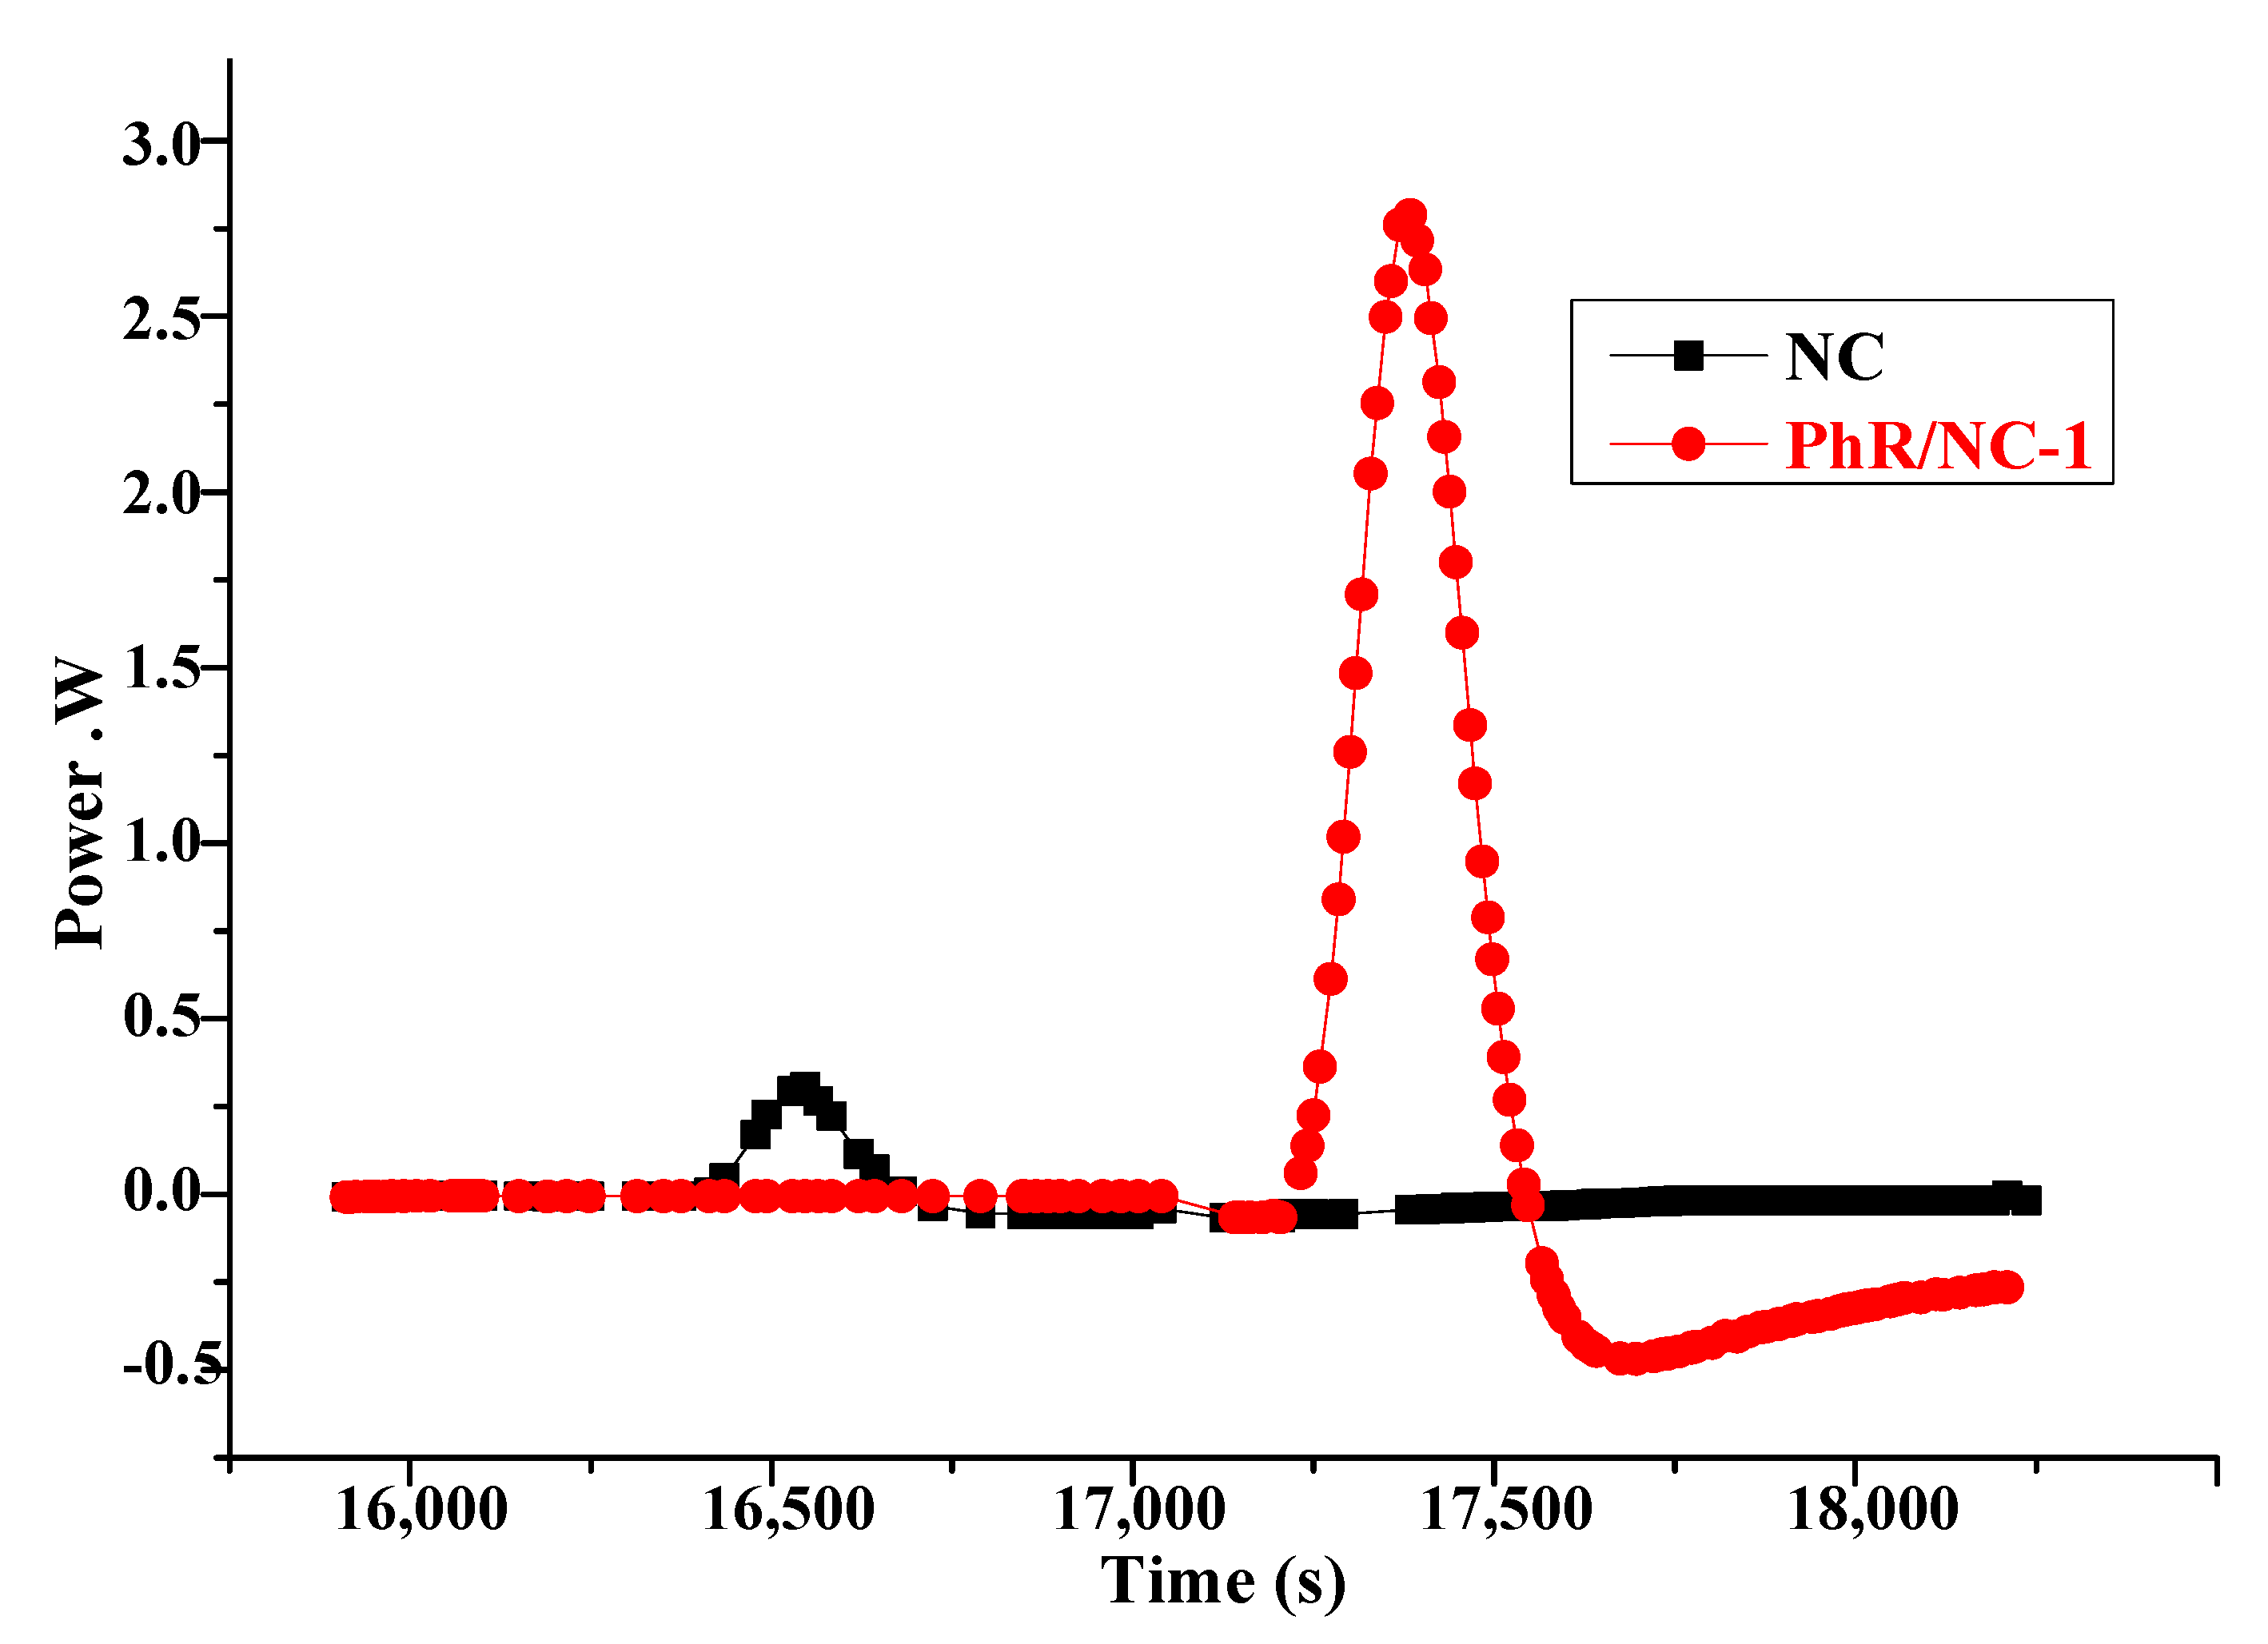
Figure 7 for NC and PhR/NC-1. It can be seen that the calorimetric signal of composite carbon (PhR/NC-1) presented an intense exothermic peak relatively finely resolved over time (between 17,640 and 18,000 s) followed by a much longer endothermic peak (18,000 to 18,900 s) with lower amplitude. The exothermic peak is attributed to the adsorption stage while the endothermic peak is attributed to the desorption of ARS from the surface of the carbonaceous material. The existence of an exothermic peak and an endothermic one, with different intensity, reflects that the adsorption of ARS is partially reversible for both carbons.
For equivalent times of the phenomena (FWHM = 149 and 182 s for composite and NC respectively), we can observe that the energy is higher with the composite carbon PhR/NC-1. This seems to indicate a higher interaction with the composite carbon than NC and higher kinetics with the first carbon fibers.
Several successive injections of ARS were realized and the cumulative behavior was followed. The FMC energy appears to depend also on the injected quantity of ARS for both carbons. This was obviously visible in
Figure 8 which illustrates the evolution of the cumulative total energy as a function of cumulative amount of injected ARS. It can be seen that the cumulative energy increases with the increasing quantity of injected ARS. Moreover, this result confirms that the composite carbon exhibits more energy than NC. The difference between the total energy could be due to the presence of phenolic resin in the composite carbon which increases the number of contact points on the carbon composite surface, increases its polarity and promotes ARS-carbon interactions. The respective phases of the adsorption process can be described using the Hill model [
52] as follows:
where, θ is the degree of cooperatively, n is the Hill coefficient, L is the ligand concentration and K
d is the microscopic association coefficient.
At the adsorption equilibrium, the covering surface of adsorbent can be considered as directly proportional to the cumulative energy using an analogy between the concentration (L) and cumulative injected volume of ARS. Under this hypothesis, the Hill equation was modified as follows:
where, V
cum is the cumulative injected volume, E
cum is the cumulative energy and
is the maximum value of the cumulative energy.
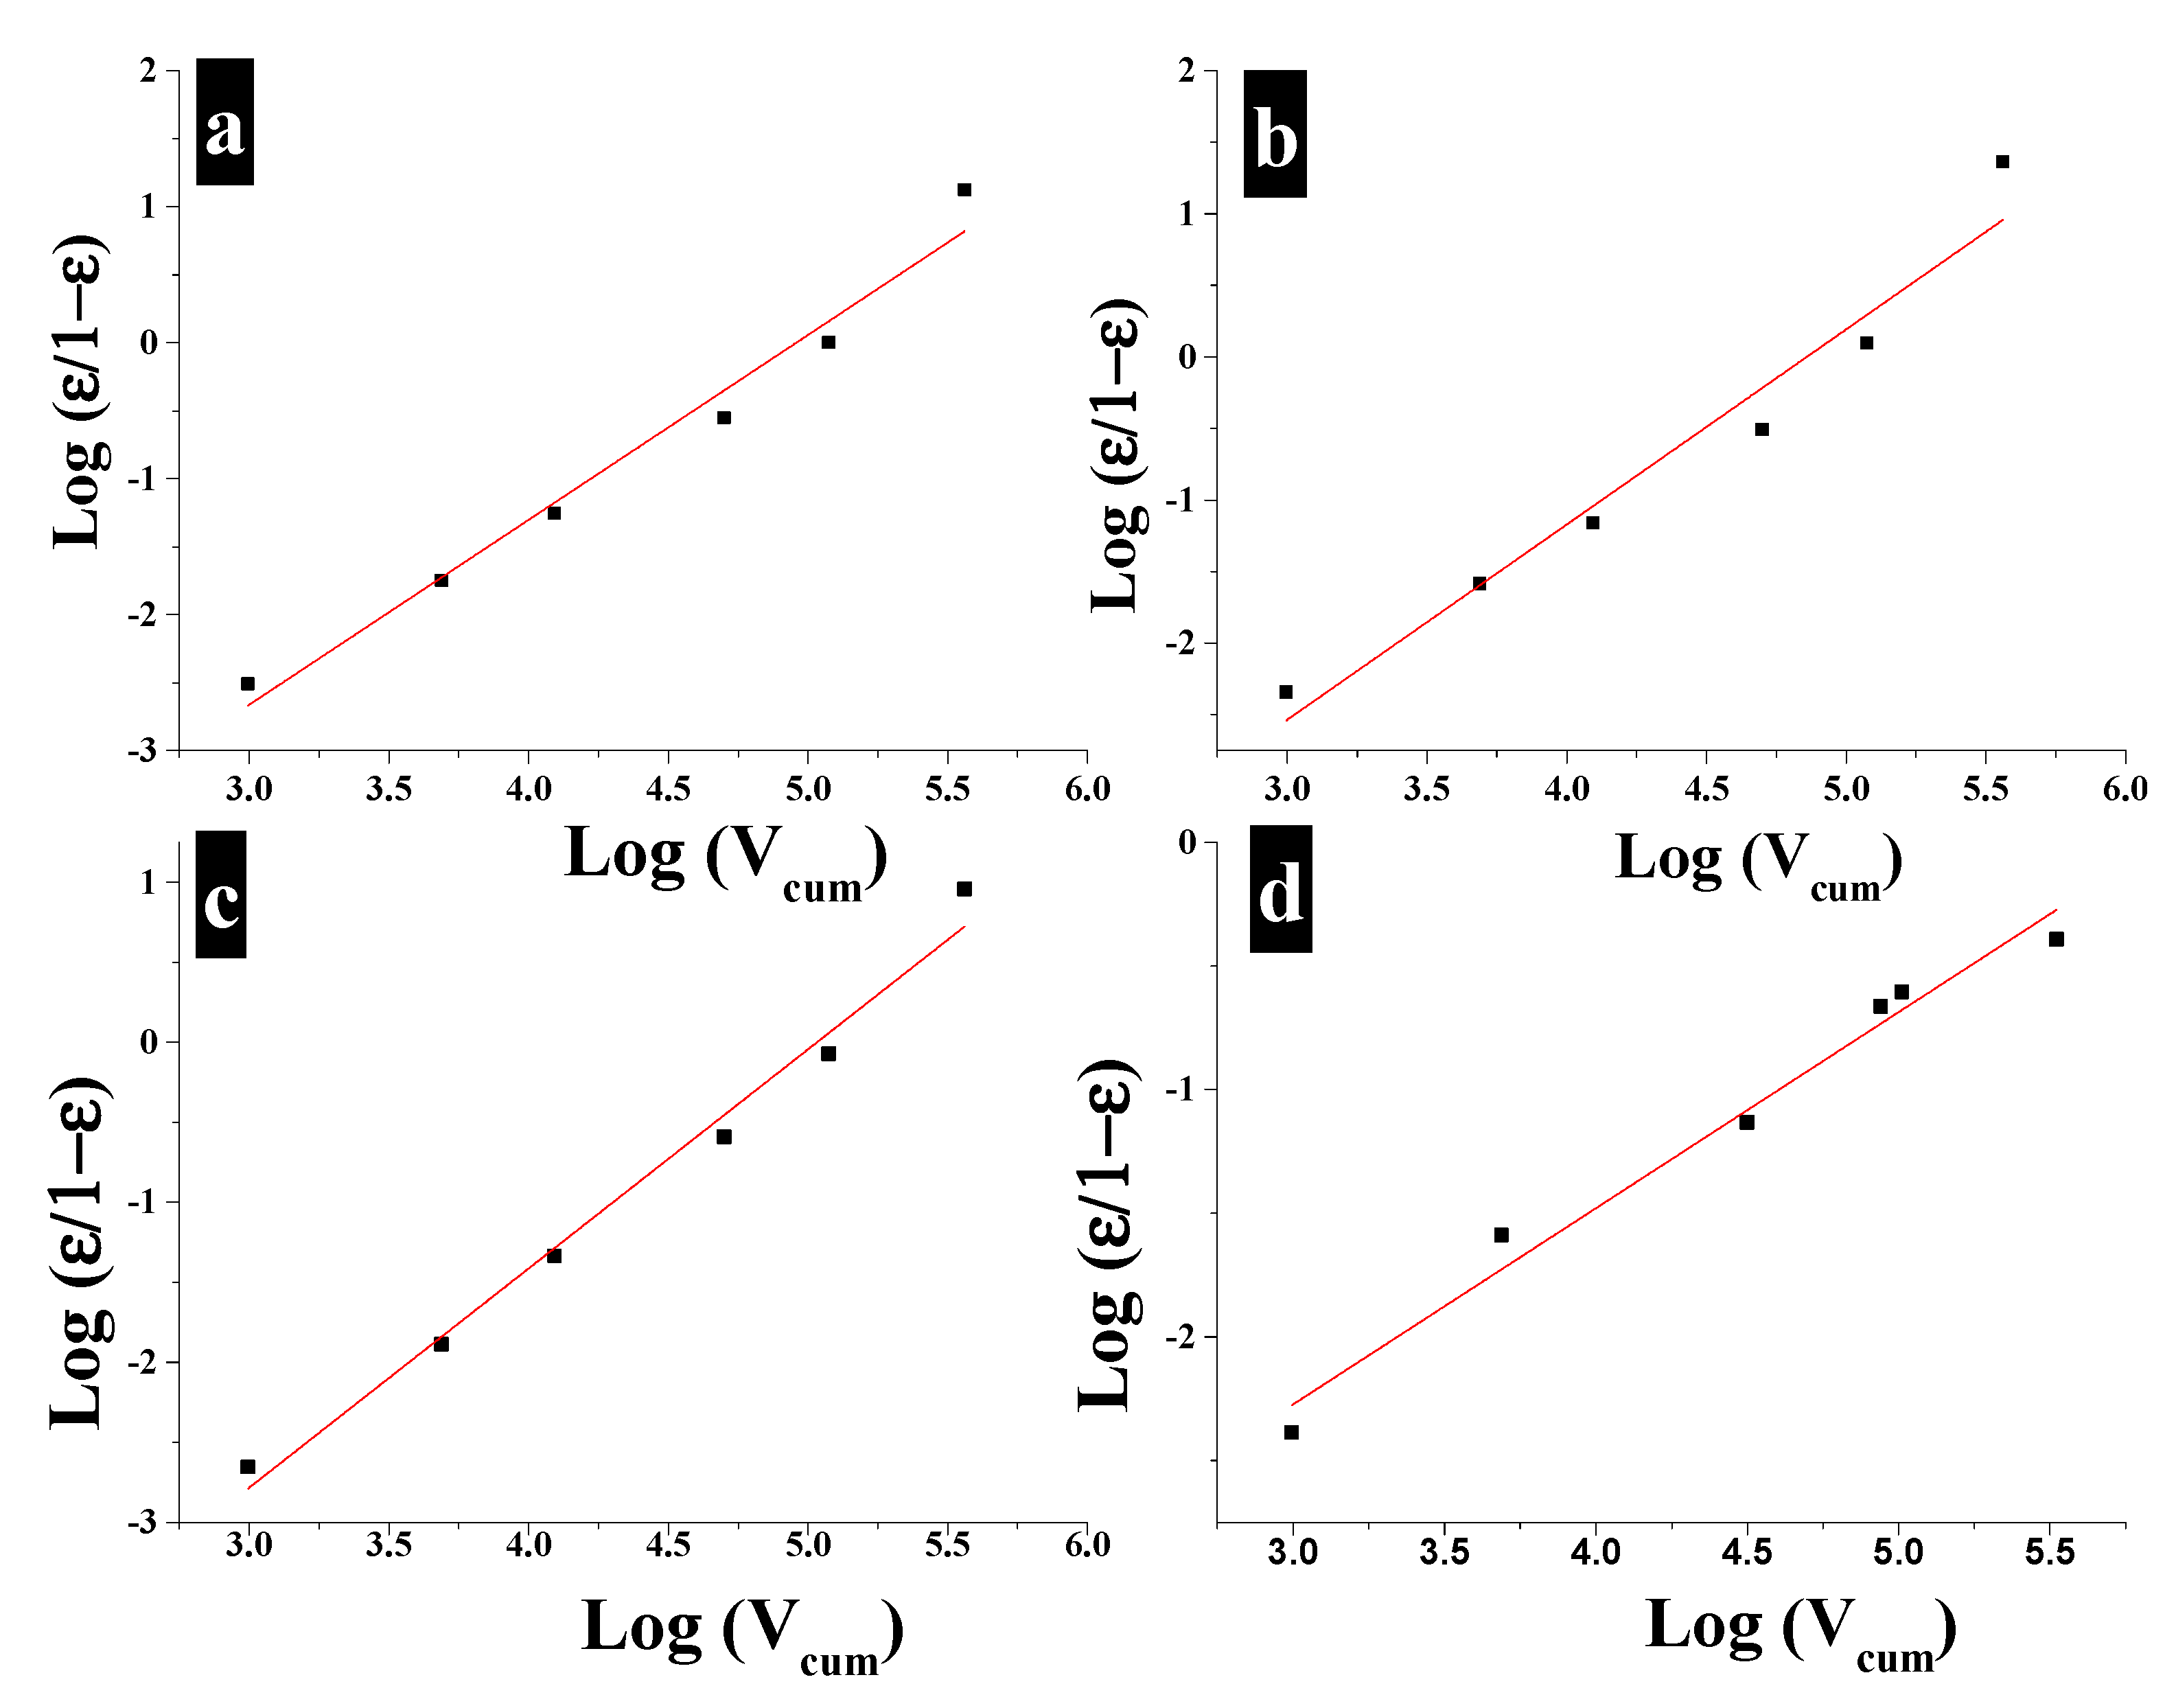
It can be seen that the Hill plots have a linear form (
Figure 9). Given the fact the Hill coefficient (slope of the Hill plot) of the adsorption phase was greater than 1 (
Table 5), the binding of one molecule of ARS promotes the binding of additional ones. This result suggests a perfectly free and independent adsorption of ARS on the surface of the composite carbon.
The desorption Hill coefficient was practically the same as the adsorption coefficient, meaning that the desorption phase involves increased affinity with ARS molecules. However, the desorption microscopic association coefficient (Kd = 130) was less than that of adsorption (Kd = 142), likely reflecting domination of ARS adsorption phase.
Total phase behavior with Hill coefficient was greater than 1 (
n = 1.37,
Table 5), but for the reaction between ARS and NC, the Hill coefficient was less than 1 (
n = 0.79 < 1;
Table 5). That is the reason why the cooperative adsorption was considered negative. The binding of one molecule of ARS inhibits supplementary binding of another one, suggesting that the reaction between ARS and NC was probably very limited and reversible (the system limits the adsorption and makes a large part of adsorbed ARS (or almost all the adsorbed molecules) to desorb.
From a quantitative perspective, ARS molecules show good affinity for composite carbon and at the same time higher than that for NC carbon. This result may be due to the contribution given by the presence of phenolic resin having higher porosity with interconnected pores in composite carbon.
The quantitative results were completed by an energy analysis, in order to investigate the energy potential between ARS molecules and carbon material.


 ,
, 


