1. Introduction
The world’s first medium scale Floating Offshore Wind Turbine (FOWT) BlueH was a modest affair compared to the current HyWind project, the floating pilot wind farm located in Scotland (
https://4coffshore.com/windfarms/hywind-scotland-pilot-park-united-kingdom-uk76.html). The last decade evolution suggests that the idea of generating electricity in deep water areas is becoming more feasible than expected initially. Several wind sector companies, institutions and countries are interested in researching and supporting this green technology. The fact is that the investment required for the building, installation and decommissioning of FOWTs increase the Levelised Cost Of Energy (LCOE) more than other current wind energy production solutions such as bottom fixed offshore wind turbines [
1]. However, few countries in the world have shallow water areas as required for bottom fixed wind turbines, so most countries are forced to resort to floating solutions. There is a number of different FOWT designs at present, but there is significant research going on and once the industry has settled on one or two basic designs, mass production can reduce costs.
Several platform designs have been presented in recent years, from more expensive and hydrodynamically stiffer to less expensive and stiff ones, i.e. spar-buoy [
2], tension-leg-platform [
3], semi-submersibles [
4] and barge-type platform [
5]. Although all FOWT models need a control unit for the normal operation performance, low hydrodynamically stable platforms require additional advanced control algorithms to counteract the structural load produced by the incident waves, and, hence, extend the working live period. This is the case of the Aerodynamic Platform Stabiliser (APS) control technique presented in [
6], which is designed to work in the ITI Energy barge-type platform concept with the NREL’s 5 MW wind turbine. Good generator speed regulation, electric power production, generator torque demand and platform-pitch motion reduction were shown, resulting in large tower-base and blade-root bending moment reductions. This achieves feeding-back the measurement of the nacelle-pitch motion providing a vigorous blade-pitch regulation to avoid wind gust perturbation.
The main aim of this paper is to validate the flexibility of this APS control technique implementing on a different FOWT model, e.g. in a higher power rated wind turbine and more hydrodynamically stable platform. Concretely, the 10 MW wind turbine model [
7], developed by Denmark Technical University (DTU) mounted on the TripleSpar floating platform concept has been chosen, which was designed in the INNWIND.EU project [
8]. A scaled model test was carried out with active blade-pitch control in a wave basin laboratory [
9,
10,
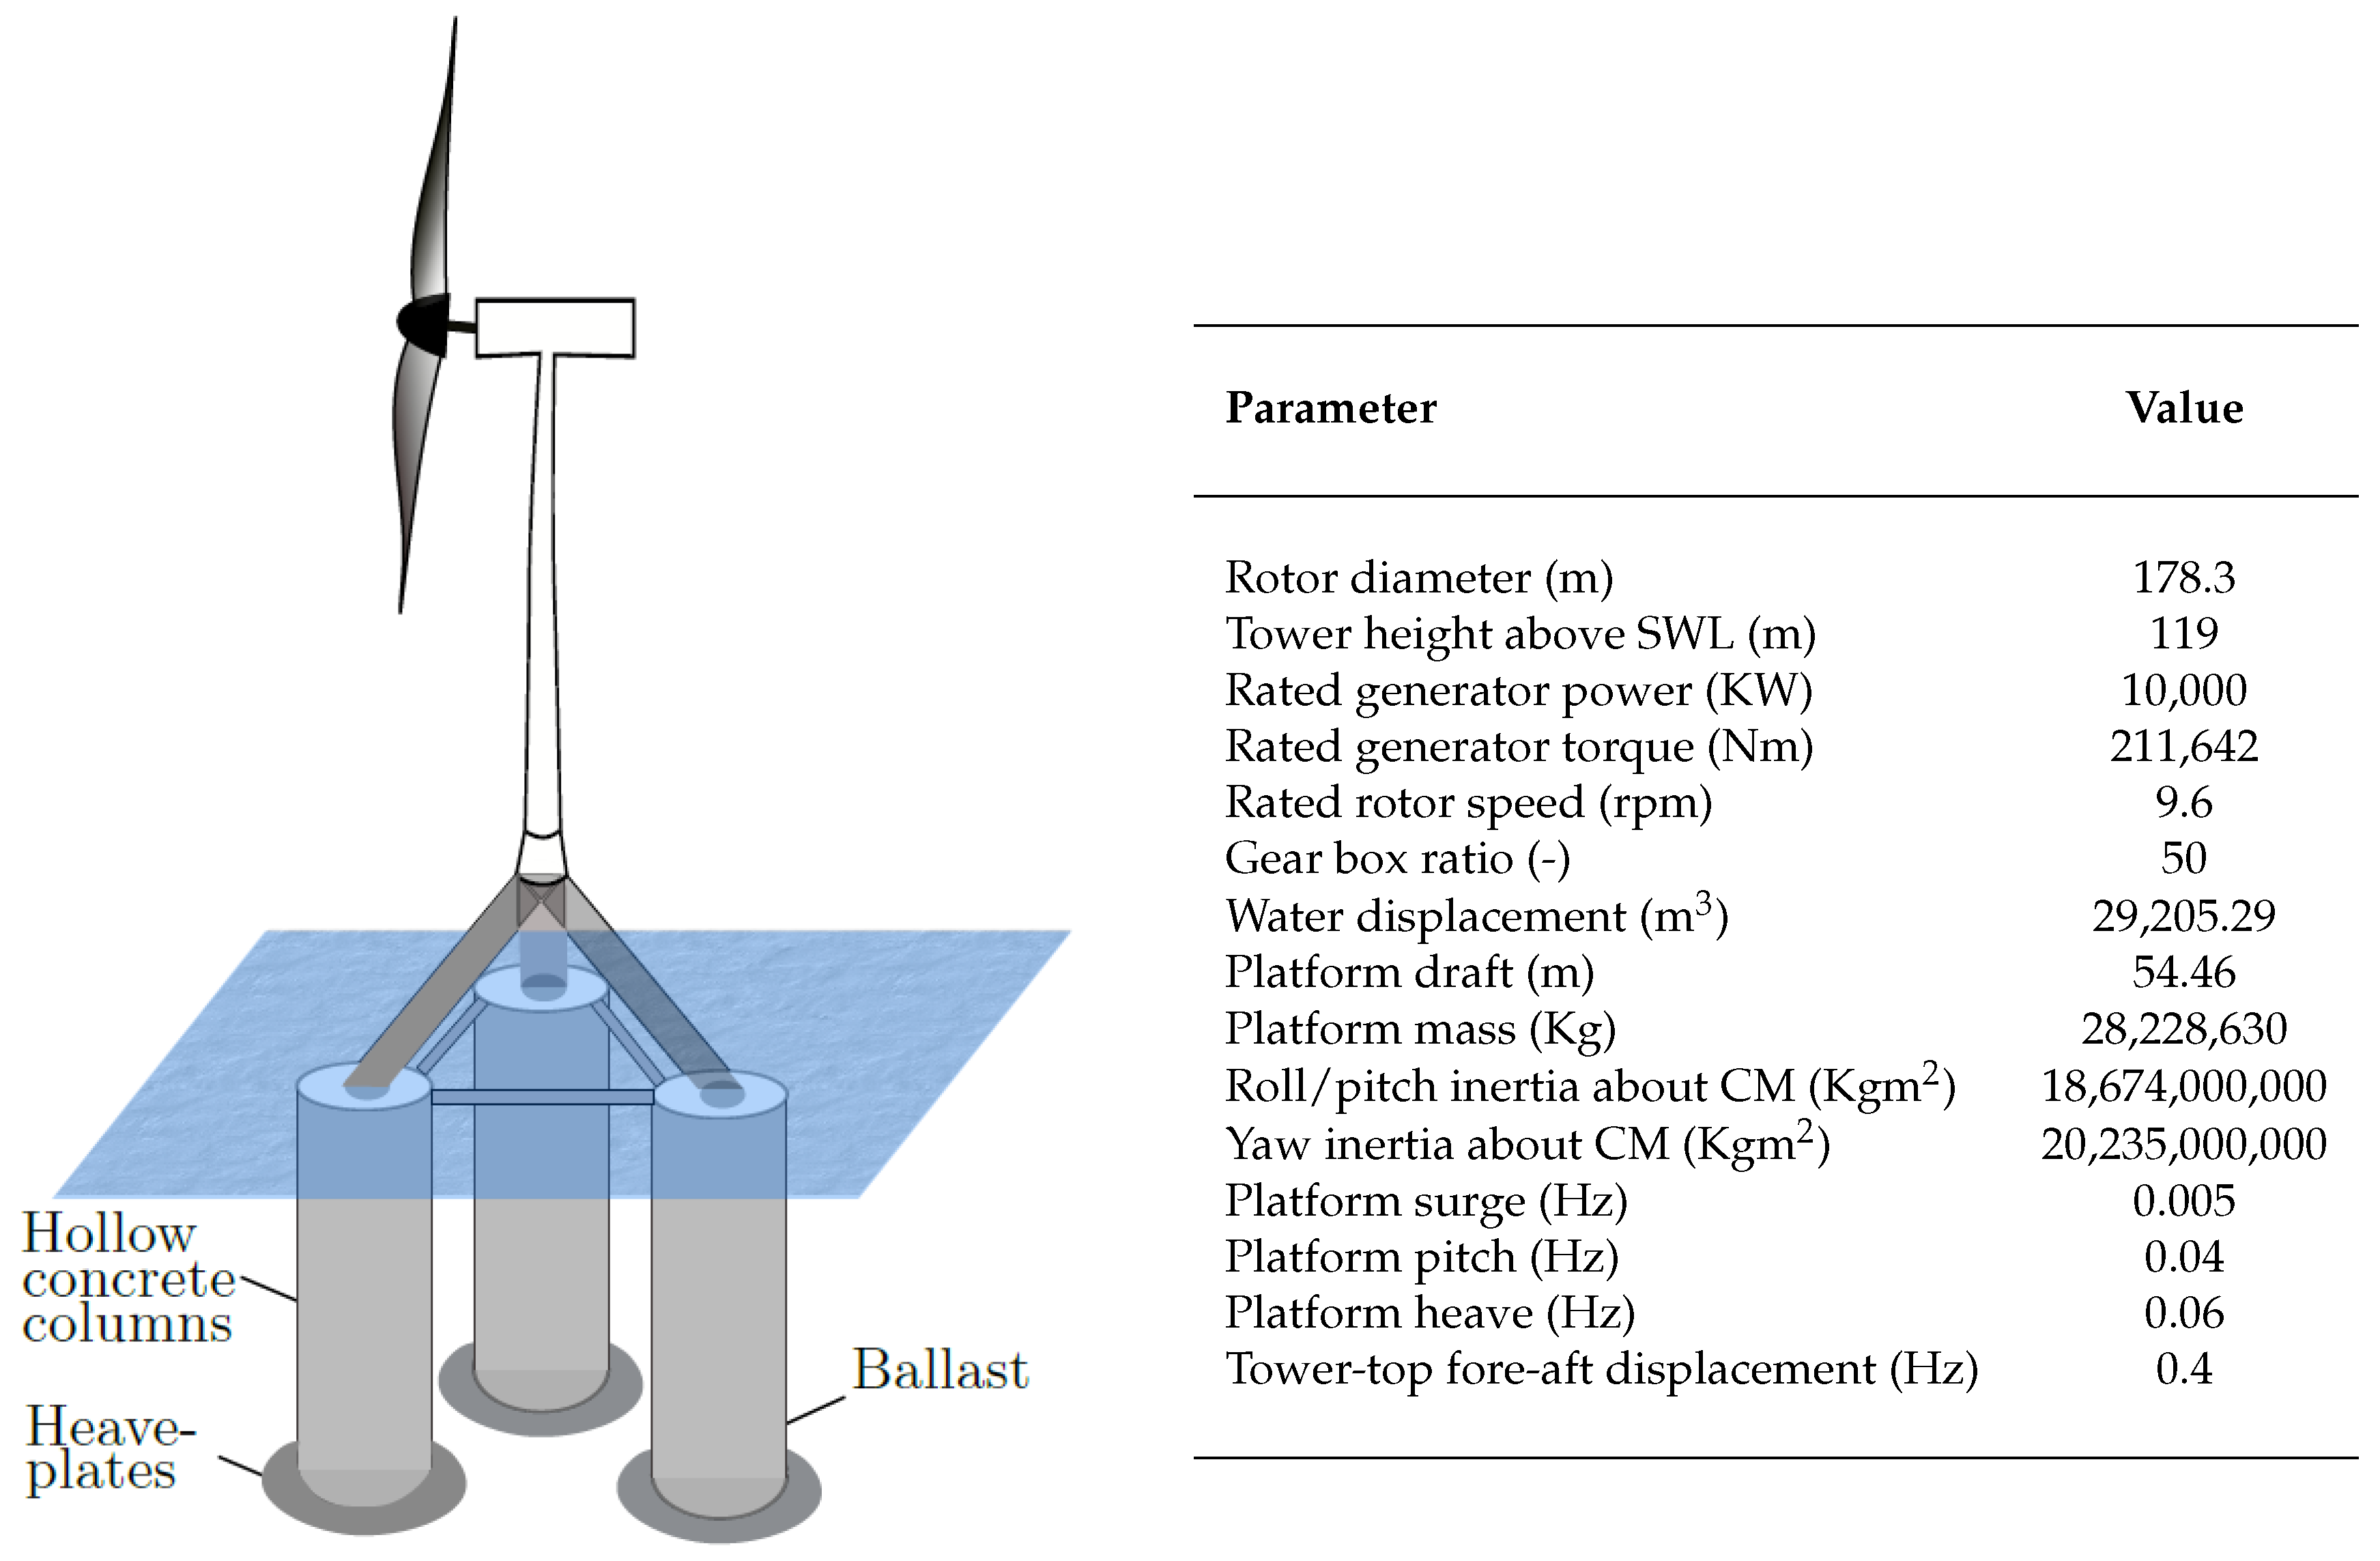
11]. The DTU 10 MW TripleSpar conceptual model and its properties are shown in
Figure 1. As can be seen in this figure, this FOWT mixes the semi-submersible and spar-buoy floating technologies. Thus, it takes the ballast stabilised principle from the spar-buoy platforms, but it is distributed into three columns to reduce the draft of the overall platform as semi-submersible platforms do. The presented platform-roll, -pitch and -yaw inertias, as well as the overall FOWT mass is higher than the NREL 5 MW mounted on the ITI Energy barge, by 25, 13 and 5 times, respectively. All this provides good challenges for testing the APS control loop algorithm on a hydrodynamically more stable FOWT system.
Furthermore, a different way for the APS control design process is presented in this article. The APS control algorithm has been tuned through a Simplified Low-Order Wind turbine (SLOW) linear model. The SLOW model of the DTU 10 MW TripleSpar is presented in [
12] by the Stuttgart Wind Energy (SWE) in the framework of the European project INNWIND. This FOWT model only includes five Degrees Of Freedom (DOF), platform-surge, -pitch and -heave; drivetrain; and tower-top fore-aft displacement, resulting in a simpler model than those obtained by using FAST. These are the required modes for the mode shaping of the APS control loop. Nevertheless, SLOW and FAST linear models have been compared for accuracy checking purpose before the control design process.
This paper is organised as follows.
Section 2 provides a comparison between SLOW and FAST as well as the validation of the linear models.
Section 3 describes the control implemented for the DTU 10 MW TripleSpar in above rated wind speeds, including the APS control loop design process. The results obtained from the application of such a control strategy are then discussed in
Section 4 and
Section 5, where time-domain simulations and load analysis are presented, respectively.
2. Linear Models
The linear models are useful for developing state matrices of a wind turbine plant to aid in the control design and analysis process. The linear models used to describe the wind turbine are periodic and are only perturbed around the linearisation point in above rated wind speeds. FAST has the capability to linearise FOWT systems around steady-state solutions. Sometimes, in the above rated wind speed regions and depending on the platform hydrodynamic stiffness, the achievement of the linear model in the desired operation point can be difficult due to the coupling between blade- and platform-pitching, as analysed in [
13]. Therefore, and to try the control design process with a simplified linear model, SLOW linear models developed at the SWE have been used. These linear models are focused on representing the system dynamics of the FOWT with only the necessary DOFs achieving a good trade-off between model accuracy and efficiency.
The SLOW model consists of a structural FOWT model and the sub-models for aerodynamic, hydrodynamic and mooring line forces. The structural model is based on a flexible multibody formulation with rigid and flexible bodies, in which the platform is considered as rigid body with three DOFs (surge, heave and pitch) and the tower as a elastic body with a single fore-aft DOF. For the external forces, the aerodynamics is represented through a rigid actuator disc with a quasi-static force model based on the aerodynamic torque and thrust coefficients for each tip speed ratio and blade-pitch angle. The three catenary mooring lines are represented by a quasi-static model, which results in a 6 × 6 stiffness matrix in the linearised formulation, for each operating point. The frequency-dependent wave excitation force vectors are calculated by a hydrodynamic panel code. The resulting frequency-domain representation of the six forces on the fixed floating body can be included through a parametric linear transfer function [
14]. Hydrodynamic radiation damping is neglected due to the small influence on FOWTs. On the contrary, Morison’s equation is used to capture the hydrodynamic viscous damping. It is linearised based on Borgman’s formula. The equations of motion are derived with the Newton-Euler approach, the same as in the commercial software Simpack. It has the advantage that the MBS layout (i.e., bodies and DOFs) are not hardcoded but user-defined. The equations of motion are available as symbolic equations accelerating the model execution. The time-integration is about 120 times faster than real time. A validation of the model against the wind wave tank test can be found in [
15].
The FAST model, in contrast, includes six DOFs of the rigid platform (surge, sway, heave, pitch, roll and yaw), the elastic tower fore-aft and side-to-side DOFs first and second modes, generator speed DOF, drivetrain torsional DOF, blade flapwise DOFs first and second modes, and a single blade edgewise DOF. FAST v7 only has been used for the linearisation process since FAST v8 does not have yet the capability to linearise FOWT systems. The linearisation process with FAST v7 of the full DOF enabled FOWT system was carried out trimming the generator torque, with a fixed blade-pitch angle to avoid convergence issues, as explained in [
13].
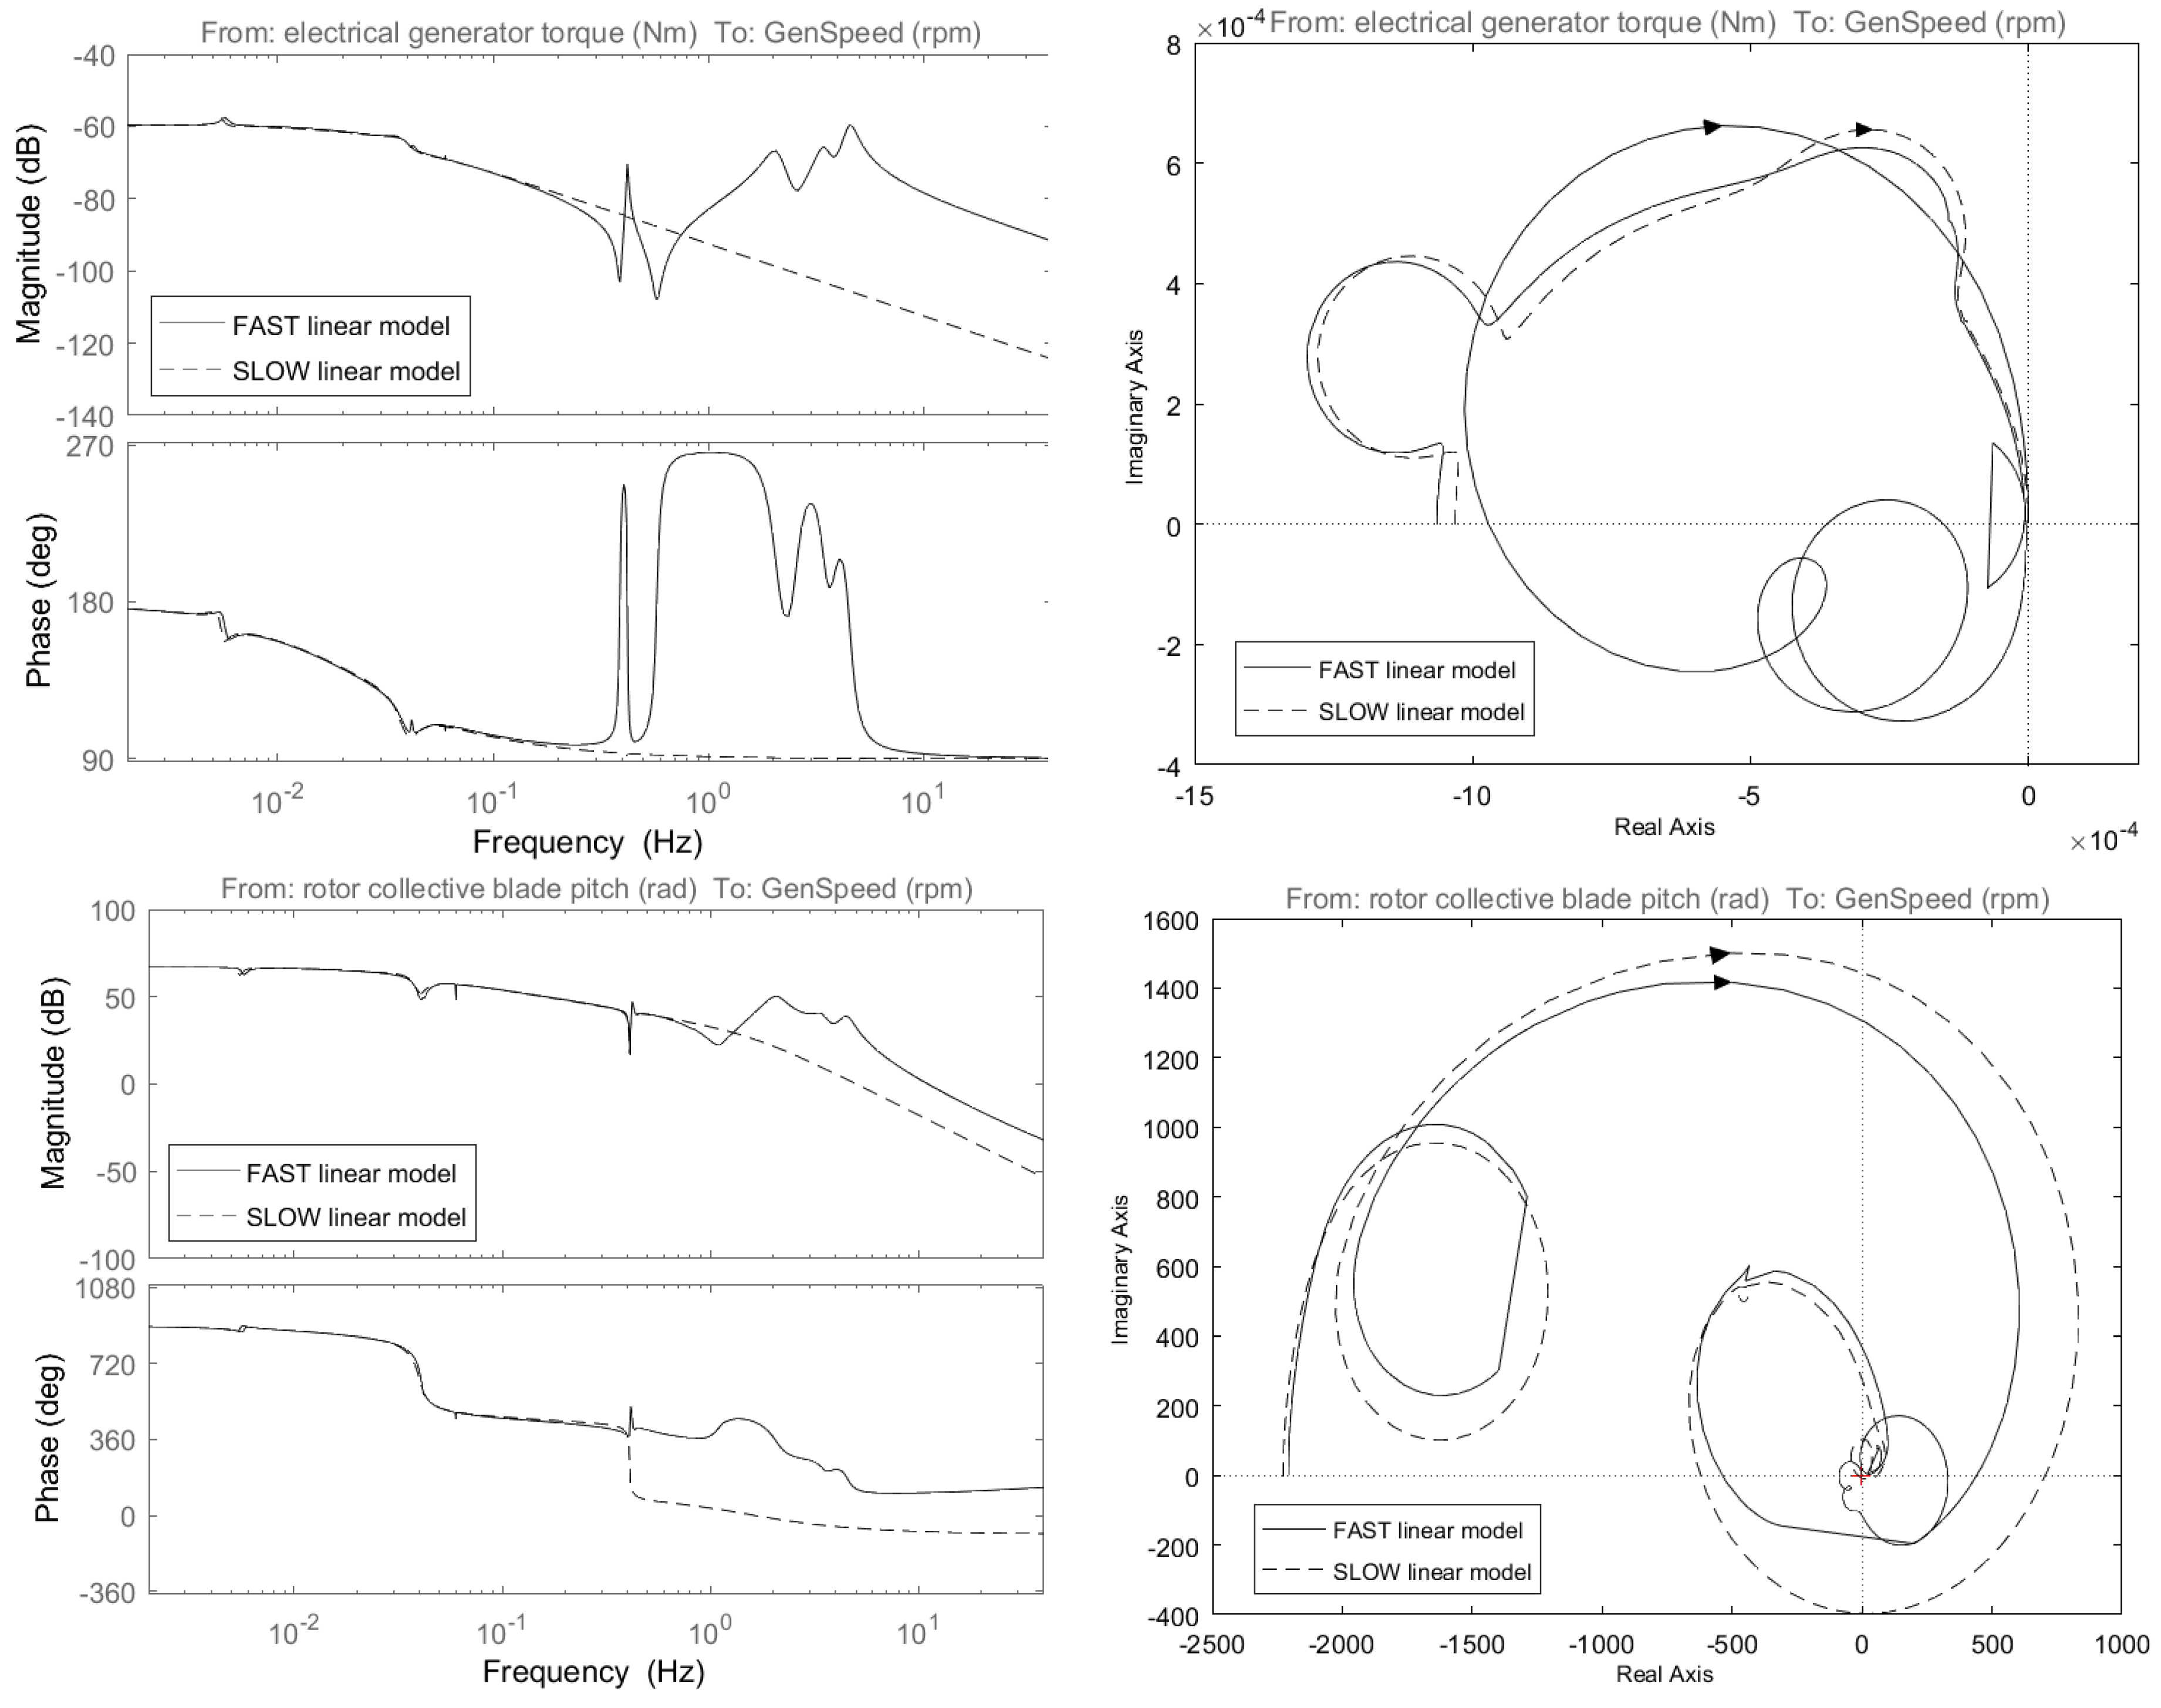
The comparison between the SLOW and FAST linear models is shown in
Figure 2. As can be seen in the figure, very good agreements have been achieved between the two linear models. The difference in the number of included DOFs in each linear model is the most visible evidence. In the bode diagram from electrical generator torque to generator speed, frequencies below tower side-to-side bending mode (0.421 Hz) fits very well. These are the platform-surge (0.005 Hz), -pitch (0.04 Hz) and -heave (0.06 Hz) modes. Above these frequencies, the SLOW linear model has not included the rest of modes as blade-flapwise and -edgewise ones. In the bottom bode diagram, from rotor collective blade-pitch to generator speed, frequencies below first blade flapwise bending mode (1.1 Hz) shows good frequency agreement. The same linear models agreement can be checked in the corresponding Nyquist diagrams. The small misalignment around the platform-surge mode can be due to the difference of the mooring modelling, wave radiation influence and/or viscous drag implementation between SLOW and FAST. However, such a small deviation does not affect the APS control loop tuning process.
3. Advanced Control Design
The advanced APS control technique was designed to mitigate the platform-pitch motion of the barge-type FOWT in the above rated wind speed [
6]. In this article, the APS control loop has been redesigned to achieve the same functionality than in [
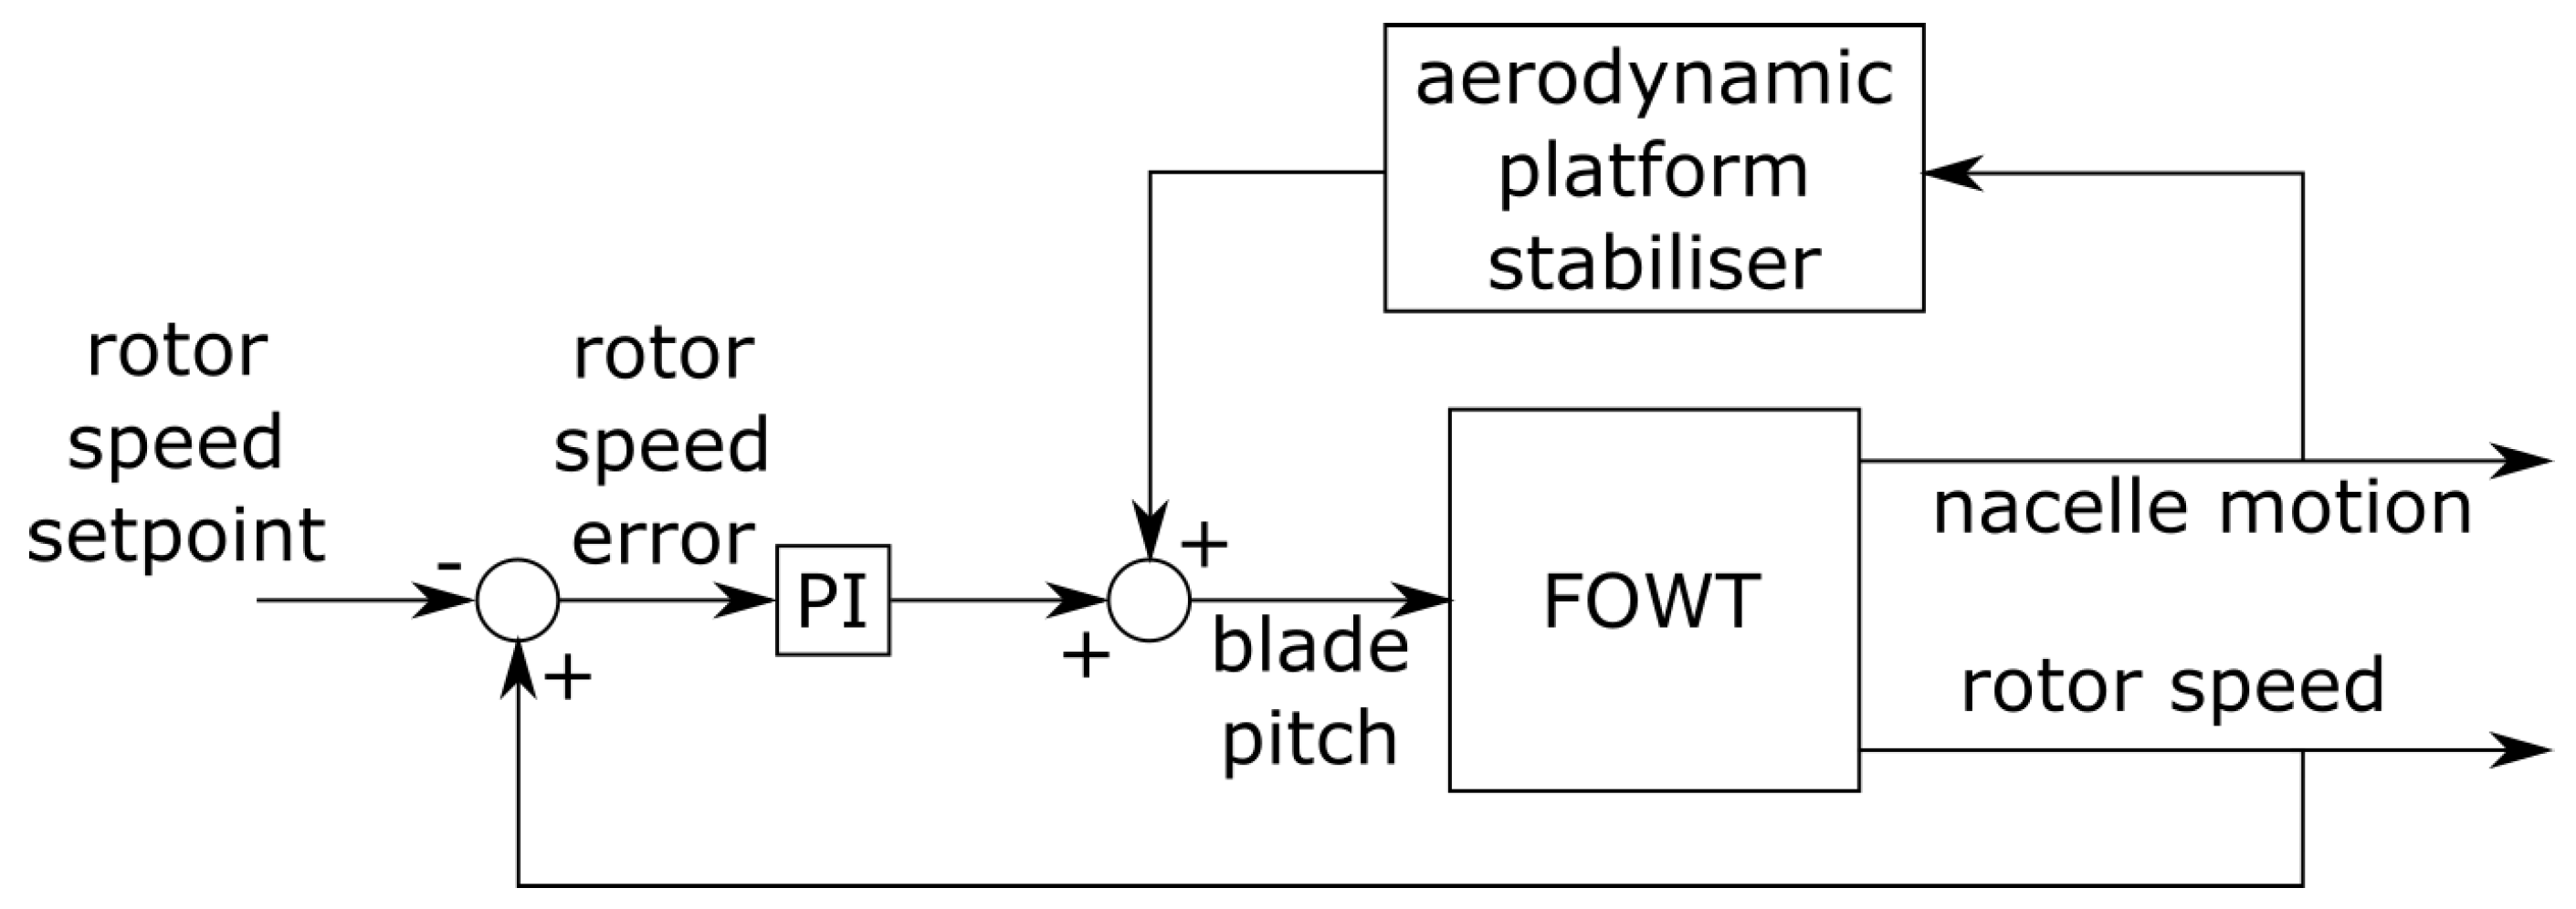
6] but for a larger rated power wind turbine and a hydrodynamically more stable platform, i.e. the DTU 10 MW TripleSpar model. The controller structure has been maintained adding a control loop called APS to the conventional wind turbine blade-pitch PI control loop, as shown in
Figure 3. This conventional PI control loop regulates the generator speed via blade-pitch angle variation. The APS loop aerodynamically damps the platform-pitch motion via an additional blade-pitch angle variation. Thus, the final blade-pitch angle is the sum of the angle demands of both control loops. The objective of this control strategy is to reduce platform-pitch oscillations and tower-base bending moments while regulating the generator speed, without increasing the blade-root bending moments.
3.1. Aerodynamic Platform Stabiliser
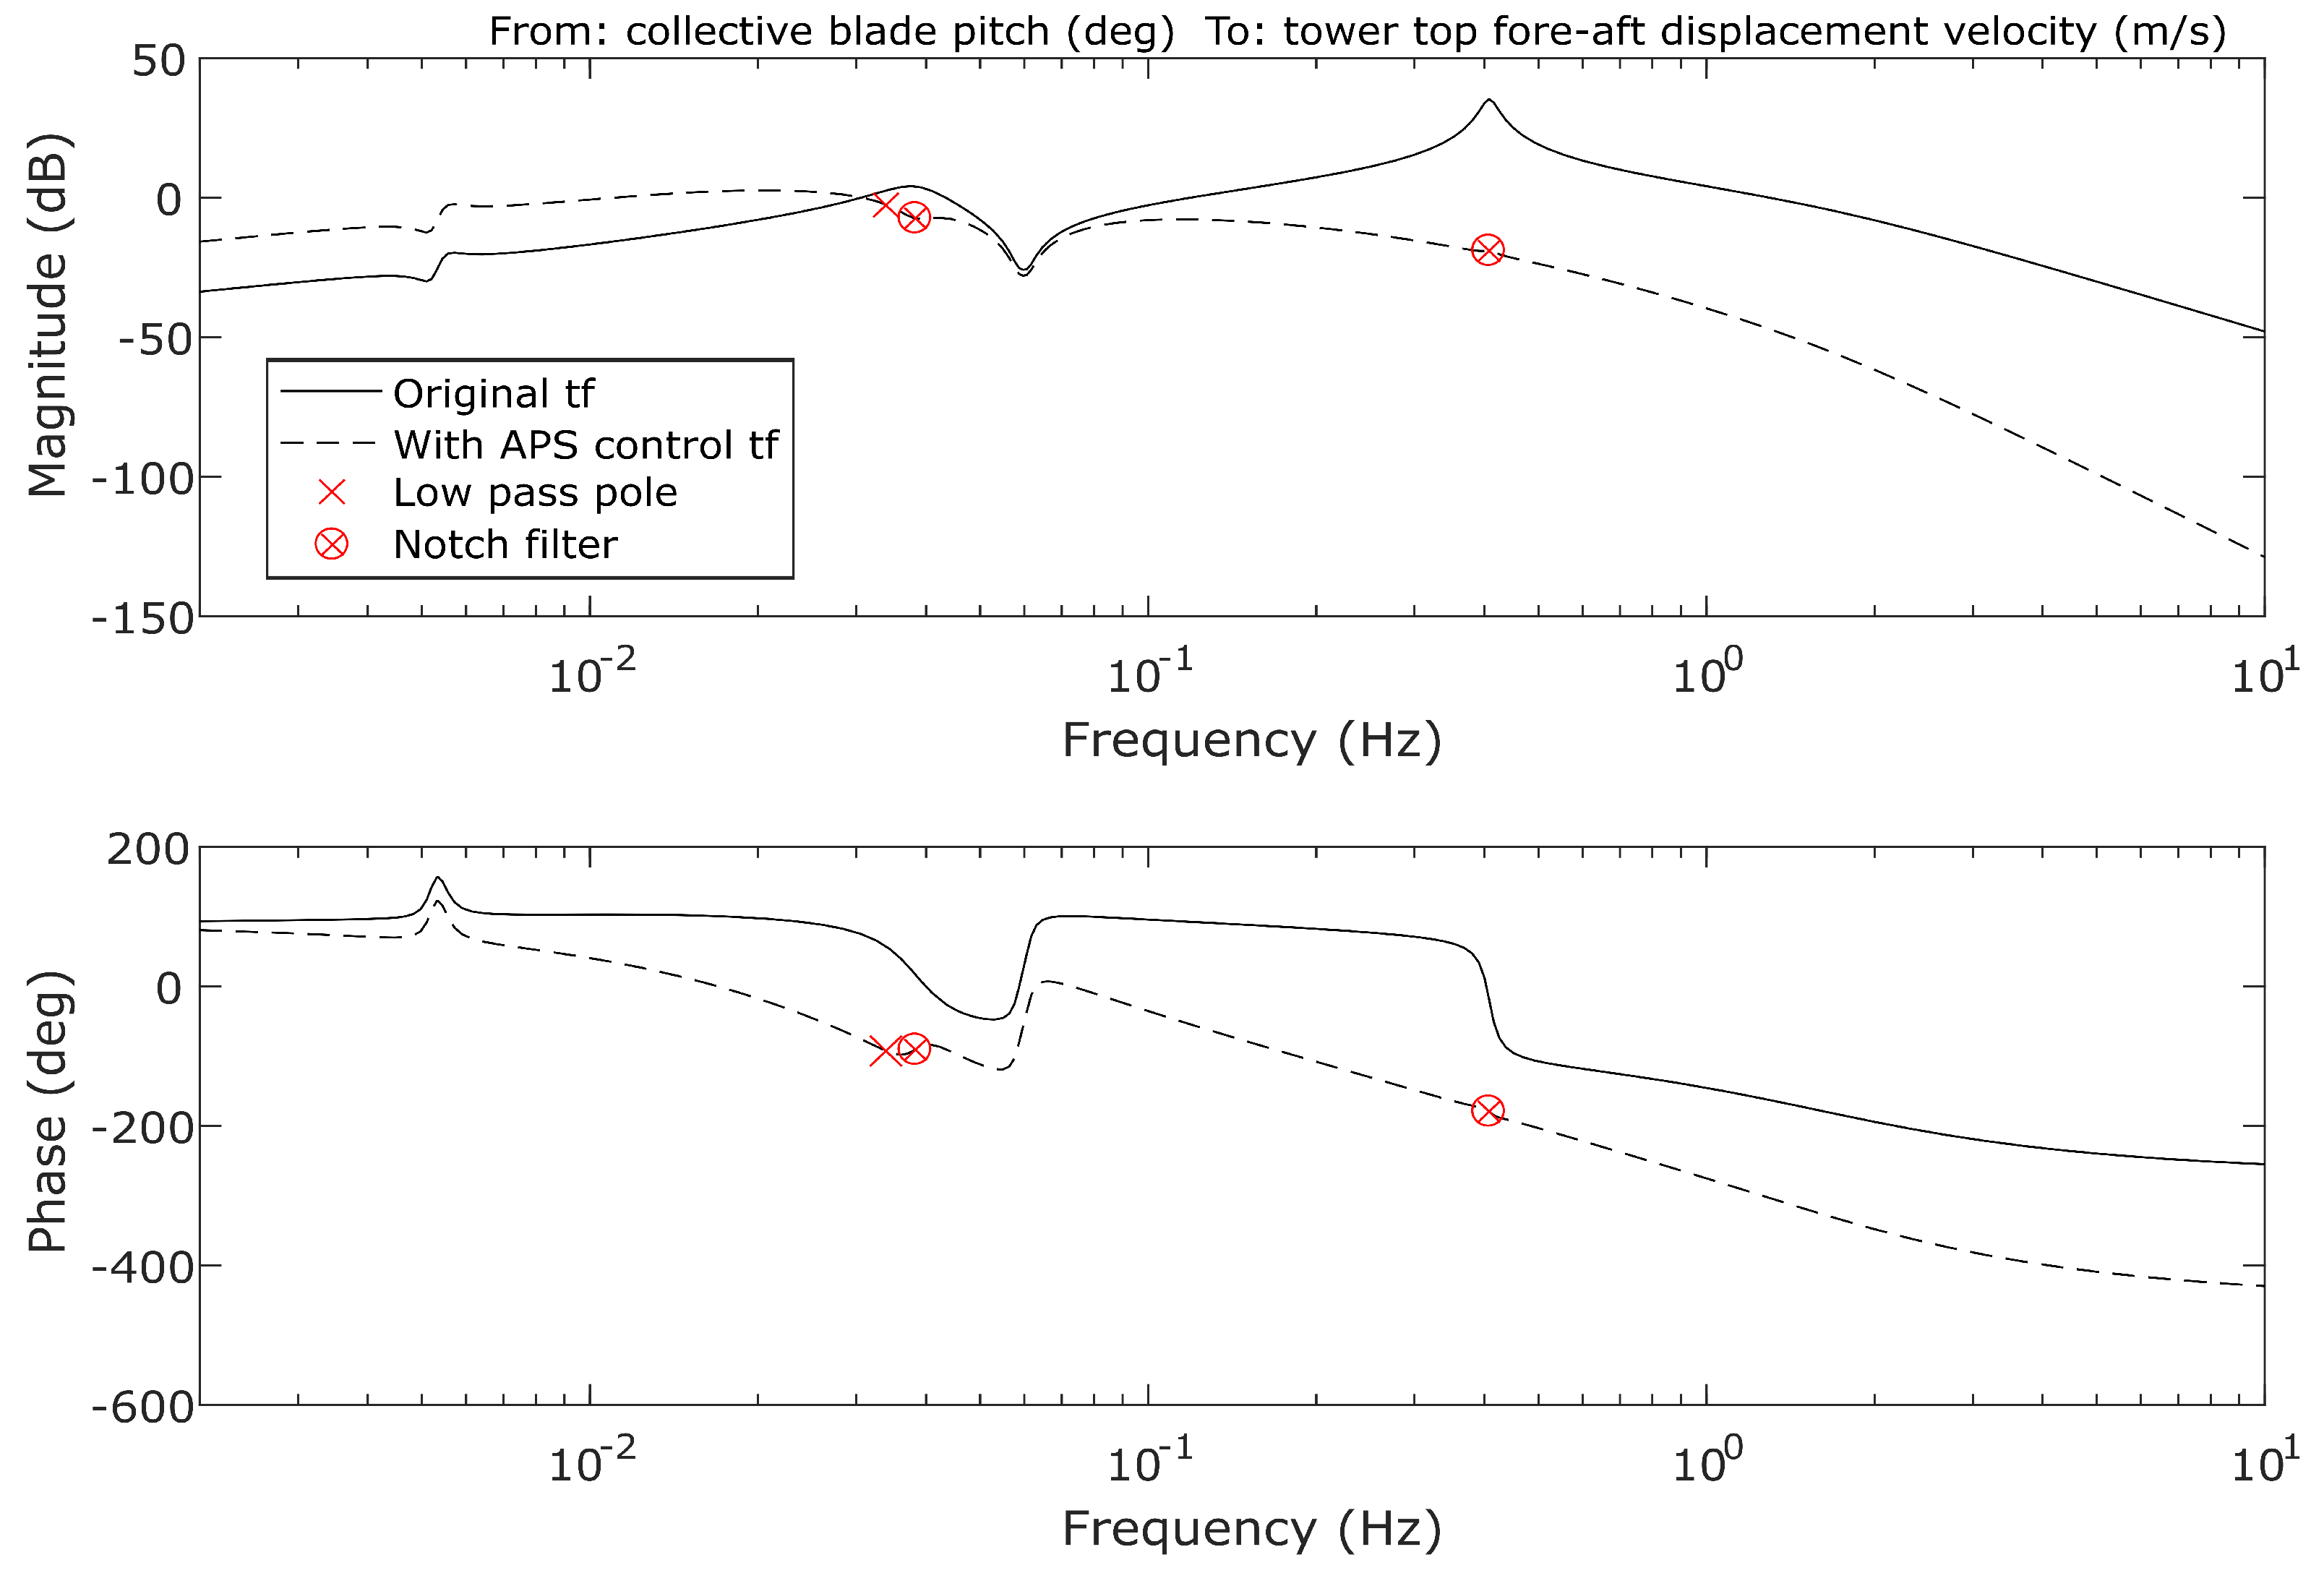
The APS control loop has been tuned by shaping the SLOW linear open-loop bode diagram from the collective blade-pitch angle to tower-top fore-aft displacement velocity. A second order low-pass filter and two second order Notch filters have been implemented.
Figure 4 displays the open loop bode diagrams of: (i) the linearised plant; and (ii) the linearised plant with the APS control, in open-loop configuration. The complex pole at 0.0339 Hz gives the desired open-loop properties between the platform-surge and -pitch natural frequencies. Note that the magnitude is flattened and the phase is around the 0
, which allows us to produce a considerable nacelle-pitch-opposing blade-pitch action in a frequency range in which the conventional PI controller cannot act vigorously, so as not to cause negative platform damping. The Notch filters, at platform-pitch and tower-top fore-aft displacement natural frequencies, were also necessary to avoid the excessive blade-pitch action at such frequencies.
The APS control transfer function, from the tower-top fore-aft displacement velocity to the collective blade-pitch angle, containing the second order low-pass filter, the two Notch filters and the gain, is given by
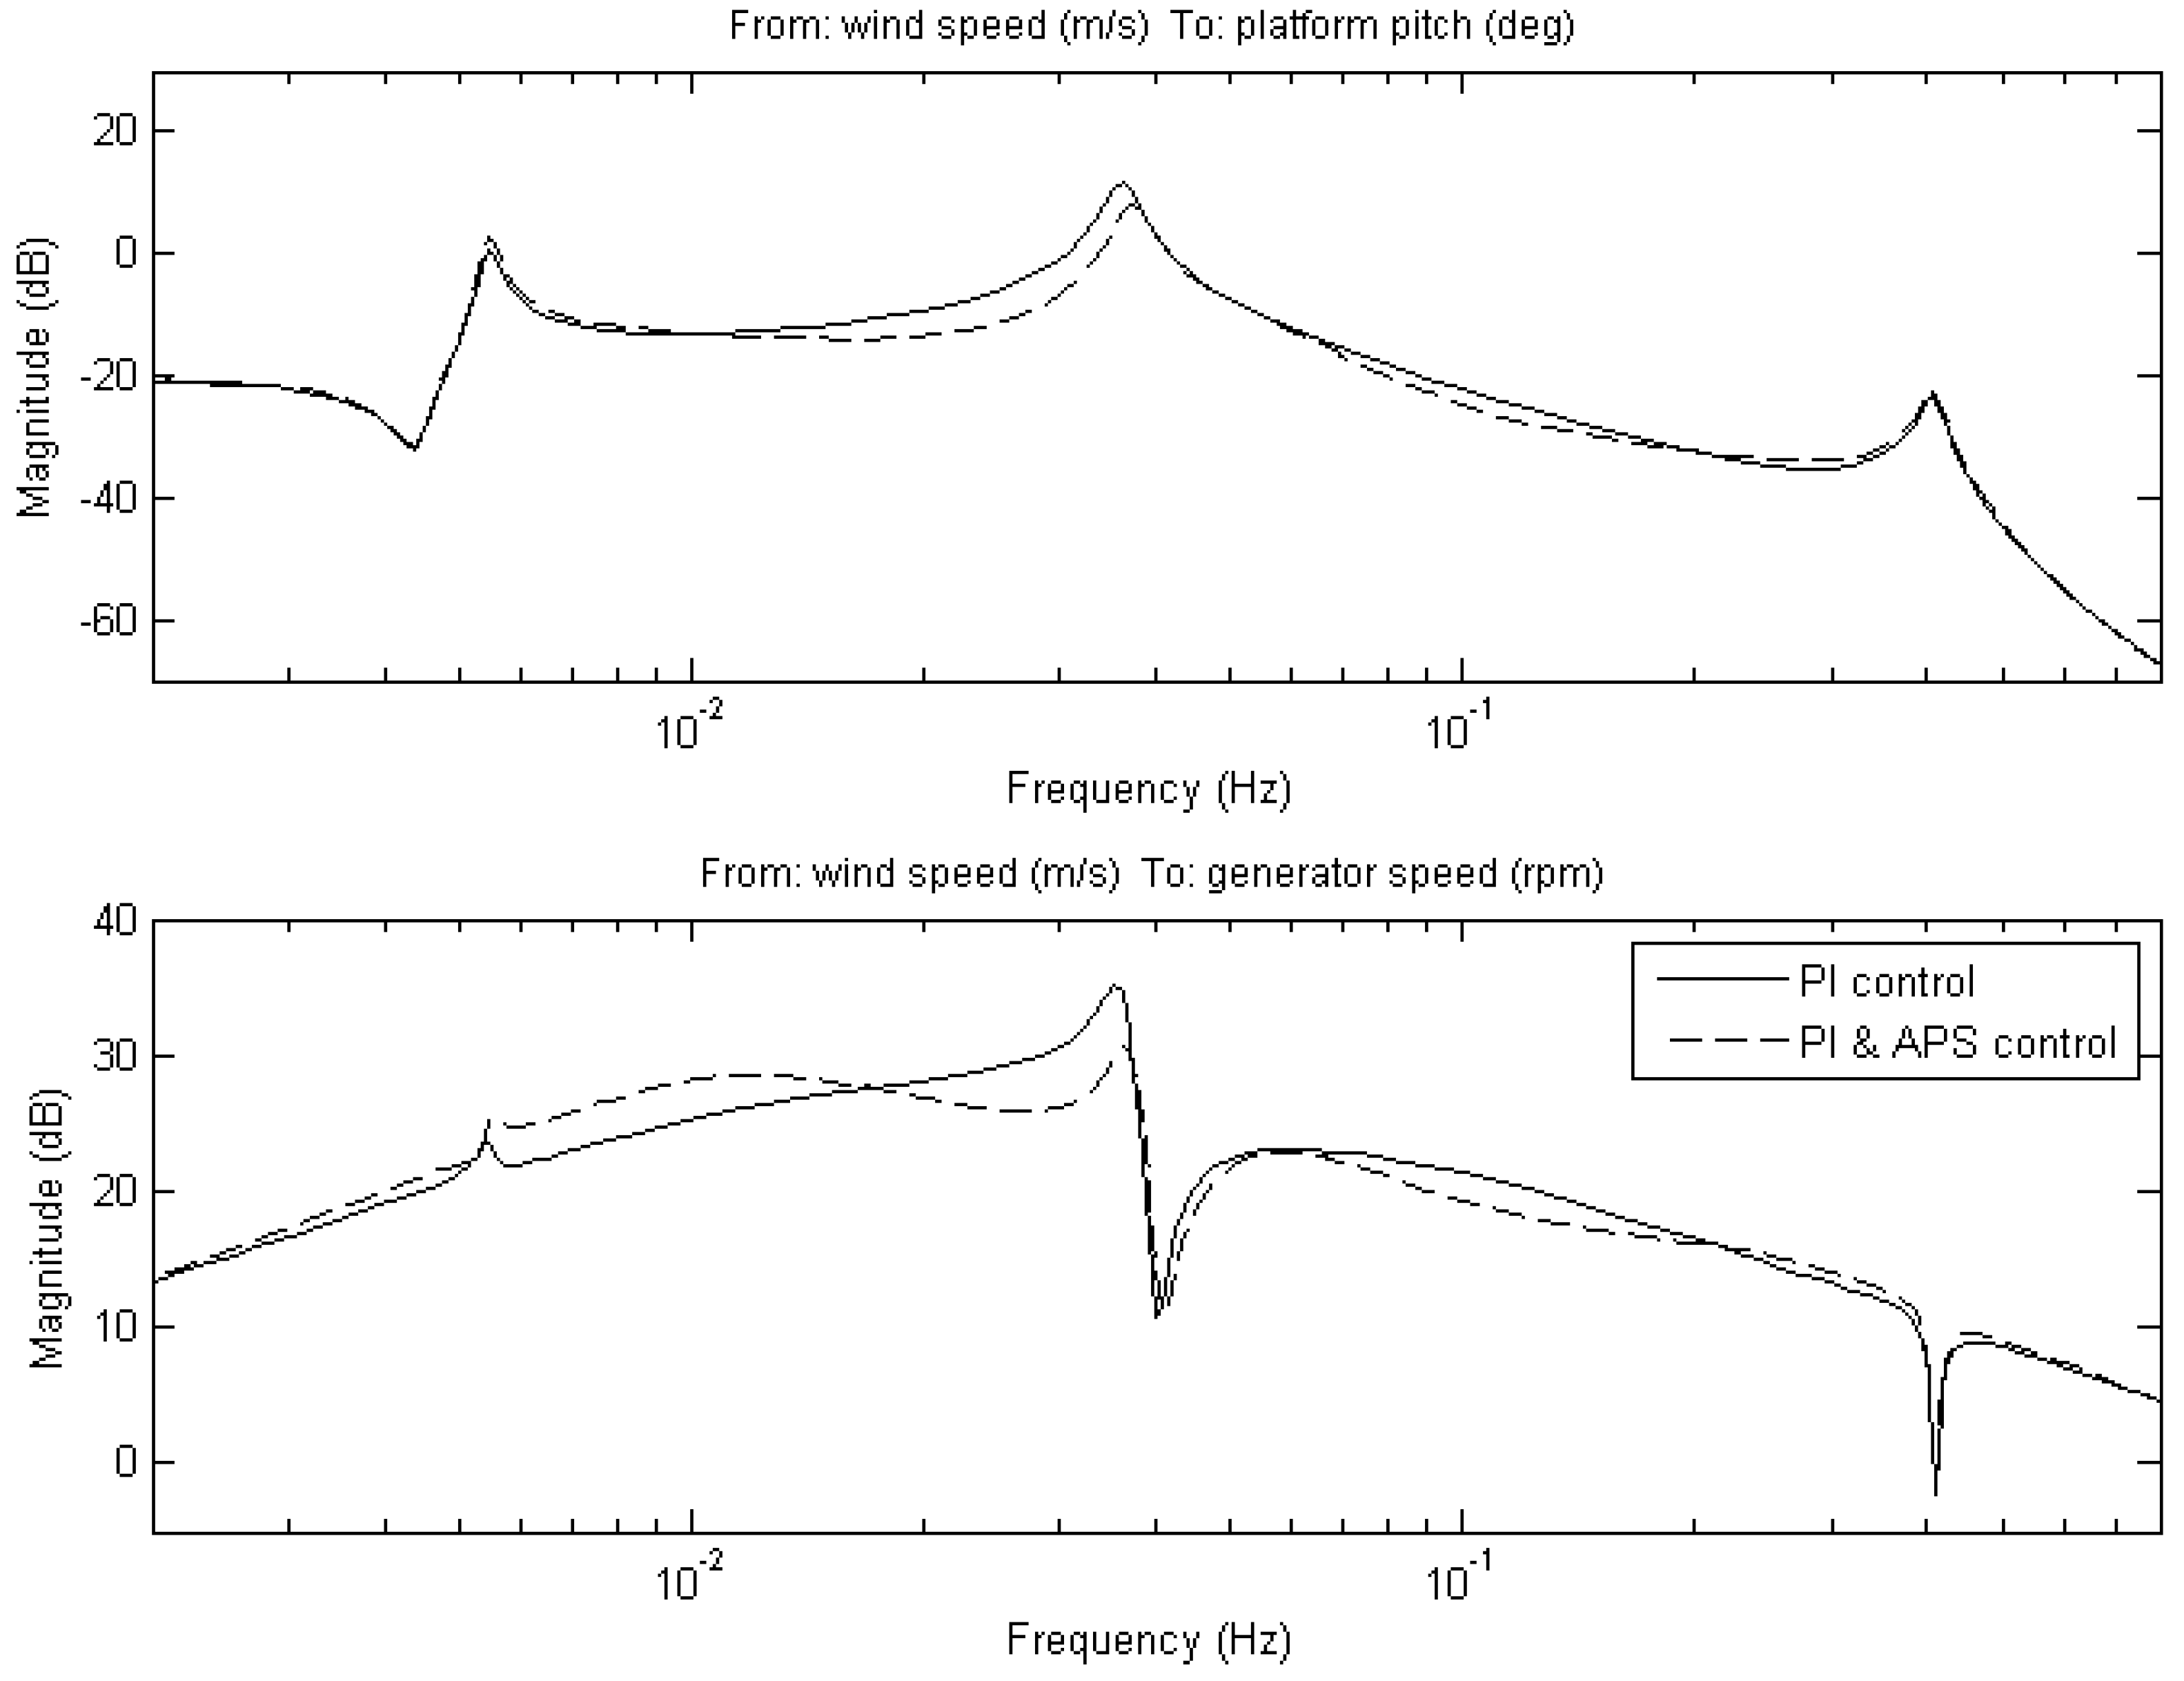
The closed-loop bode diagram from wind to platform-pitch angle and from wind to generator speed are shown in
Figure 5. Large platform-pitch angle reductions are shown between the platform-surge and -pitch natural frequencies. Exactly, the gradual mitigation takes place in the frequency range 0.01–0.04 Hz. The maximum reduction of 4.8 dB is achieved near the platform-pitch natural frequency. The influence of the APS control loop in the generator speed regulation is shown in the bottom bode diagram of the same figure. The same frequency range is affected in this case, where the most significant reduction occurs at the resonance frequency of the platform-pitch natural motion, produced by the negative platform damping effect, where the reduction is about 4.55 dB.
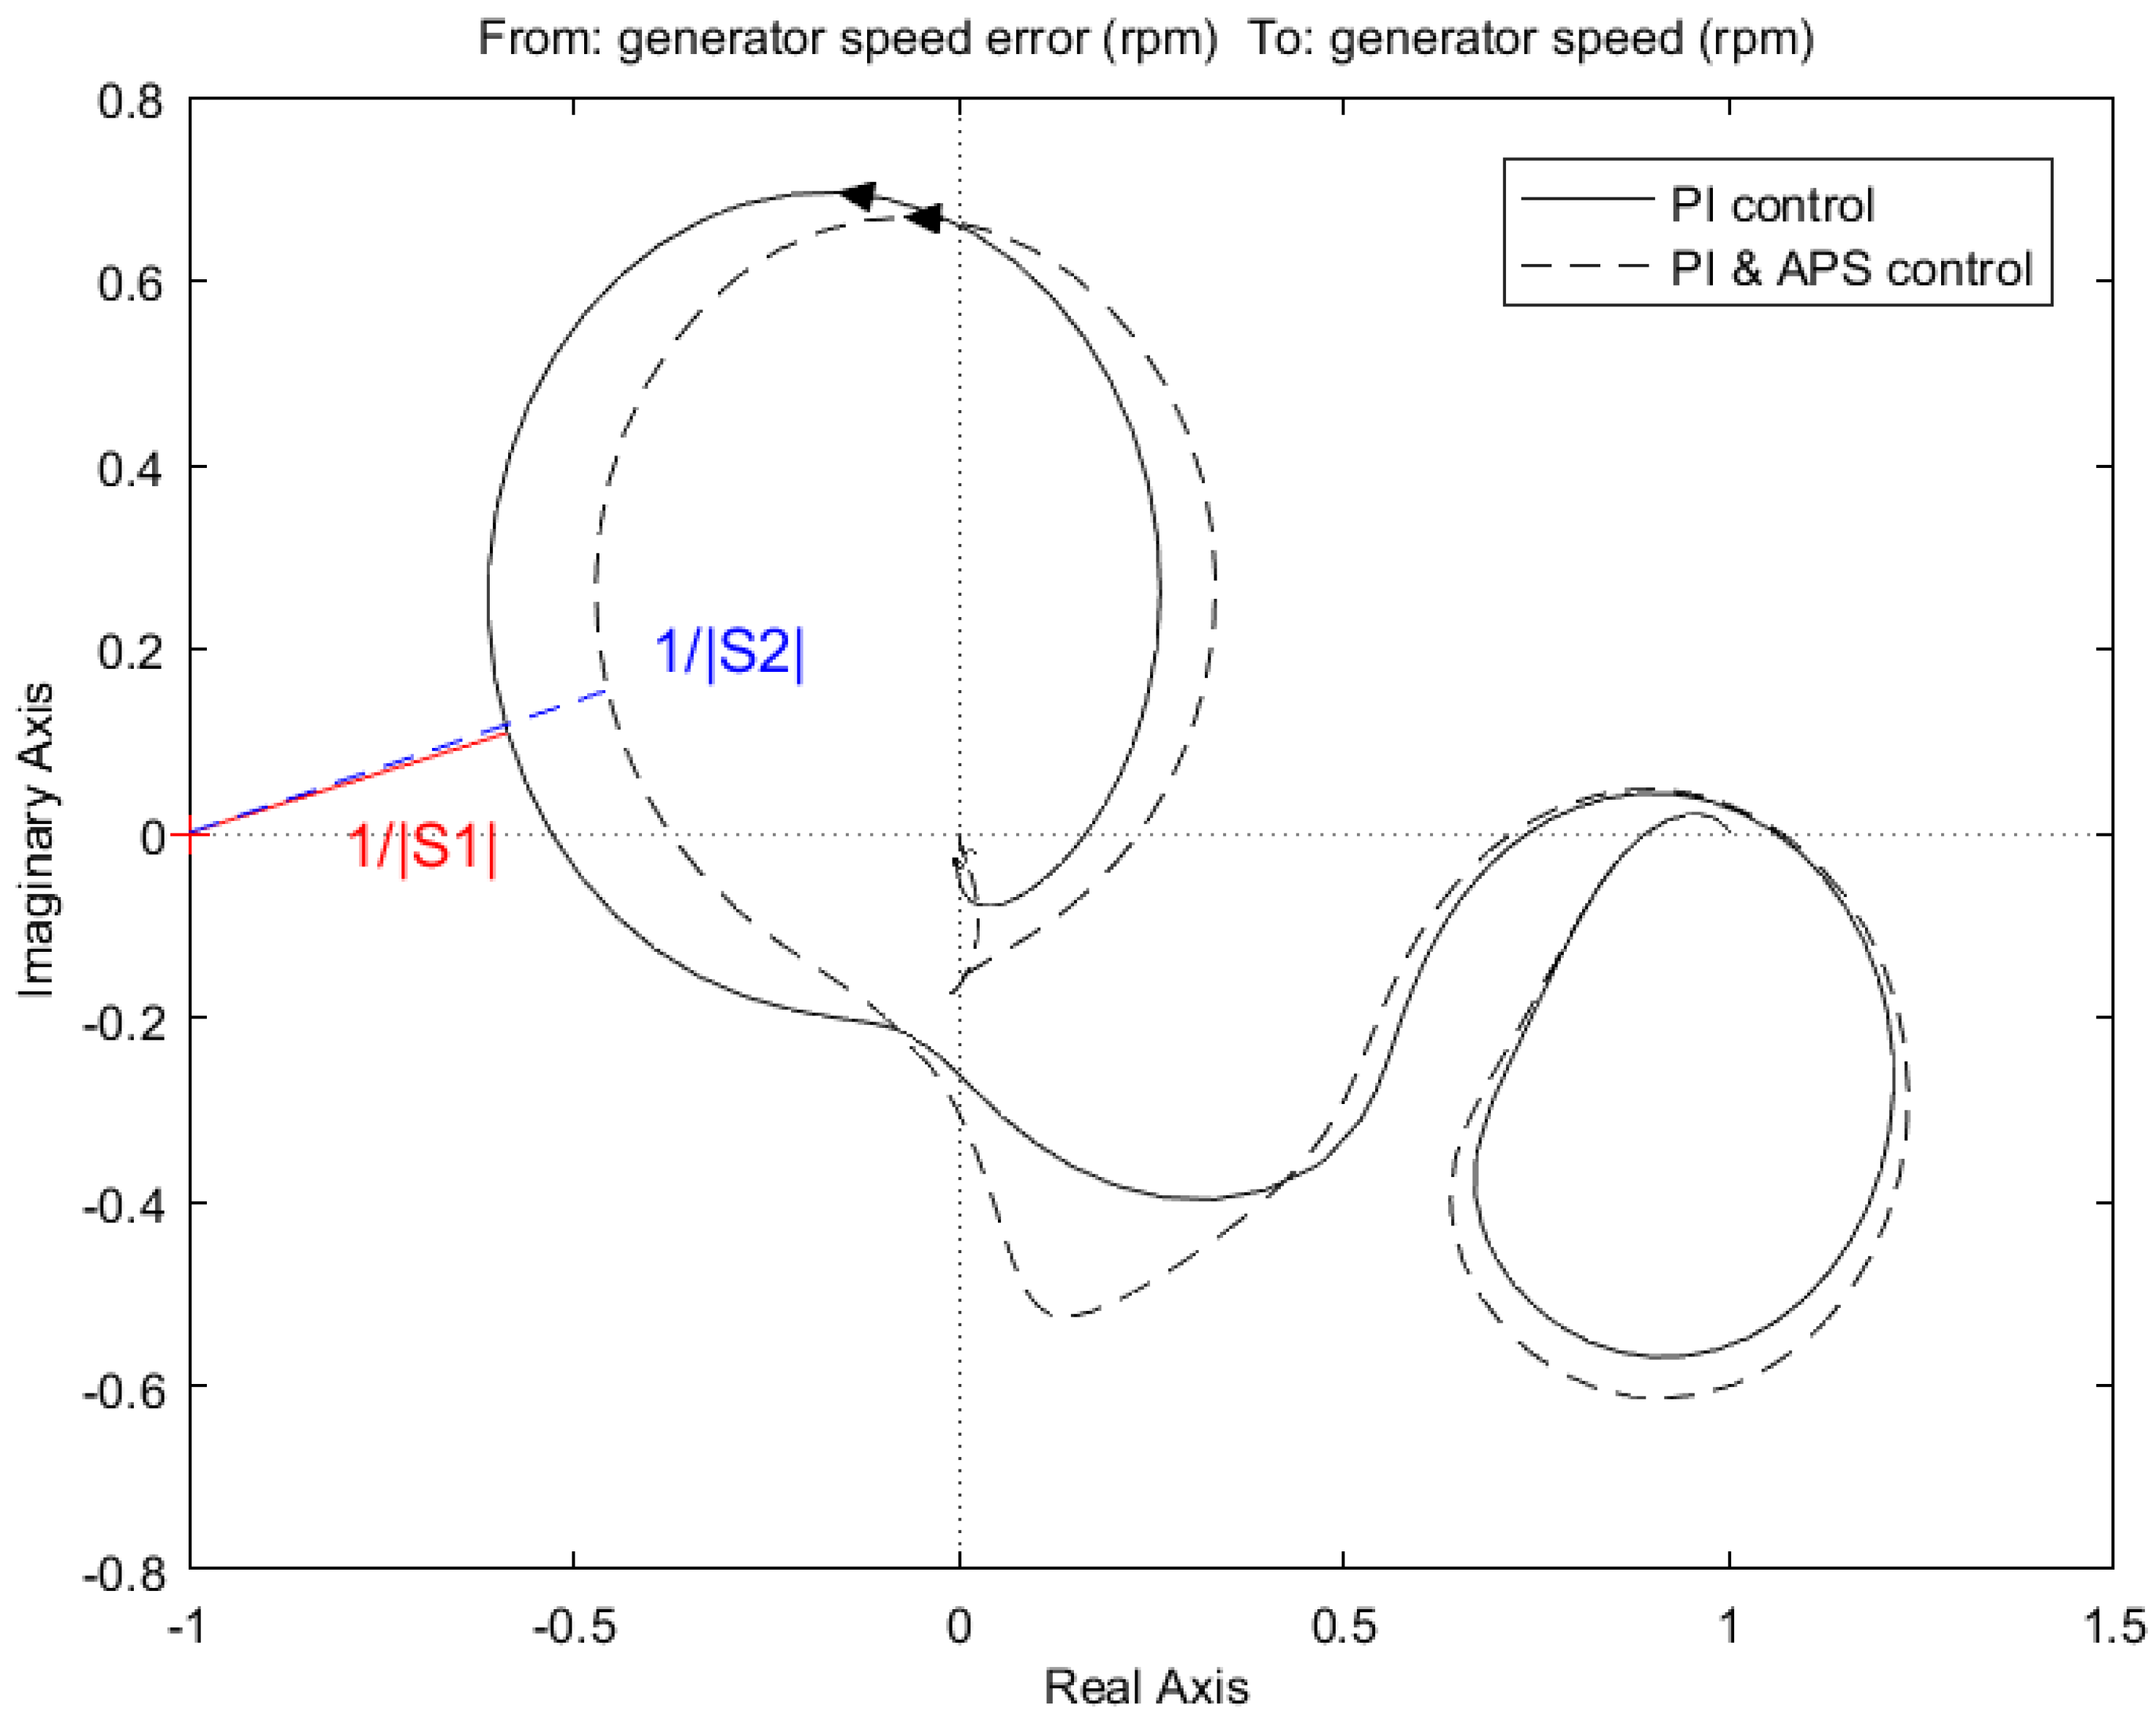
The sensitivity peak analysis of the FOWT control system with and without APS control loop is shown in
Figure 6. For that, a unity negative closed-loop feedback of the conventional PI and the linearised plant is used. This robustness analysis is important to check the influence of the implemented APS control loop in the control system sensitivity. Thus, the inverse of the sensitivity peak is the minimum distance between Nyquist curve and critical point −1 + 0j. As shown in
Figure 6, the Nyquist curve of the transfer function including the APS control loop shows a larger minimum distance (1/|S2|) to the critical point than that presented by the conventional PI control loop (1/|S1|), meaning the implementation of the APS control loop increases the robustness of the control system.
3.2. Conventional Blade-Pitch PI Control Loop
The conventional PI control loop is based on the blade-pitch angle modification for wind turbine rotor speed regulation. This regulation is essential to keep the rotor speed as close as possible to the rated value, in the above rated wind speed region, to produce a good electric power quality with small oscillations. The conventional PI control is tuned to be as vigorous as possible to avoid the large responses to wind gusts. Although this is the wind turbine PI tuning goal, in FOWTs, the conventional PI controller bandwidth cannot be higher than the natural frequency of the platform-pitch motion, as shown in [
5]. The reason of this limitation is to avoid the negative platform damping effect in FOWTs.
The conceptual controller described here was developed by the University of Stuttgart using a linearised model following the method reported in [
16]. The PI design strategy is based on the platform-pitch mode closed-loop pole placement using the SLOW model, where its pole in the closed-loop is set such that the real part is always in the complex left-half plane for all wind speeds. This method results in a gain-scheduling which ensures the stability of the platform at all operating conditions.
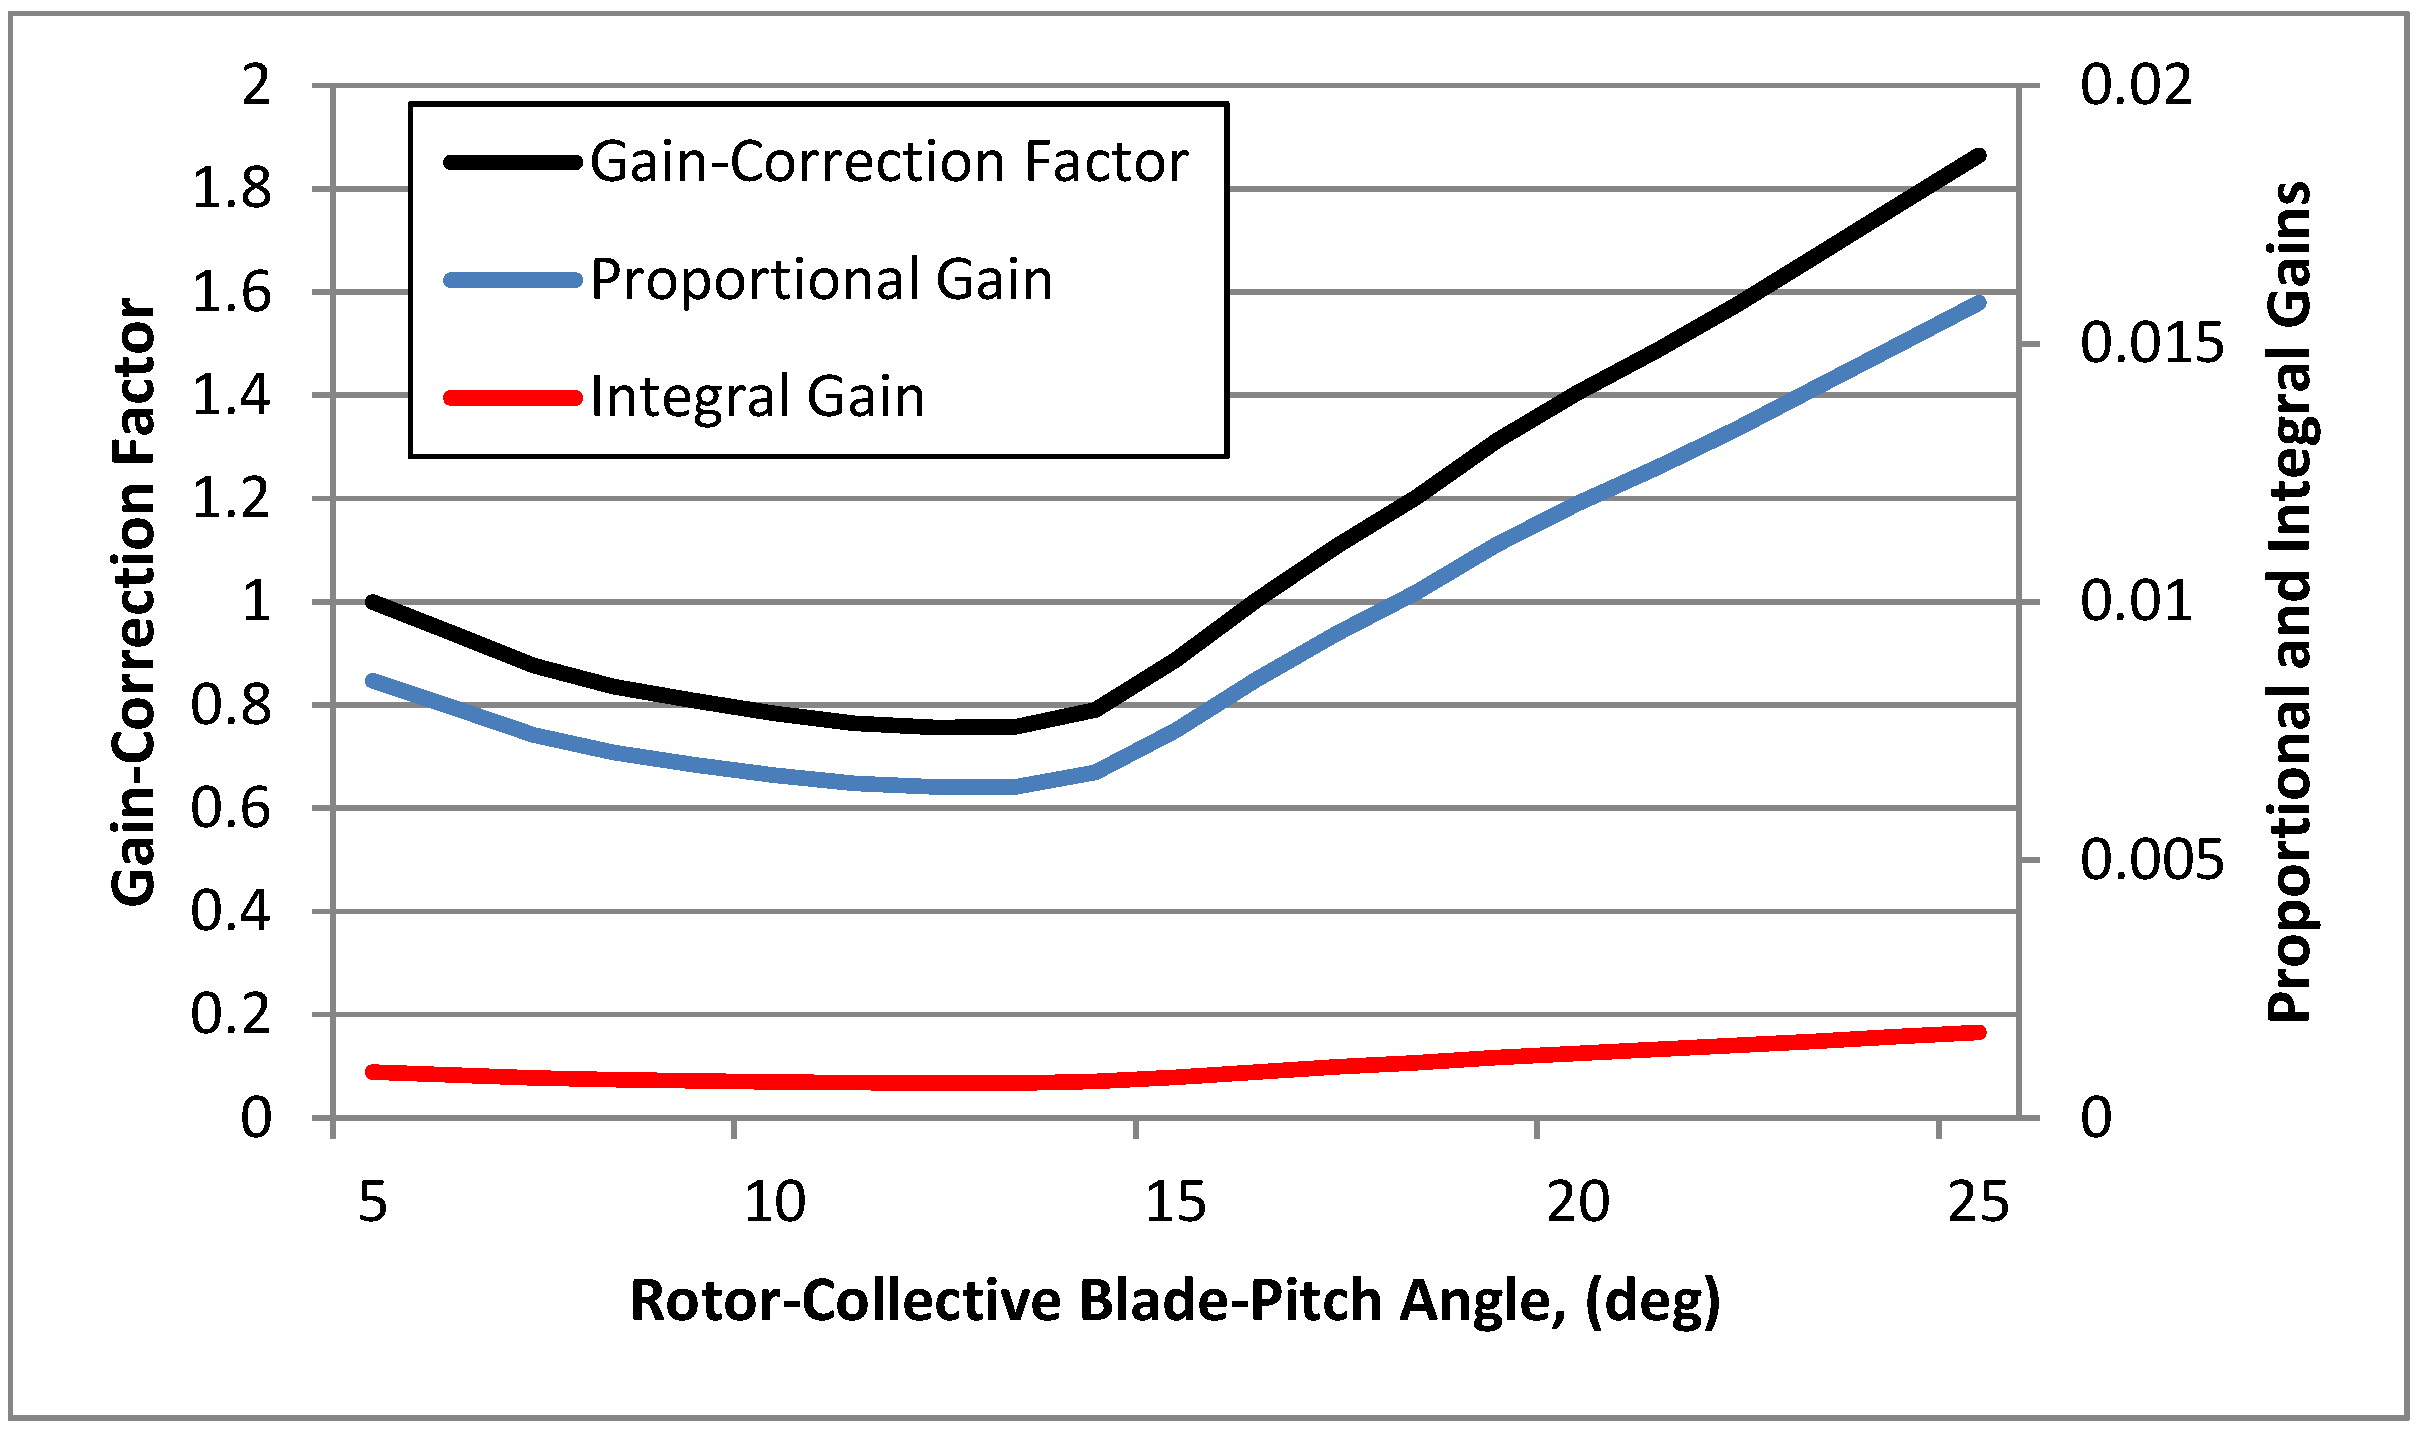
Figure 7 shows the PI controller values implemented for this DTU 10 MW wind turbine mounted on the TripleSpar platform. The non-linear gain scheduling is realized with a lookup table. The generator torque is kept constant in the pitch control region.
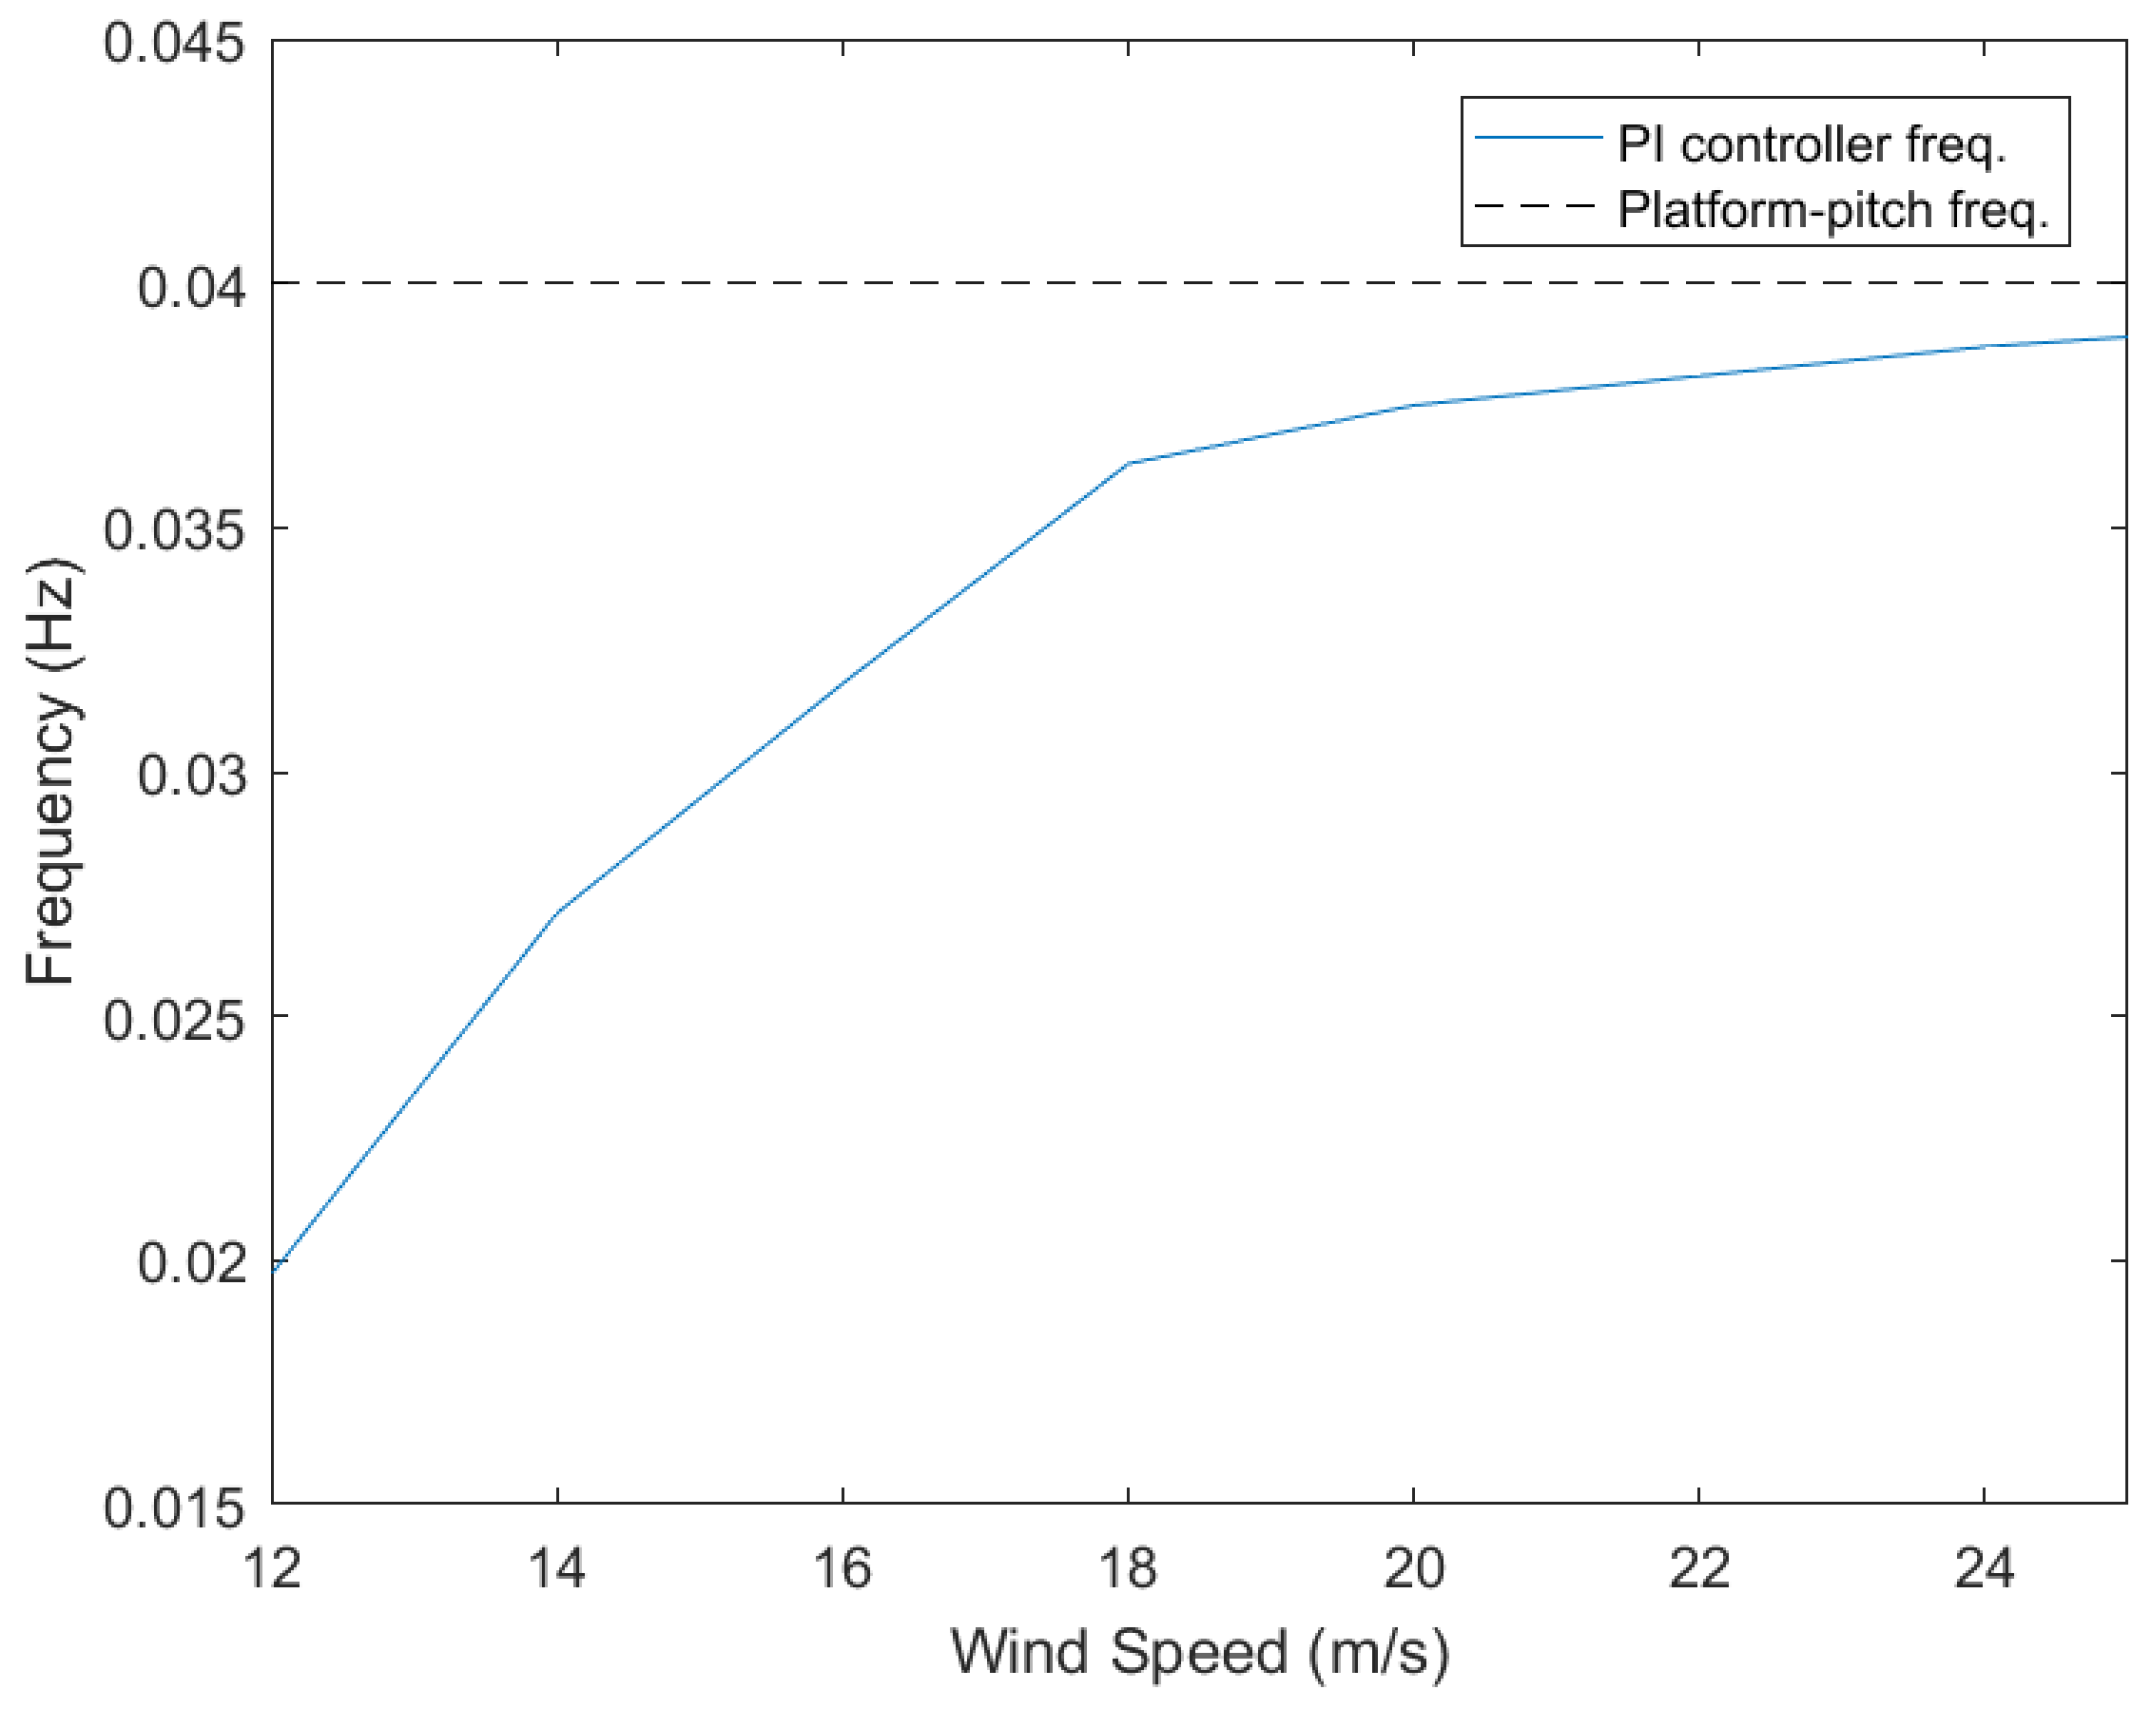
As mentioned previously, over the above rated wind speed region the controller natural frequency must not exceed the platform-pitch natural frequency.
Figure 8 shows the platform-pitch natural and controller bandwidth frequencies in above rated wind speeds. This was checked by analysing the crossover frequency of the open-loop bode diagram including the PI controller and the FOWT linear plant model at each wind speed over the above rated wind speeds until the cut-out wind speed. At low wind speeds, near to the rated generator speed, the PI controller present lower bandwidth frequency than at high wind speeds. This increase goes according to the aerodynamic rotor sensitivity between power and thrust coefficients, ensuring lower controller frequency than the platform-pitch natural frequency in all wind speeds.
4. Simulation Results
Time-domain simulations were carried out to test the DTU 10 MW wind turbine mounted on the TripleSpar platform with the implementation of the control techniques presented in
Section 3. The wind profile was generated with TurbSim v1.06.00 for the Design Load Case (DLC) 1.1 (power production) as defined by the standard IEC61400-1 [
17]. The most conservative turbulence class was selected (wind turbine class-A) to demonstrate the vigorous blade-pitch control response to wind gusts. Irregular waves were generated with the HydroDyn v2.03 module [
18] and the JONSWAP/Pierson-Moskowitz spectrum model. The selected most probable wave-elevation case scenario was about 1.37 m and the peak-spectral period of the incident waves was about 15 s, as the Gaussian-distribution histogram shows in [
5]. The HydroDyn module, coupled into the FAST software, computes the hydrodynamic loads on the floating structure and returns them back to FAST. Note that all the simulations were carried out with Matlab/Simulink (R2016) linked with FAST v8.16.00a, HydroDyn v2.03 and AeroDyn v15.00. FASTv8 full non-linear model has all DOFs enabled.
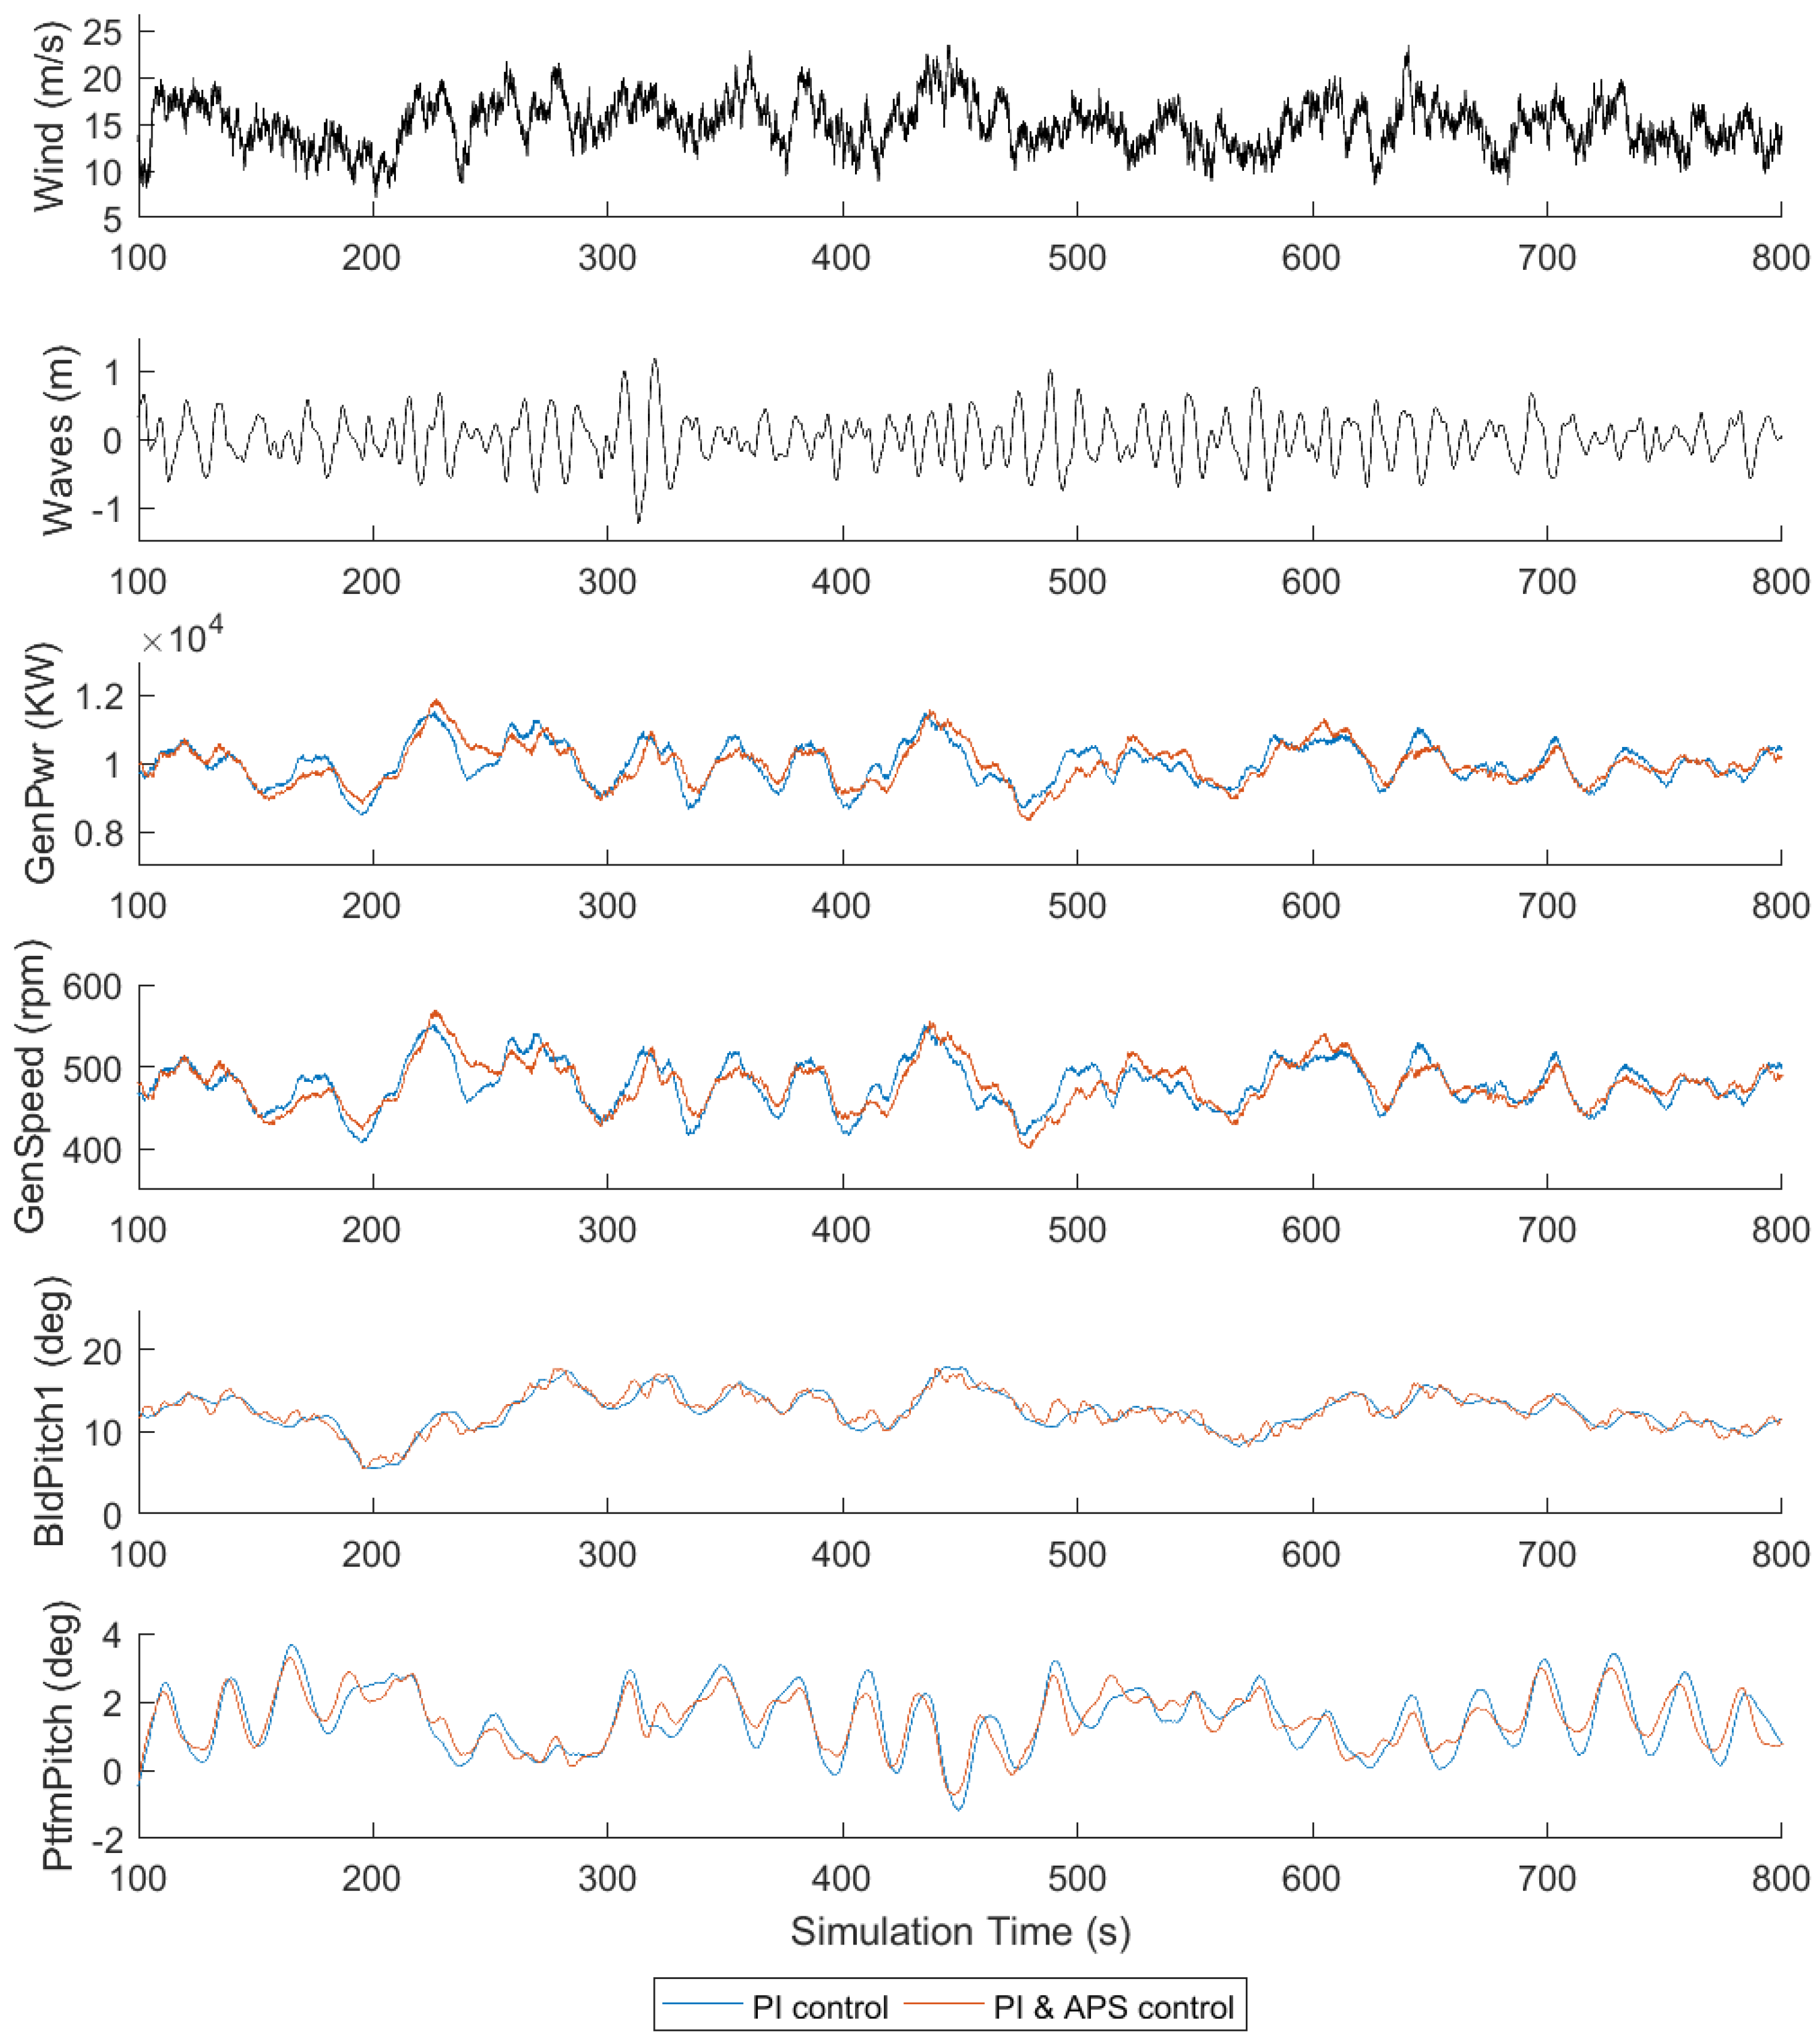
Time-domain simulation results at 16 m/s mean wind speed and 1.37 m wave elevation are shown in
Figure 9. The results comparison shows good improvements in the generator speed regulation with the implementation of the APS control loop. The same regulation result is shown in the generated electric power, due to the constant generator torque strategy applied to this FOWT in the above-rated wind speed region. Significant platform-pitch motion reduction is shown during the simulation thanks to the APS control loop actuation.
Although the blade-pitch activity is not increased strikingly, a small ripple can be seen during the time domain simulation. This ripple is induced by the wave produced platform-pitch oscillations. This is known because the main frequency of the waves and of the ripple present the same value, and also because repeating the same simulation but in still water conditions, the ripple has disappeared. The APS control loop modifies the blade-pitch angle proportionally to the tower-top fore-aft displacement, without discriminating whether the displacement is produced by the wind gust or by the wave induced platform-pitch motion. The ripple can be easily seen in this case, because the natural frequency of the platform-pitch motion and wave peak-spectral frequency are different.
The maximum, minimum, mean (
) and standard deviation (
) of the time-domain simulation results are summarised in
Table 1. Small differences are shown between PI and APS control statistic results in the generator power and generator speed, meaning that the APS control loop does not perturb the normal performance of those variables. However, the platform pitch results shows more conservative maximum and minimum values, whereas standard deviation with the implementation of the APS control, meaning that effectively the APS control loop reduces de platform-pitch oscillations.
The overall FOWT performance improvements with the TripleSpar platform are not as spectacular as shown with the barge-type platform in [
6]. This is because the APS control loop acts proportionally to the tower-top fore-aft displacement. Since the TripleSpar platform has a higher hydrodynamic stiffness, the tower-top fore-aft displacement is smaller, and, hence, the APS influence is smaller too. However, to greater or lesser extent, the overall FOWT performance improves with the implementation of the APS control loop.
5. Load Analysis
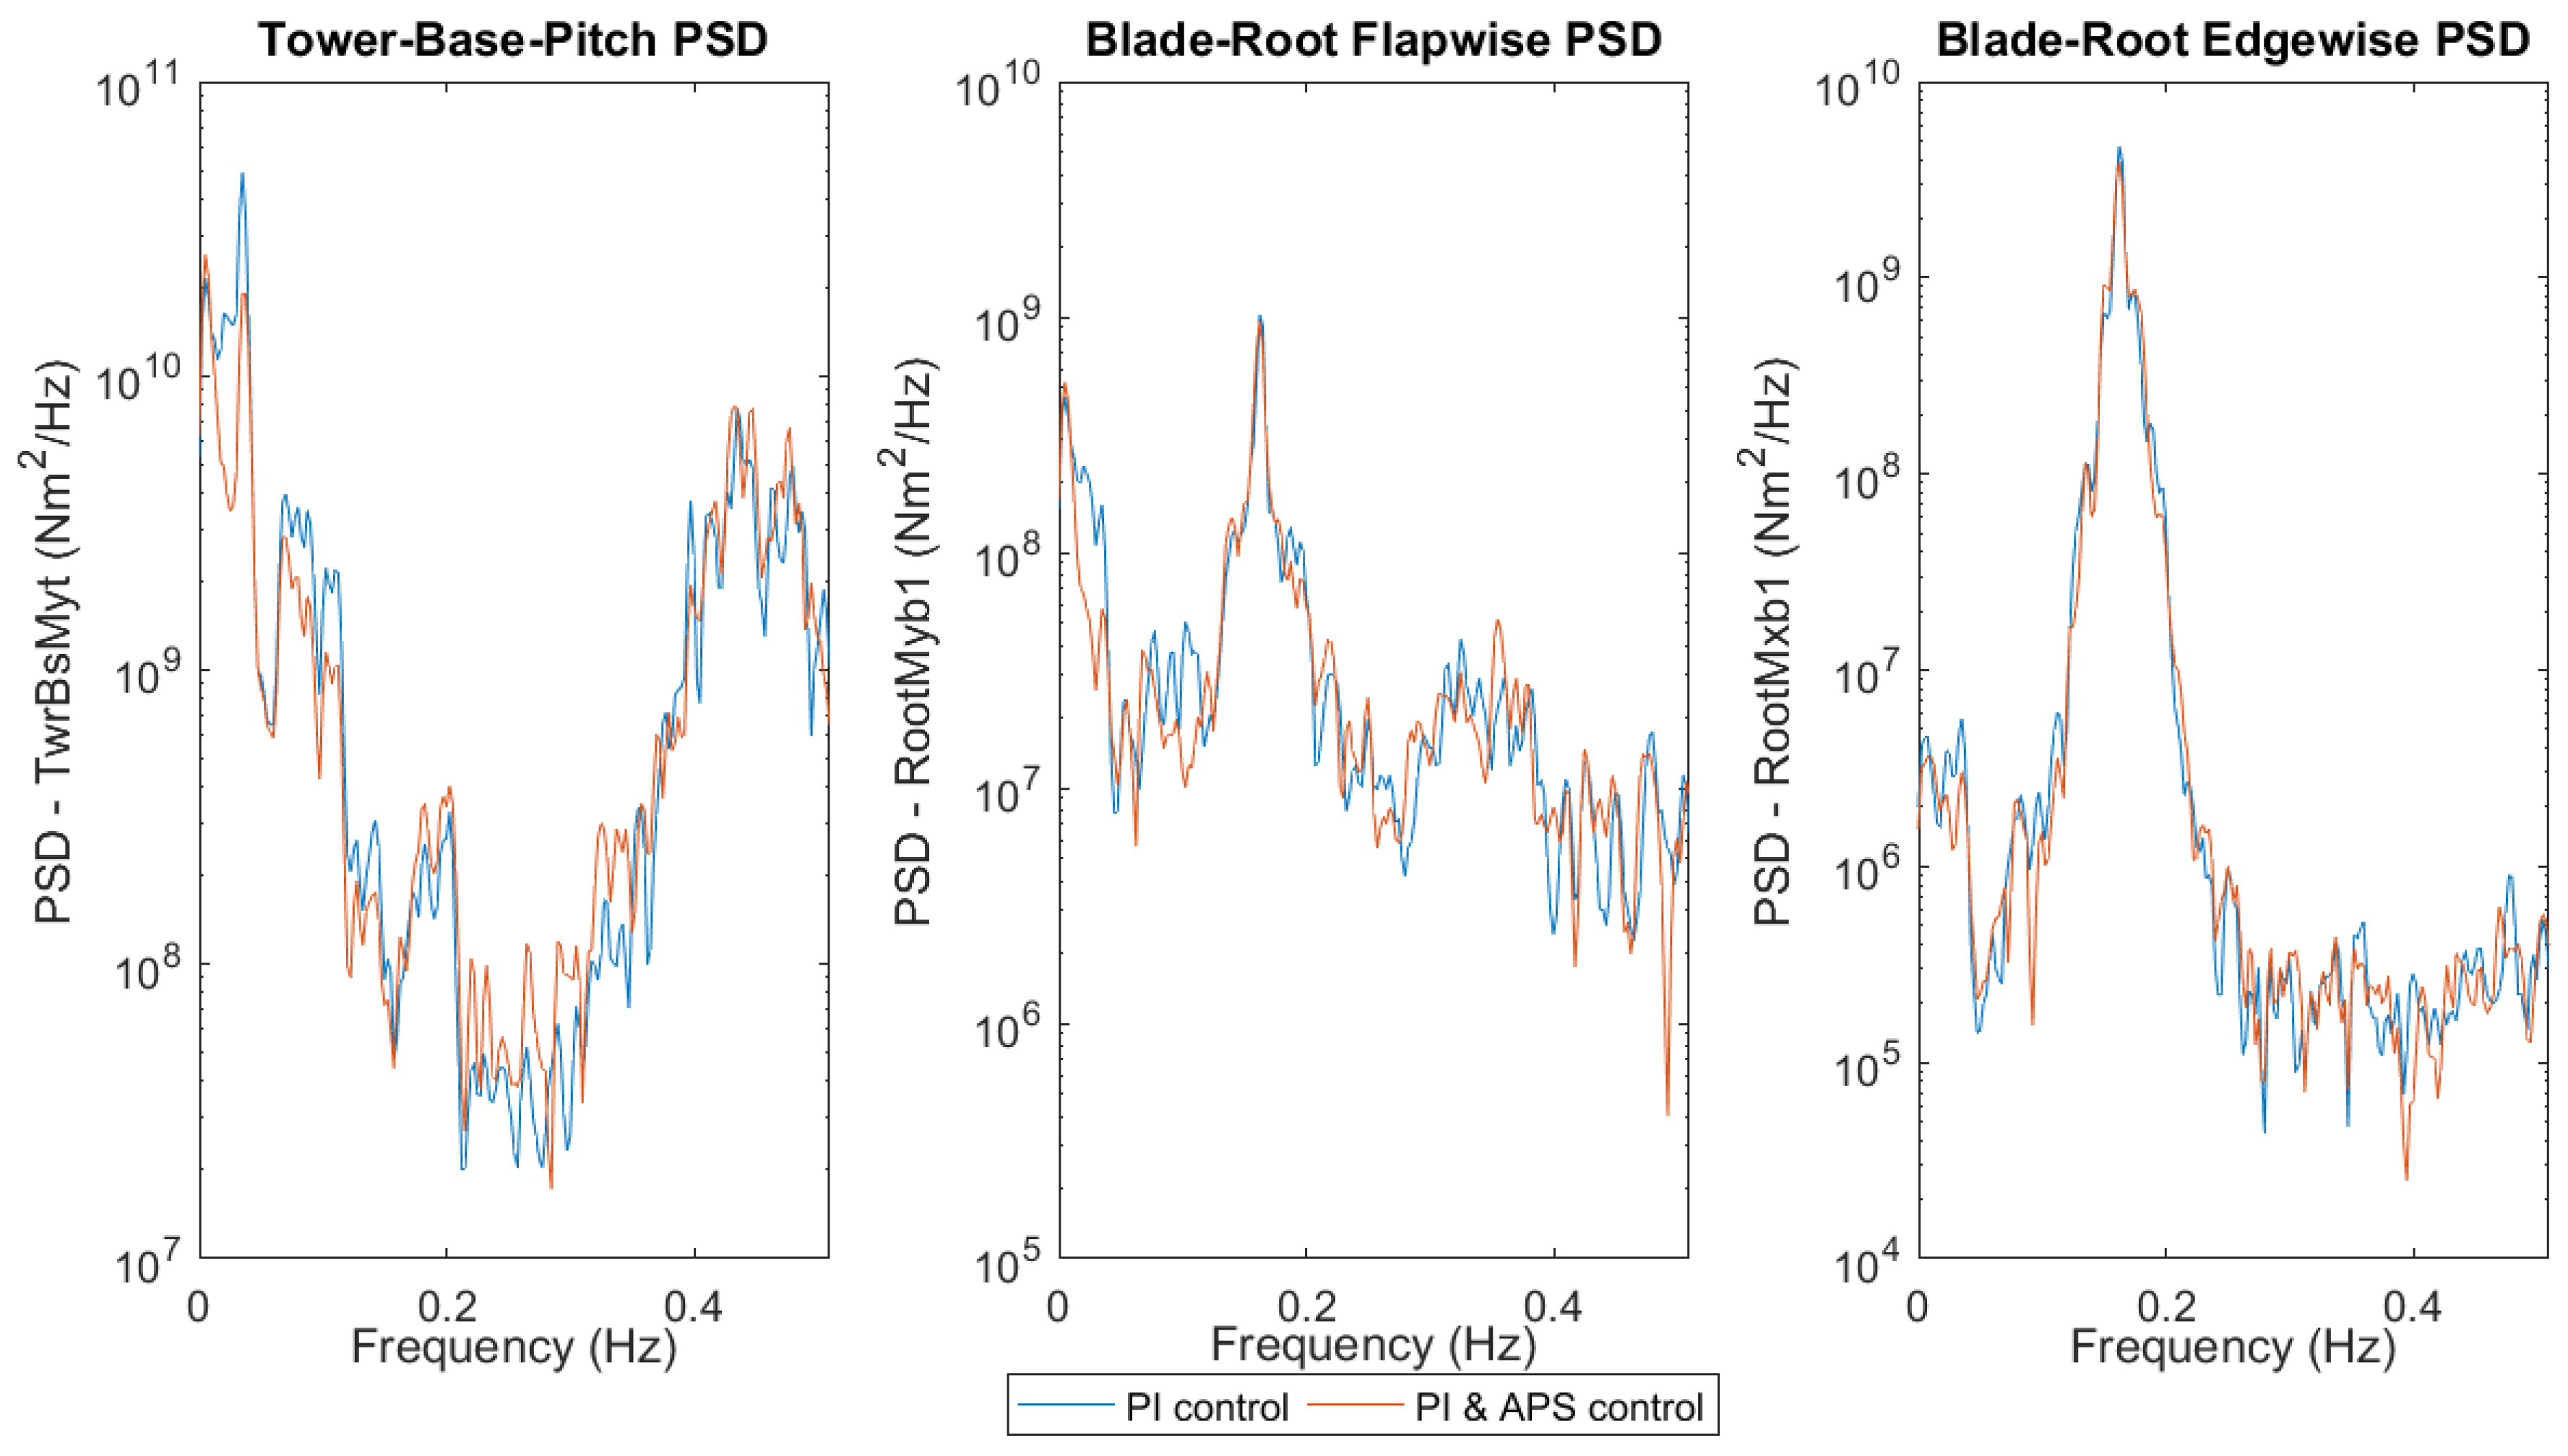
The Power Spectral Density (PSD) of a time series provides the information about the energy concentration in the frequency-domain regions. This analysis helps identifying which frequencies collect more activity of the measured signal. In this case, the critical FOWT tower-base-pitch, blade-root flapwise and edgewise bending moments are analysed as shown in
Figure 10. The same time interval as that considered for the time-domain simulation is used for the PSD analysis, not taking into account the first 100 s to avoid transients of the start-up. Appreciable improvements are achieved at low frequencies where the APS control technique has the highest influence. The blade-root flapwise bending moment result is smaller at this frequency range due to the reduction in the rotor thrust thanks to the vigorous blade-pitch reaction, whereas the tower-base pitch bending moment is smaller due to the reduction of the platform-pitch oscillations. The blade-root edgewise bending moment presents very similar results for both control strategies, meaning that the implementation of the APS control loop does not negatively affect to the blade-root edgewise. There is no negative impact on the rotor speed frequency (1P = 0.16 Hz) as well as on the blade passing frequency (3P), as it can be seen in the plot.
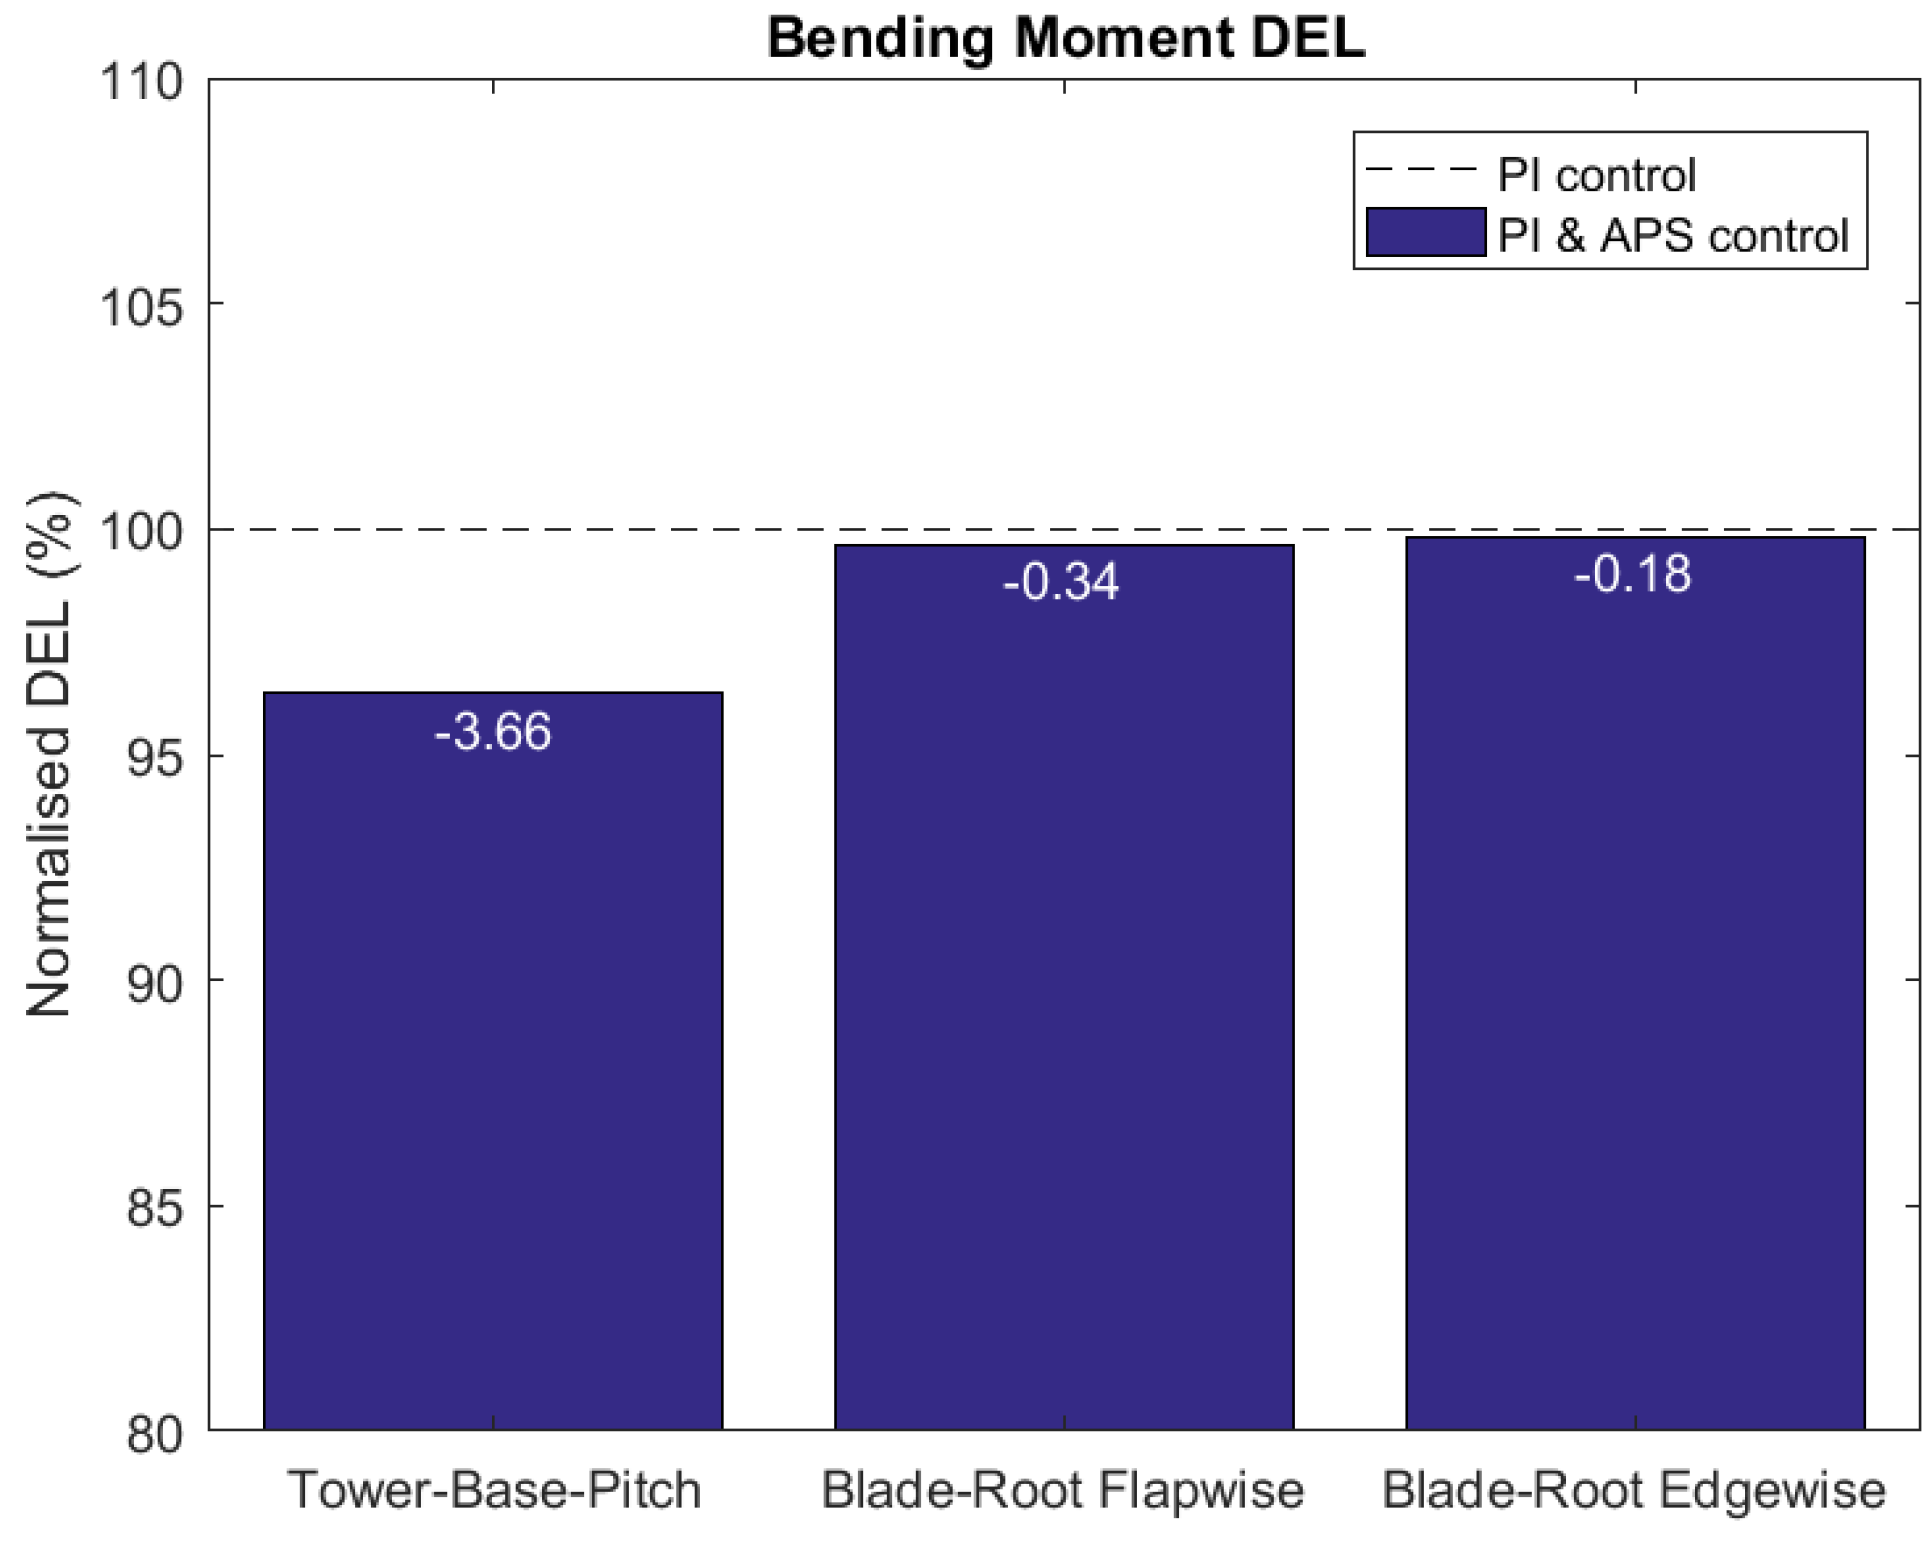
The Damage Equivalent Load (DEL) is a typical approach for assessing the overall fatigue loading damage impact of a given time-history load signal. In this case, the DELs have been calculated with the rain-flow counting method for a life time extrapolation of 20 years. The APS control loop results are compared to the conventional PI detuned results, and given in percentages. The tower-base-pitch, blade-root flapwise and edgewise bending moments DELs are shown in
Figure 11. Substantial improvement of 3.66% in the tower-base-pitch bending moment is shown with the implementation of the APS control loop. No remarkable improvement is shown in the blade-root flapwise and edgewise bending moments; however, these results confirm that the APS control loop has no a negative effect on the blade-root loads.
6. Result Discussion
A comparison between SLOW and FAST linear models has been presented. The results show good frequency and magnitude agreements in the Bode and Nyquist diagrams. A small deviation is seen due to the difference of the mooring modelling, wave radiation influence and/or viscous drag implementation between SLOW and FAST. However, such a small deviation does not affect to the APS control loop tuning process, validating the low-order SLOW linear models accuracy for model control design process.
Time-domain results show good improvements in the overall FOWT performance with the APS control loop implementation, which improves the generator speed as well as generated electric power quality. The platform-pitch motions have been substantially reduced as well. The PSD and DEL results support those improvements showing a tower-base bending moment reduction of 3.66%, whereas the blade-root flapwise and edgewise bending moments have not been negatively affected by the implementation of the APS control loop.
An increment in the blade-pitch activity has been observed through a small ripple of about the same frequency as incident waves. This is because the APS control loop cannot discriminate the tower-top fore-aft motions produced by the wind gusts and those induced by the incident waves. This motivates us to continue researching on another control loop for the incident waves effect cancellation.

 ,
, 


