DAG-Based Distributed Ledger for Low-Latency Smart Grid Network


Abstract
:
1. Introduction
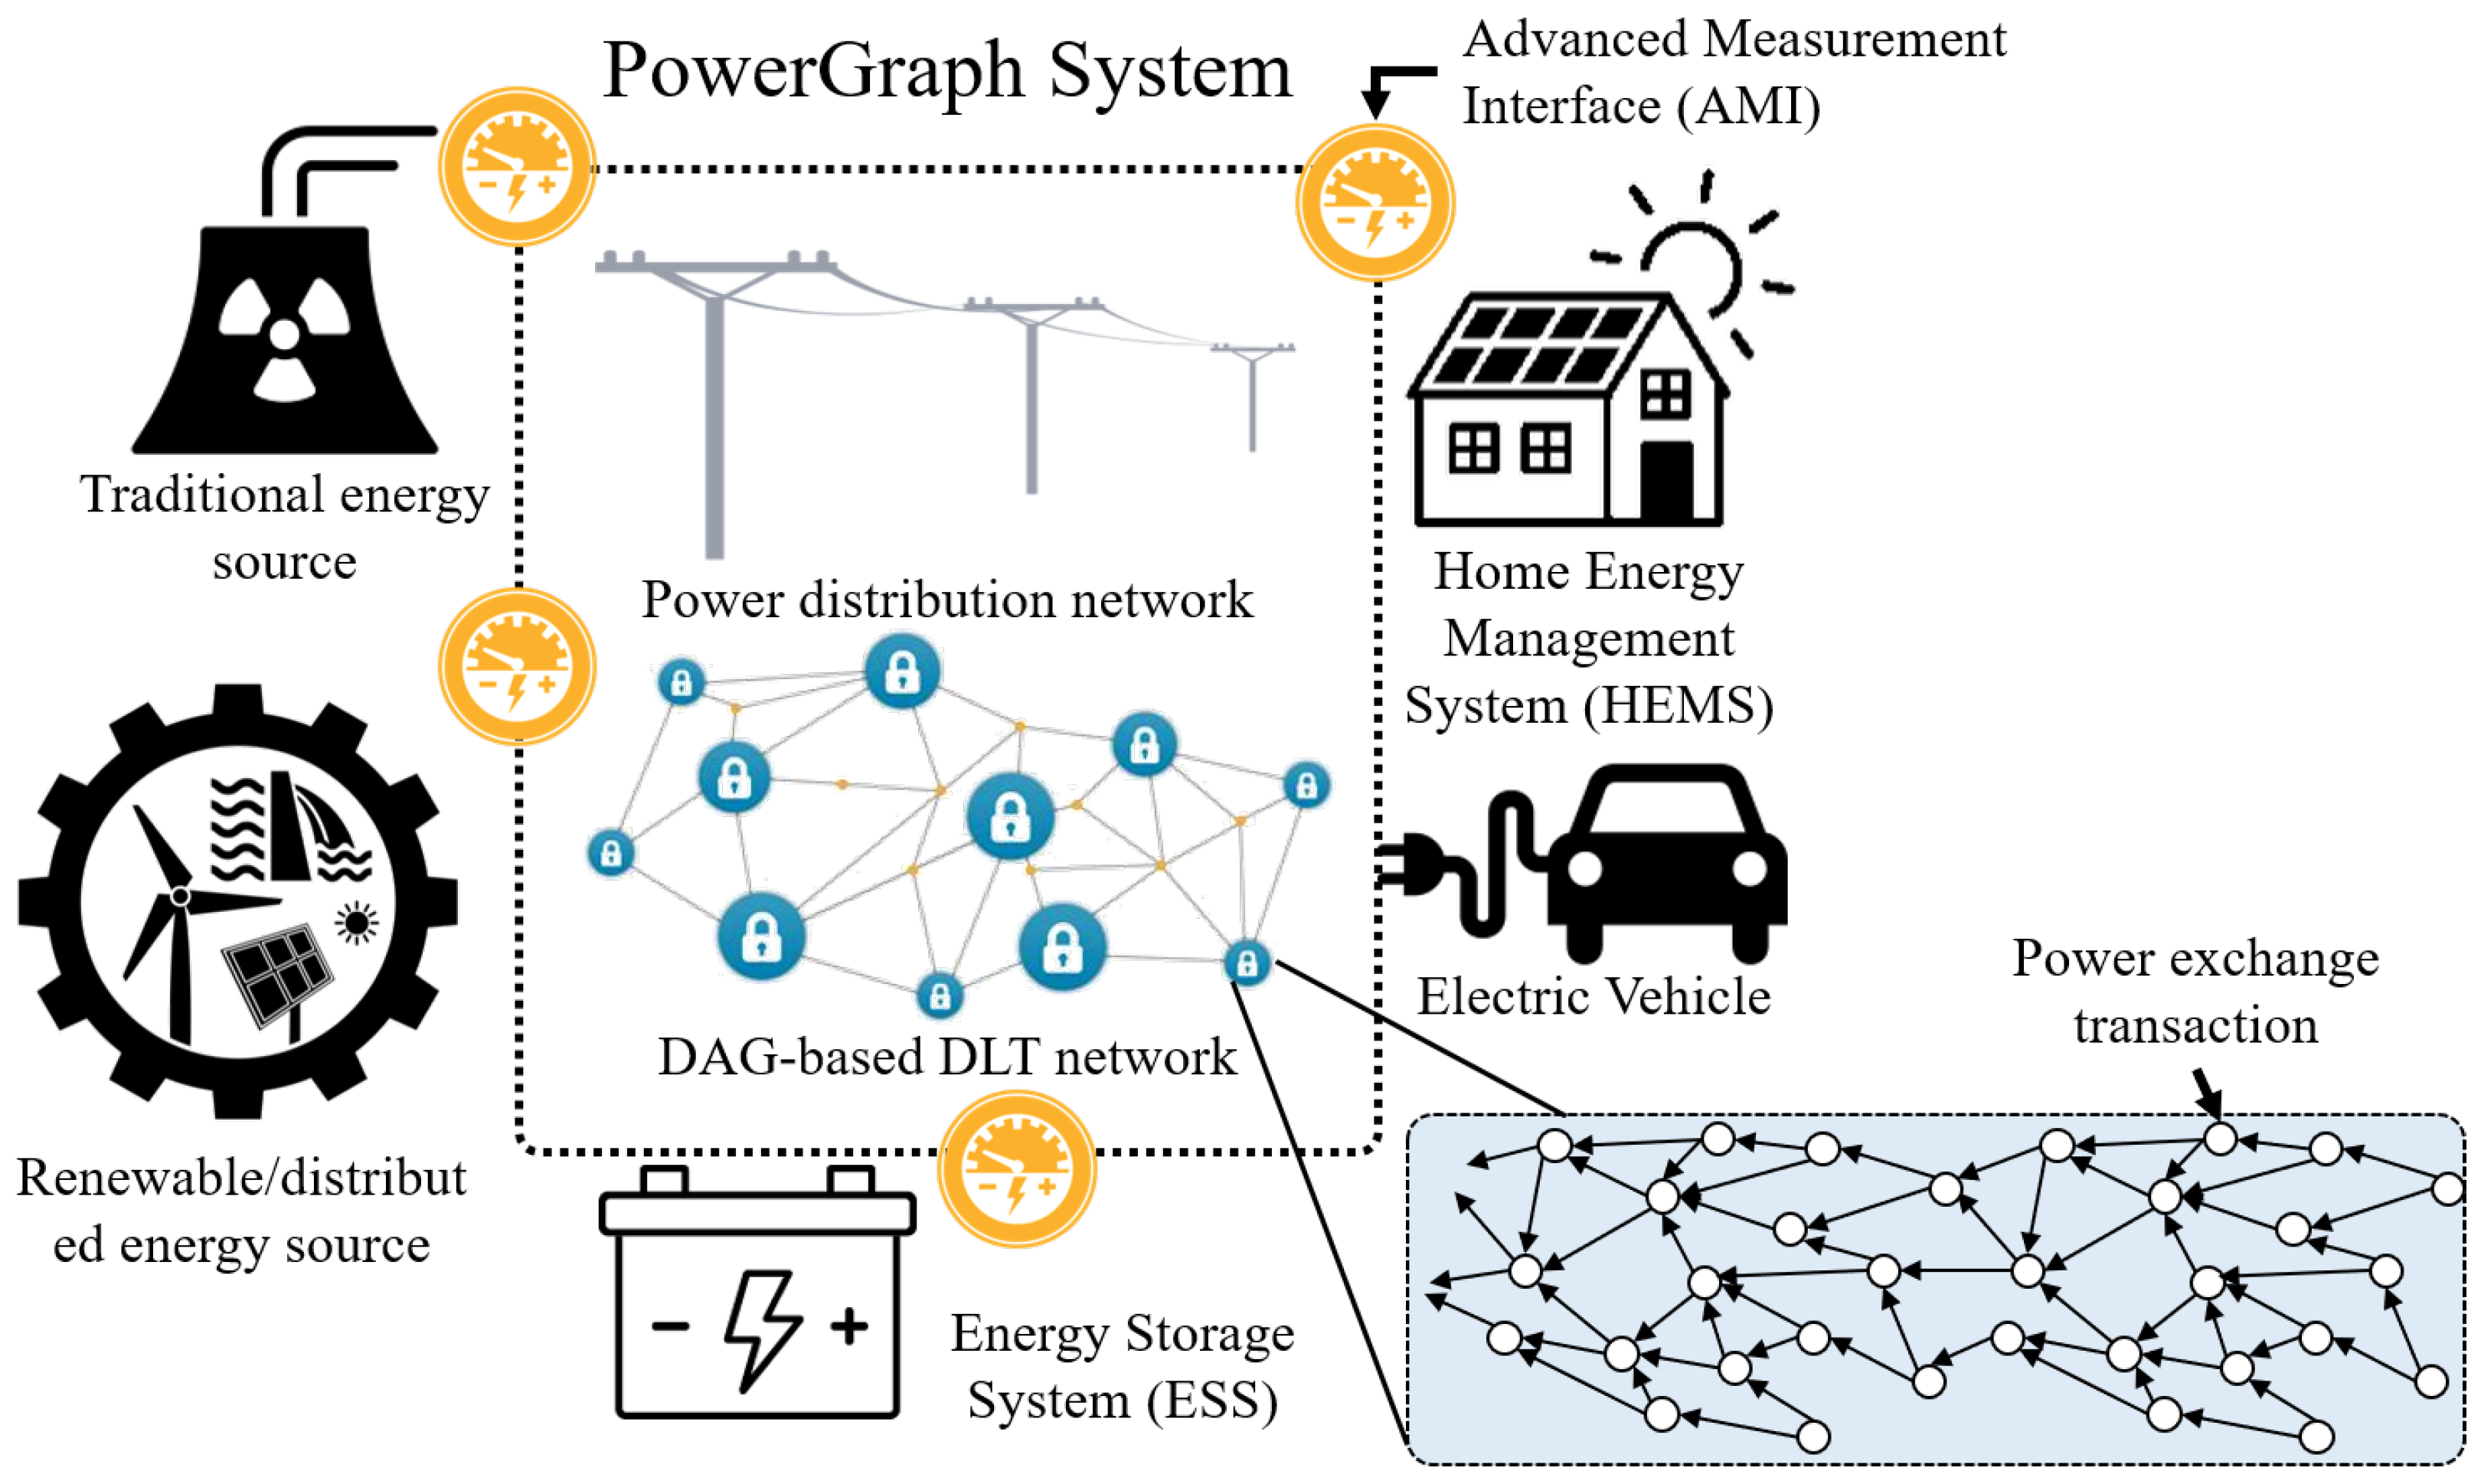
2. PowerGraph Design
2.1. Difference from the Cryptocurrency Exchange
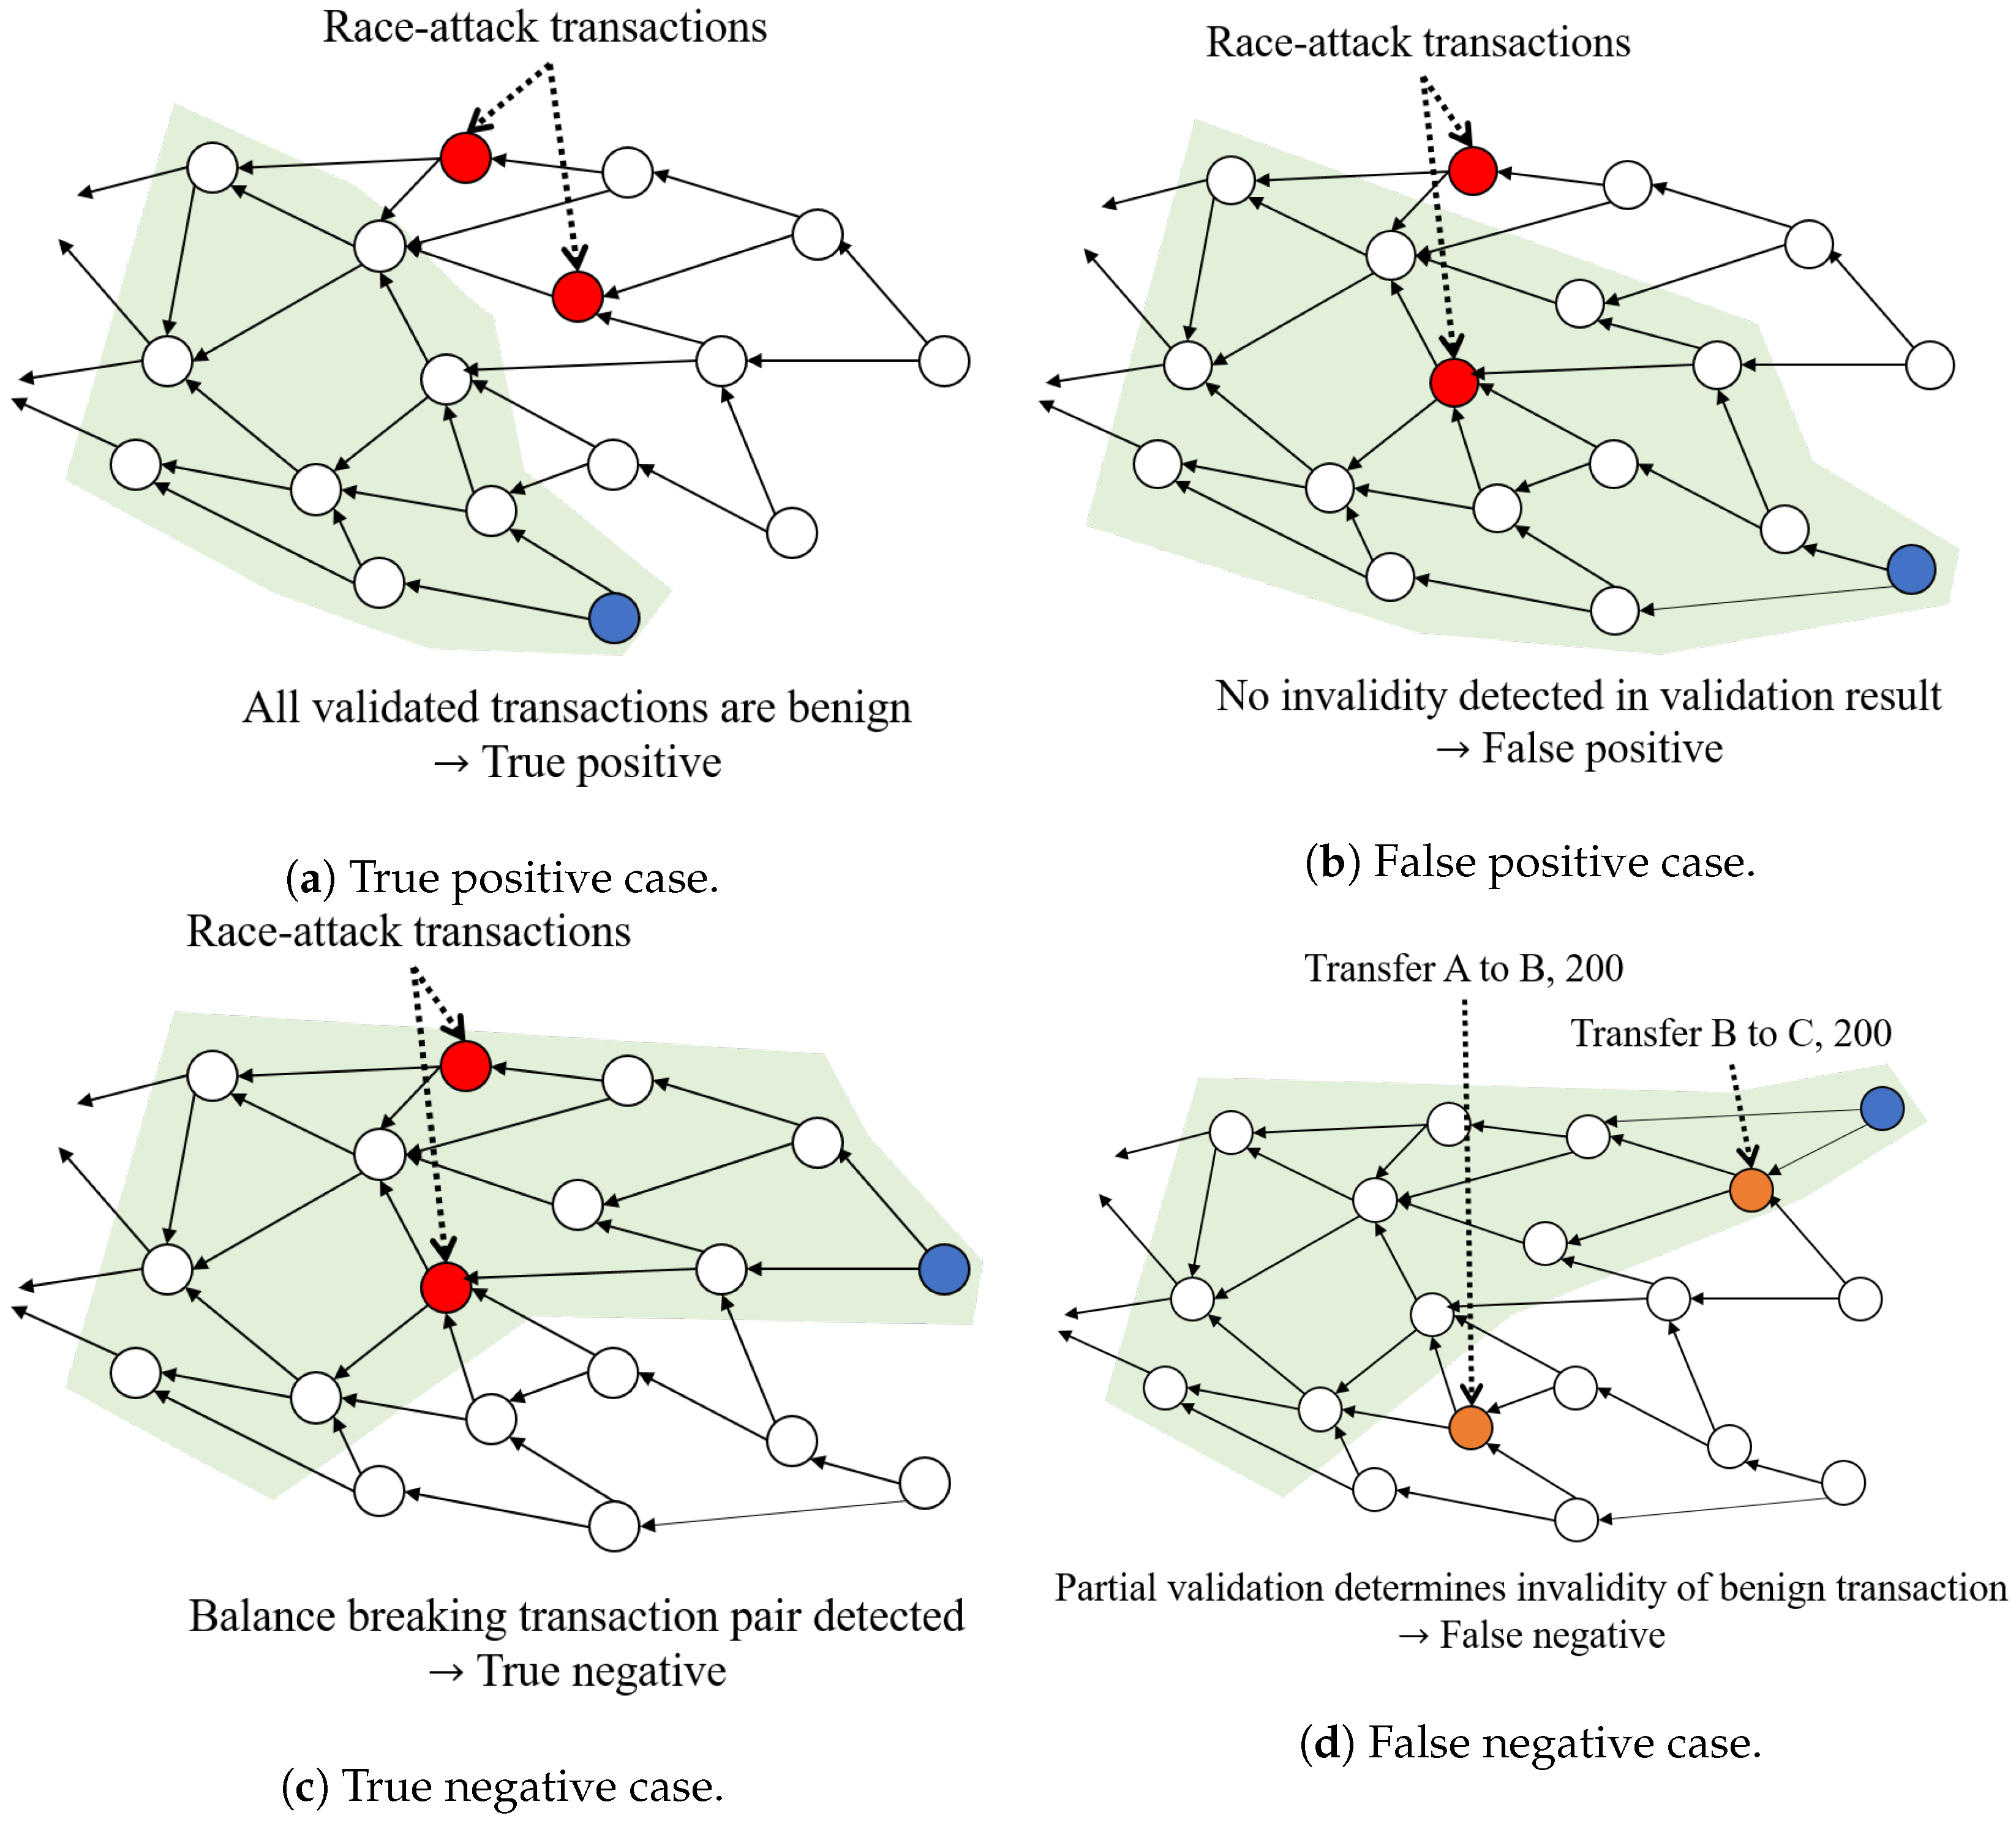
- Measured resource: The resources generated and exchanged in a Smart Grid are based on measurements obtained by AMIs, which are attached at the Smart Grid system. In other words, only the measurement results define the actual transactions of power exchanges. Conversely, AMI measurements prove the true power delivery, so the transaction validation process can exploit these measurements to decrease the overhead. PowerGraph cross-validates the measurements to detect the malicious transactions, such as double-spending or reduced payment in transaction.
- Continuous exchange: Power distribution is a continuous procedure, while transactions are defined as discrete. An ideal Smart Grid aims to dynamically manage a power source to enhance the power quality and prevent the blackouts caused by power overloads. To track the customers’ power usage, the Smart Grid network should periodically issue the transactions for the power measurements varied by the power distribution. This observation leads to the conclusion that issuing transactions more frequently will improve the Smart Grid’s accuracy. We analyzed the performance model of PowerGraph, considering the power transaction issuance cycle.
- Complex validation: Smart Grid network should validate both the transaction of the cryptocurrency and the power distribution. To confirm the power exchange, the transaction should include the power amount the customer received, as well as the cryptocurrency amount that the customer transferred. PowerGraph proposes a novel method of validating the Smart Grid transaction that covers several types of transaction used in the network.
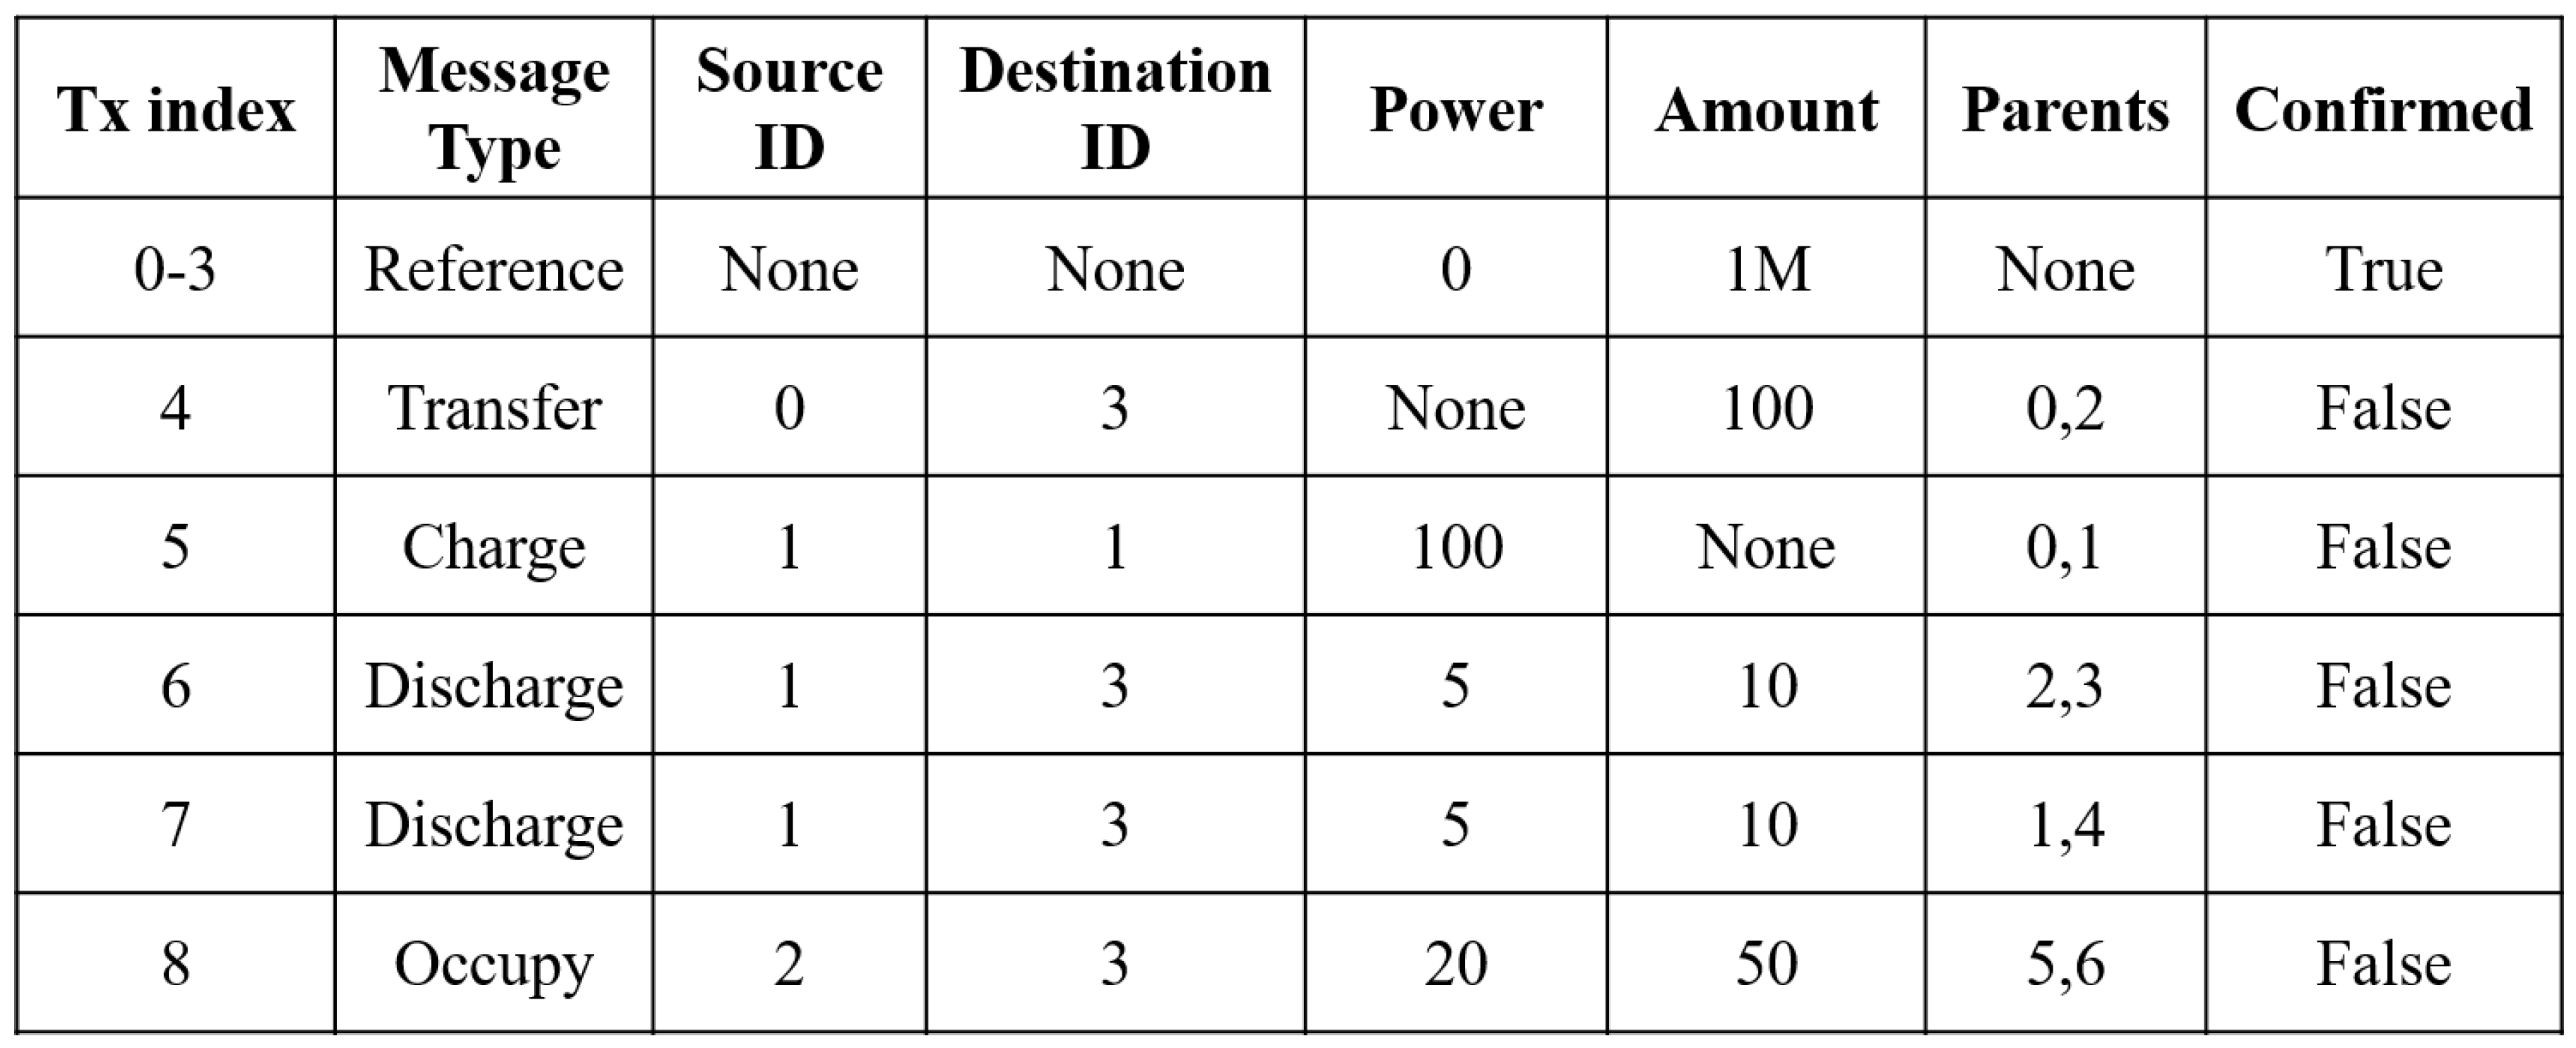
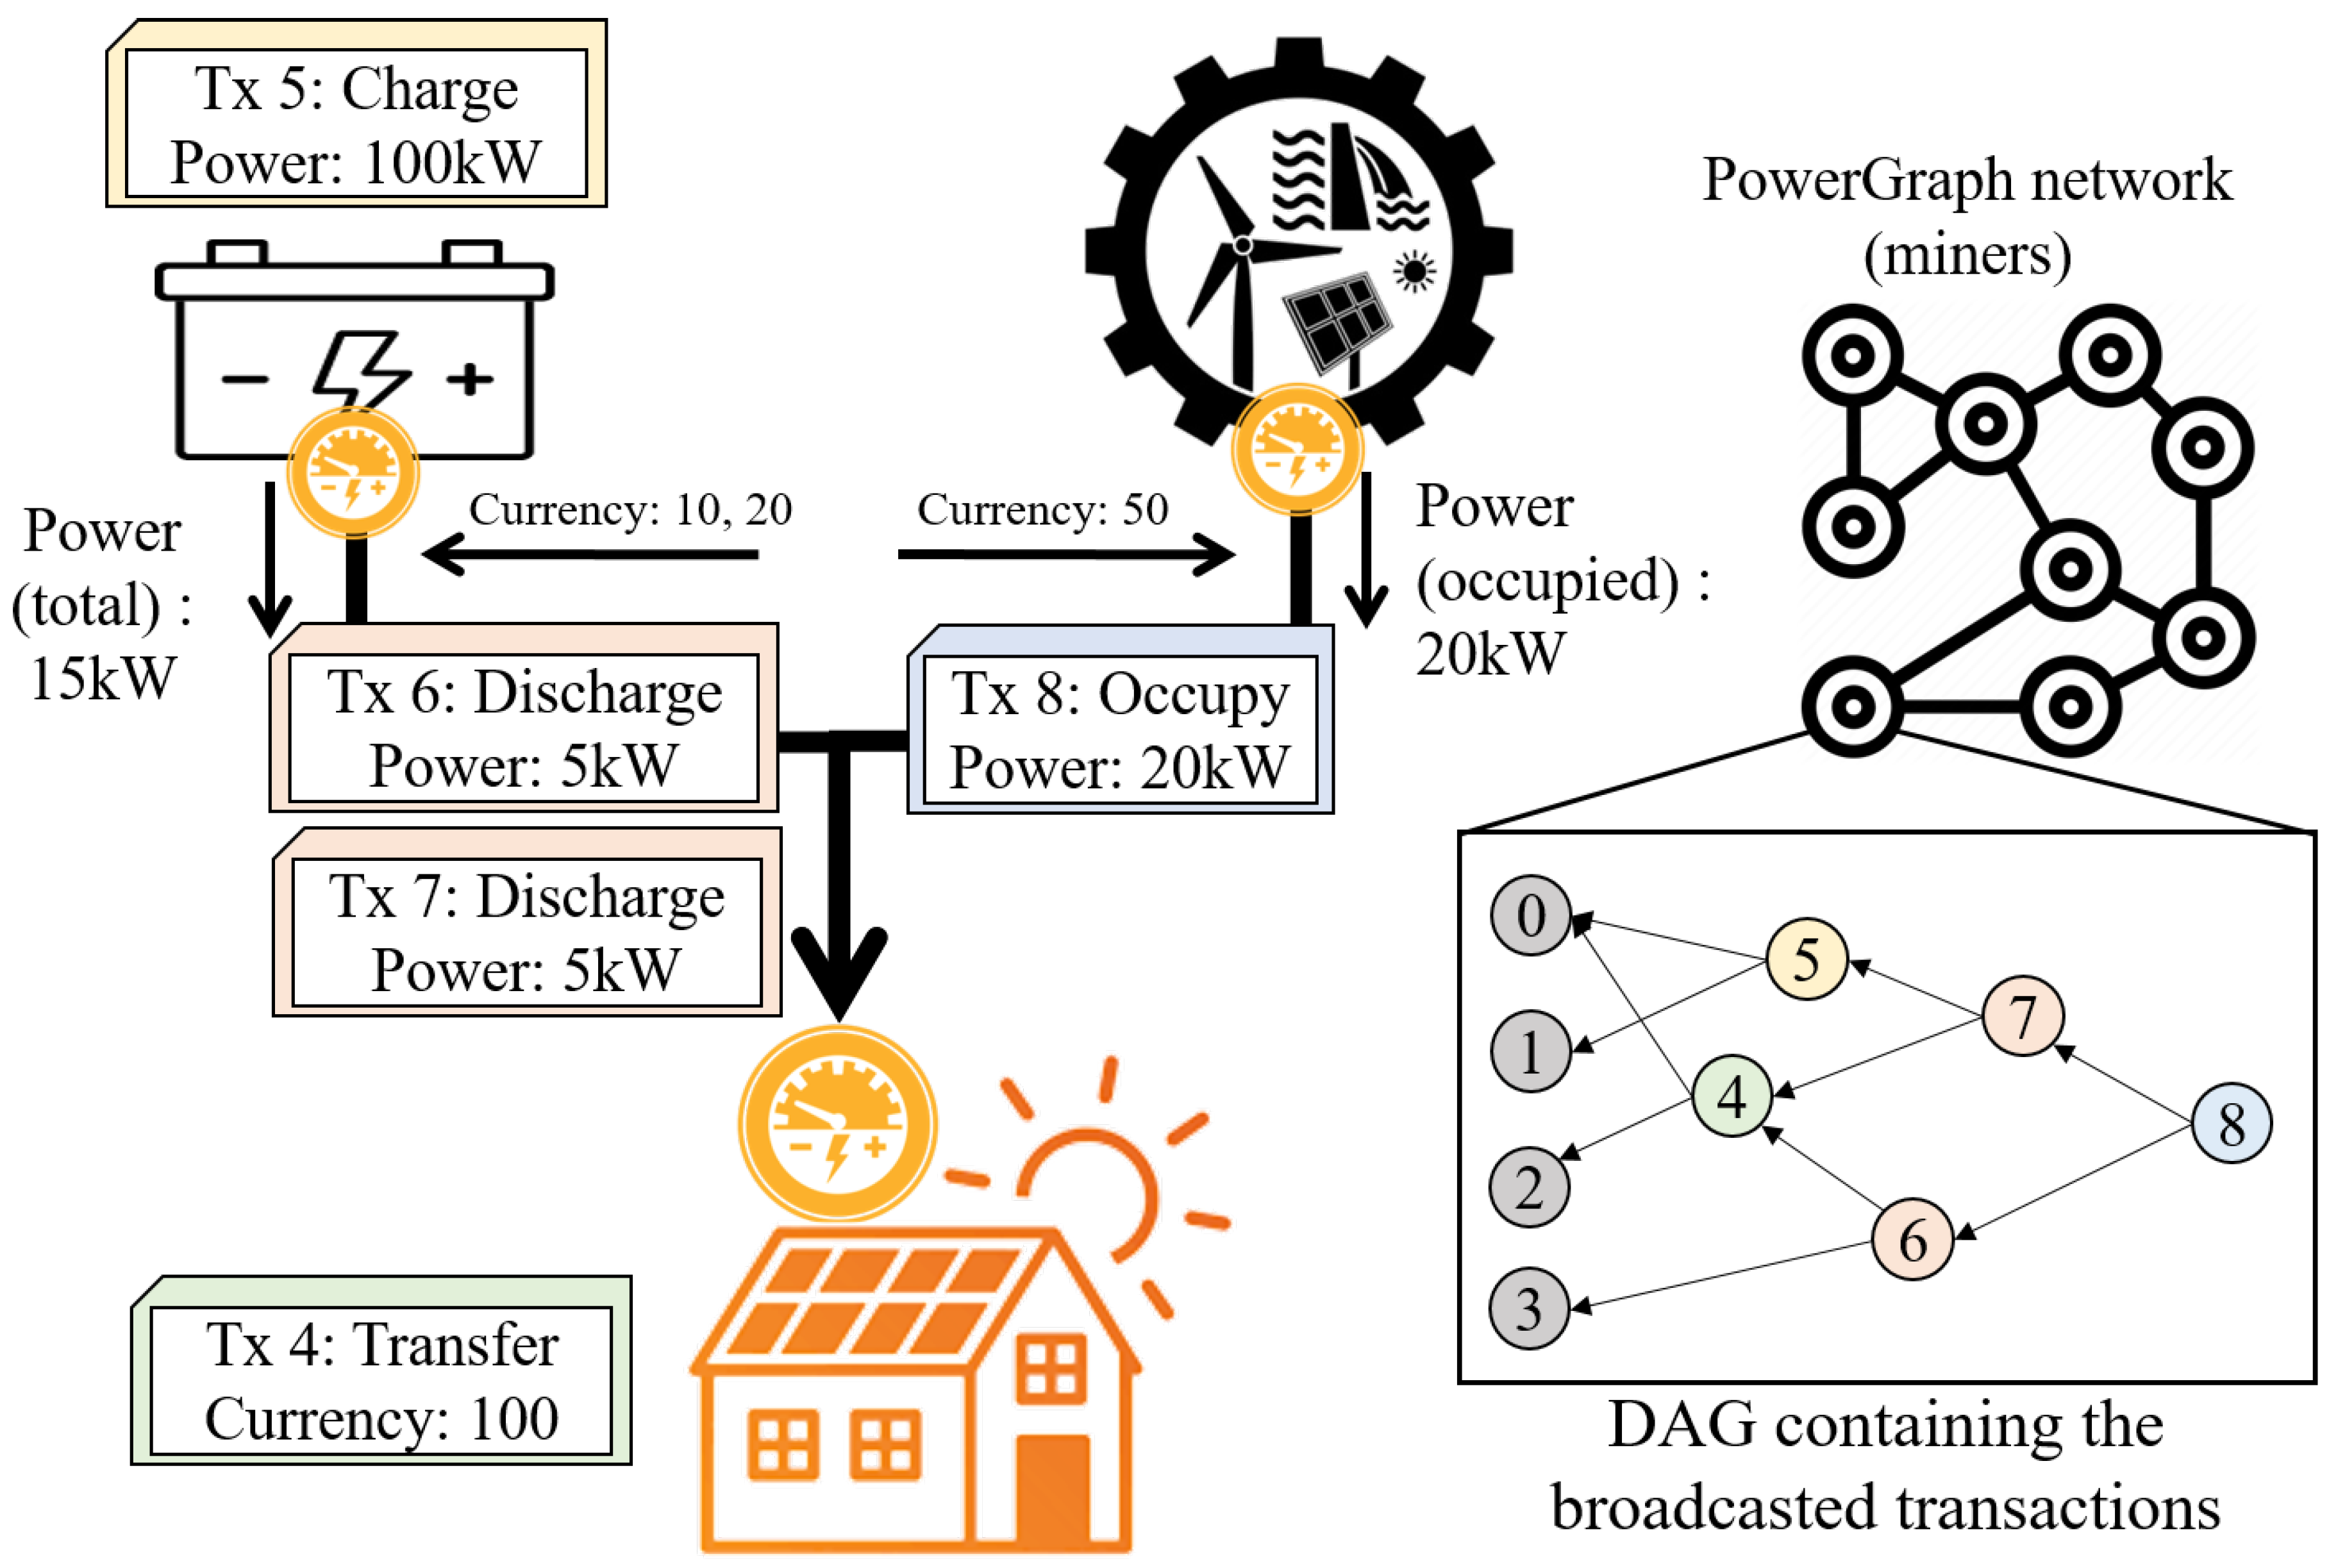
2.2. Transaction Types
2.2.1. Charge
2.2.2. Discharge
2.2.3. Occupy
2.2.4. Transfer
2.2.5. Reference
2.3. PowerGraph Procedure
2.3.1. PowerGraph Transactions
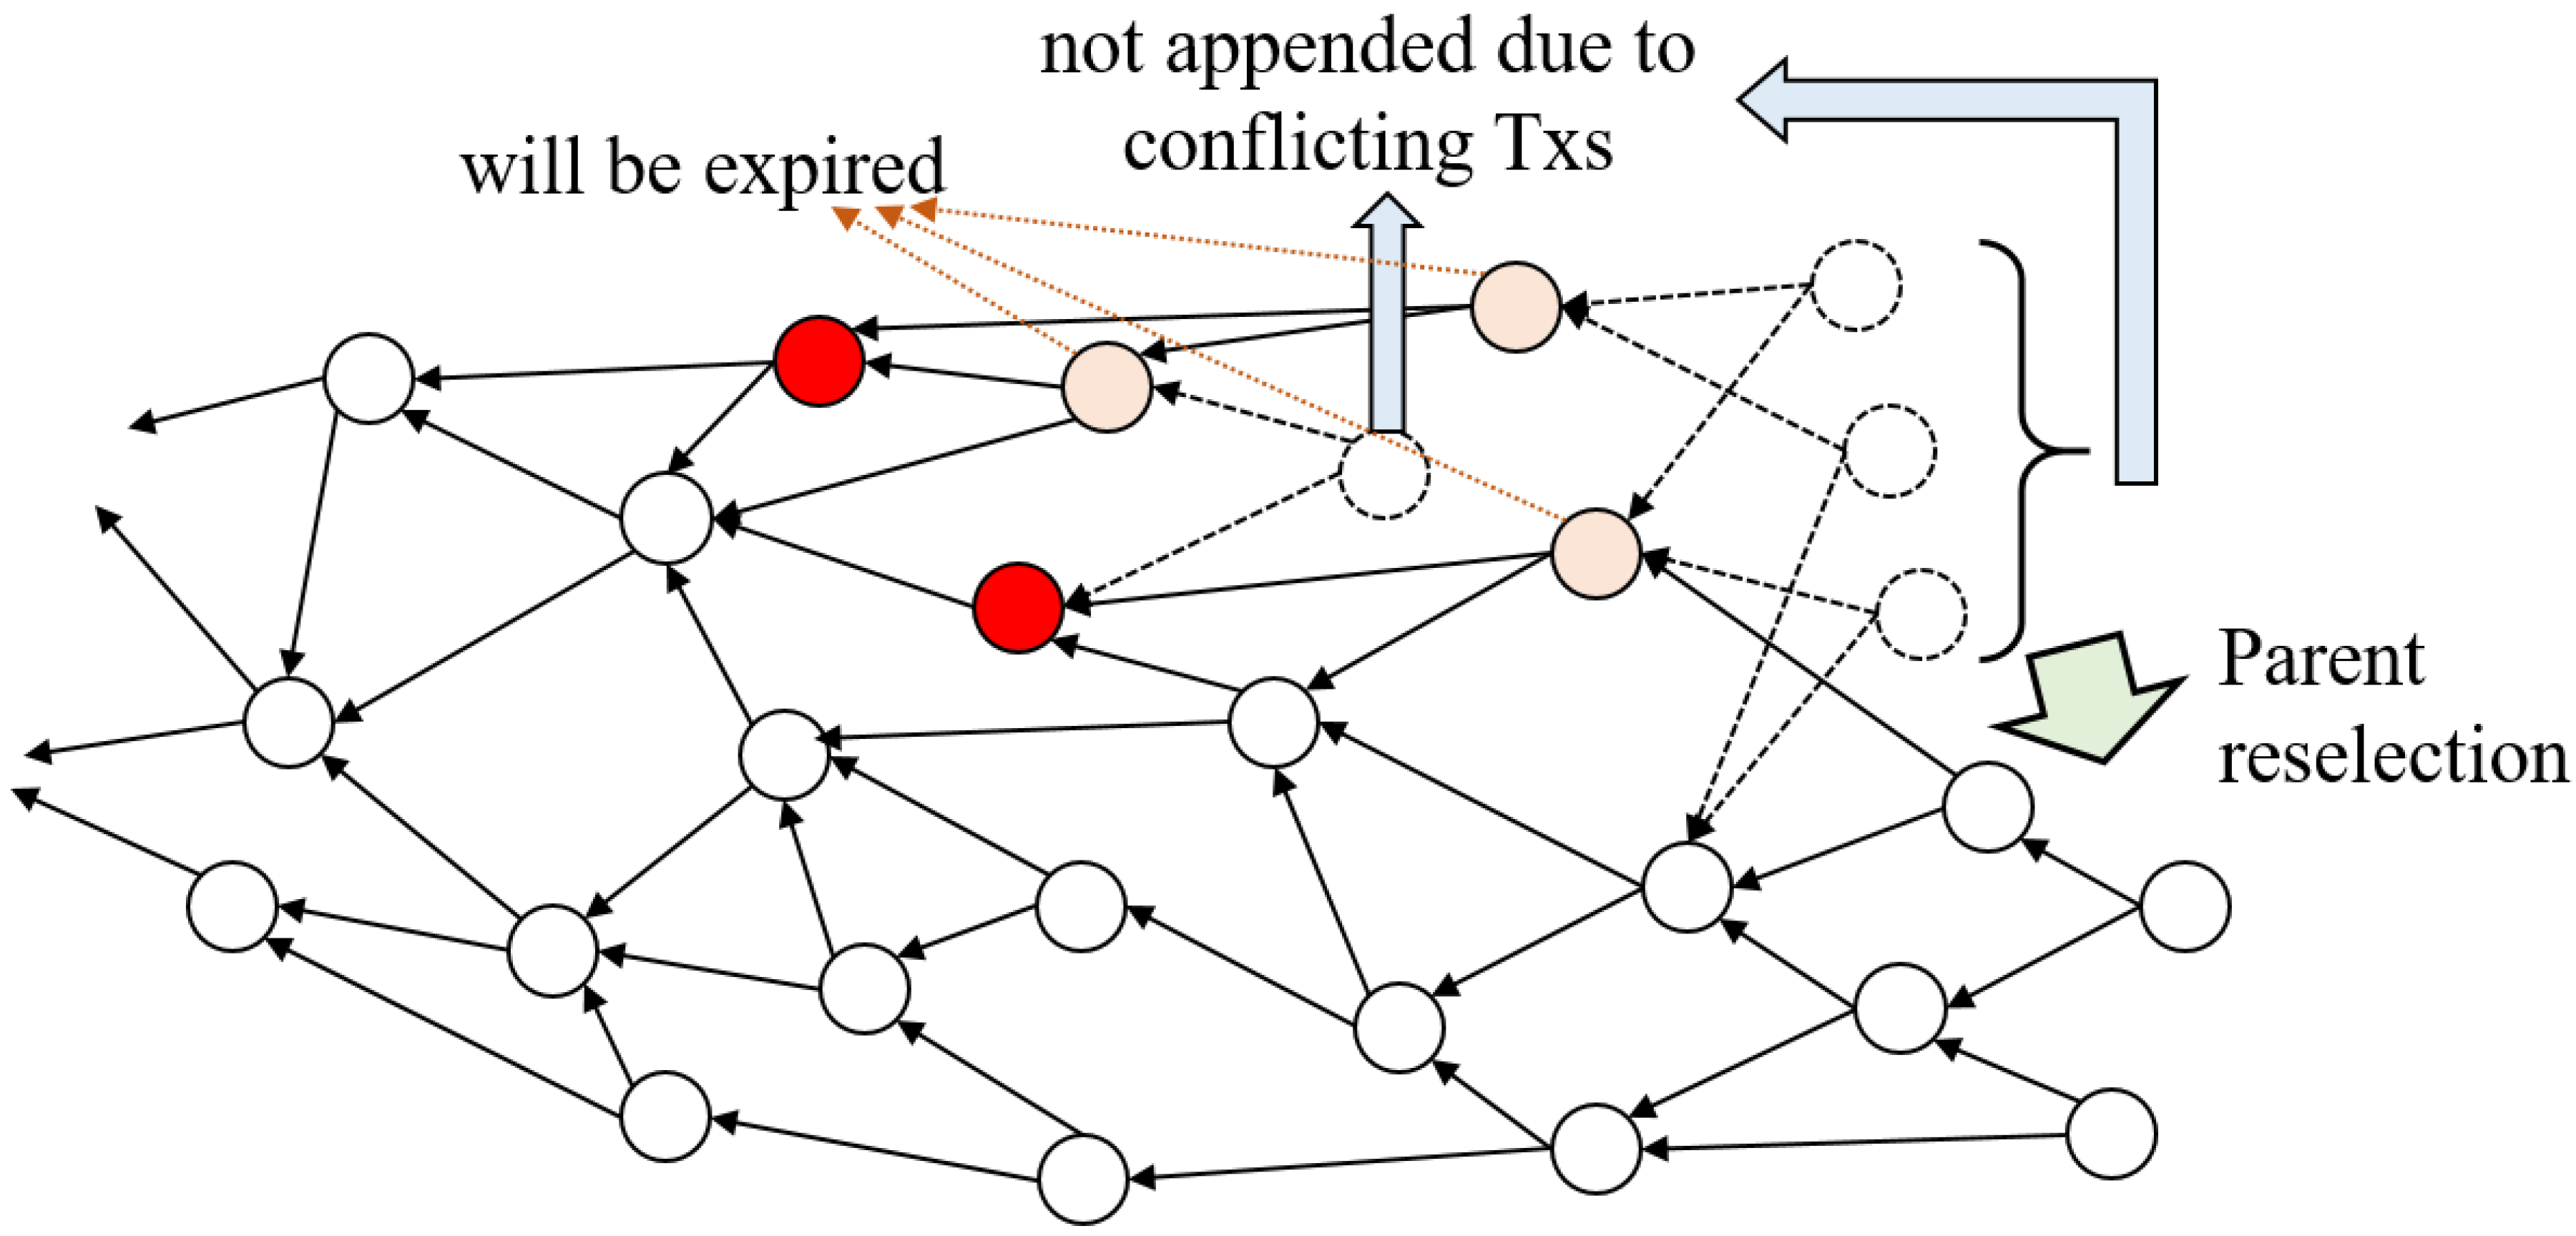
2.3.2. DAG-Based DLT Structure
2.3.3. PowerGraph Consensus
| Algorithm 1. PowerGraph consensus algorithm. |
|
3. Evaluation
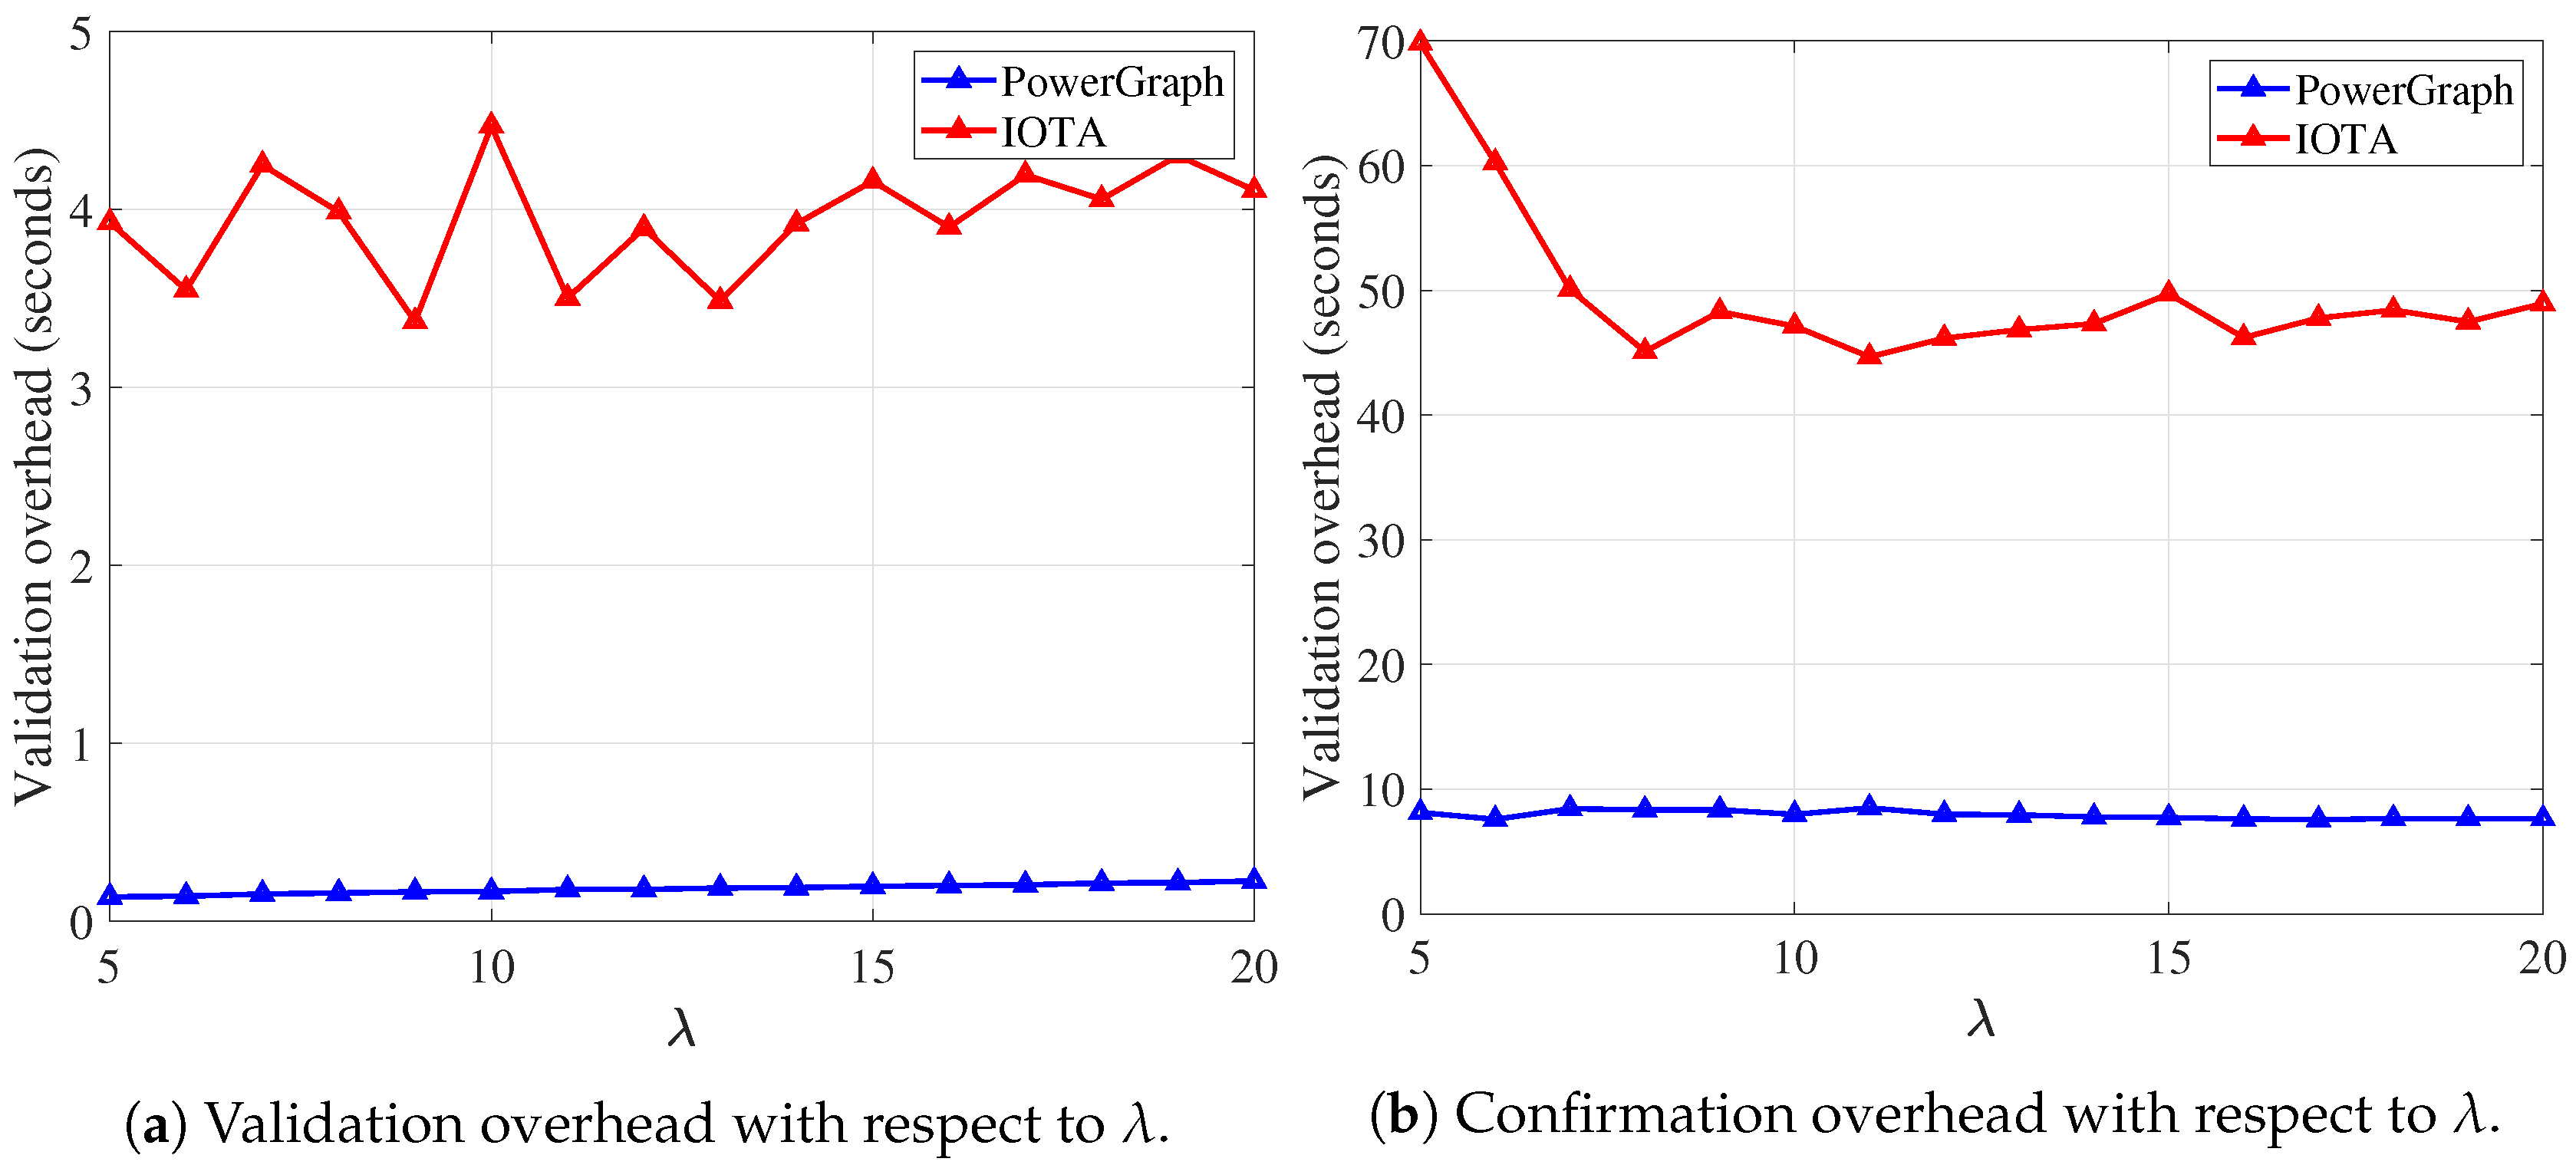
- Smart Grid scenario setup: We input the transaction incoming rate , and the probability of the double-spending transaction issuance as the parameters. The arrival of the transaction follows the Poisson distribution with , and each transaction is validated by a randomly selected miner. Please note that the power distribution continuously occurs, but the transaction generation discretely occurs. If the transaction issuance cycle per a power distribution is t sec, then represents the expected number of the power distribution lines in a Smart Grid system. We varied the , and to examine the PowerGraph in different environments of the Smart Grid system in Section 3.2 and Section 3.1, respectively.
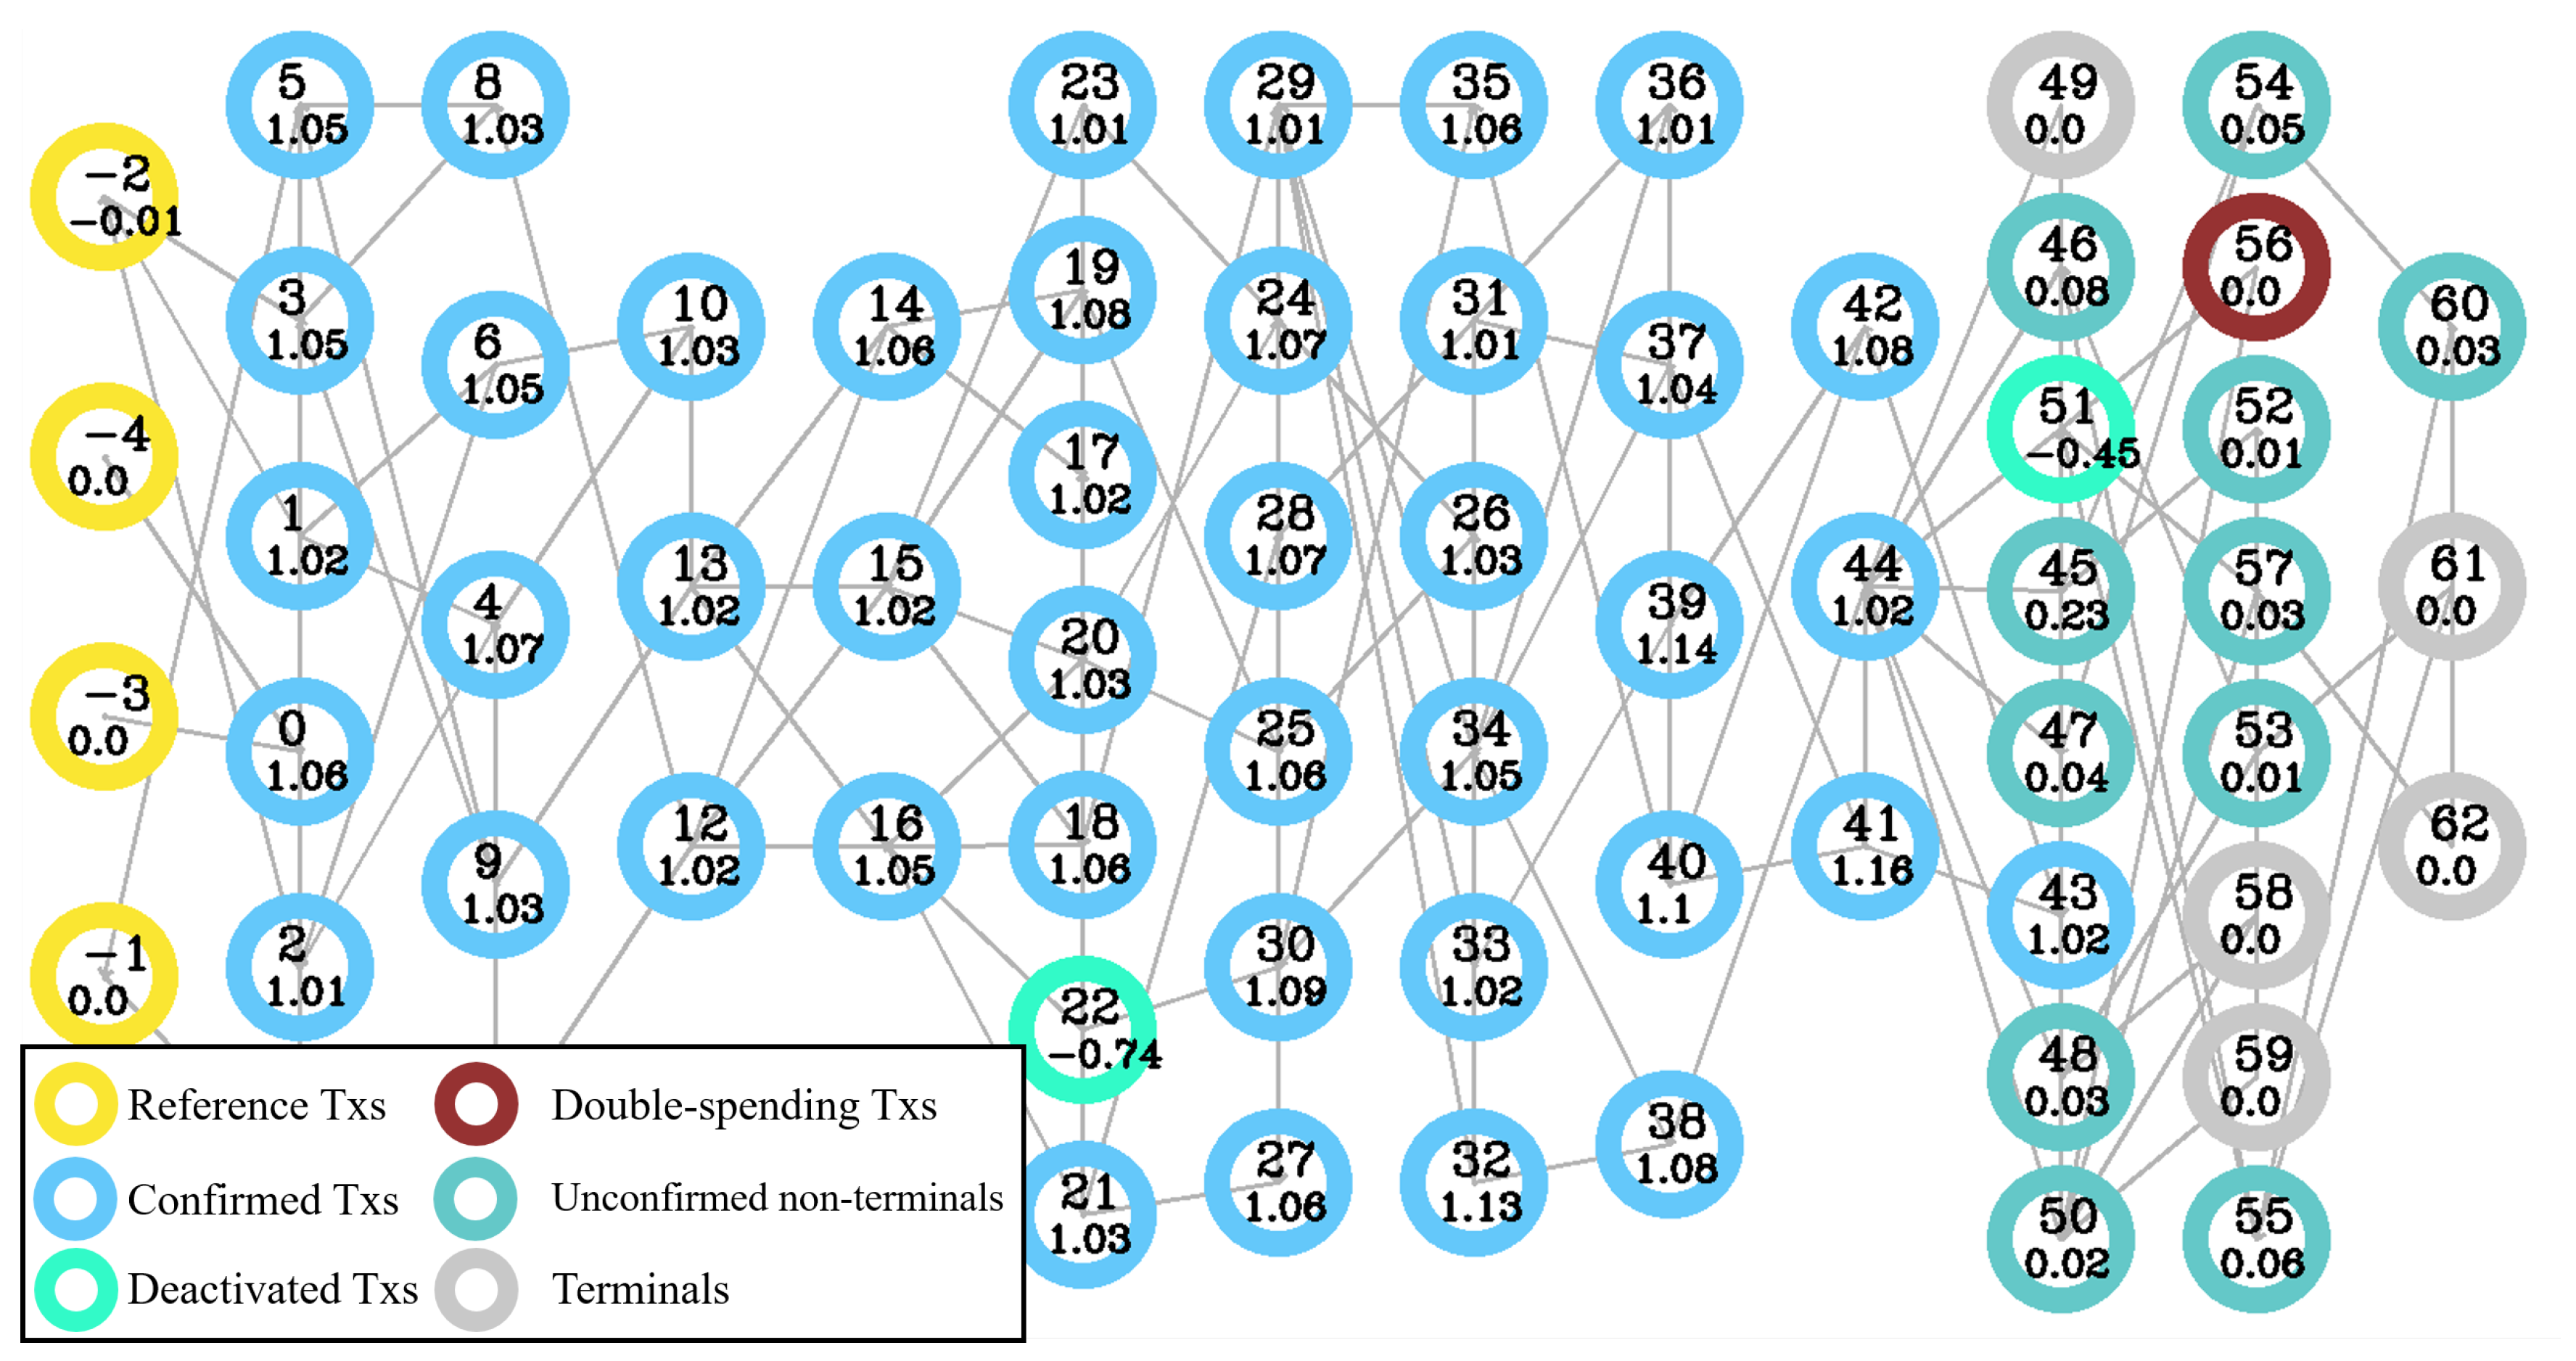
- PowerGraph operation: We implemented the DAG-shaped database for each miner, and the transactions are randomly assigned to a miner for validation. After the validation of a transaction, validation result is broadcast to the validation network, and the other miners update the transaction after a certain network delay. Each miner changes the SCC of each transaction in its own validation processes, and determines the validity of the transaction when the SCC reaches to a certain threshold, or 1.
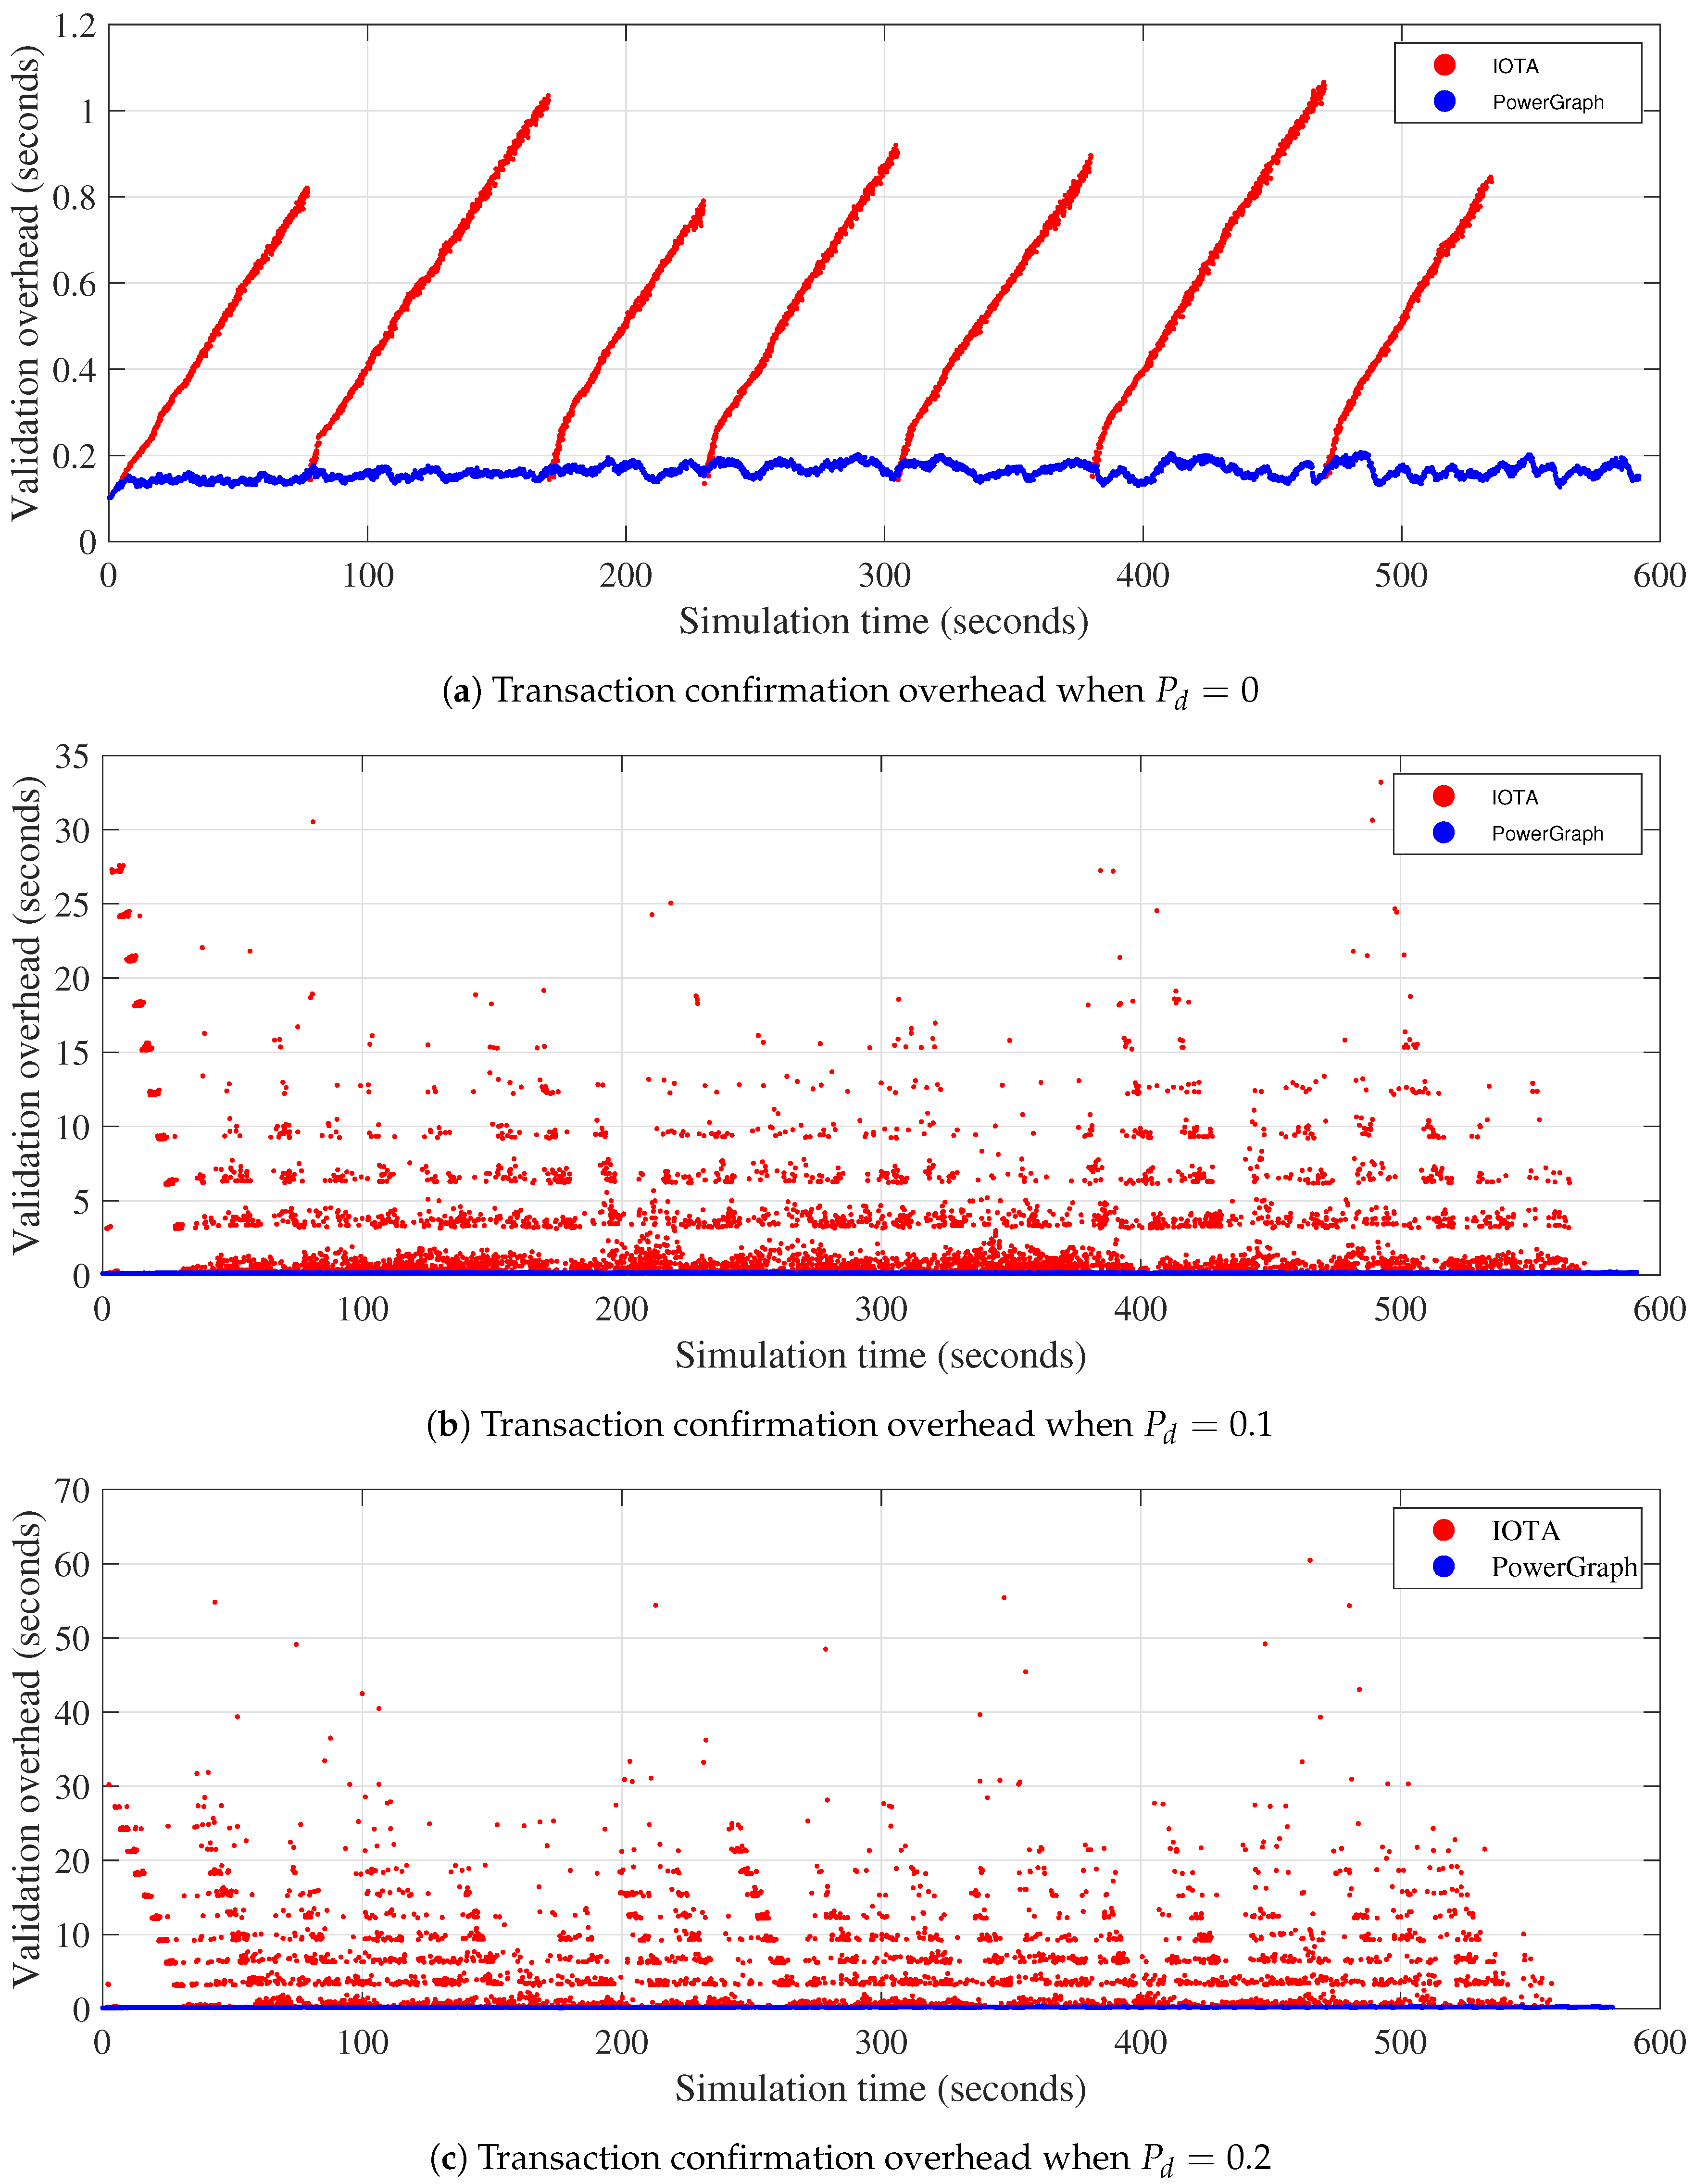
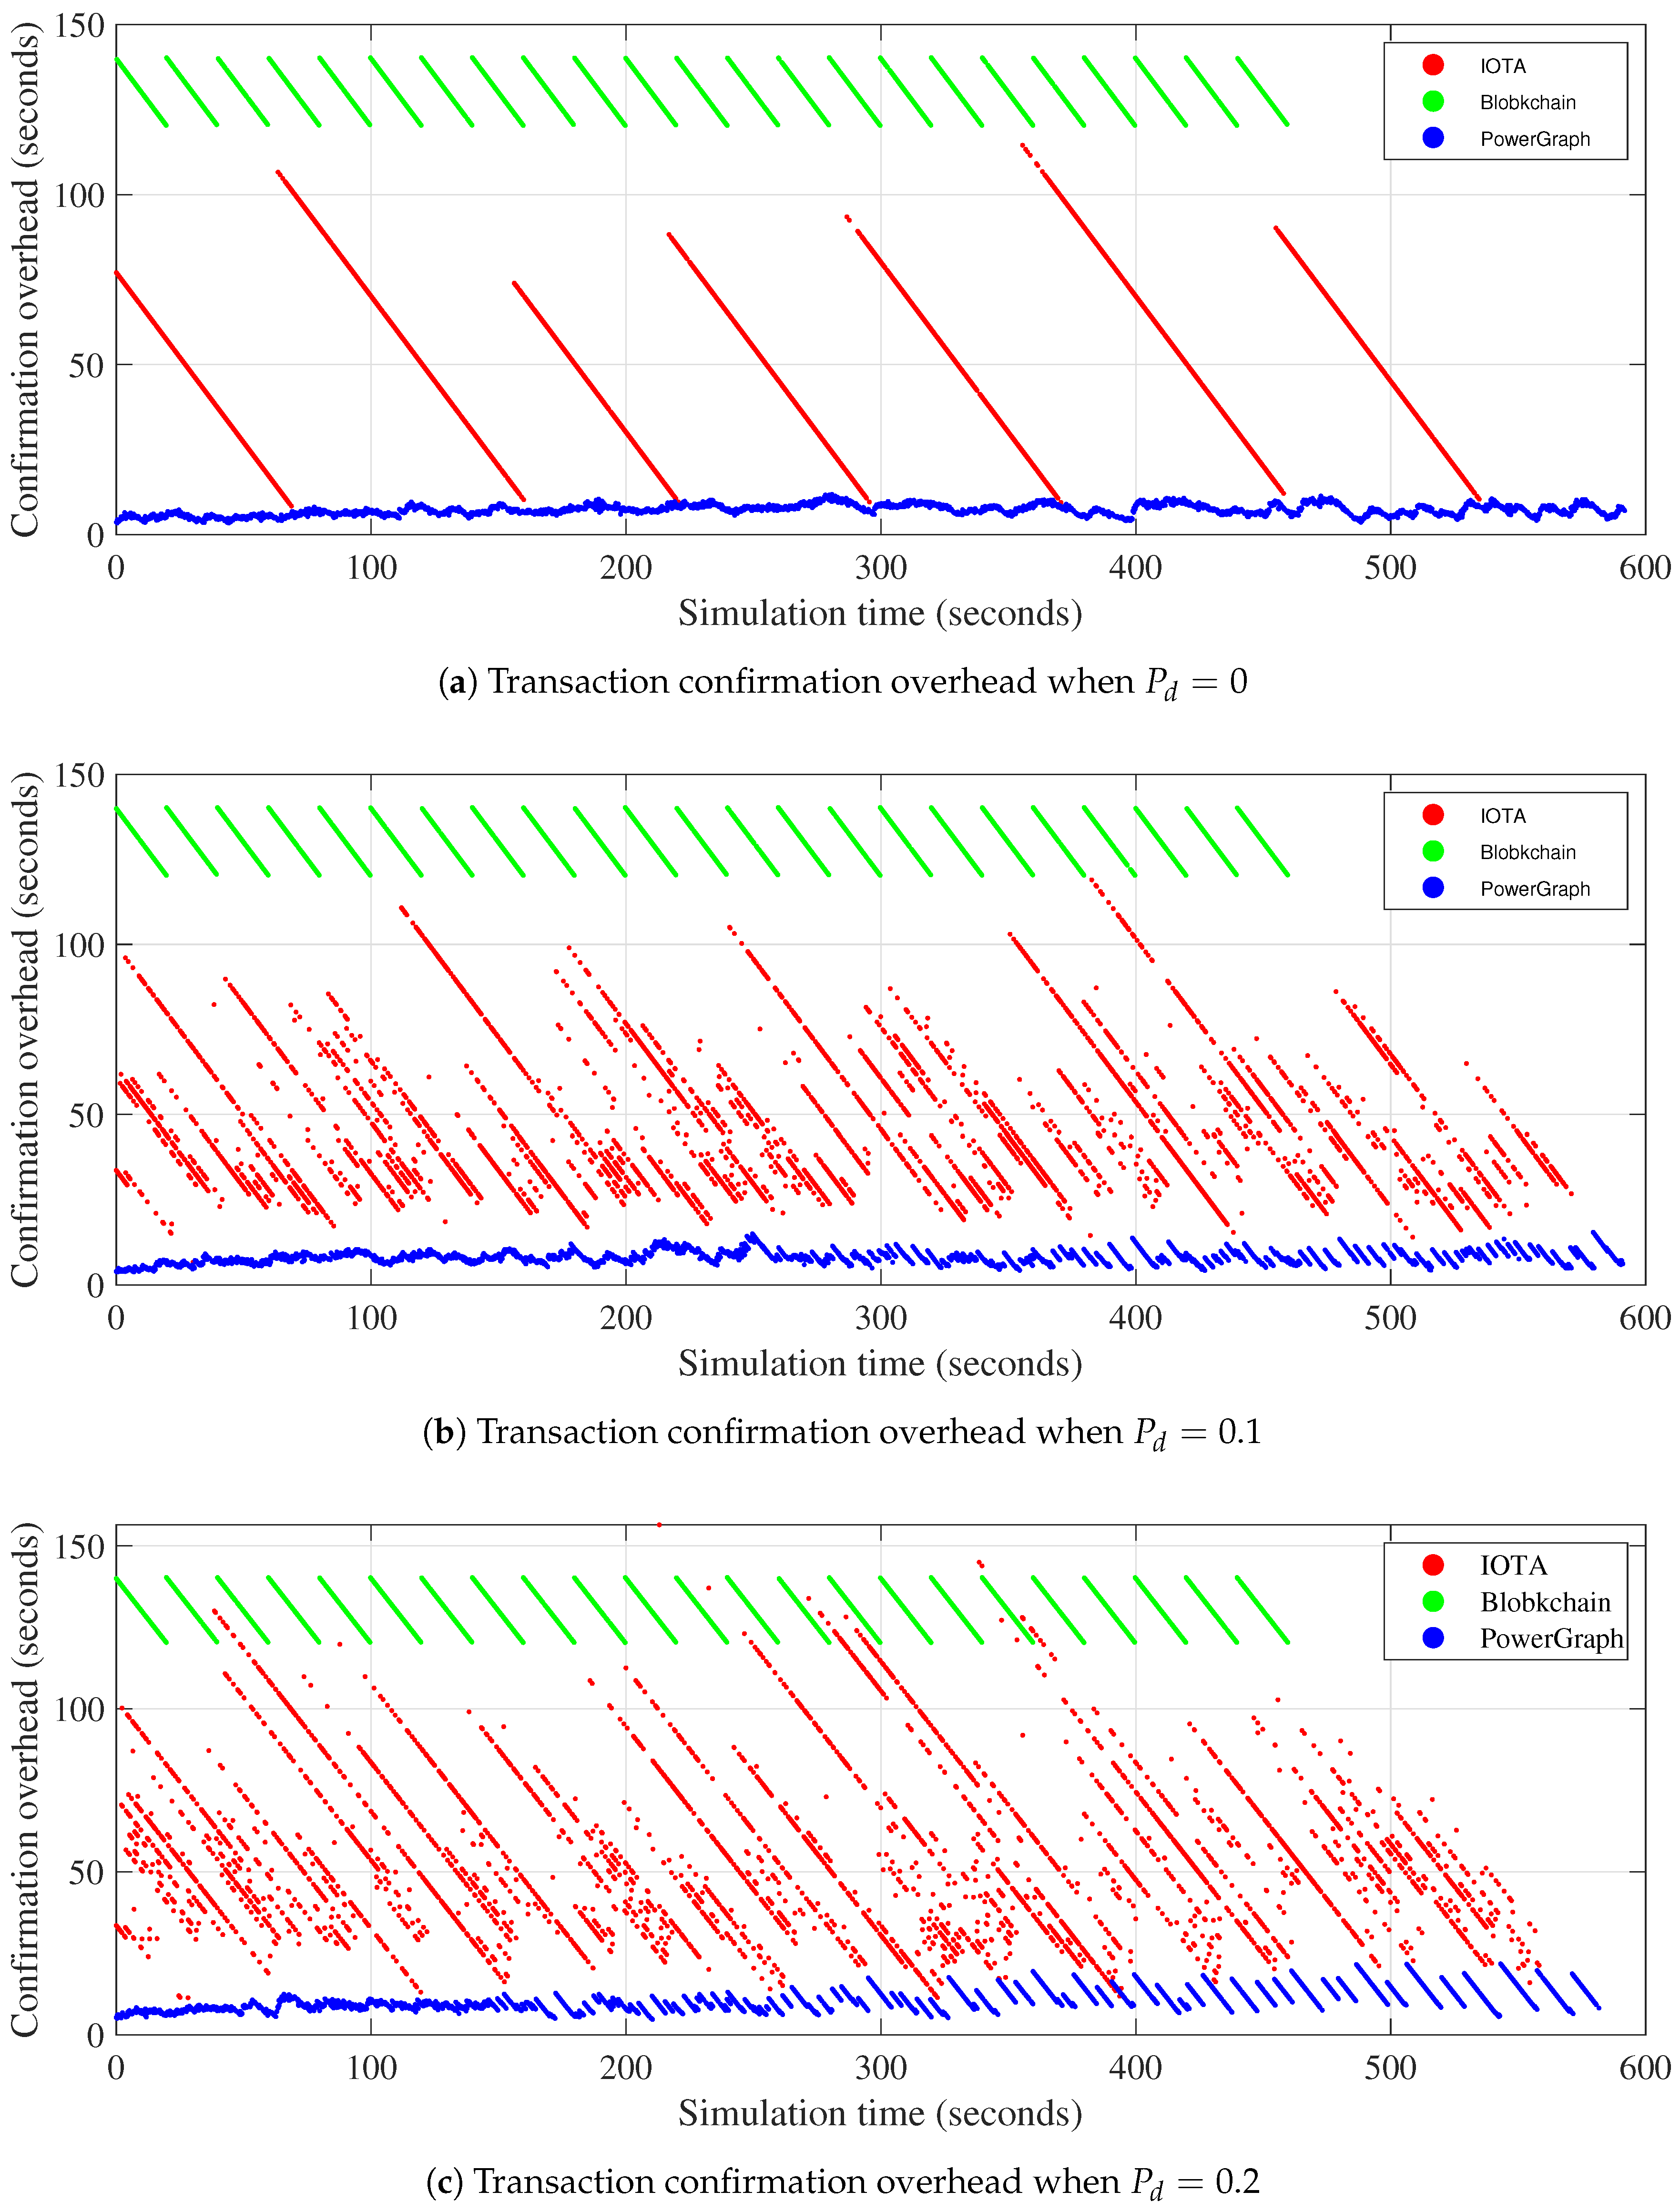
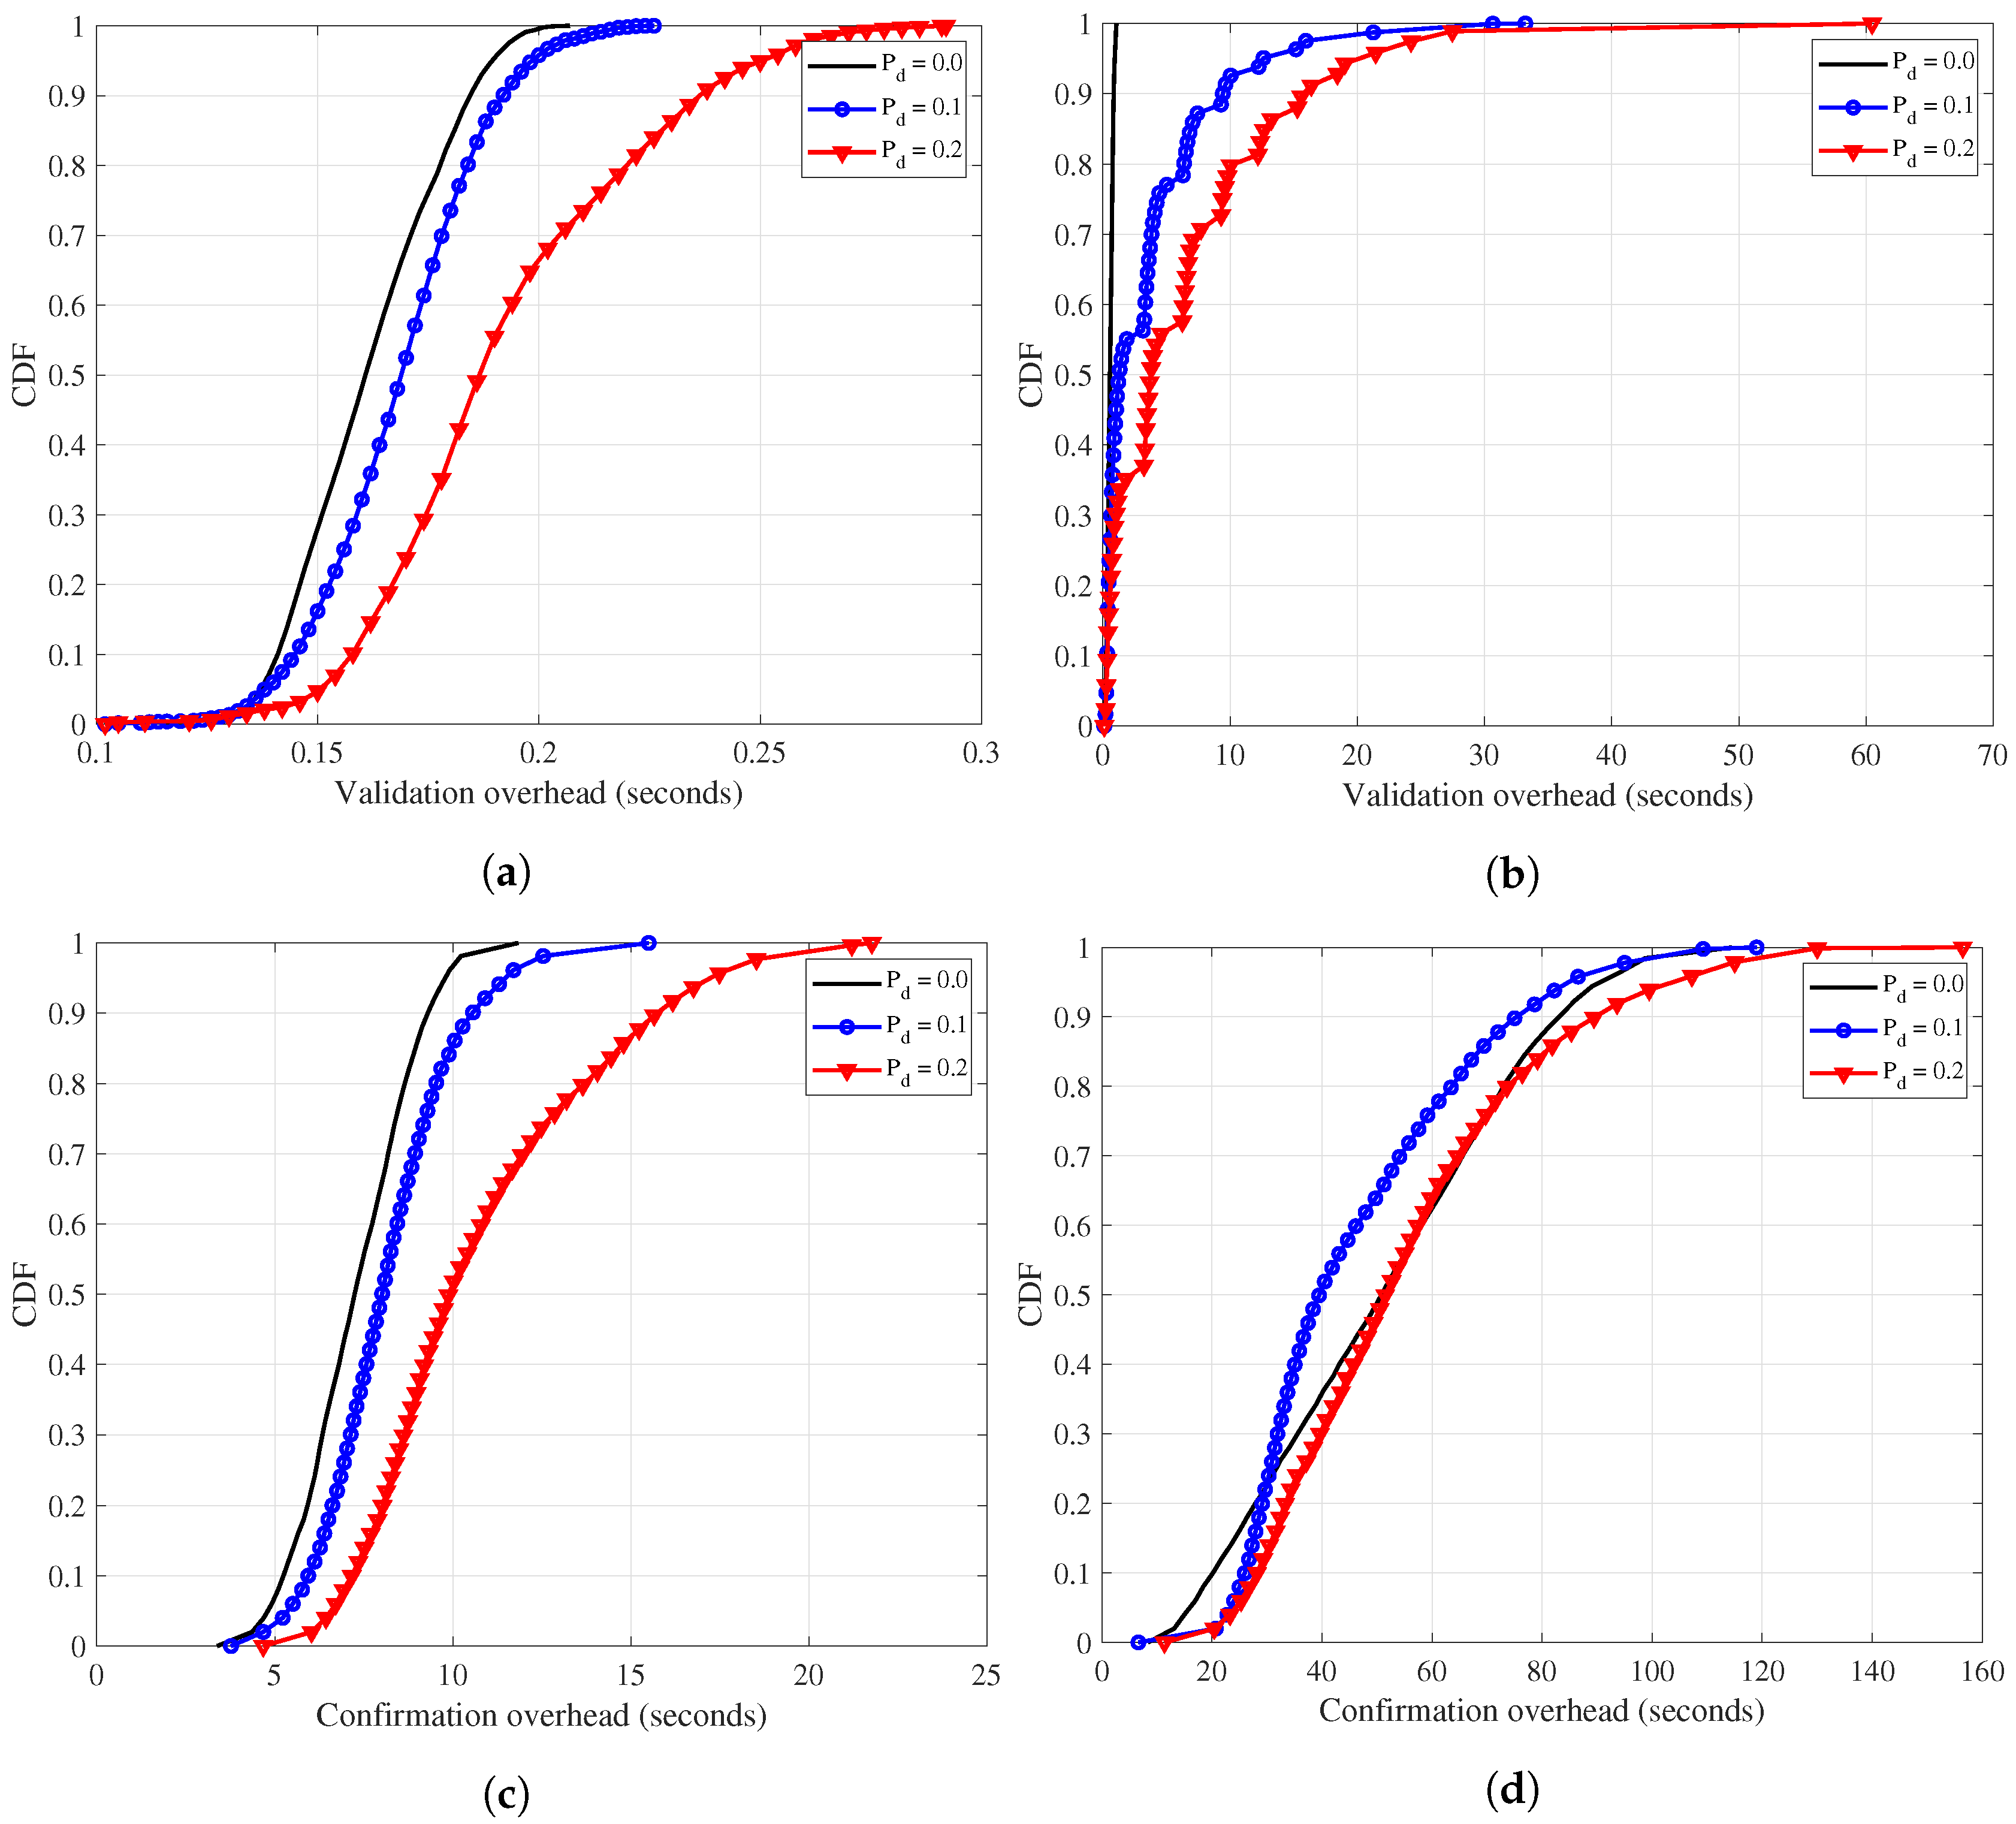
- Data measurement and collection: We ran the simulation and collected each transaction’s validation overhead, , and confirmation overhead, . We defined the validation overhead as the time interval from the arrival of the transaction to the start of broadcast to the network. Meanwhile, we defined the confirmation overhead as the time interval from the arrival of the transaction to the first decision of the transaction as confirmed or deactivated, which can be regarded as transaction finalization time. While varying the environmental parameters, we plotted the and on the domain of the transaction arrival time, or the average of them on the domain of the parameters.
- Comparison groups: To compare the performance of PowerGraph with the other DLTs, we implemented Blockchain and the IOTA method based on our simulation software. In the case of Blockchain, the validation completion time of the transaction is matching with the block generation time, where the block contains the transaction. Also, following the 6-block confirmation, we set the confirmation completion time of the transaction to the time that the subsequent six blocks are generated after the transaction is validated. Since the Blockchain features a variety of block generation cycles [16], we set the cycle to 20 s. In the case of IOTA, the confirmation by the participants was proposed; however, the foundation-powered nodes called coordinators periodically perform the confirmation process. Since the confirmation cycle of the coordinators are not known, so we set the cycle to 3 s. Also, for preventing the deadlock of the validation discussed in Section 2.3.2, we let the double-spending transactions occur after 60 s. We first generated a set of transactions arrived in a simulation runtime, then ran each implementation along with the PowerGraph to compare the performance in a same input.
3.1. Double-Spending Attack Ratio
3.2. Transaction Incoming Rate
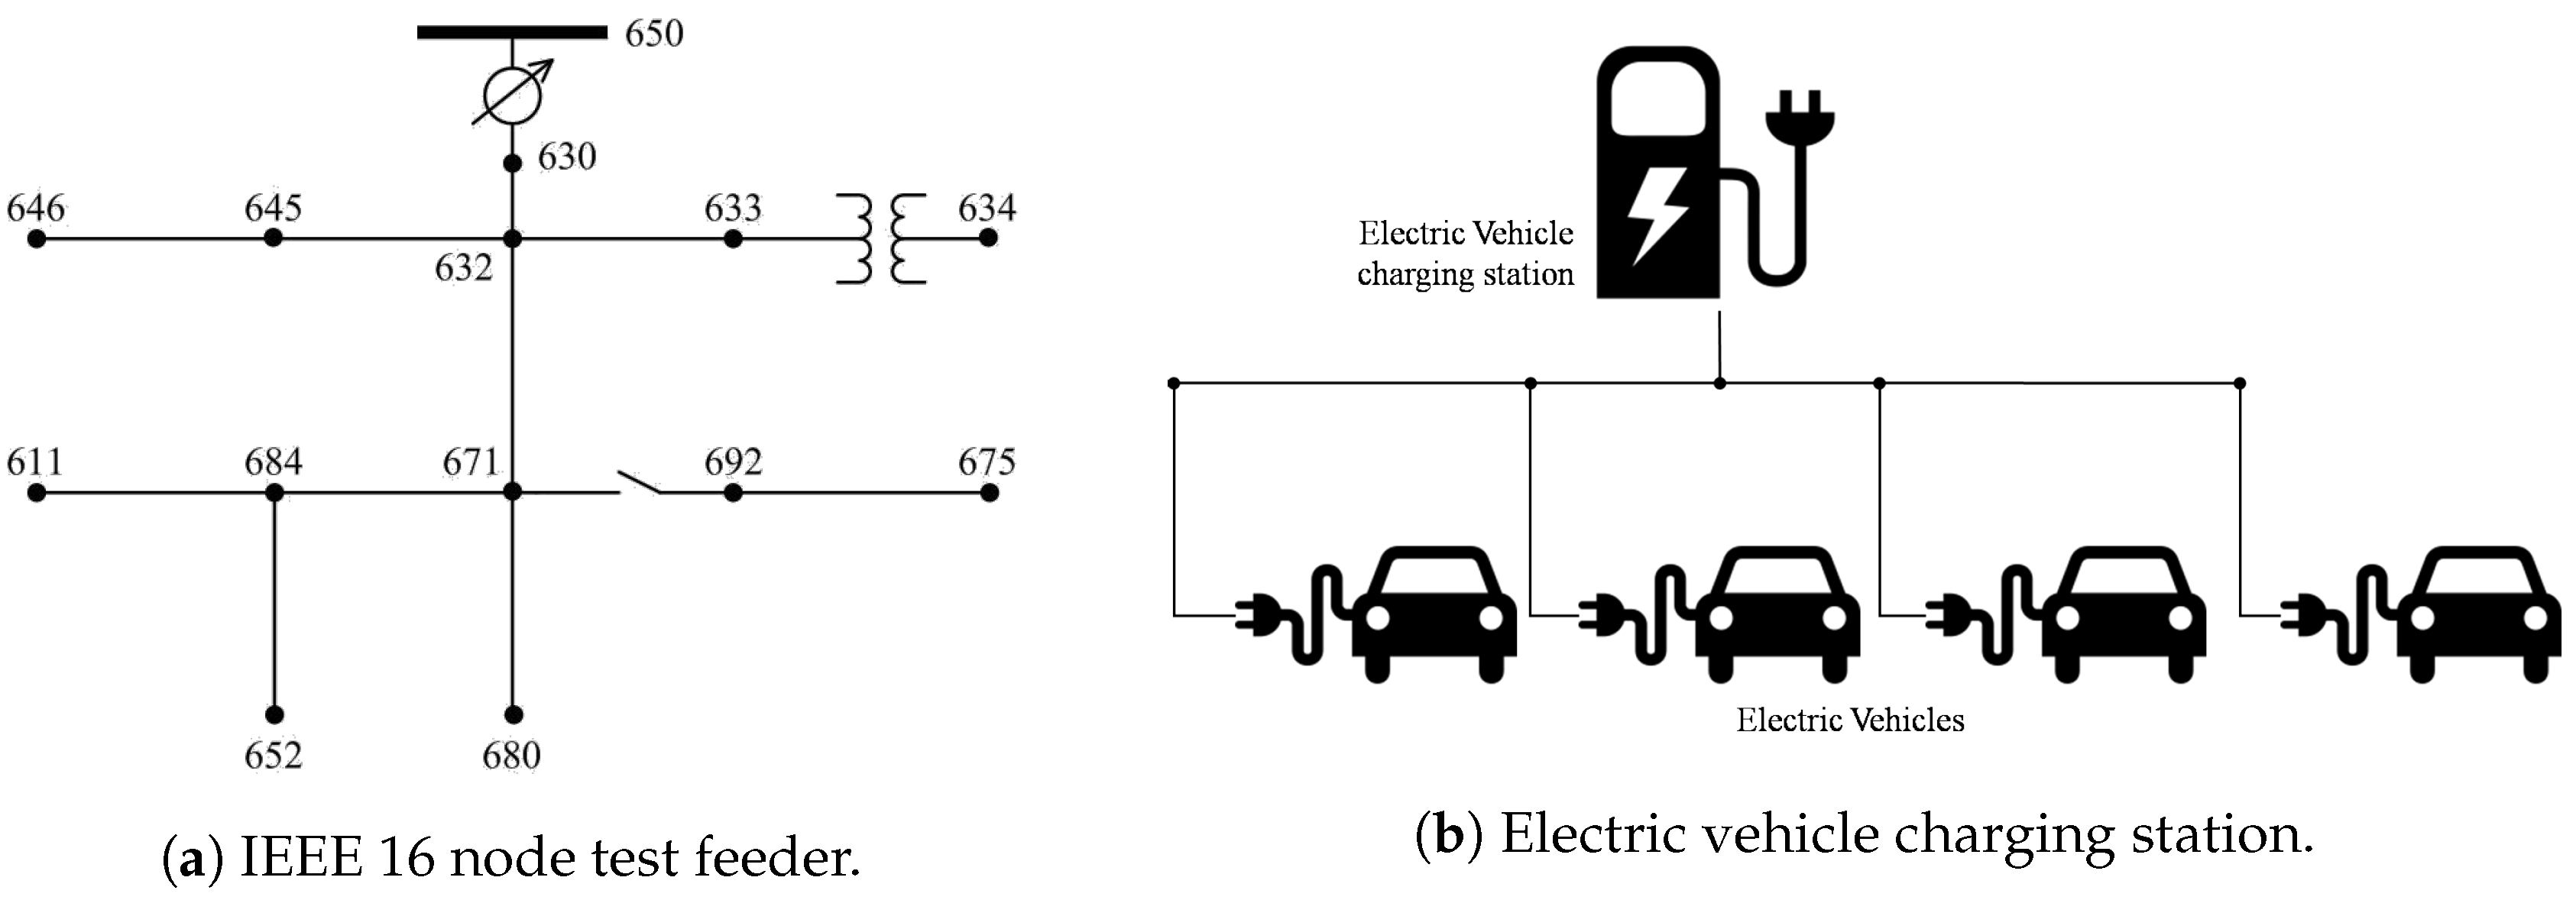
3.3. Practical Scenario
3.4. Remark on Evaluation Results
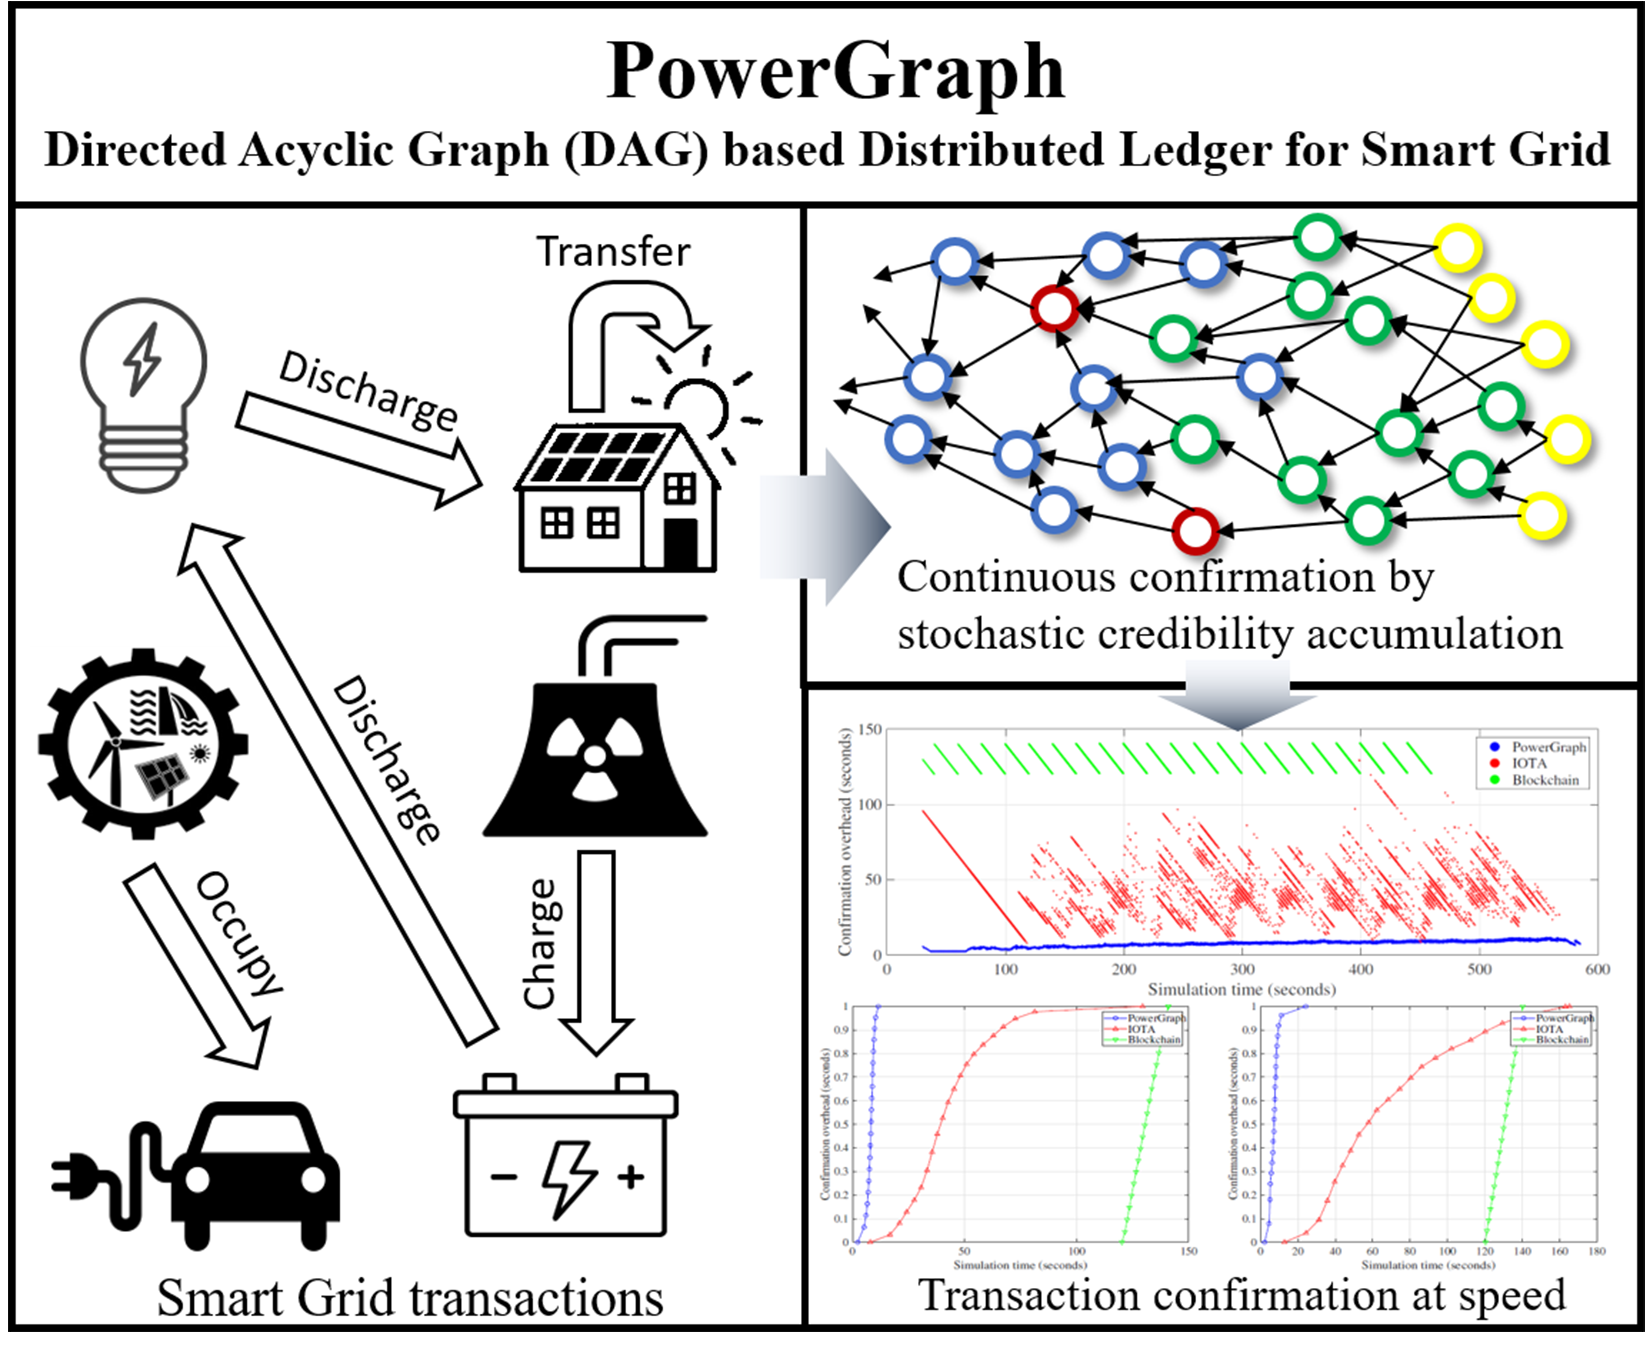
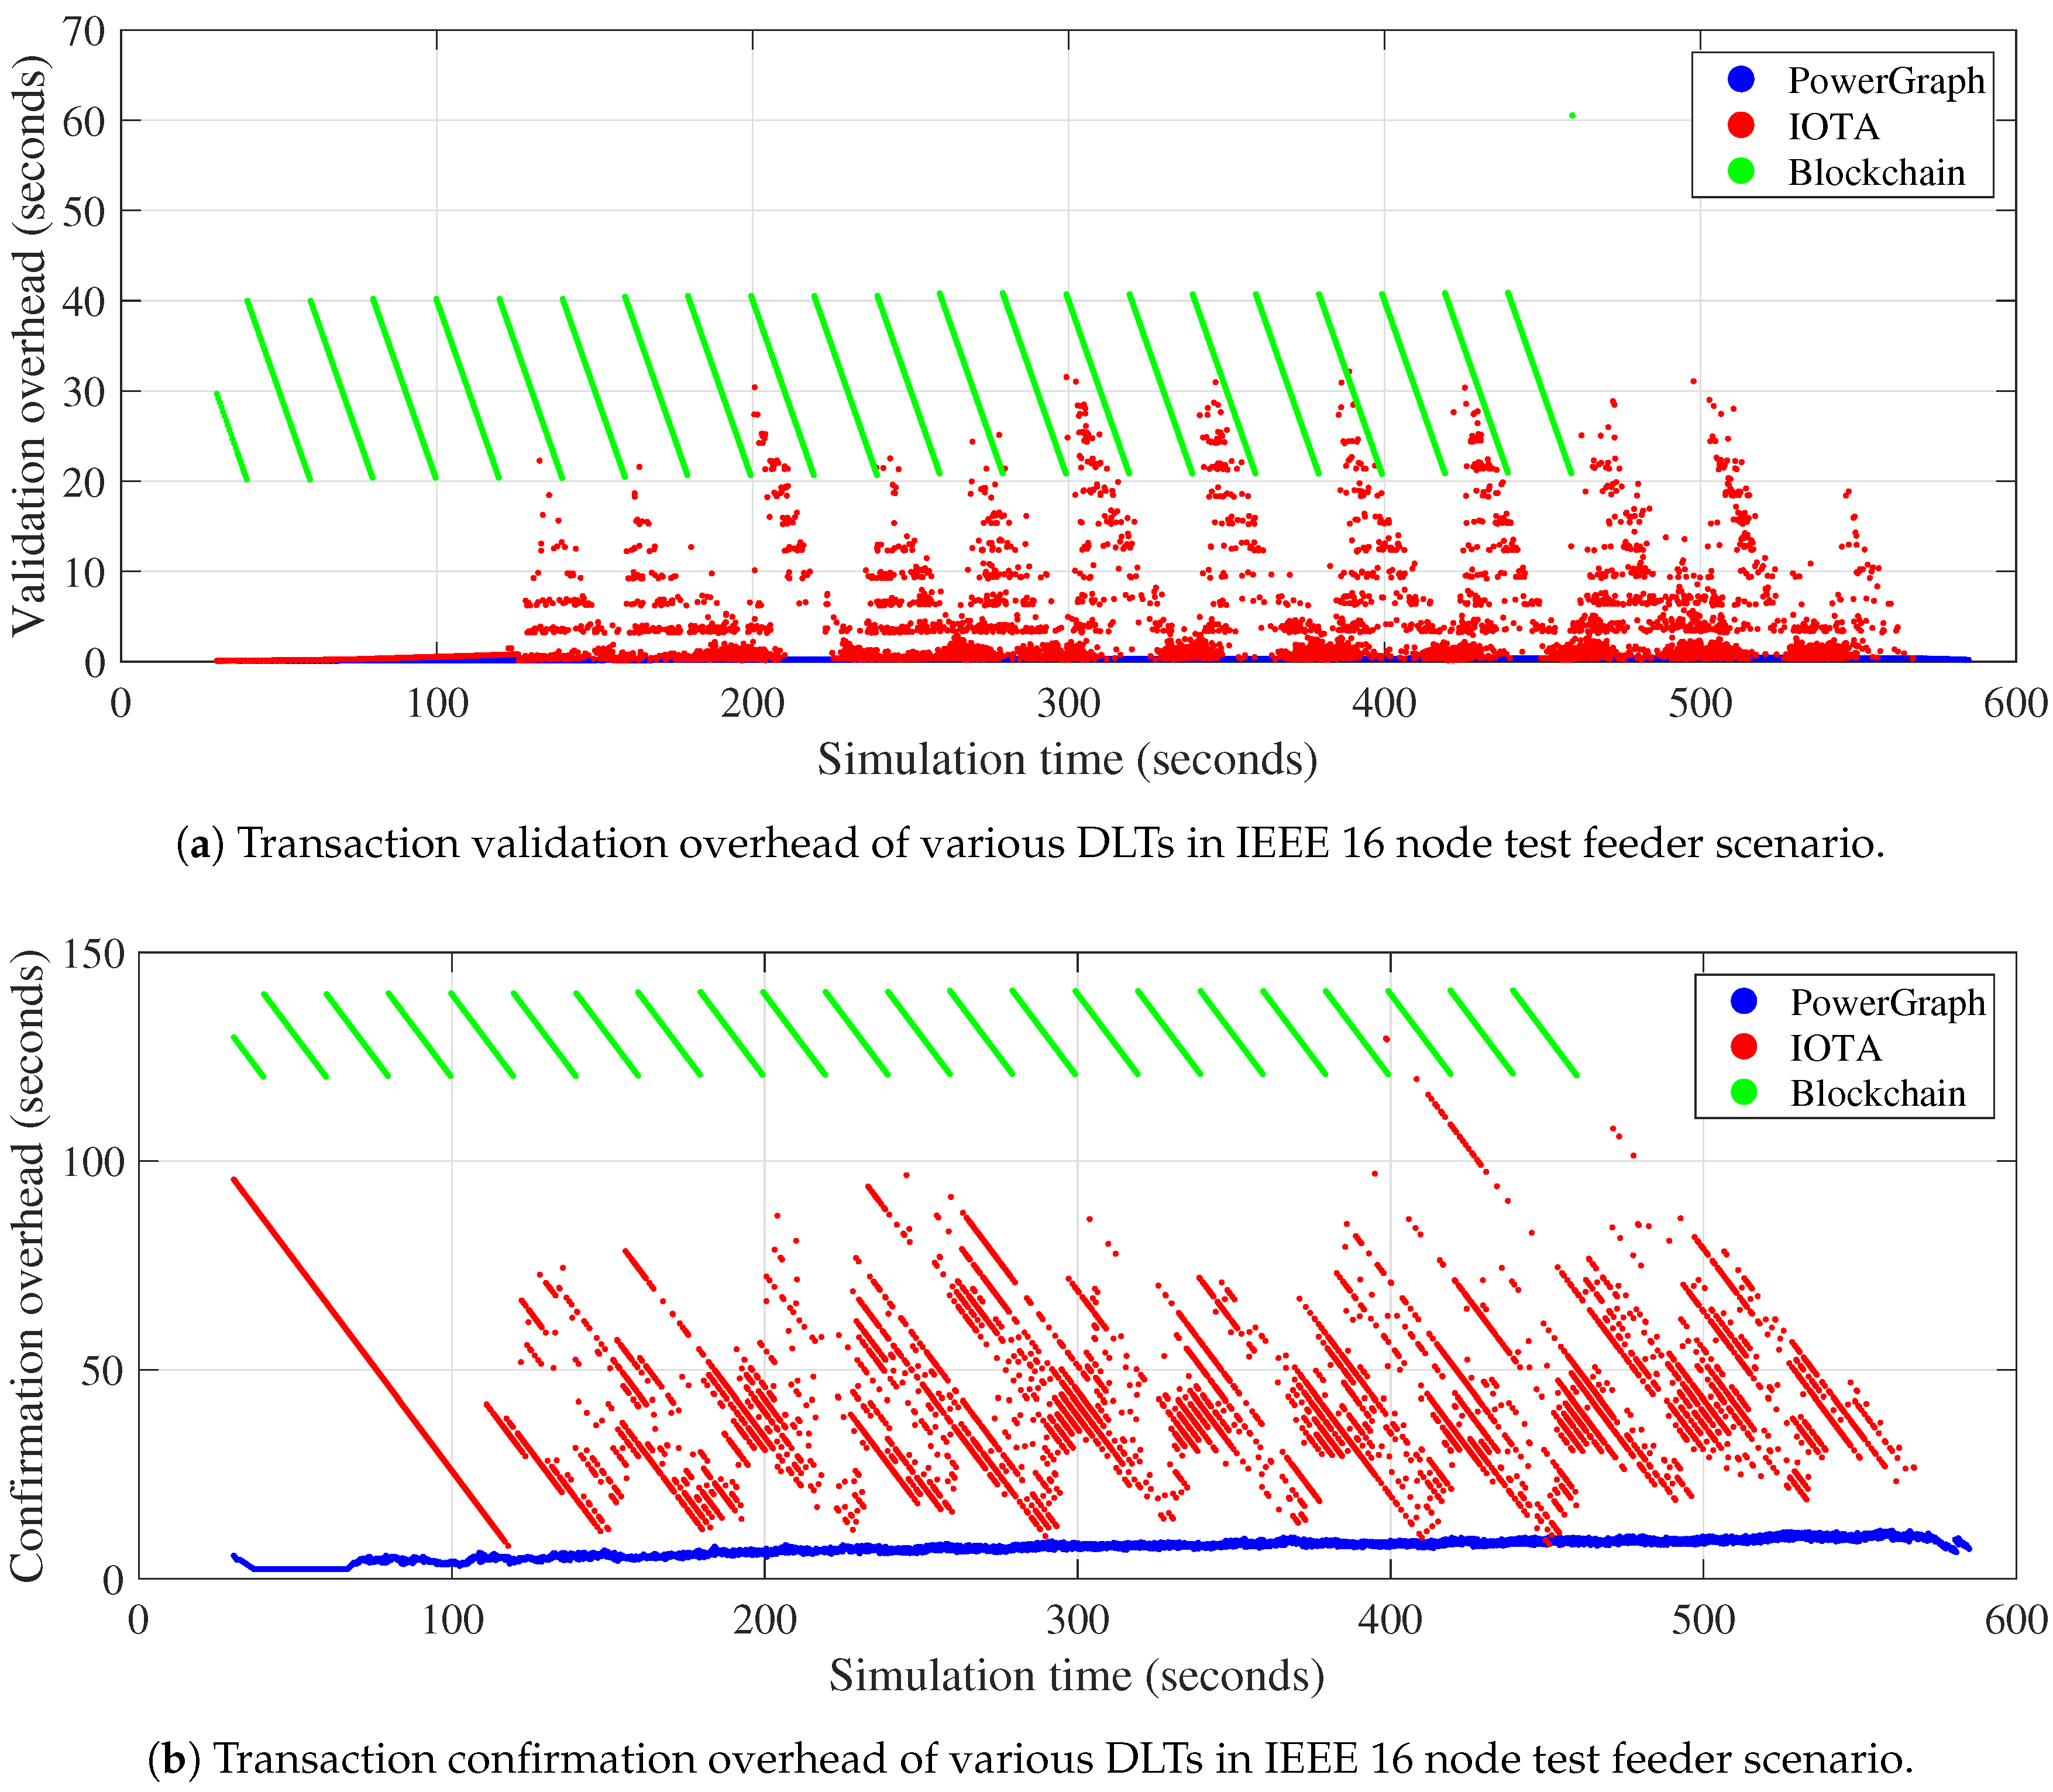
- Depending on the environmental factor and , the flow of the confirmation and the validation overhead can be varied. IOTA shows the patterned shape of the performance with respect to the simulation time, which is mainly due to the discretized and probabilistic process of the confirmation. The patterned shape results in the increment of the confirmation overhead of the system, which results in about 60 s, and this is about 5 to 7 times larger than the PowerGraph’s overhead. The overhead flow of the PowerGraph shows the little scale of the patterned shape in , or no pattern in , due to the continuous confirmation and deactivation of the transactions, based on Algorithm 1.
- As increases, the confirmation and validation overhead also increase. The equipped mechanism in each DLT restrains the overhead increase, so we show the slight increment of the overhead in Figure 10. However, due to the conditional confirmation, IOTA shows low performance when is low. This might be the misunderstanding of the IOTA system since its source code is not entirely in public [18], but potential solutions for this situation might be centralized or inefficient in terms of the validation network. On the other hand, PowerGraph shows stable performance in the entire domain, which implies the large applicability of our system.
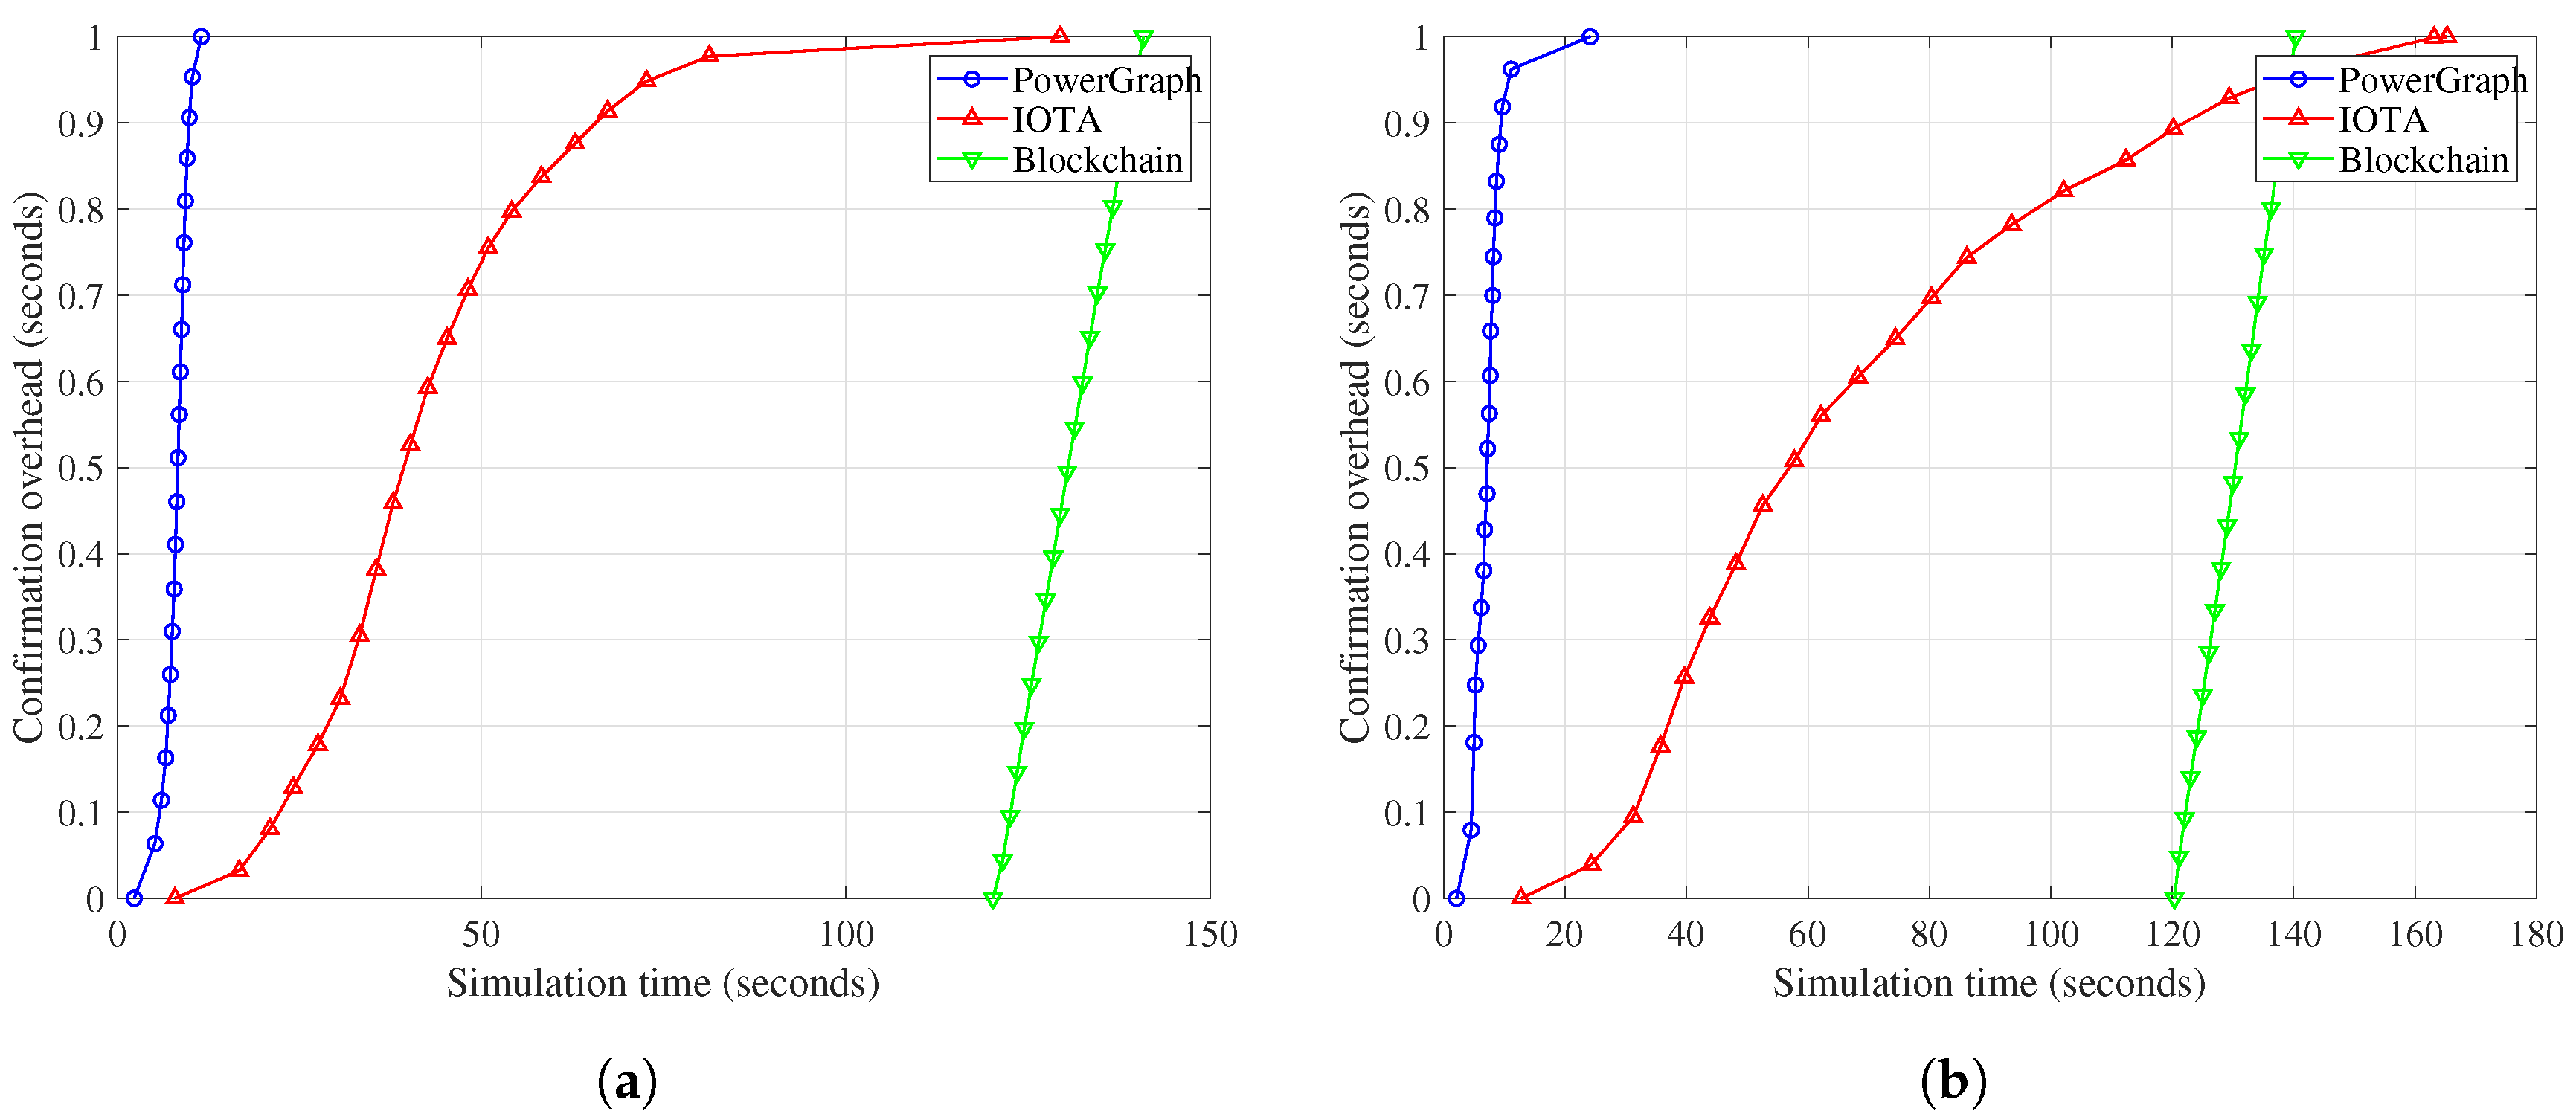
- In the evaluations with practical scenario, PowerGraph shows outperforming results in transaction finalization time, shown in Figure 12 and Figure 13. We showed that PowerGraph can sustain its confirmation and validation overhead where varies in a simulation. Also, while changing various factors such as and , PowerGraph always shows highly accelerated performance in entire evaluations. From the evaluations, we argue that our consensus algorithm used in PowerGraph can be widely applied at the various scale of the Smart Grid systems.
4. Conclusions
Author Contributions
Funding
Conflicts of Interest
Abbreviations
| DLT | Distributed Ledger Technology |
| AMI | Advanced Measurement Interface |
| ESS | Energy Storage System |
| DER | Distributed Energy Resources |
| DAG | Directed Acyclic Graph |
References
- Bae, M.; Kim, H.; Kim, E.; Chung, A.Y.; Kim, H.; Roh, J.H. Toward electricity retail competition: Survey and case study on technical infrastructure for advanced electricity market system. Appl. Energy 2014, 133, 252–273. [Google Scholar] [CrossRef]
- Kim, H.; Kim, K.; Park, S.; Kim, H.; Kim, H. Cosimulating communication networks and electrical system for performance evaluation in smart grid. Appl. Sci. 2018, 8, 85. [Google Scholar] [CrossRef]
- Kim, K.; Kim, H.; Jung, J.; Kim, H. AFAR: A robust and delay-constrained communication framework for smart grid applications. Comput. Netw. 2015, 91, 1–25. [Google Scholar] [CrossRef]
- Bae, M.; Lee, D.K.; Kim, H.; Kim, H. Self-configuring topology switch in smart home network. In Proceedings of the IEEE 2013 International Conference on ICT Convergence (ICTC), Jeju Island, South Korea, 14–16 October 2013; pp. 496–501. [Google Scholar]
- Son, H.; Kang, T.Y.; Kim, H.; Roh, J.H. A secure framework for protecting customer collaboration in intelligent power grids. IEEE Trans. Smart Grid 2011, 2, 759–769. [Google Scholar] [CrossRef]
- Son, H.; Kang, T.; Kim, H.; Park, J.B.; Roh, J.H. A fair and secure bandwidth allocation for AMI mesh network in smart grid. Comput. J. 2012, 55, 1232–1243. [Google Scholar] [CrossRef]
- Kang, T.; Kim, H. Preserving privacy with anonymity for customer collaboration in smart grid. In Proceedings of the IEEE 2012 18th Asia-Pacific Conference on Communications (APCC), Jeju Island, South Korea, 15–17 October 2012; pp. 724–729. [Google Scholar]
- Abdella, J.; Shuaib, K. Peer to peer distributed energy trading in smart grids: A survey. Energies 2018, 11, 1560. [Google Scholar] [CrossRef]
- Pieroni, A.; Scarpato, N.; Di Nunzio, L.; Fallucchi, F.; Raso, M. Smarter city: Smart energy grid based on blockchain technology. Int. J. Adv. Sci. Eng. Inf. Technol. 2018, 8, 298–306. [Google Scholar] [CrossRef]
- Kim, S.K.; Huh, J.H. A study on the improvement of smart grid security performance and blockchain smart grid perspective. Energies 2018, 11, 1973. [Google Scholar] [CrossRef]
- Cachin, C.; Vukolić, M. Blockchain consensus protocols in the wild. arXiv 2017, arXiv:1707.01873. [Google Scholar]
- Sompolinsky, Y.; Zohar, A. Accelerating Bitcoin’s Transaction Processing. Fast Money Grows on Trees, Not Chains. Iacr Cryptol. Eprint Arch. 2013. Available online: https://pdfs.semanticscholar.org/4016/80ef12c04c247c50737b9114c169c660aab9.pdf (accessed on 18 September 2019).
- Popov, S. The tangle. 2016. Available online: http://tanglereport.com/wp-content/uploads/2018/01/IOTA_Whitepaper.pdf (accessed on 18 September 2019).
- Seongjoon, P.; Seounghwan, O.; Hwangnam, K. Performance Analysis of DAG-Based cryptocurrency. In Proceedings of the 2019 IEEE International Conference on Communications Workshops (ICC Workshops), Shanghai, China, 20–24 May 2019. [Google Scholar]
- A Video of MDIP-Energies Manuscript (Demonstration of the PowerGraph Implementation). 2019. Available online: https://youtu.be/K5Uo1TIx_KM (accessed on 17 September 2019).
- Nguyen, G.T.; Kim, K. A Survey about Consensus Algorithms Used in Blockchain. J. Inf. Process. Syst. 2018, 14, 101–128. [Google Scholar]
- Kersting, W.H. Radial distribution test feeders. IEEE Trans. Power Syst. 2001, 2, 908–912. [Google Scholar]
- Siim, J. DAG-Based Distributed Ledgers. 2018. Available online: https://pdfs.semanticscholar.org/ca34/671d3a031f821345e705e00a2cd2a927d0c3.pdf?_ga=2.17730161.996692292.1568690468-1898638640.1500009594 (accessed on 18 September 2019).


| Item | Value |
|---|---|
| Proof-of-Work overhead (IOTA and PowerGraph) | s |
| Unit validation overhead | s |
| The number of Reference transactions | 4 |
| IOTA conformation threshold | 90% |
| IOTA confirmation condition | 20 terminals |
| IOTA revalidation interval | 3 s |
| Simulation time | 600 s |
© 2019 by the authors. Licensee MDPI, Basel, Switzerland. This article is an open access article distributed under the terms and conditions of the Creative Commons Attribution (CC BY) license (http://creativecommons.org/licenses/by/4.0/).
Share and Cite
Park, S.; Kim, H. DAG-Based Distributed Ledger for Low-Latency Smart Grid Network. Energies 2019, 12, 3570. https://doi.org/10.3390/en12183570
Park S, Kim H. DAG-Based Distributed Ledger for Low-Latency Smart Grid Network. Energies. 2019; 12(18):3570. https://doi.org/10.3390/en12183570
Chicago/Turabian StylePark, Seongjoon, and Hwangnam Kim. 2019. "DAG-Based Distributed Ledger for Low-Latency Smart Grid Network" Energies 12, no. 18: 3570. https://doi.org/10.3390/en12183570
APA StylePark, S., & Kim, H. (2019). DAG-Based Distributed Ledger for Low-Latency Smart Grid Network. Energies, 12(18), 3570. https://doi.org/10.3390/en12183570