An Electric Taxi Charging Station Planning Scheme Based on an Improved Destination Choice Method


Abstract
:1. Introduction
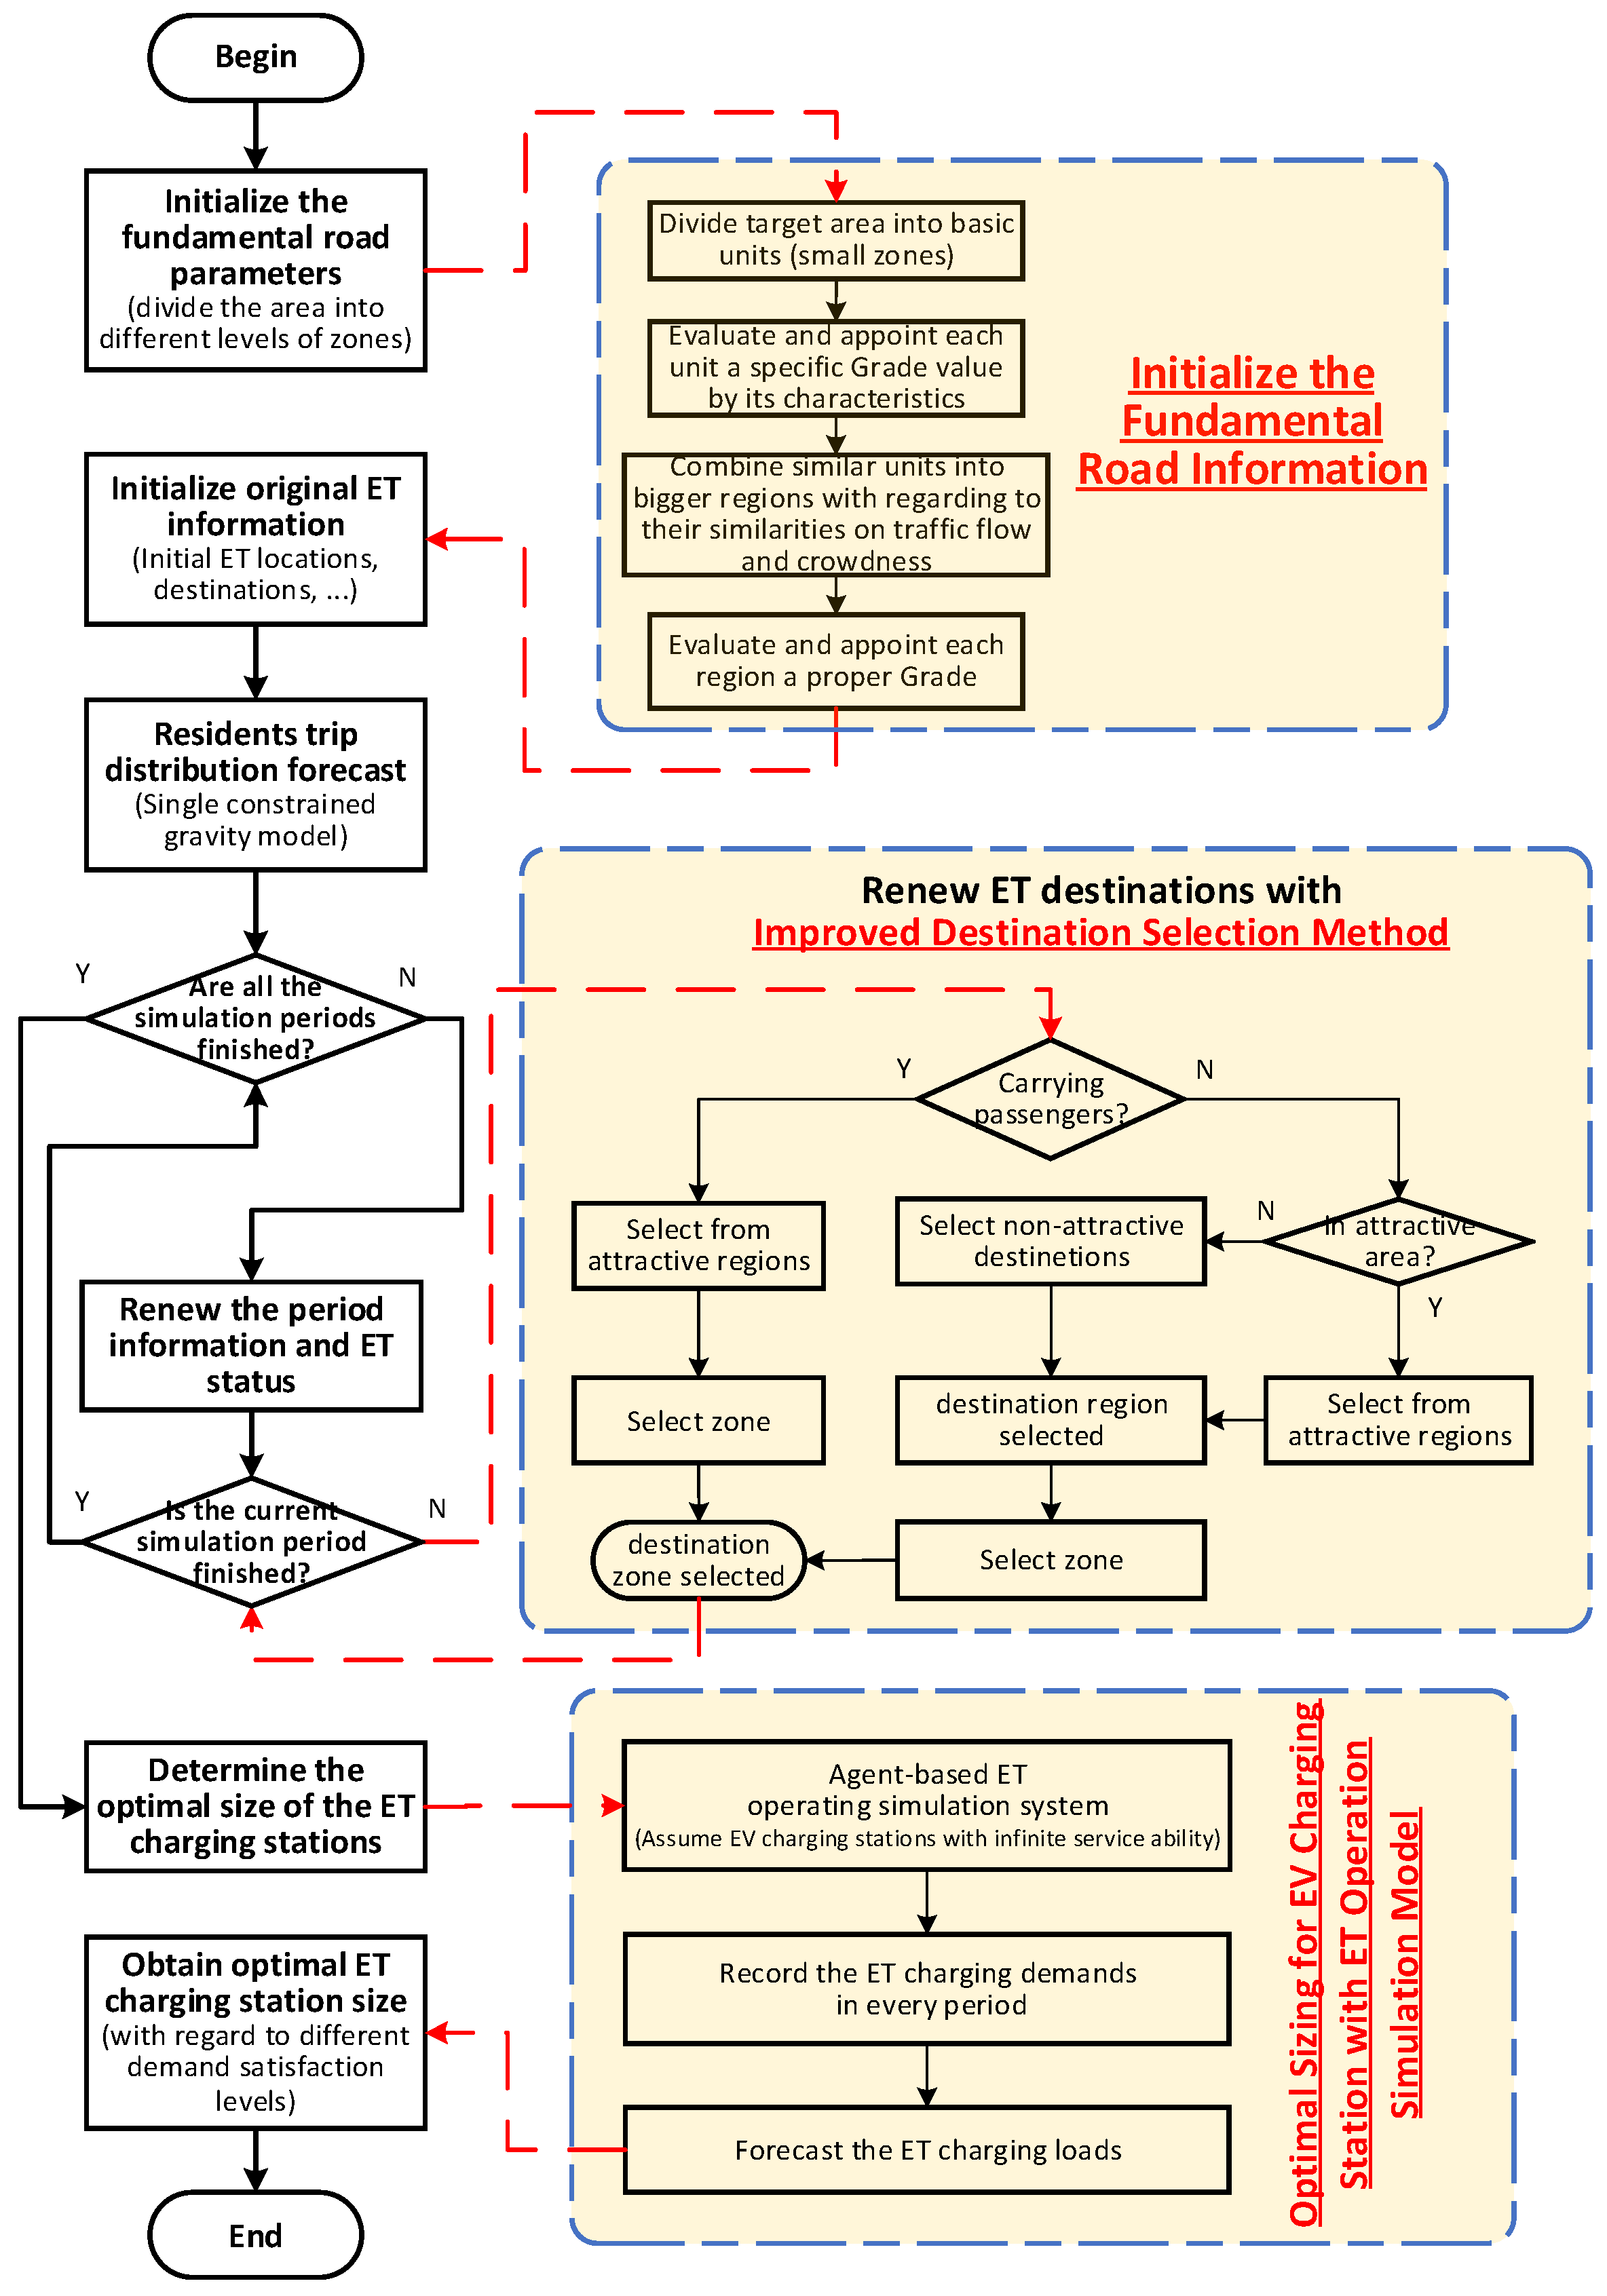
- The improved destination selection model can simulate the travel behavior of electric taxis well and has strong practical significance.
- Compared to the traditional method (as shown in Appendix A), the improved destination selection model can reduce many calculations.
- The statistical knowledge is used to find the right capacity of each charging station according to the actual operation data.
2. Hierarchical Structure of the Electric Taxi Target Area
2.1. Road Congestion Degree
- : the rating of the region that contains district i;
- : the rating of the public places that belong to district i;
- : weighting coefficient; and
- : constant coefficient
2.2. District Rating
- : district number;
- : the rating of district i;
- : the rating of the region that contains district i;
- : the rating of the public places that belong to district i;
- : weighting coefficient;
- : the set of public places in the region that contains district i;
- : constant coefficient;
- : the set of public places in district i;
- : the number of elements in R; and
- : the corresponding rating values of public places.
3. Electric Taxis Operation Model
3.1. Load Factor
- : the rate of x passengers needing to take taxis during the counting period ;
- : counting period;
- : the rate of average riding needs;
- : average number of consumers needing to take taxis during the counting period; and
- : weighting coefficients
3.2. ET Destination Selection Model When the ET Has Passengers
3.2.1. Region Selection Principle
3.2.2. District Selection Principle
- denotes the shortest distance that passengers will consider taking a taxi;
- denotes the farthest distance that passengers will consider taking a taxi;
- denotes the farthest distance in the target area; and
- denote corresponding weighting coefficients.
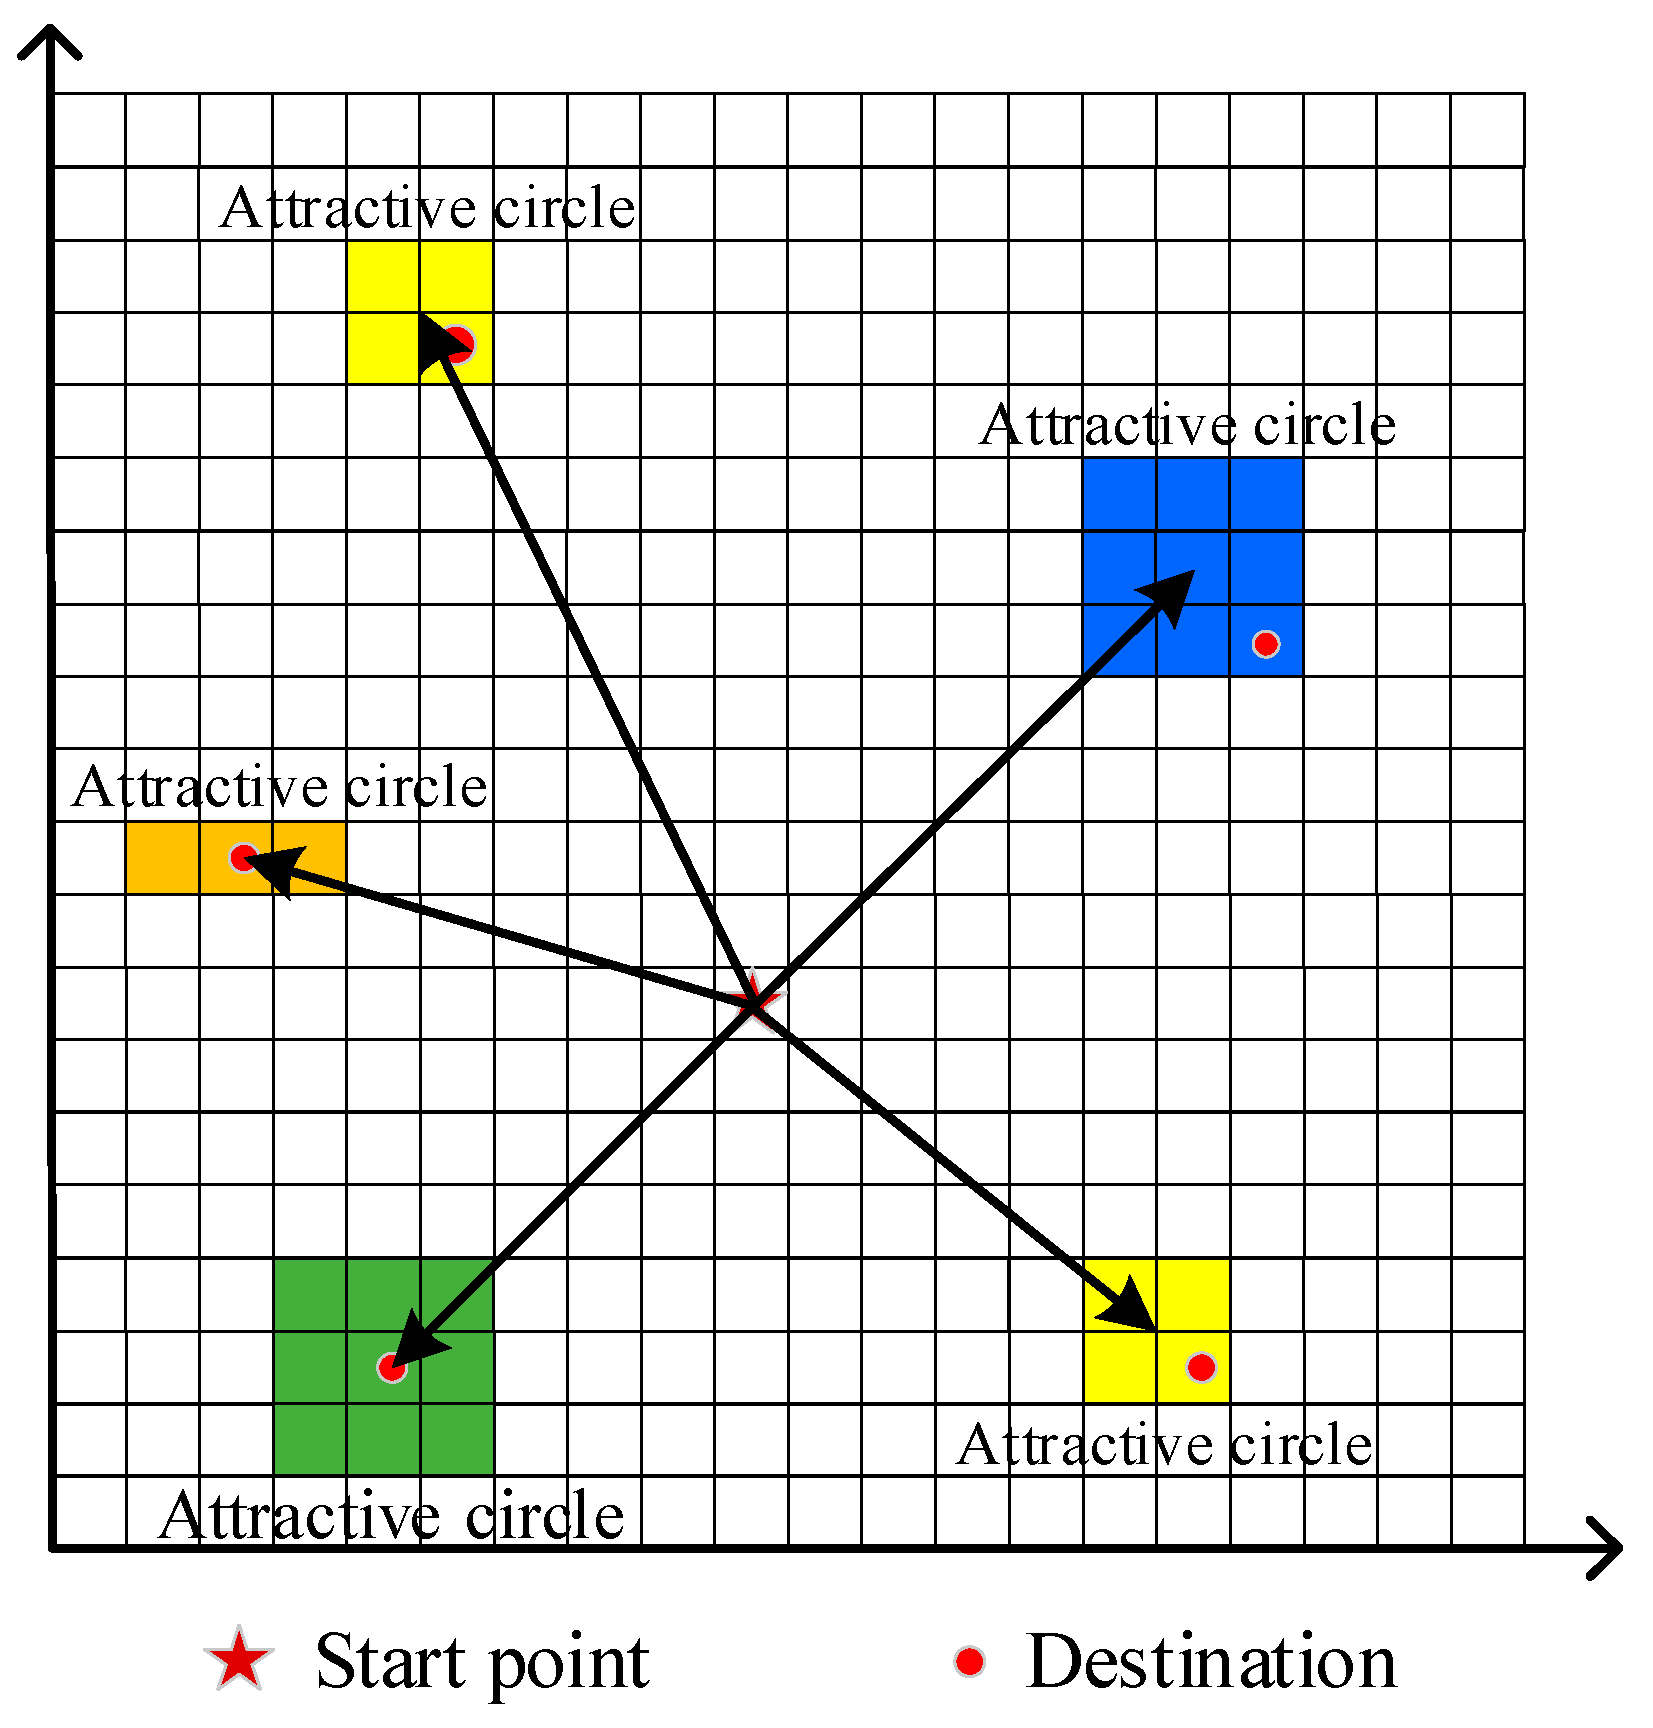
3.2.3. ET outside the Attractive Regions
3.2.4. ET inside the Attractive Region
3.3. ET’s Operating Model
3.3.1. Model Assumptions
- Vehicles only operate for M hours, and all are fully charged when the day’s work starts;
- Each ET has a corresponding ‘trigger time’ and ‘ending time’, in this paper, the time is in minutes, so, ; when , taxis begin operating, and when , taxis finish operating, is maximum business/running time for an ET.
- Information on each ET includes the following: ‘trigger time’ , ‘ending time’ , current power , current area , moving route , district conversion time , power consumption , and vehicle status . Status is updated per minutes.
- The ET’s route is the straightest line that connects the starting district and destination district.
- ‘Empty driving’ ETs determine whether they take passengers by the load factor when passing each district.
- If the ‘have passengers’ ET cannot reach the nearest charging station after it reaches its destination, the ET rejects any passengers and moves to the nearest station for charging.
- If the ‘empty driving’ ET cannot reach the nearest charging station after it reaches its destination, the ET changes its route and moves to the nearest charging station.
3.3.2. Detailed Steps
- (1)
- If , update the information: , , , (if is the destination, the vehicle status is changed to ‘empty driving’); go to Step 3;
- (2)
- If , go to Step 7;
- (1)
- If the vehicle status is ‘have passengers’, skip to Step 7;
- (2)
- If the vehicle status is ‘idle’, , determine whether to take passengers by the passenger load factor. If passengers are taken, go to Step 4; otherwise, go to Step 5;
- (3)
- If the vehicle status is ‘charging’, determine whether to take passengers by the passenger load factor. If passengers are taken, go to Step 4; otherwise, go to Step 7;
- (4)
- If the vehicle status is ‘empty driving’, determine whether to take passengers by the passenger load factor. If ET takes passengers, go to Step 4; otherwise, determine the route and power consumption from the next district k to the nearest charging station. If , this means the ‘empty driving’ ET has enough power to keep the ‘empty driving’ state; go to Step 7. Otherwise, travel to the nearest charging station, where the vehicle status will be changed to ‘charging’, and go to Step 6.
- (1)
- If , this means the ET has enough power to drive passengers to the destination, so the ET takes passengers, and the vehicle status is changed to ‘have passengers’. Determine the district conversion time by the consuming time of passing each district , , and go to Step 7.
- (2)
- If , this means the ET does not have enough power to drive passengers to the destination, so the ET rejects the passengers. If the vehicle status is ‘idle’ or ‘empty driving’, the taxi travels to the nearest charging station, and the vehicle status is changed to ‘charging’; go to Step 6. Otherwise, go to Step 7.
3.4. Analysis of Complexity
- N denotes the number of ETs;
- denotes the number of all districts;
- denotes the number of regions;
- denotes the number of districts in one region;
- denotes the number of attractive regions;
- denotes the number of surrounding districts;
- denotes the number of target districts chosen when the ET ‘has passengers’;
- denotes the number of target districts chosen when the ET is ‘empty driving’;
- denotes the number of target districts chosen when the ‘empty driving’ ET is outside attractive regions;
- n4 denotes the number of target districts chosen when the ‘empty driving’ ET is inside attractive regions;
- fp denotes the calculated cost of one ET making one probability selection; and
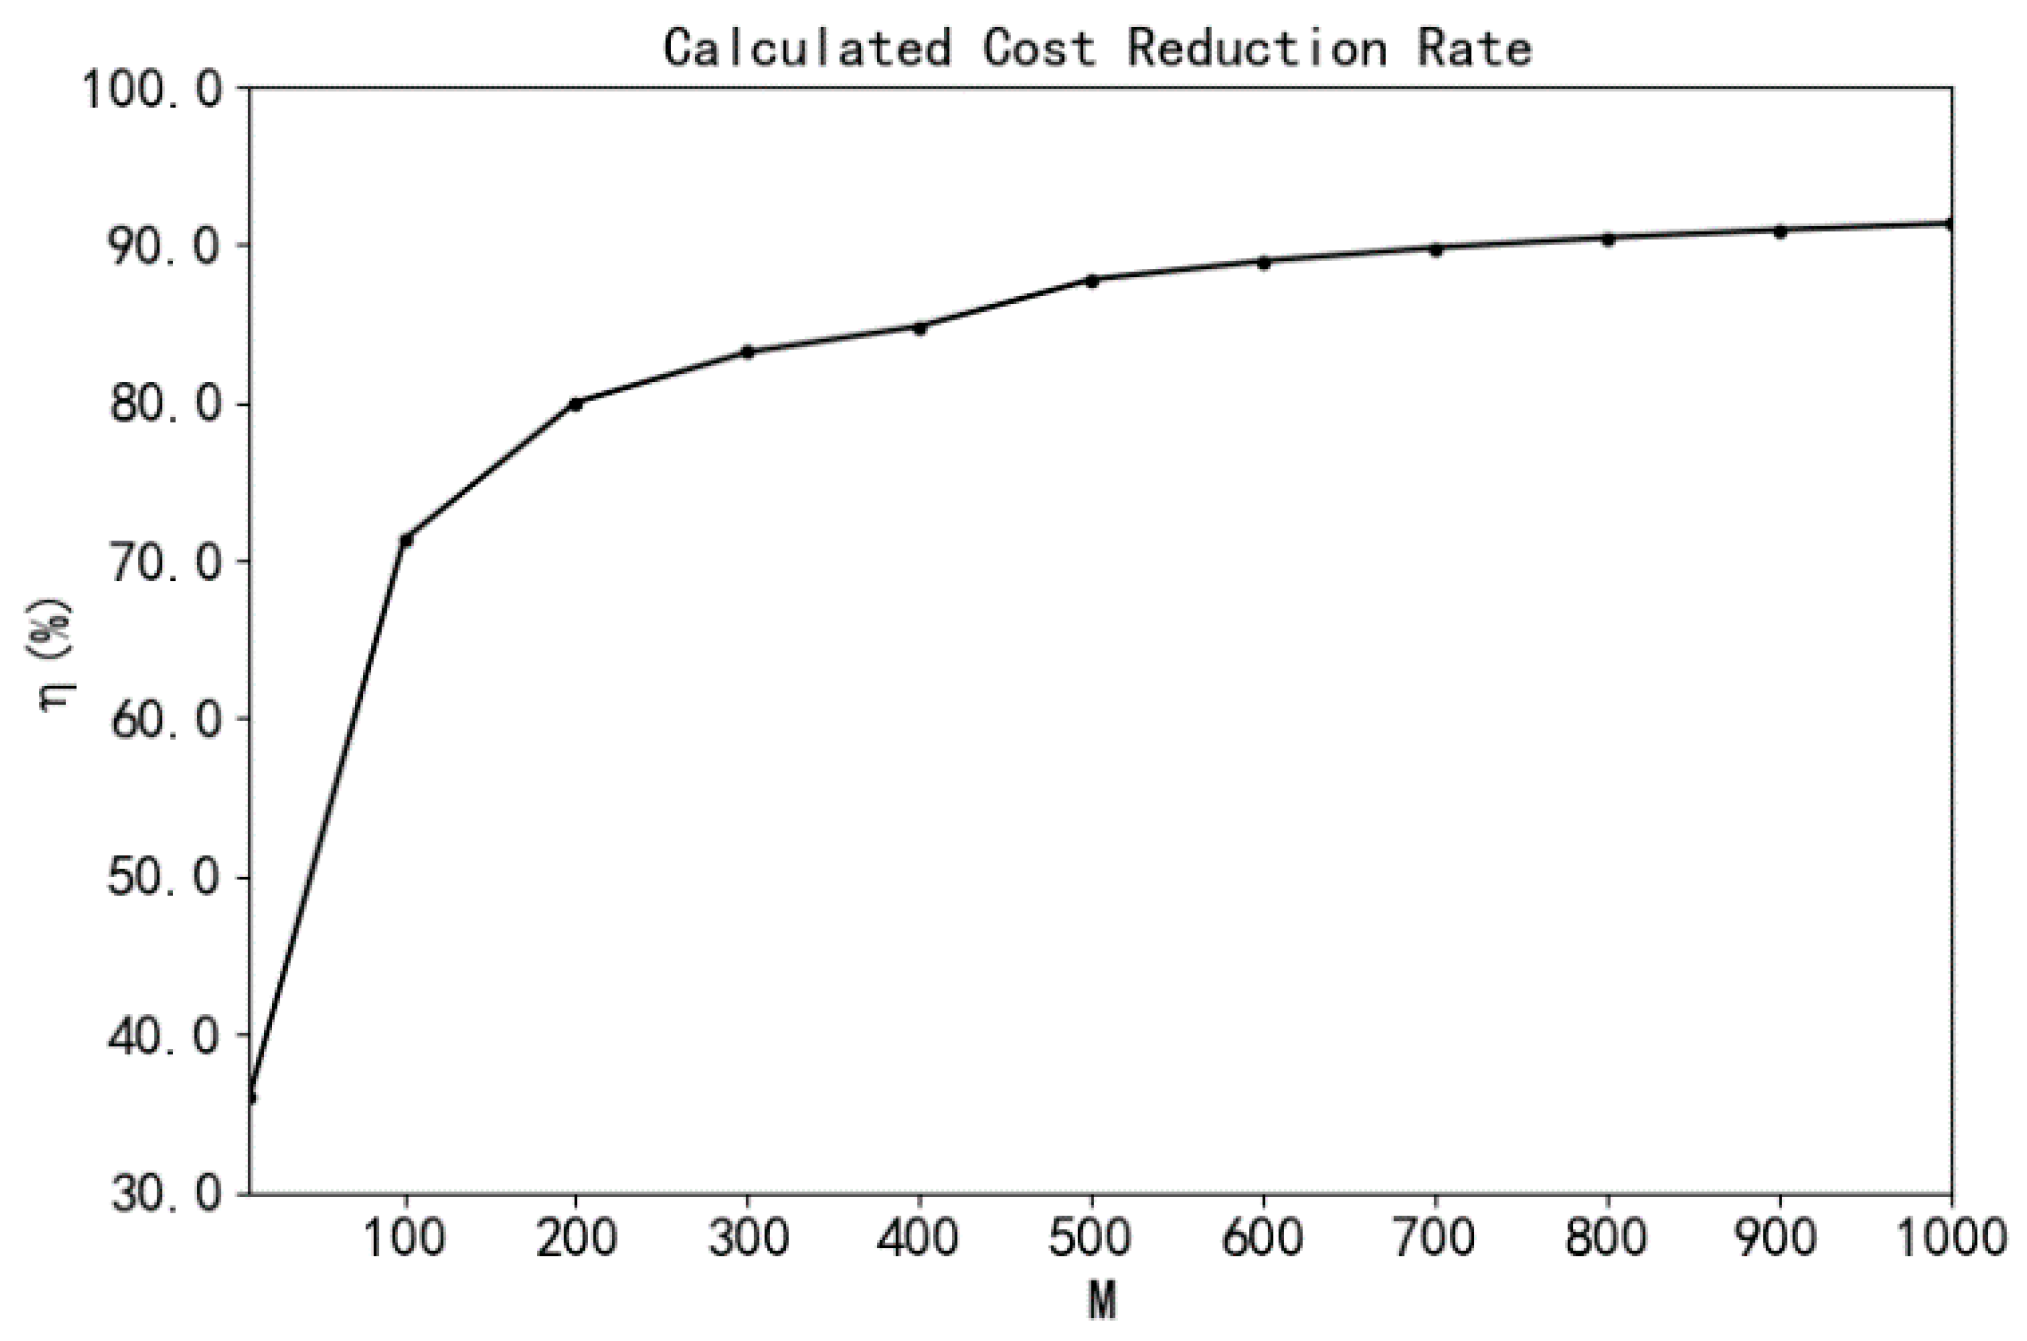
- η denotes the rate of calculated cost reduction.
4. Case Study
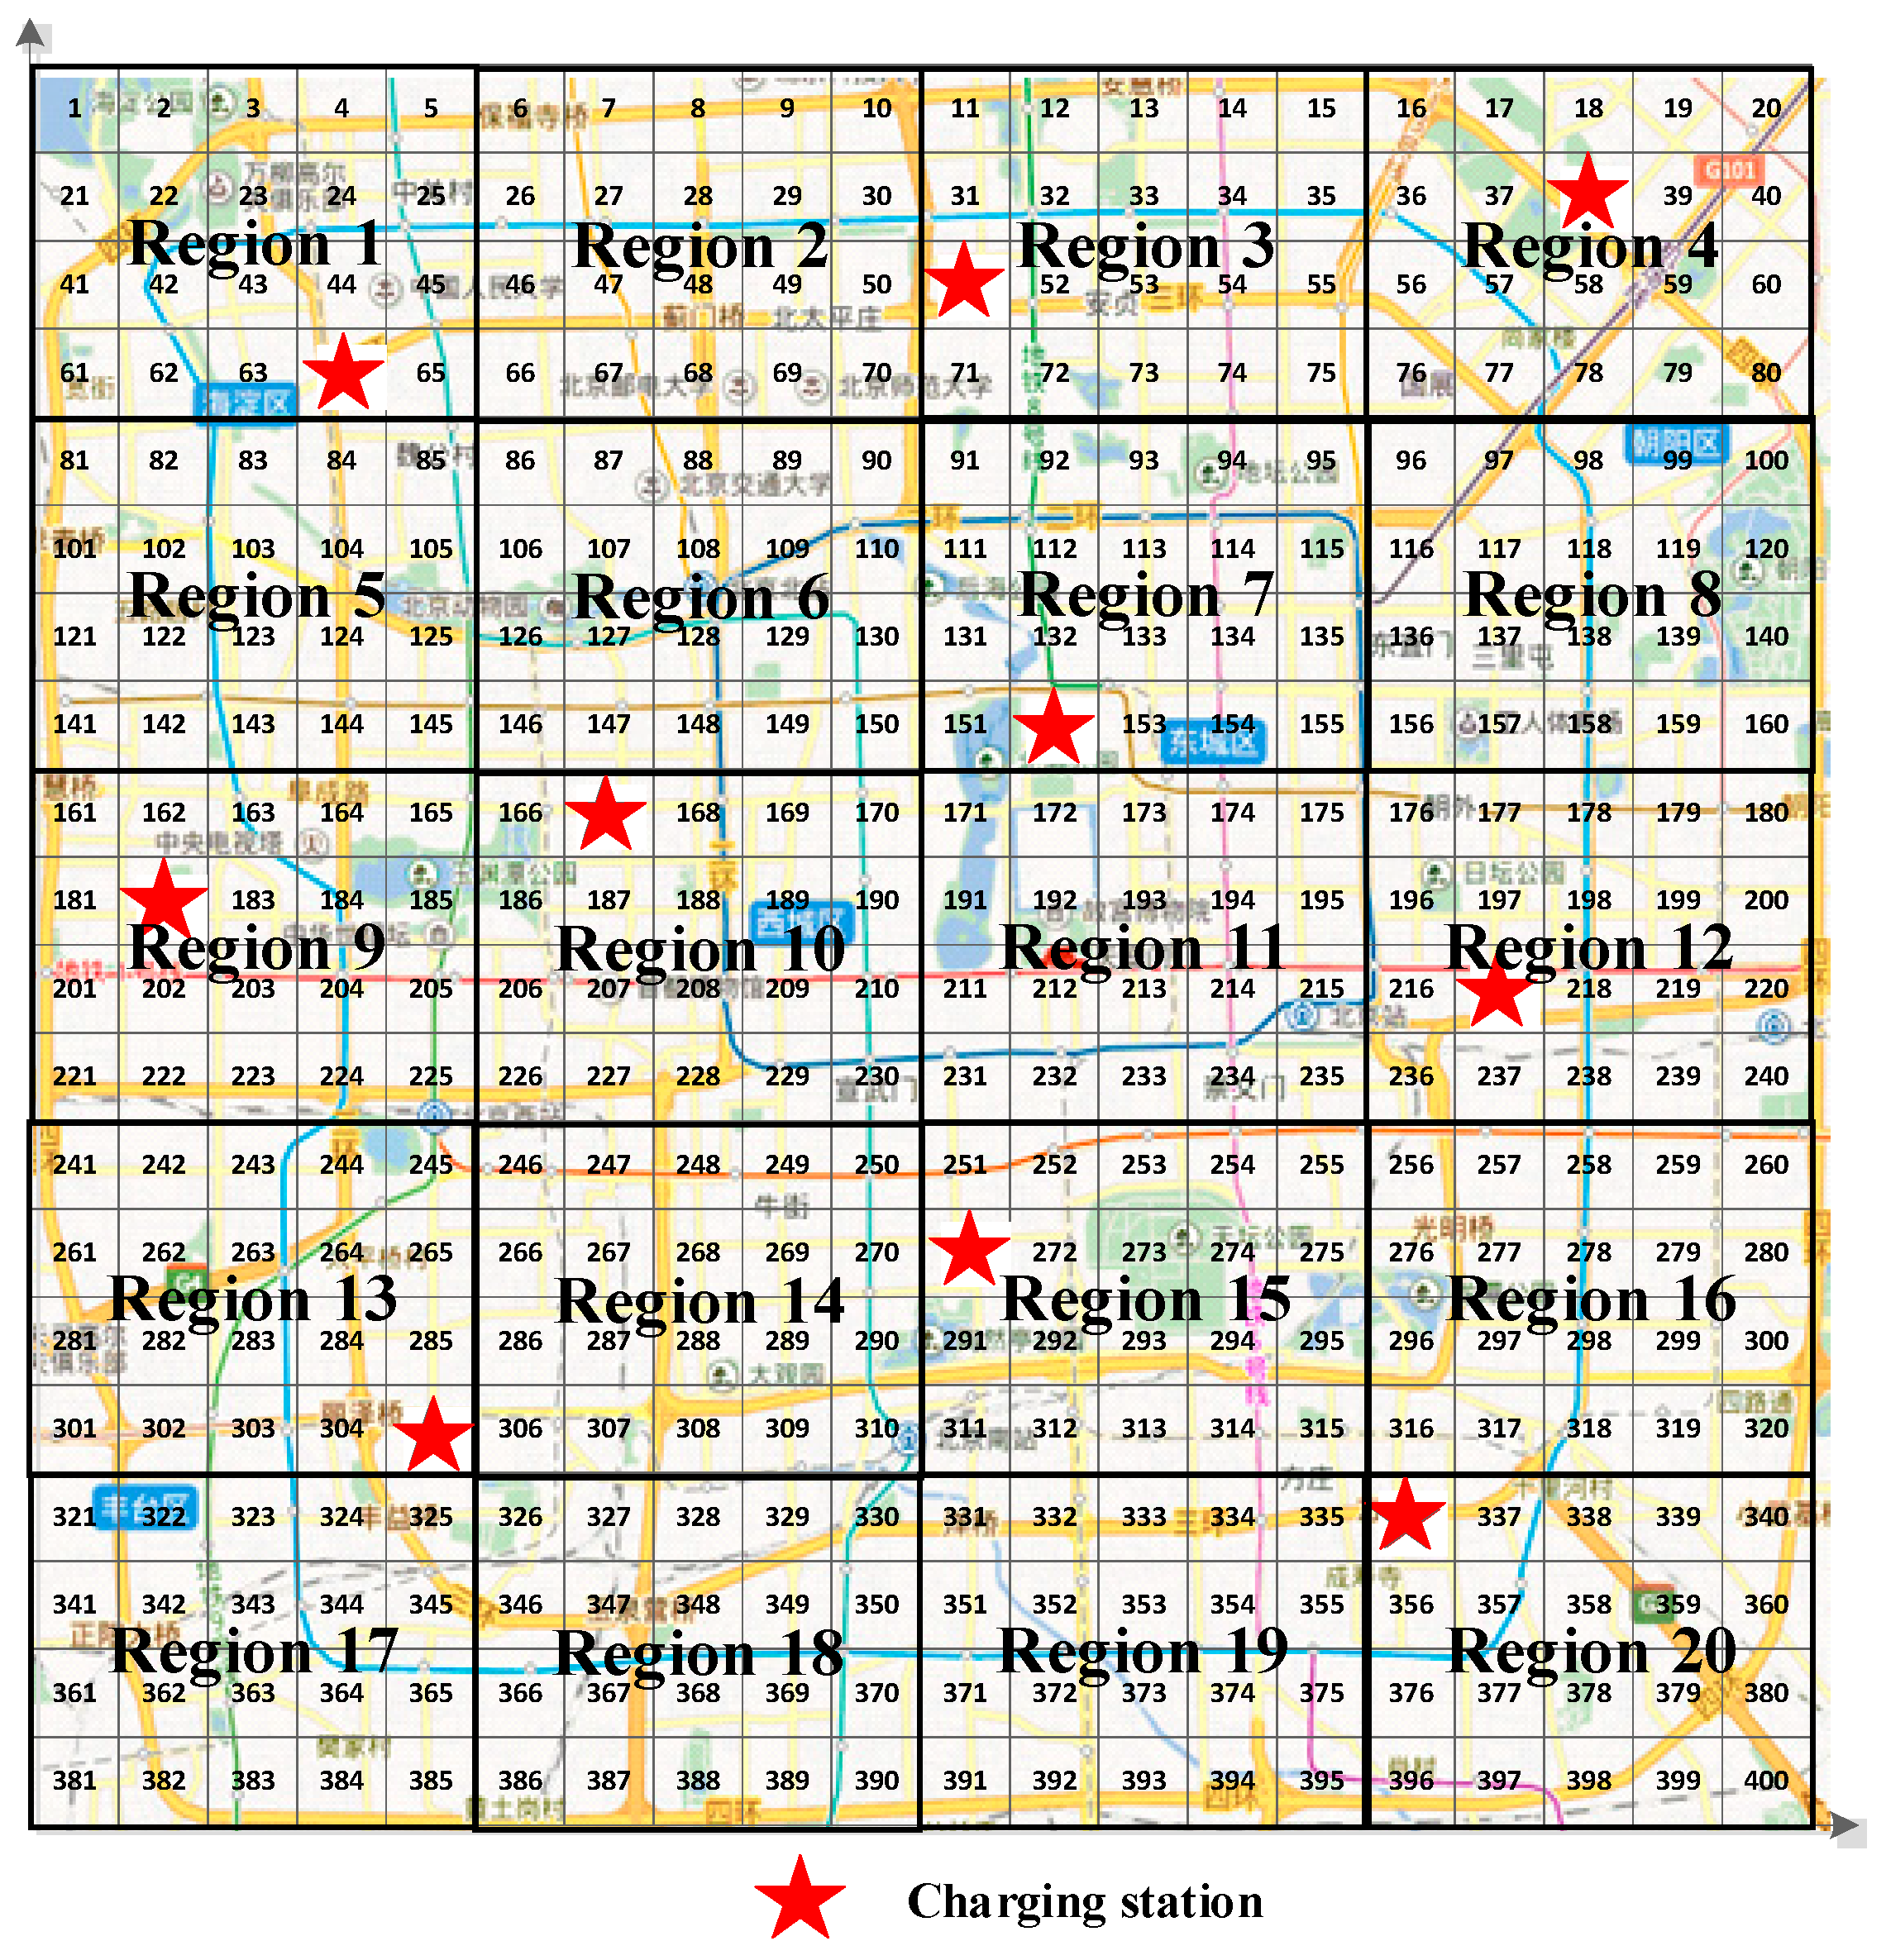
4.1. Problem Description
4.2. Case Parameters Setting
4.3. Algorithm Parameters Setting
- Maximum Iterations: 500;
- The Number of ETs: 1000;
- Maximum Business/Running Time for an ET: 5 h;
- Maximum ET Travel Mileage: 260 km; and
- ET Charging Time: 30 min.
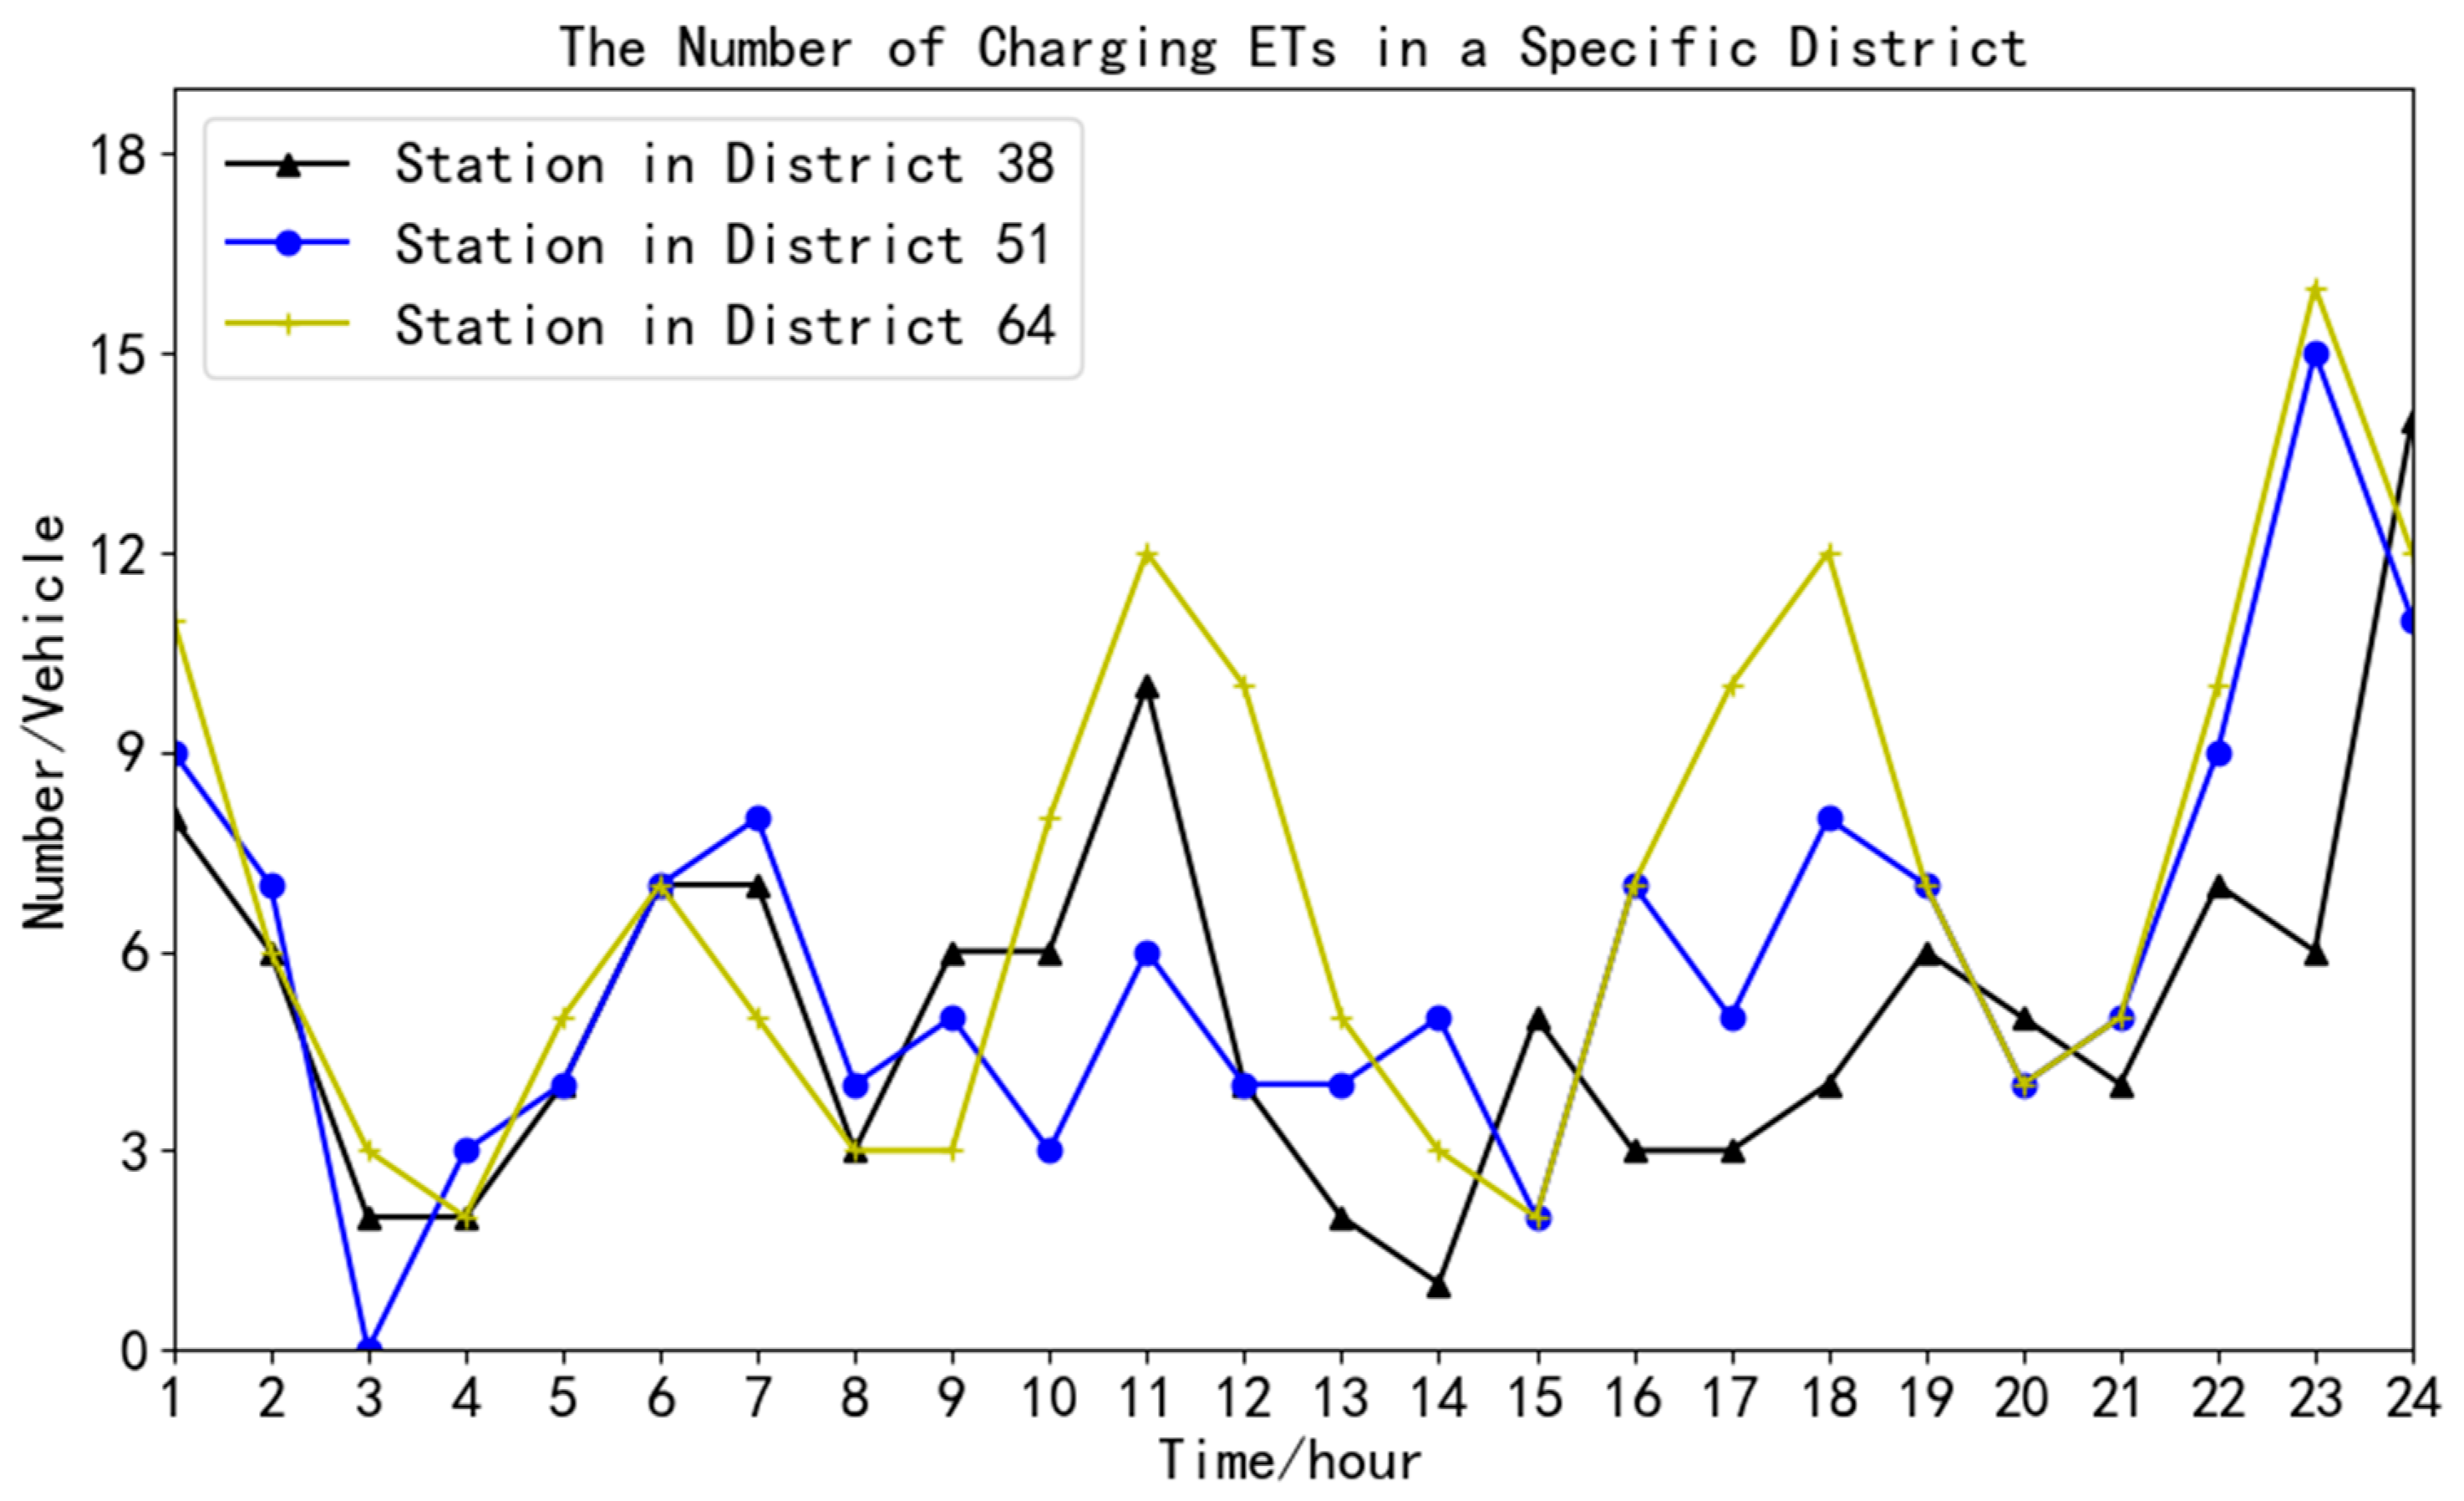
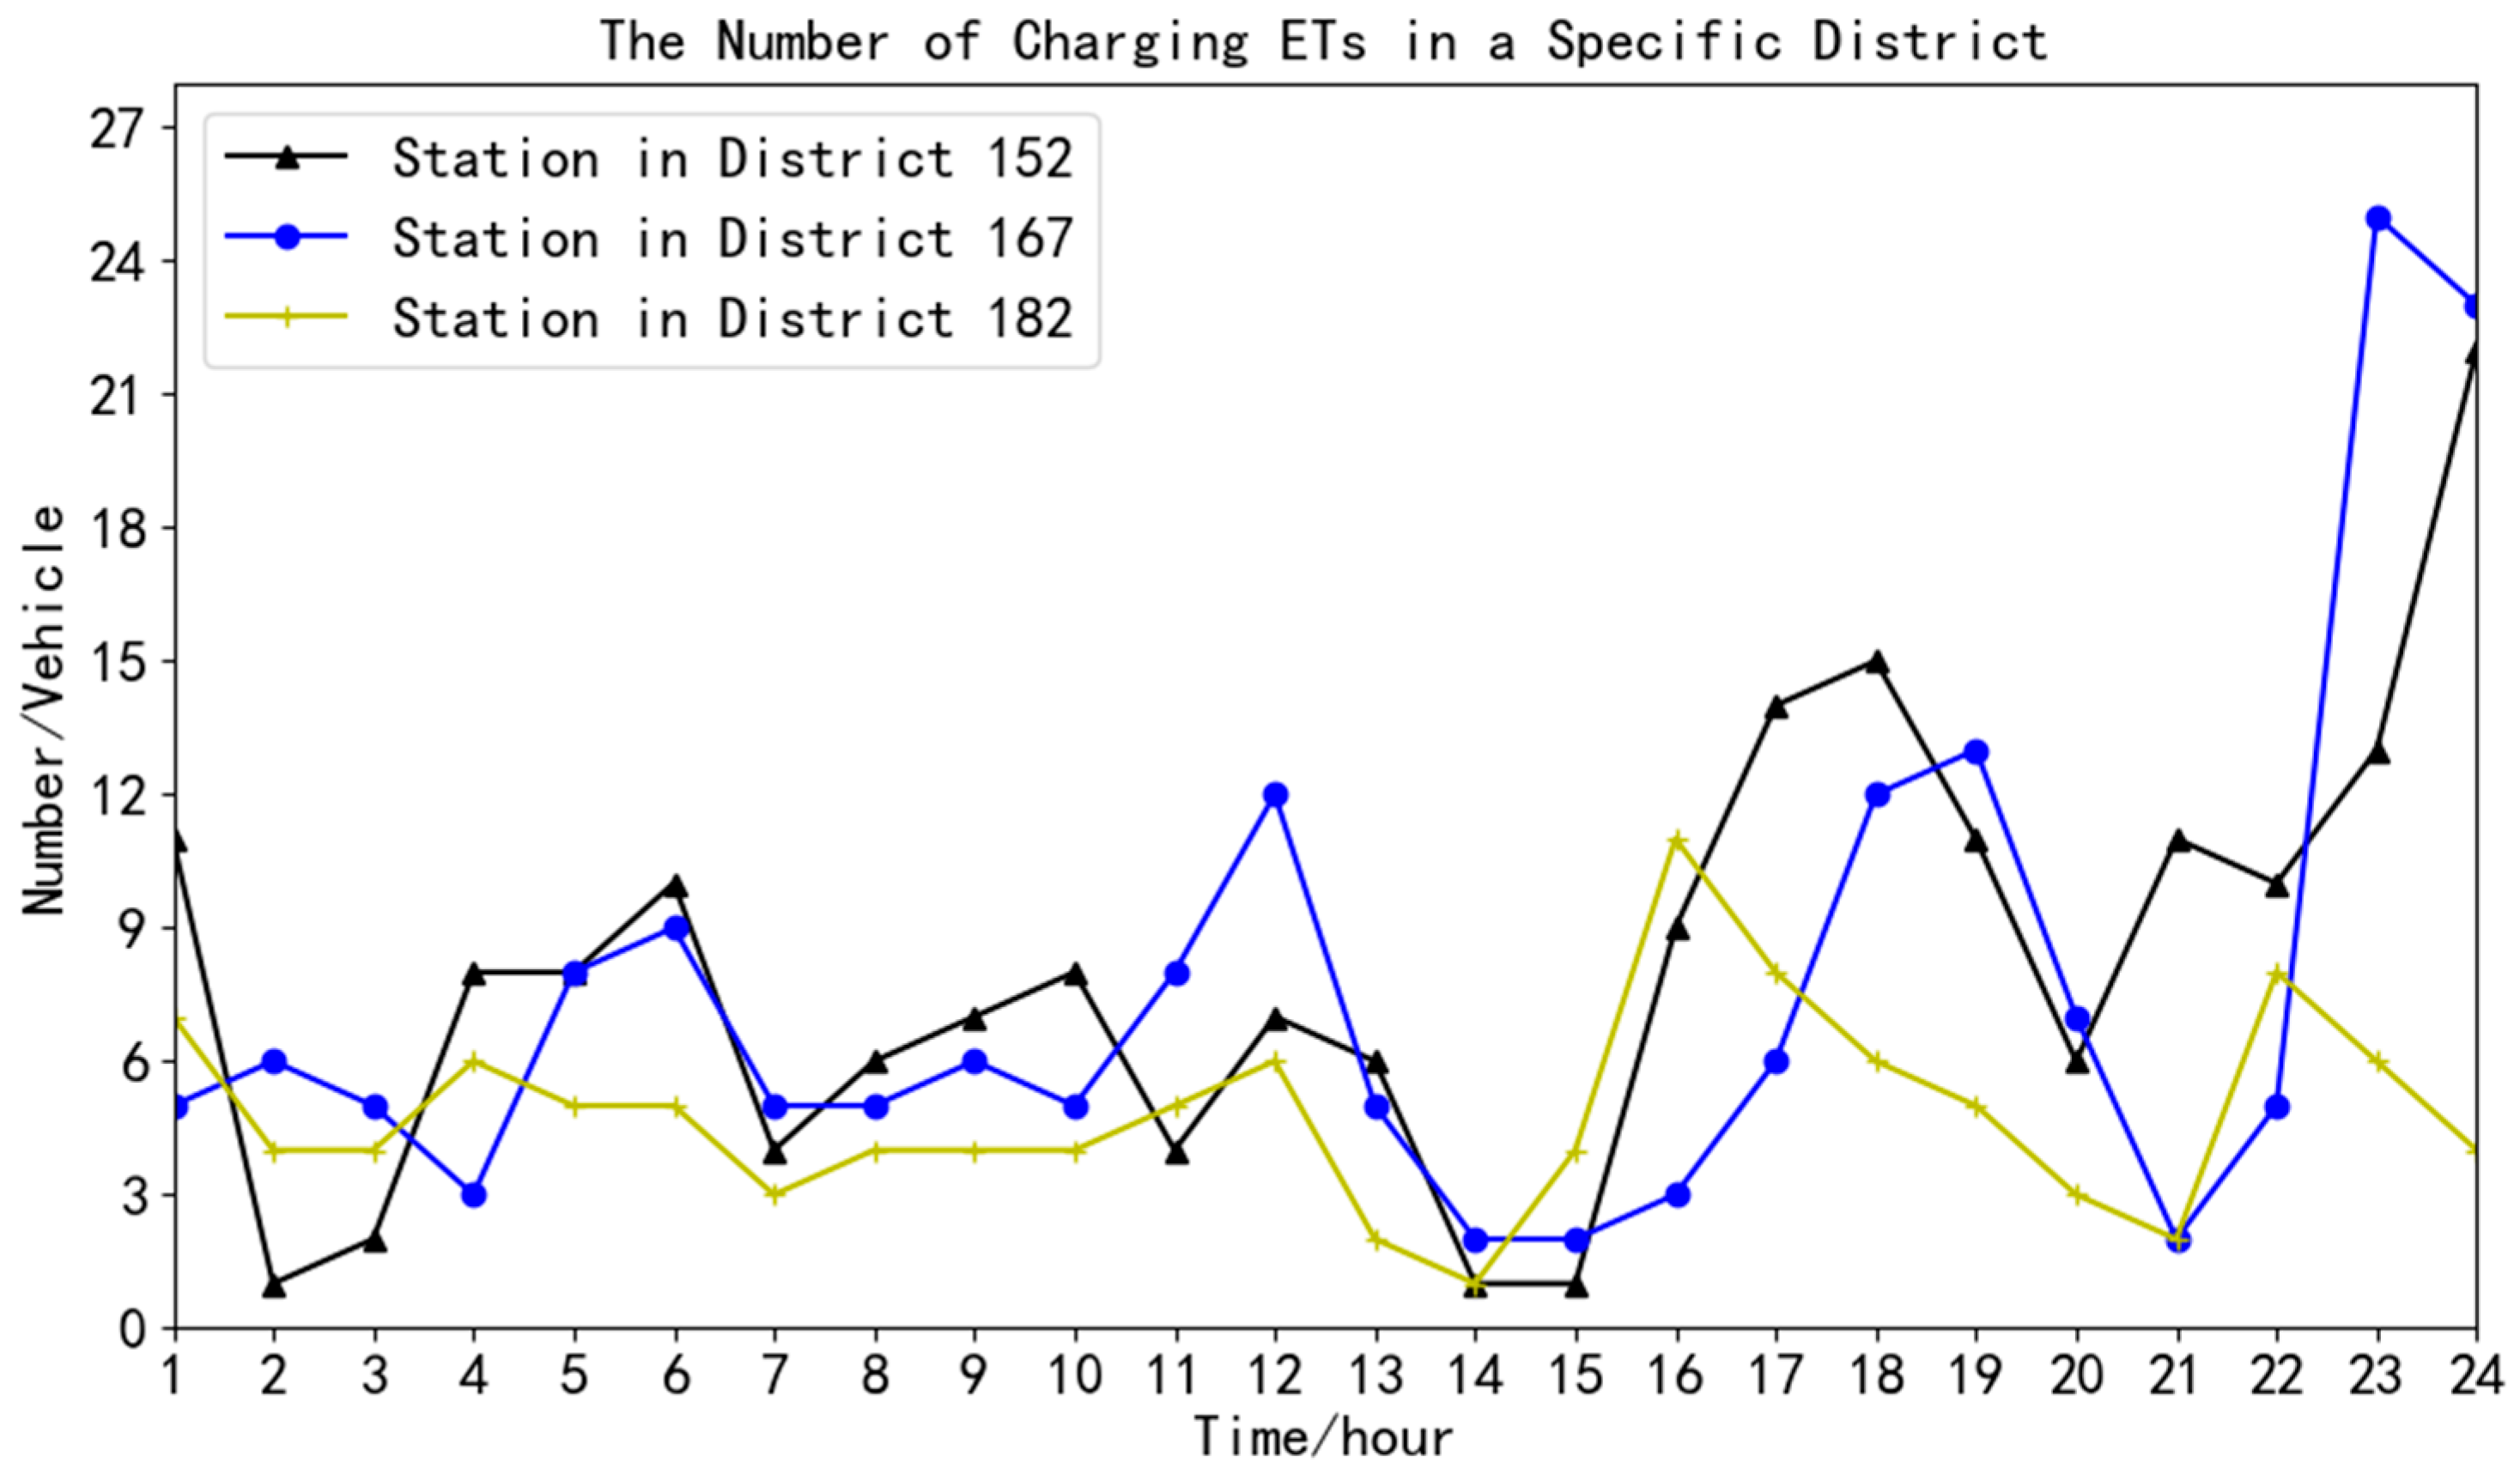
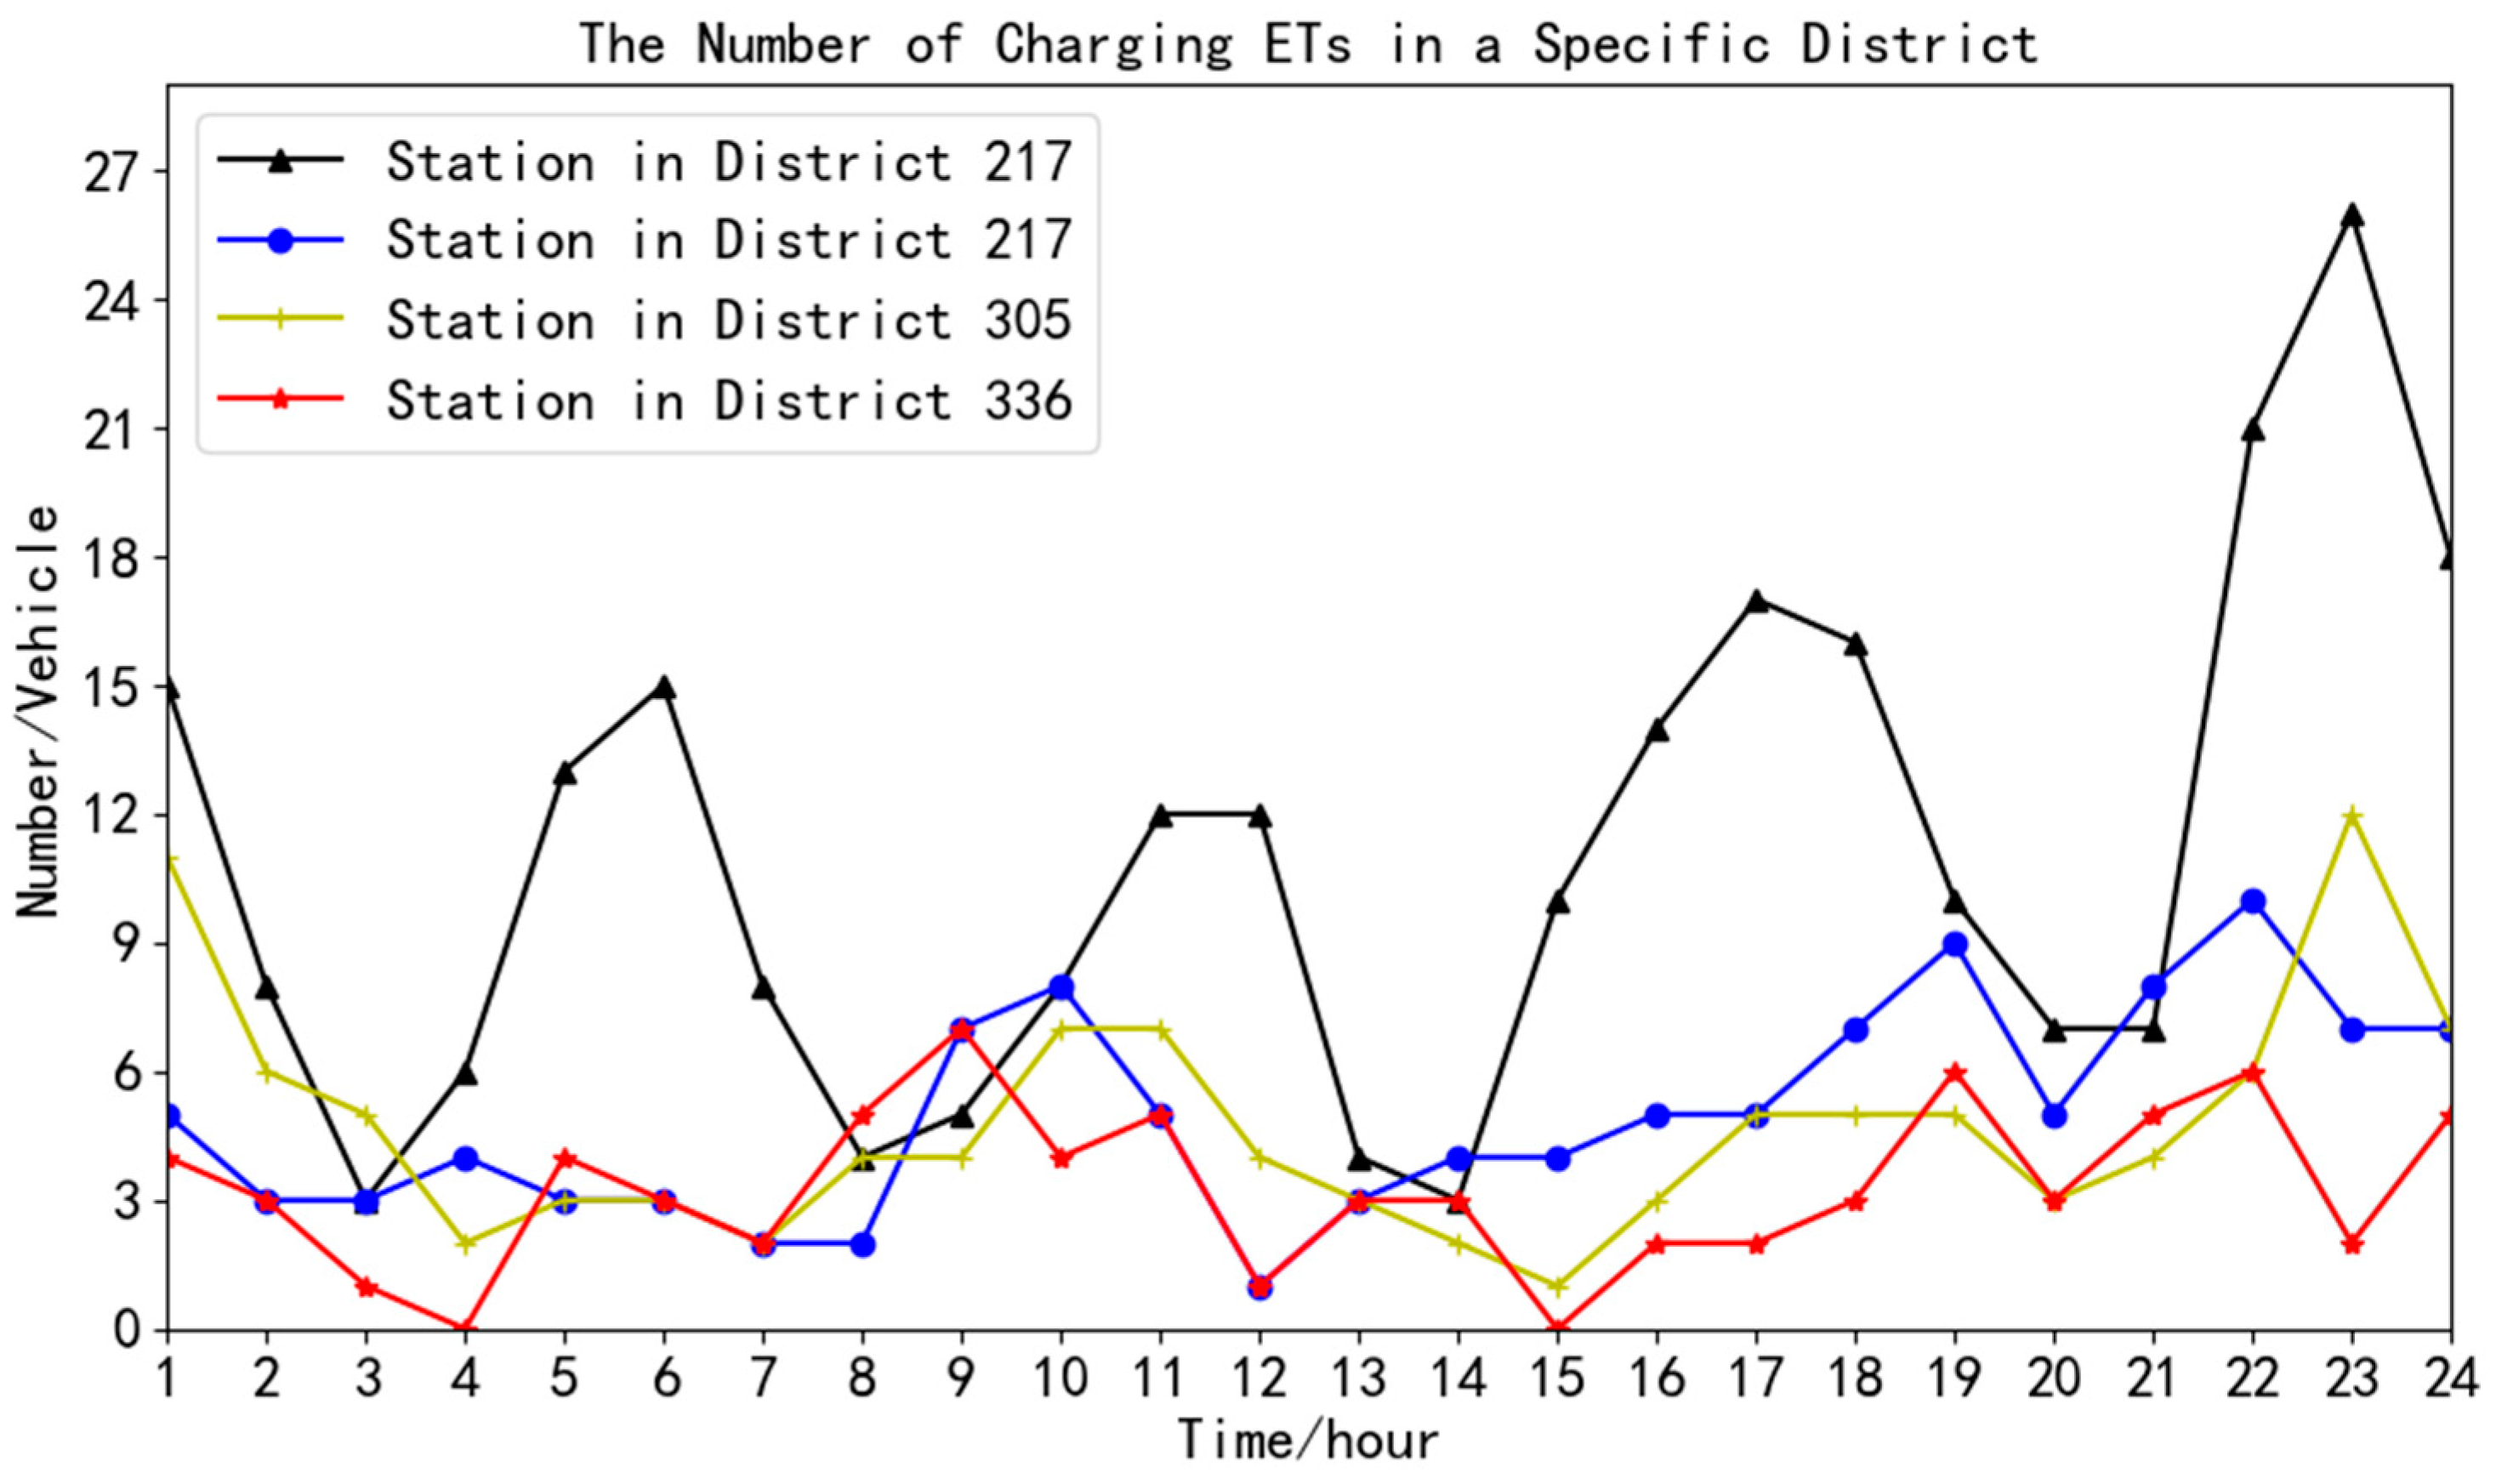
4.4. Case Result
5. Conclusions
- (1)
- The logit model was previously used in research related to geography and population. In this paper, it is used in the driver’s destination selection, which has strong practical significance.
- (2)
- Compared to the traditional method in Appendix B, the method we proposed in this paper can reduce calculation cost better based upon a greater extent of the division of the area.
- (3)
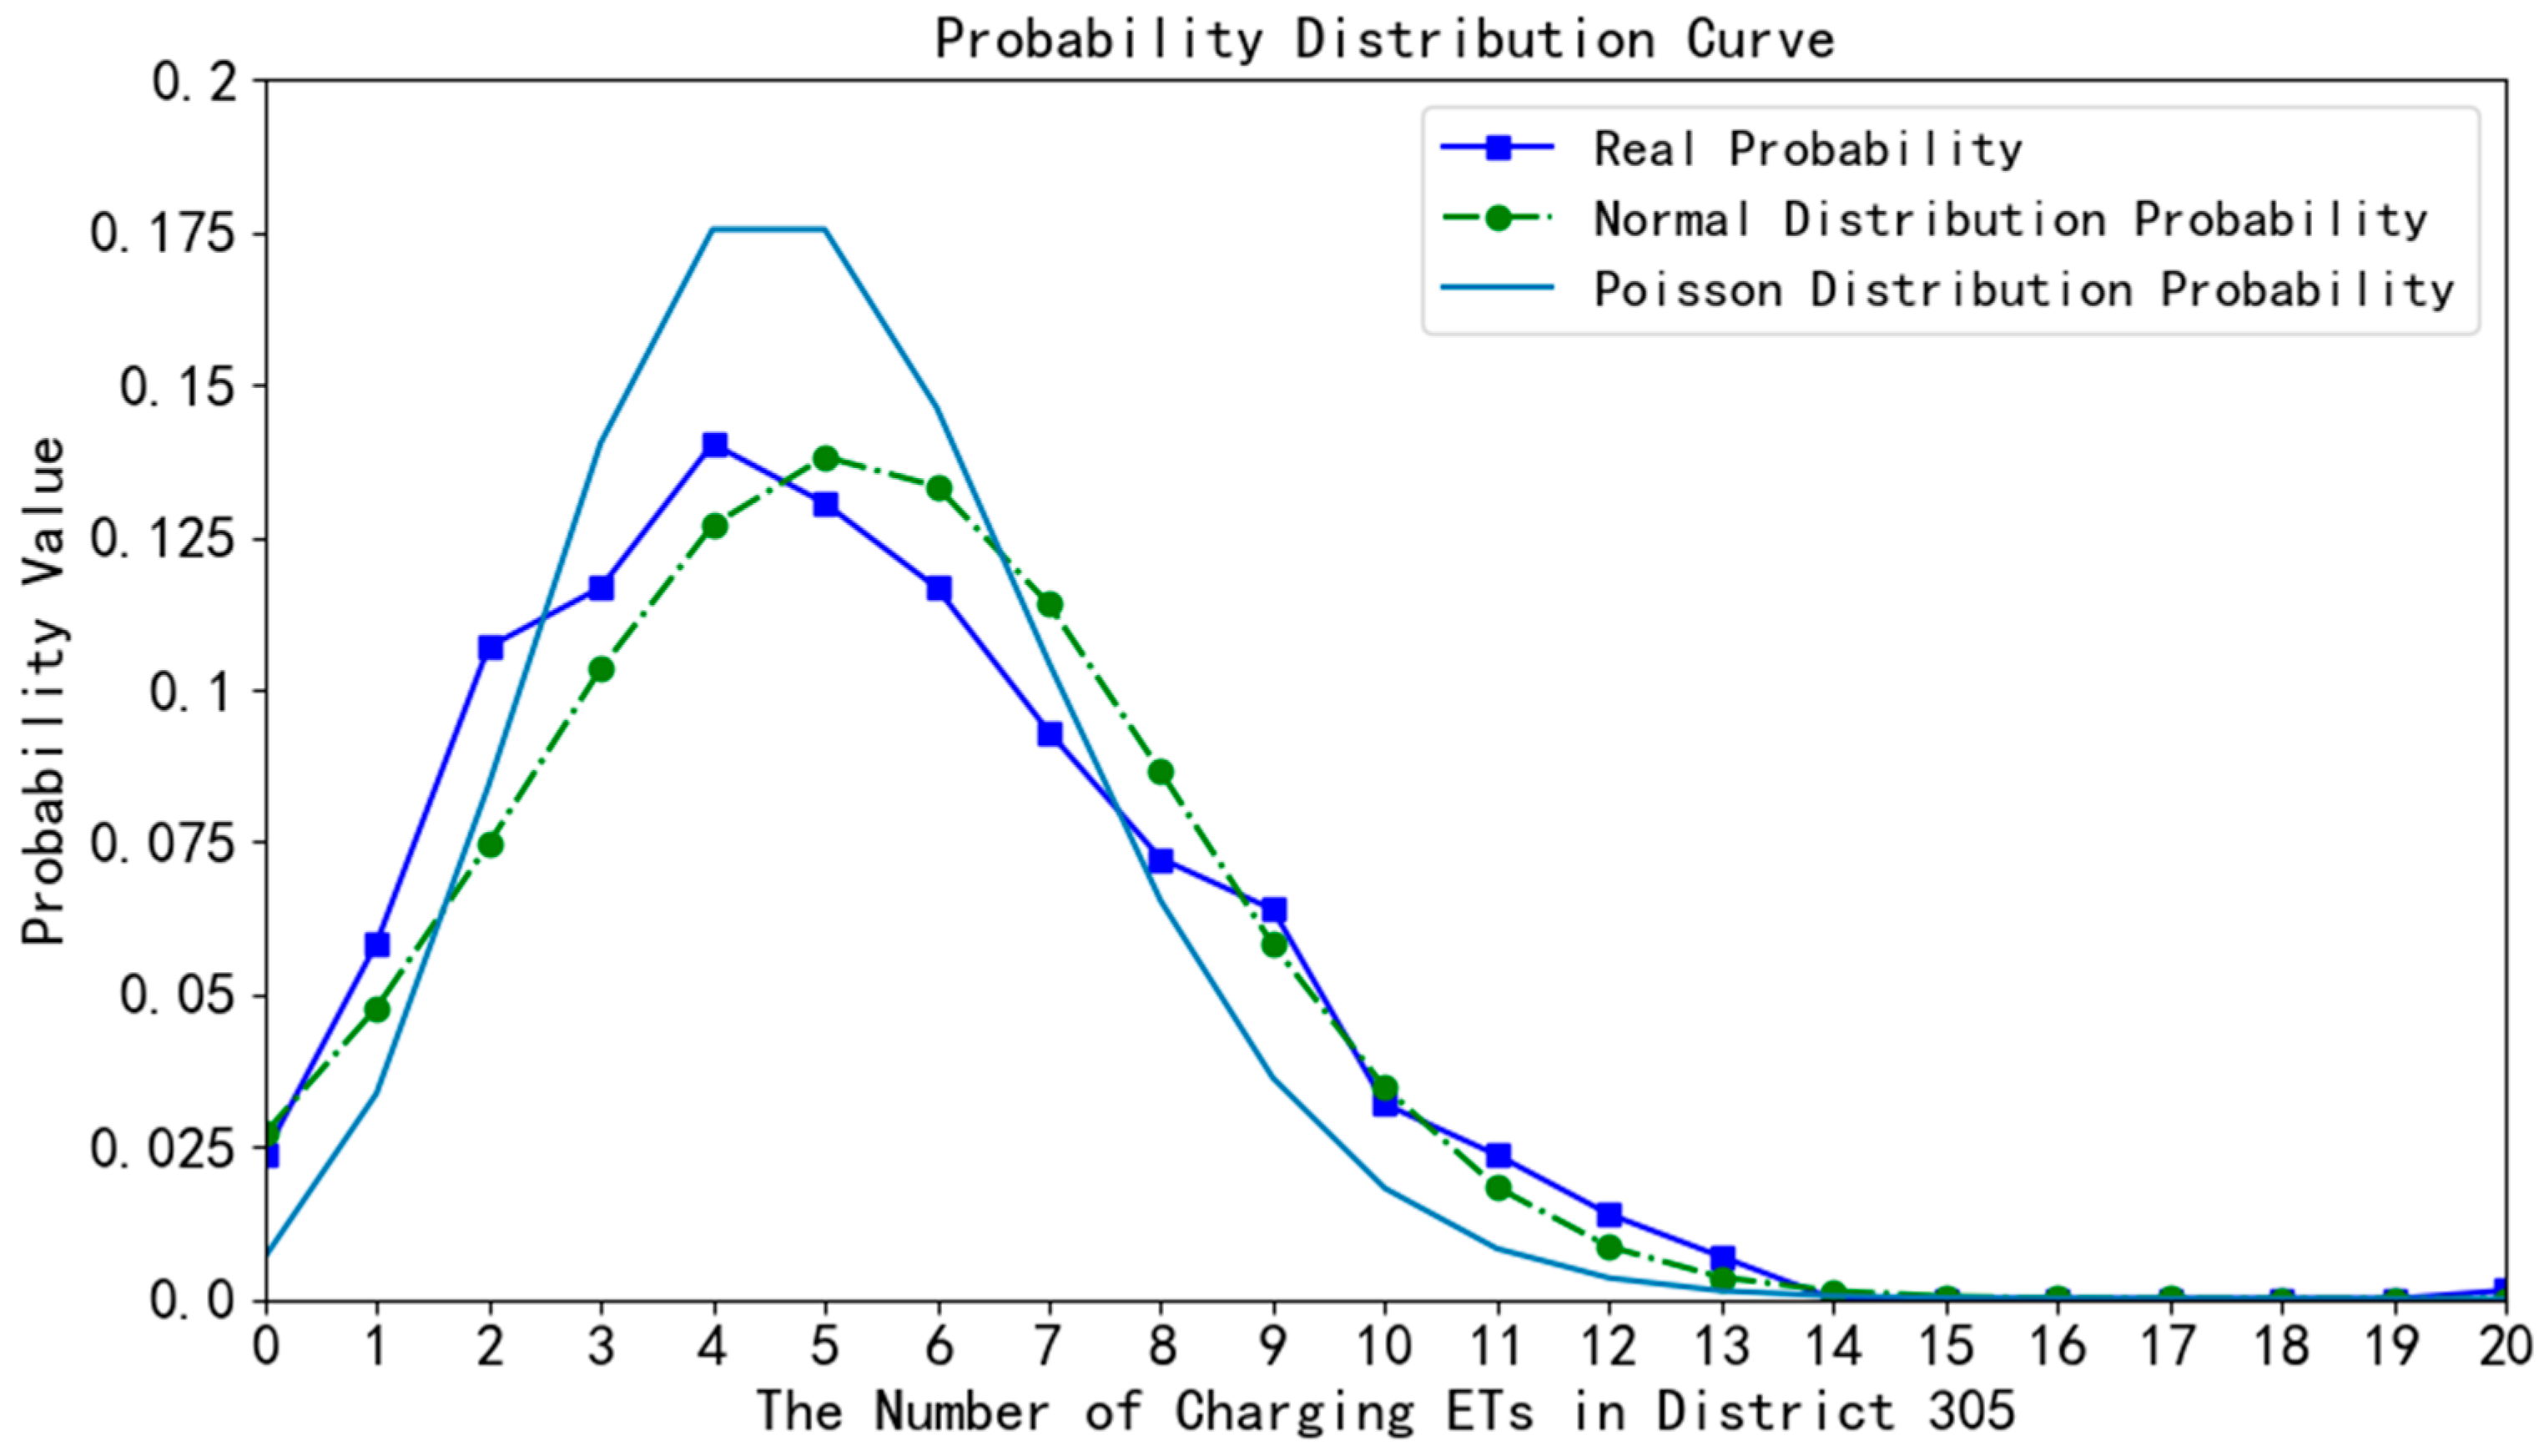
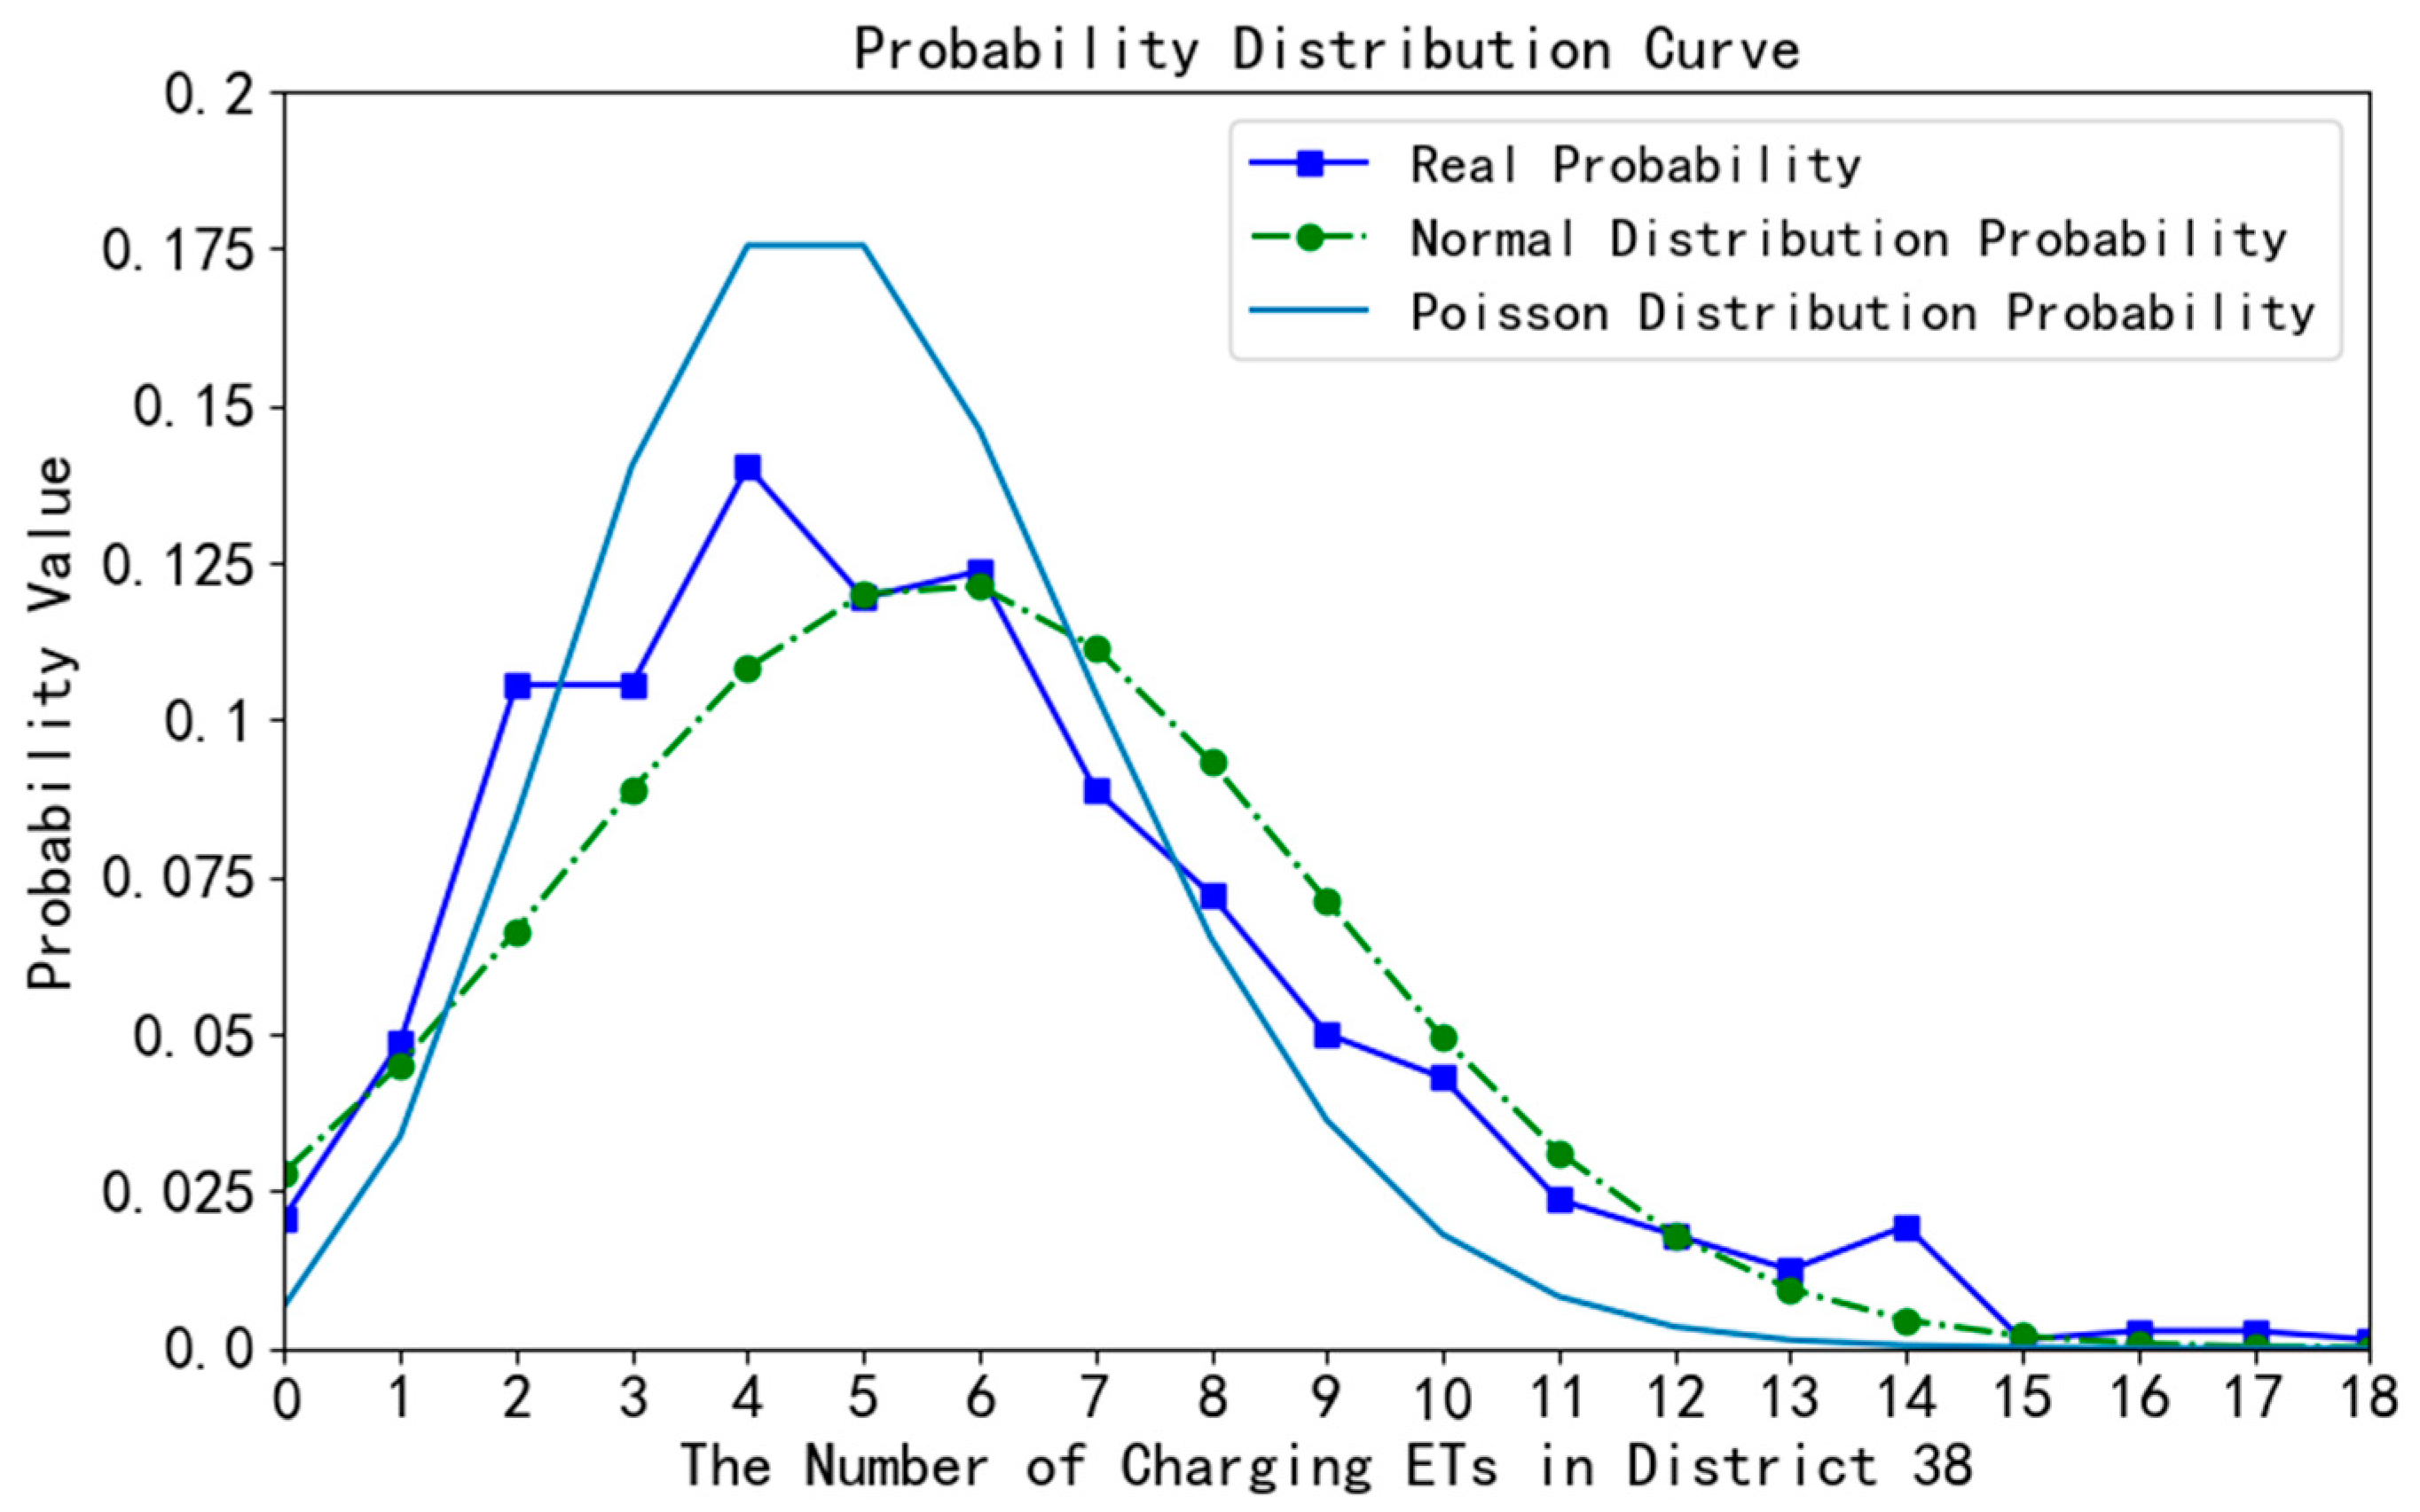
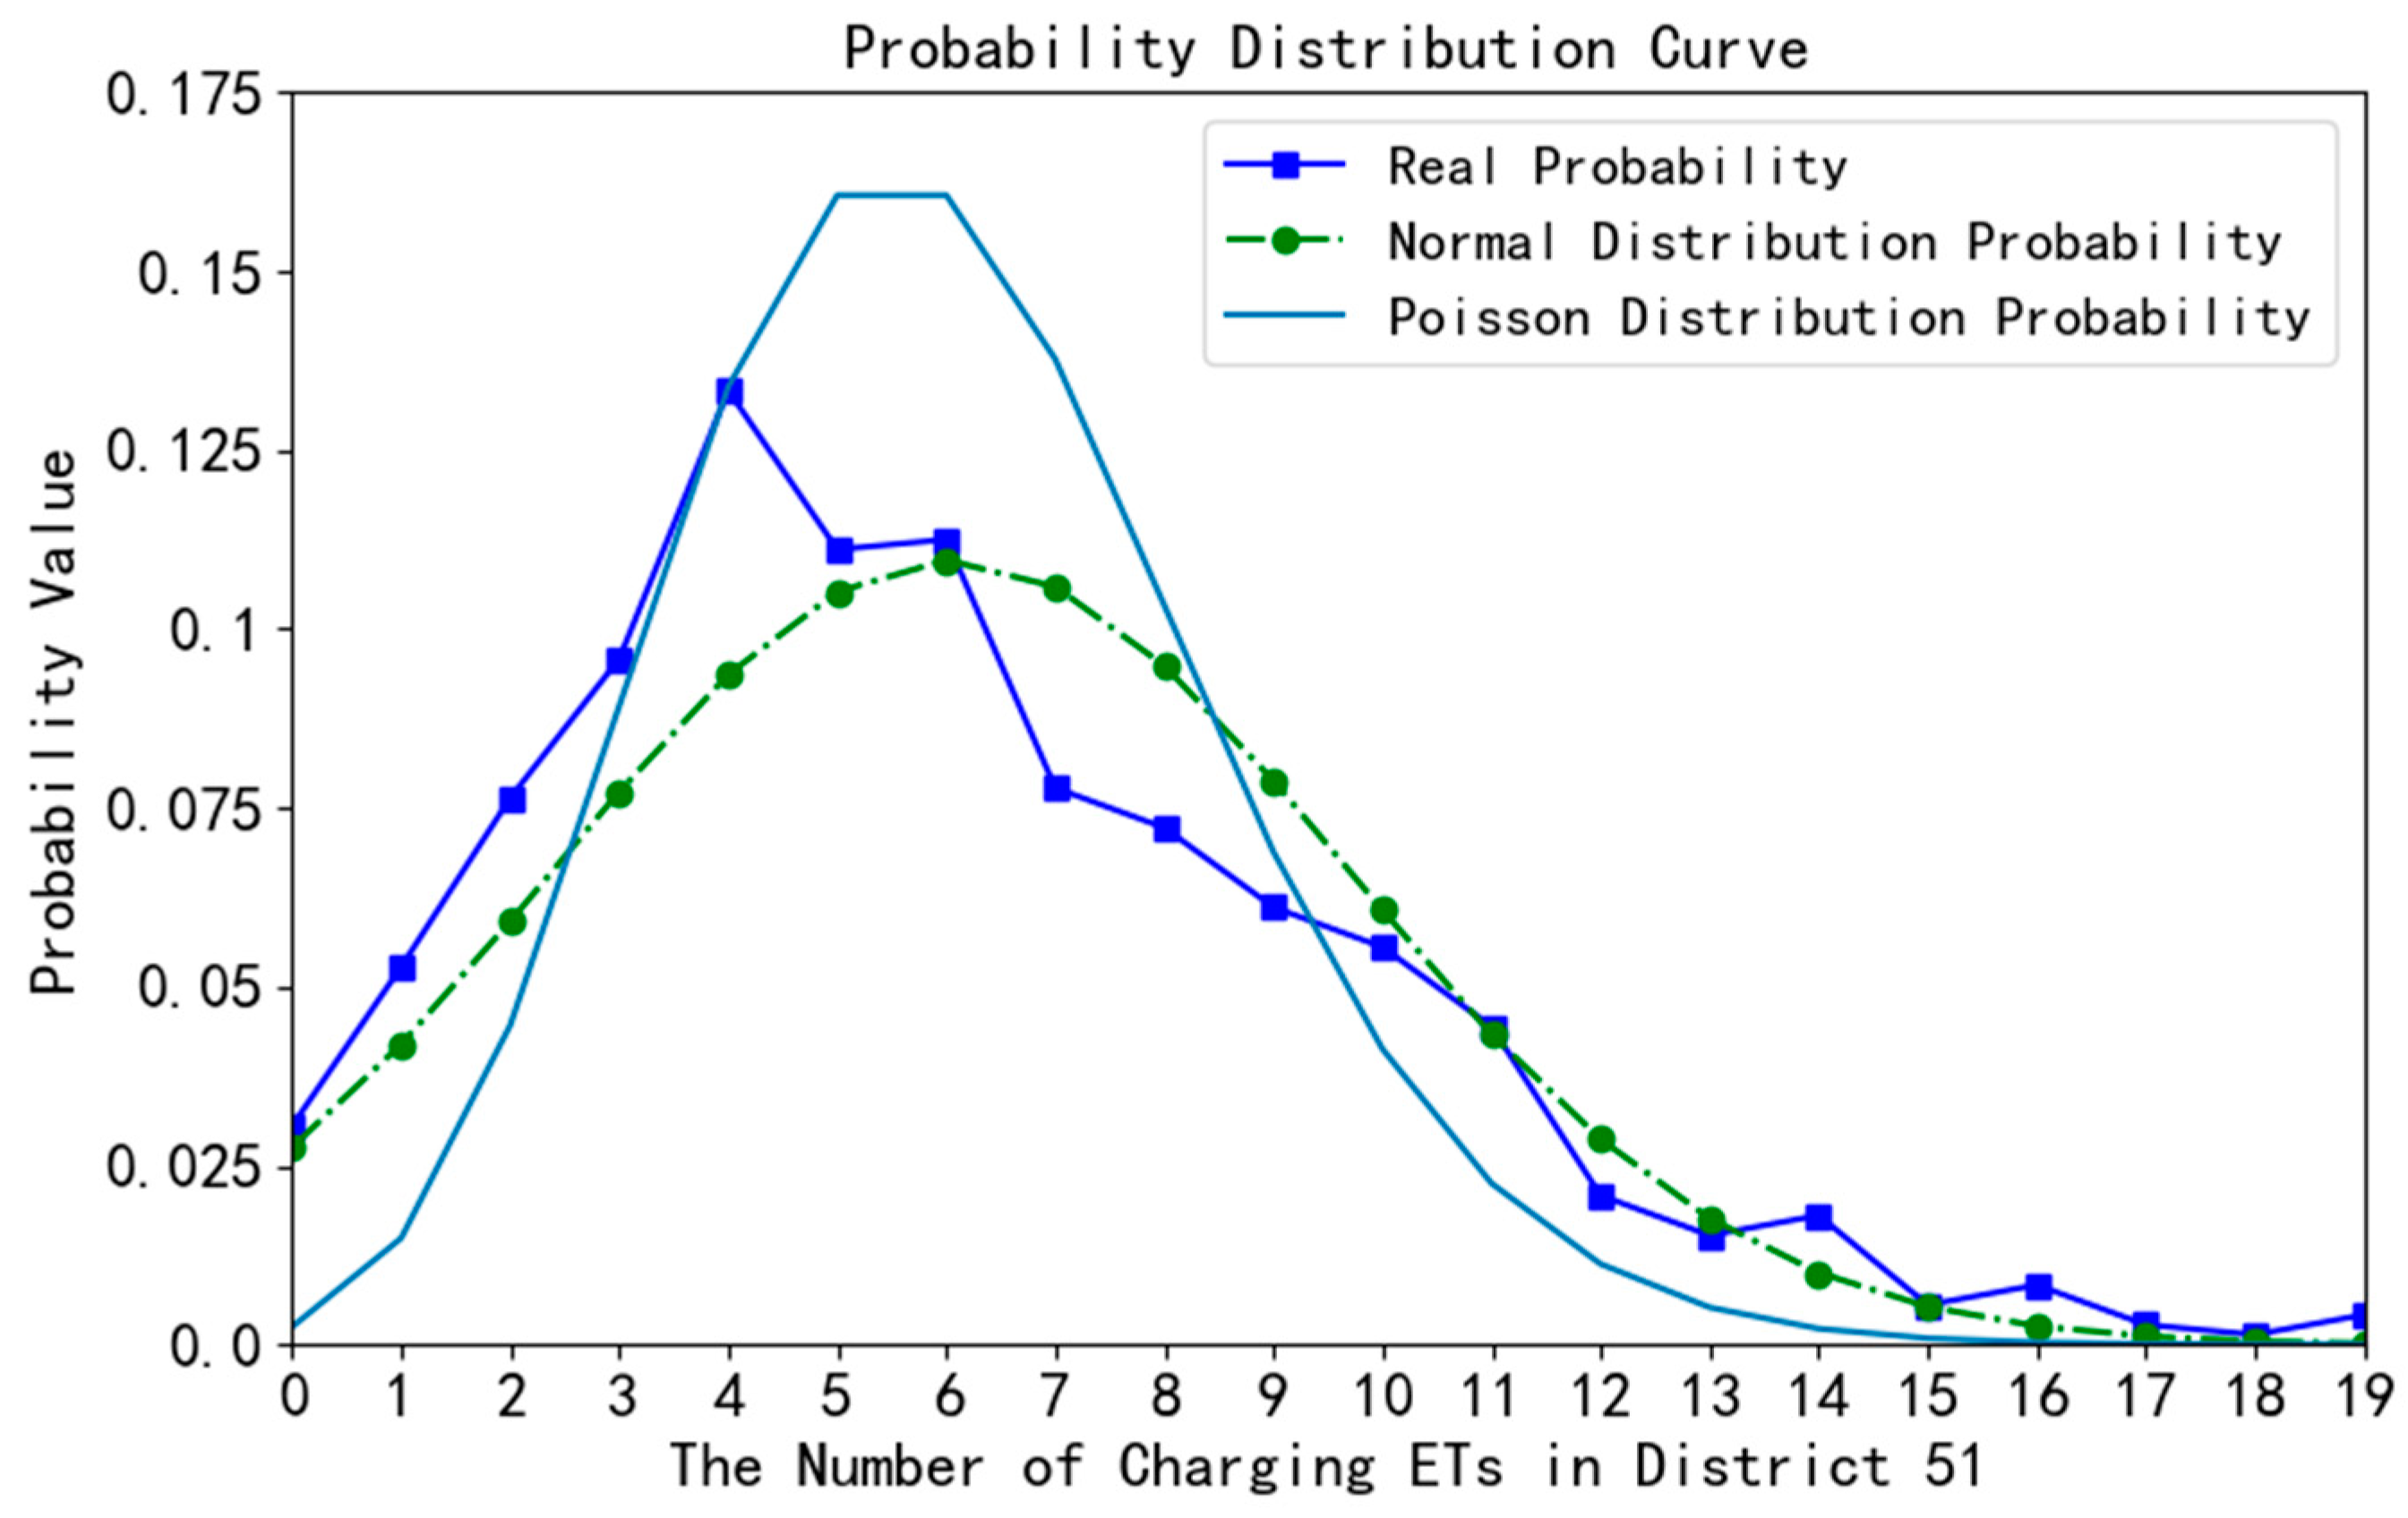
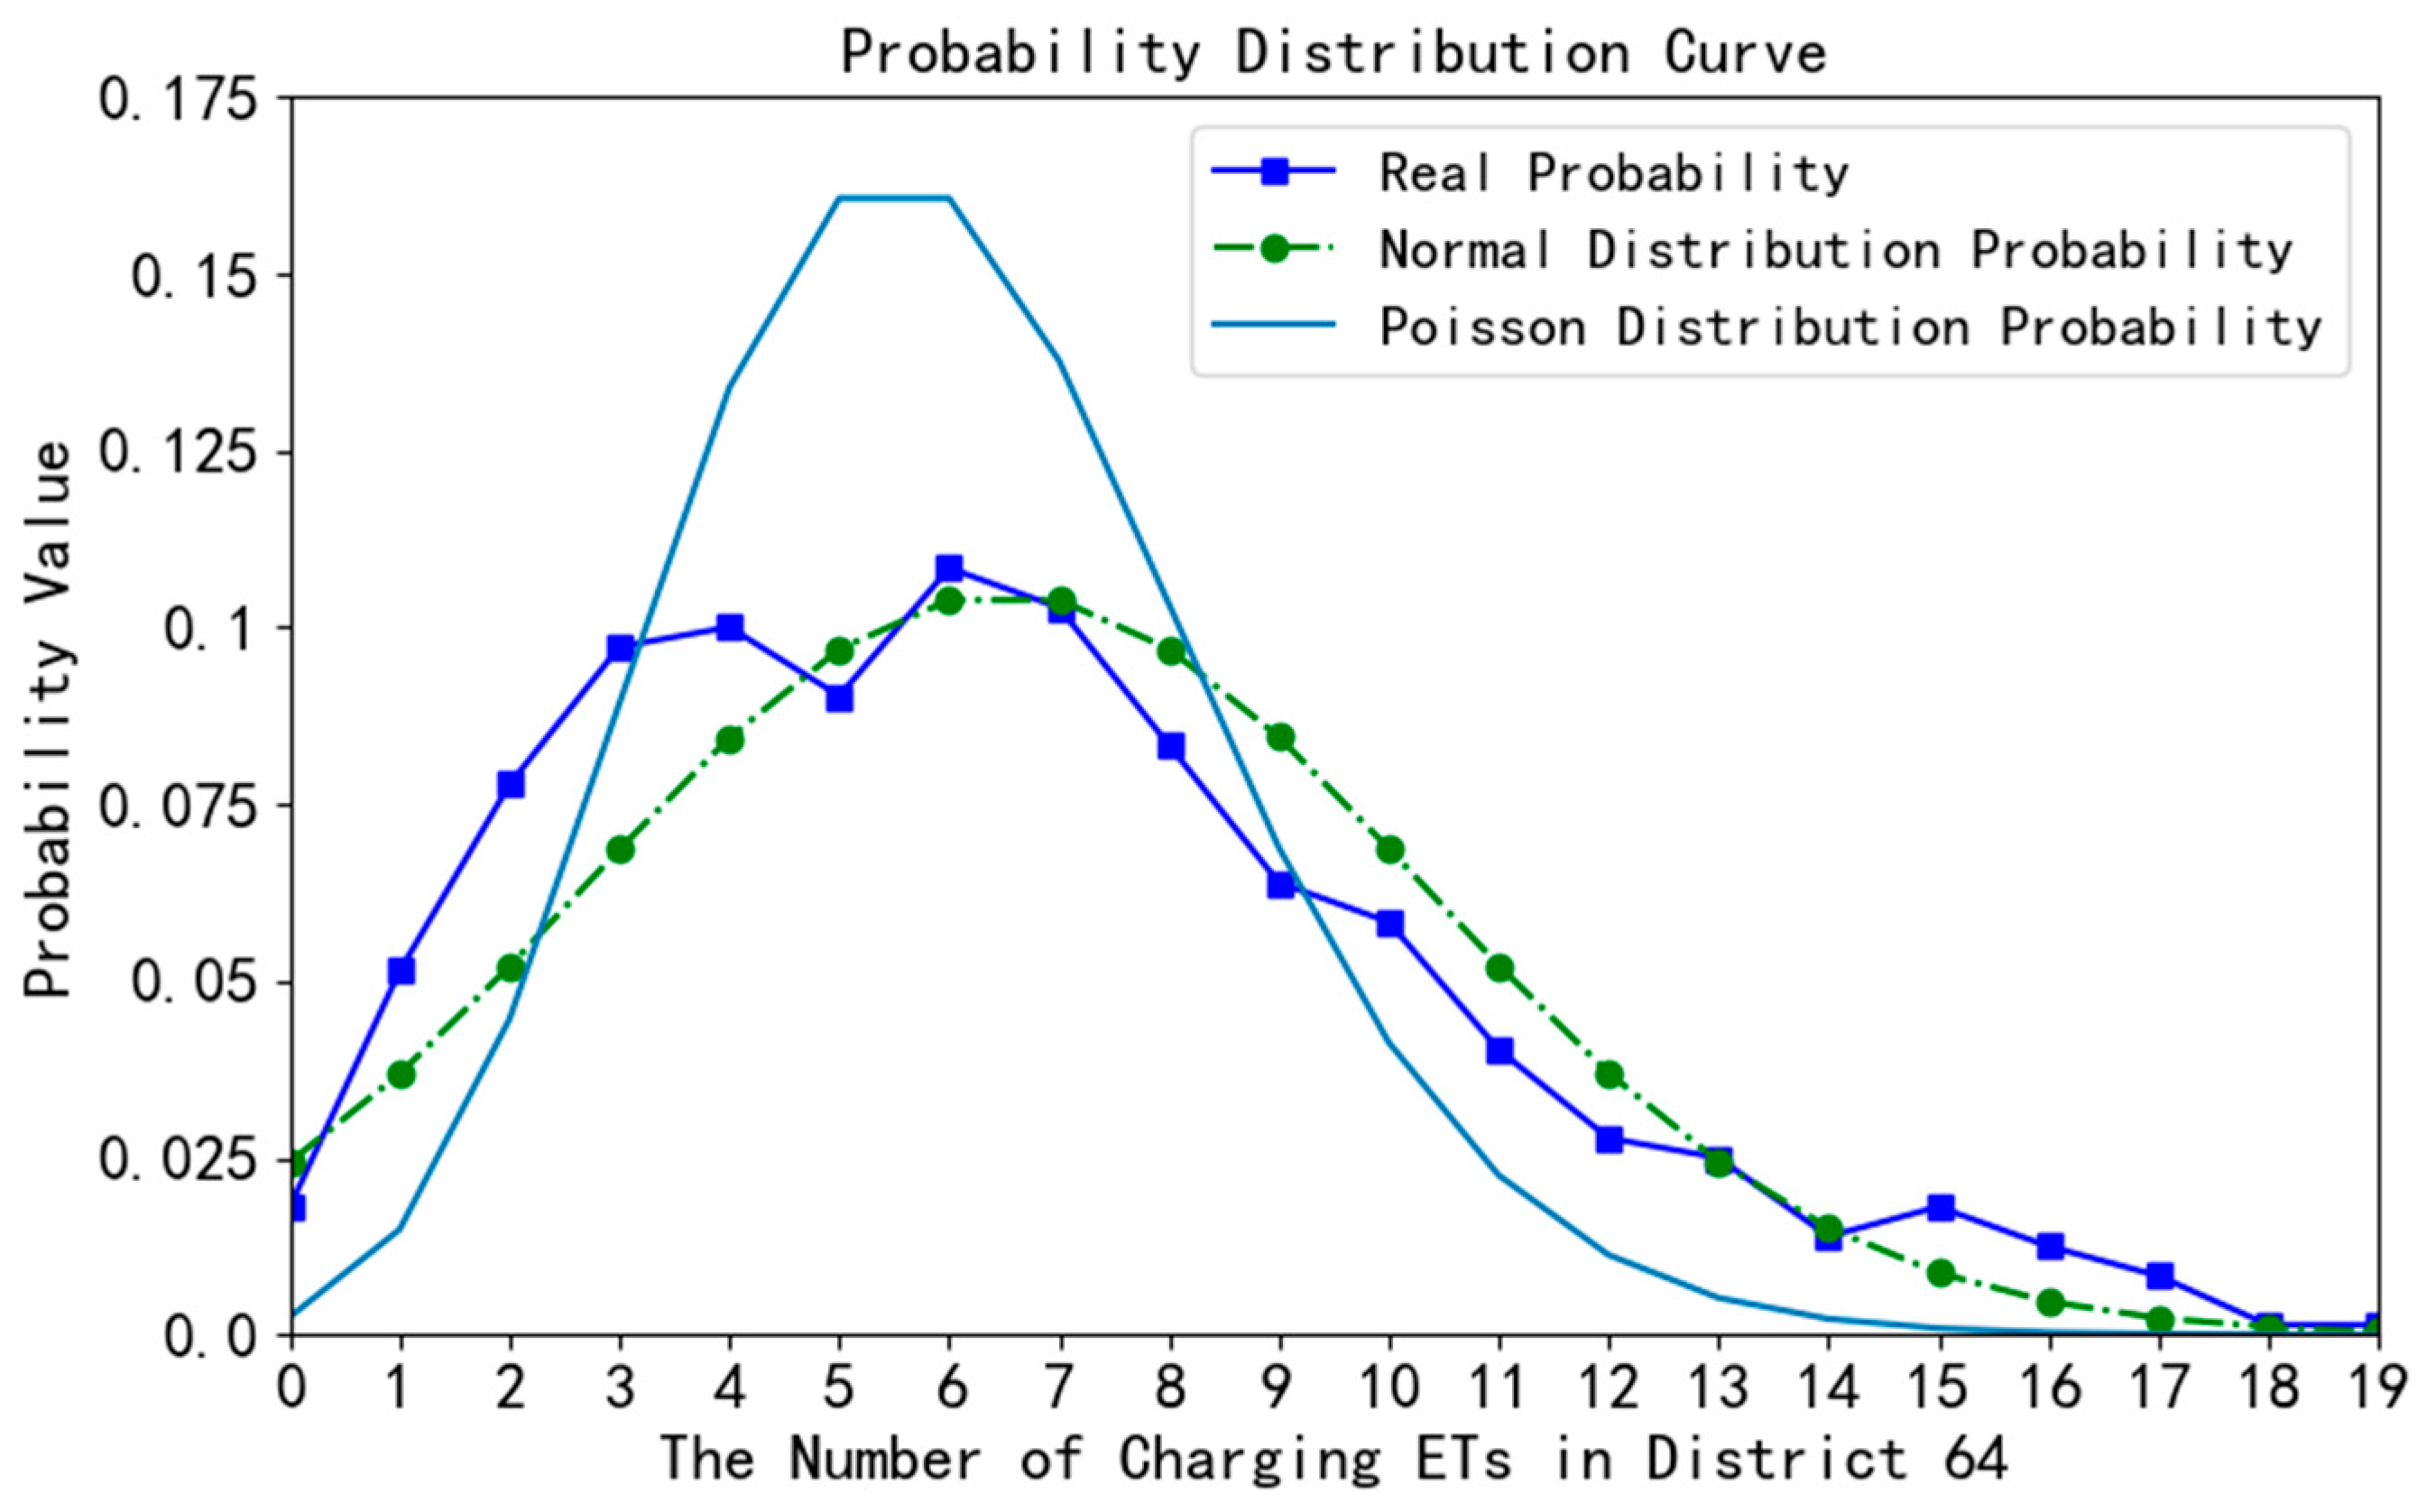
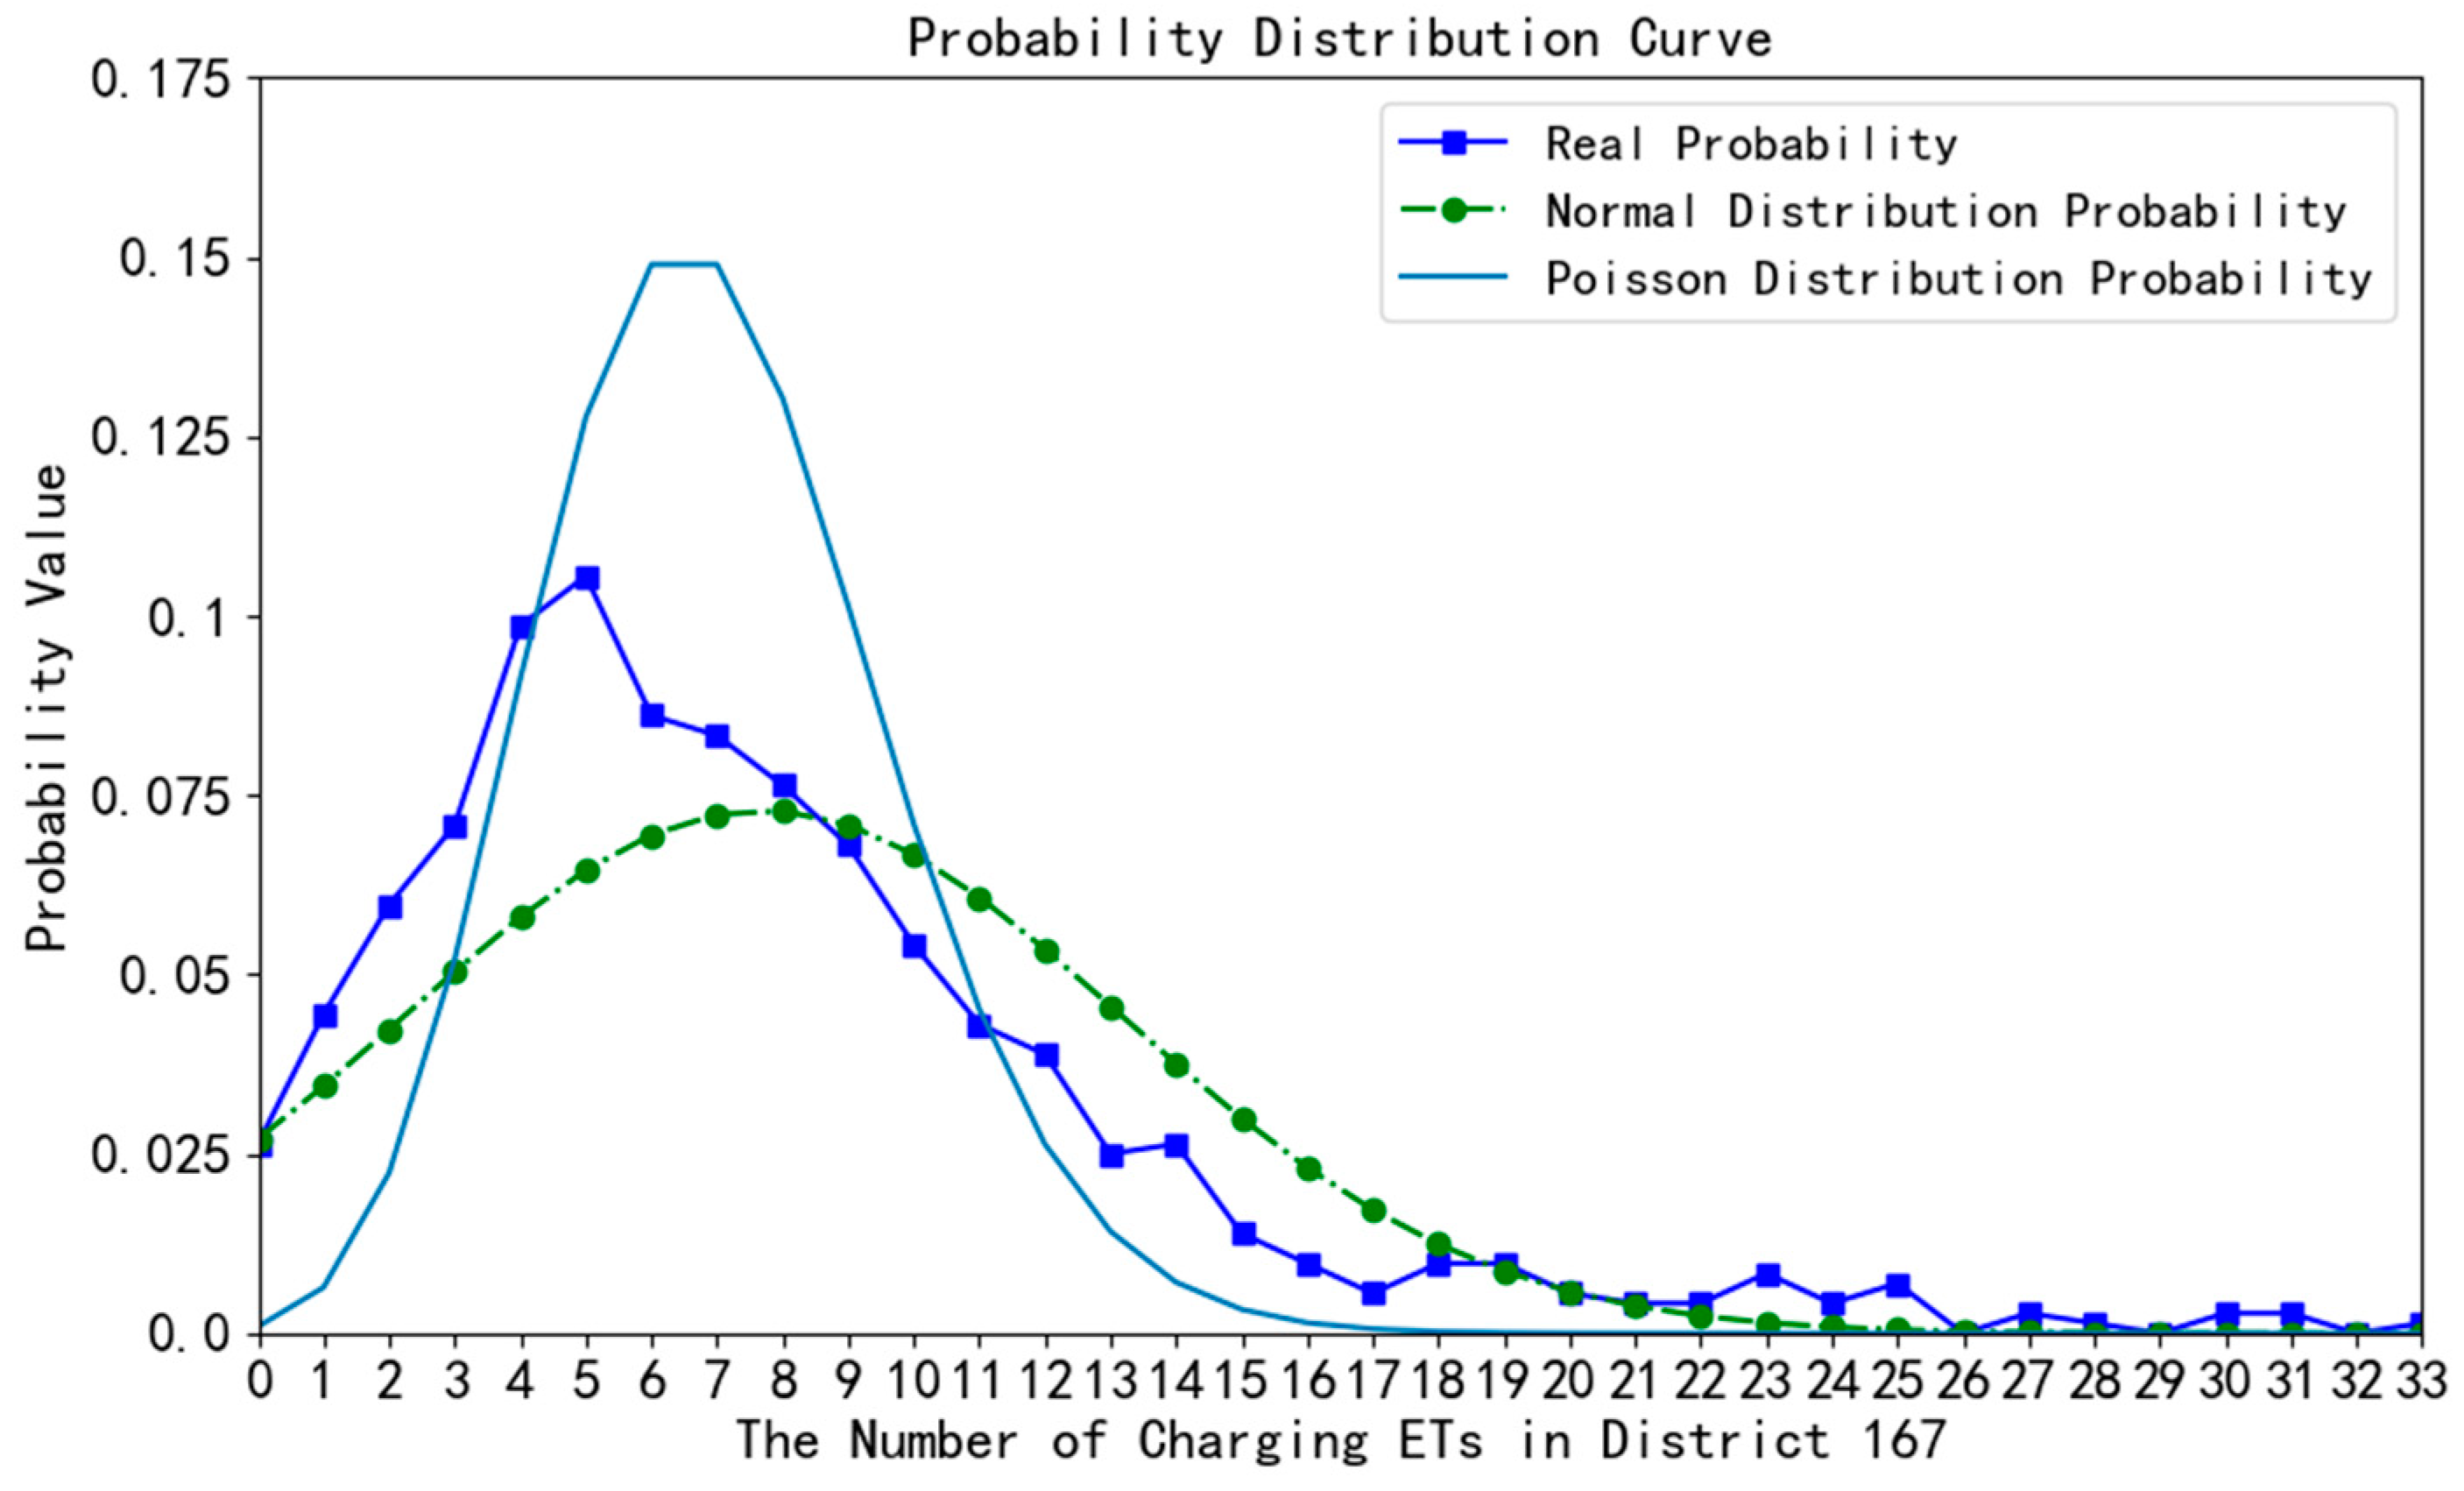
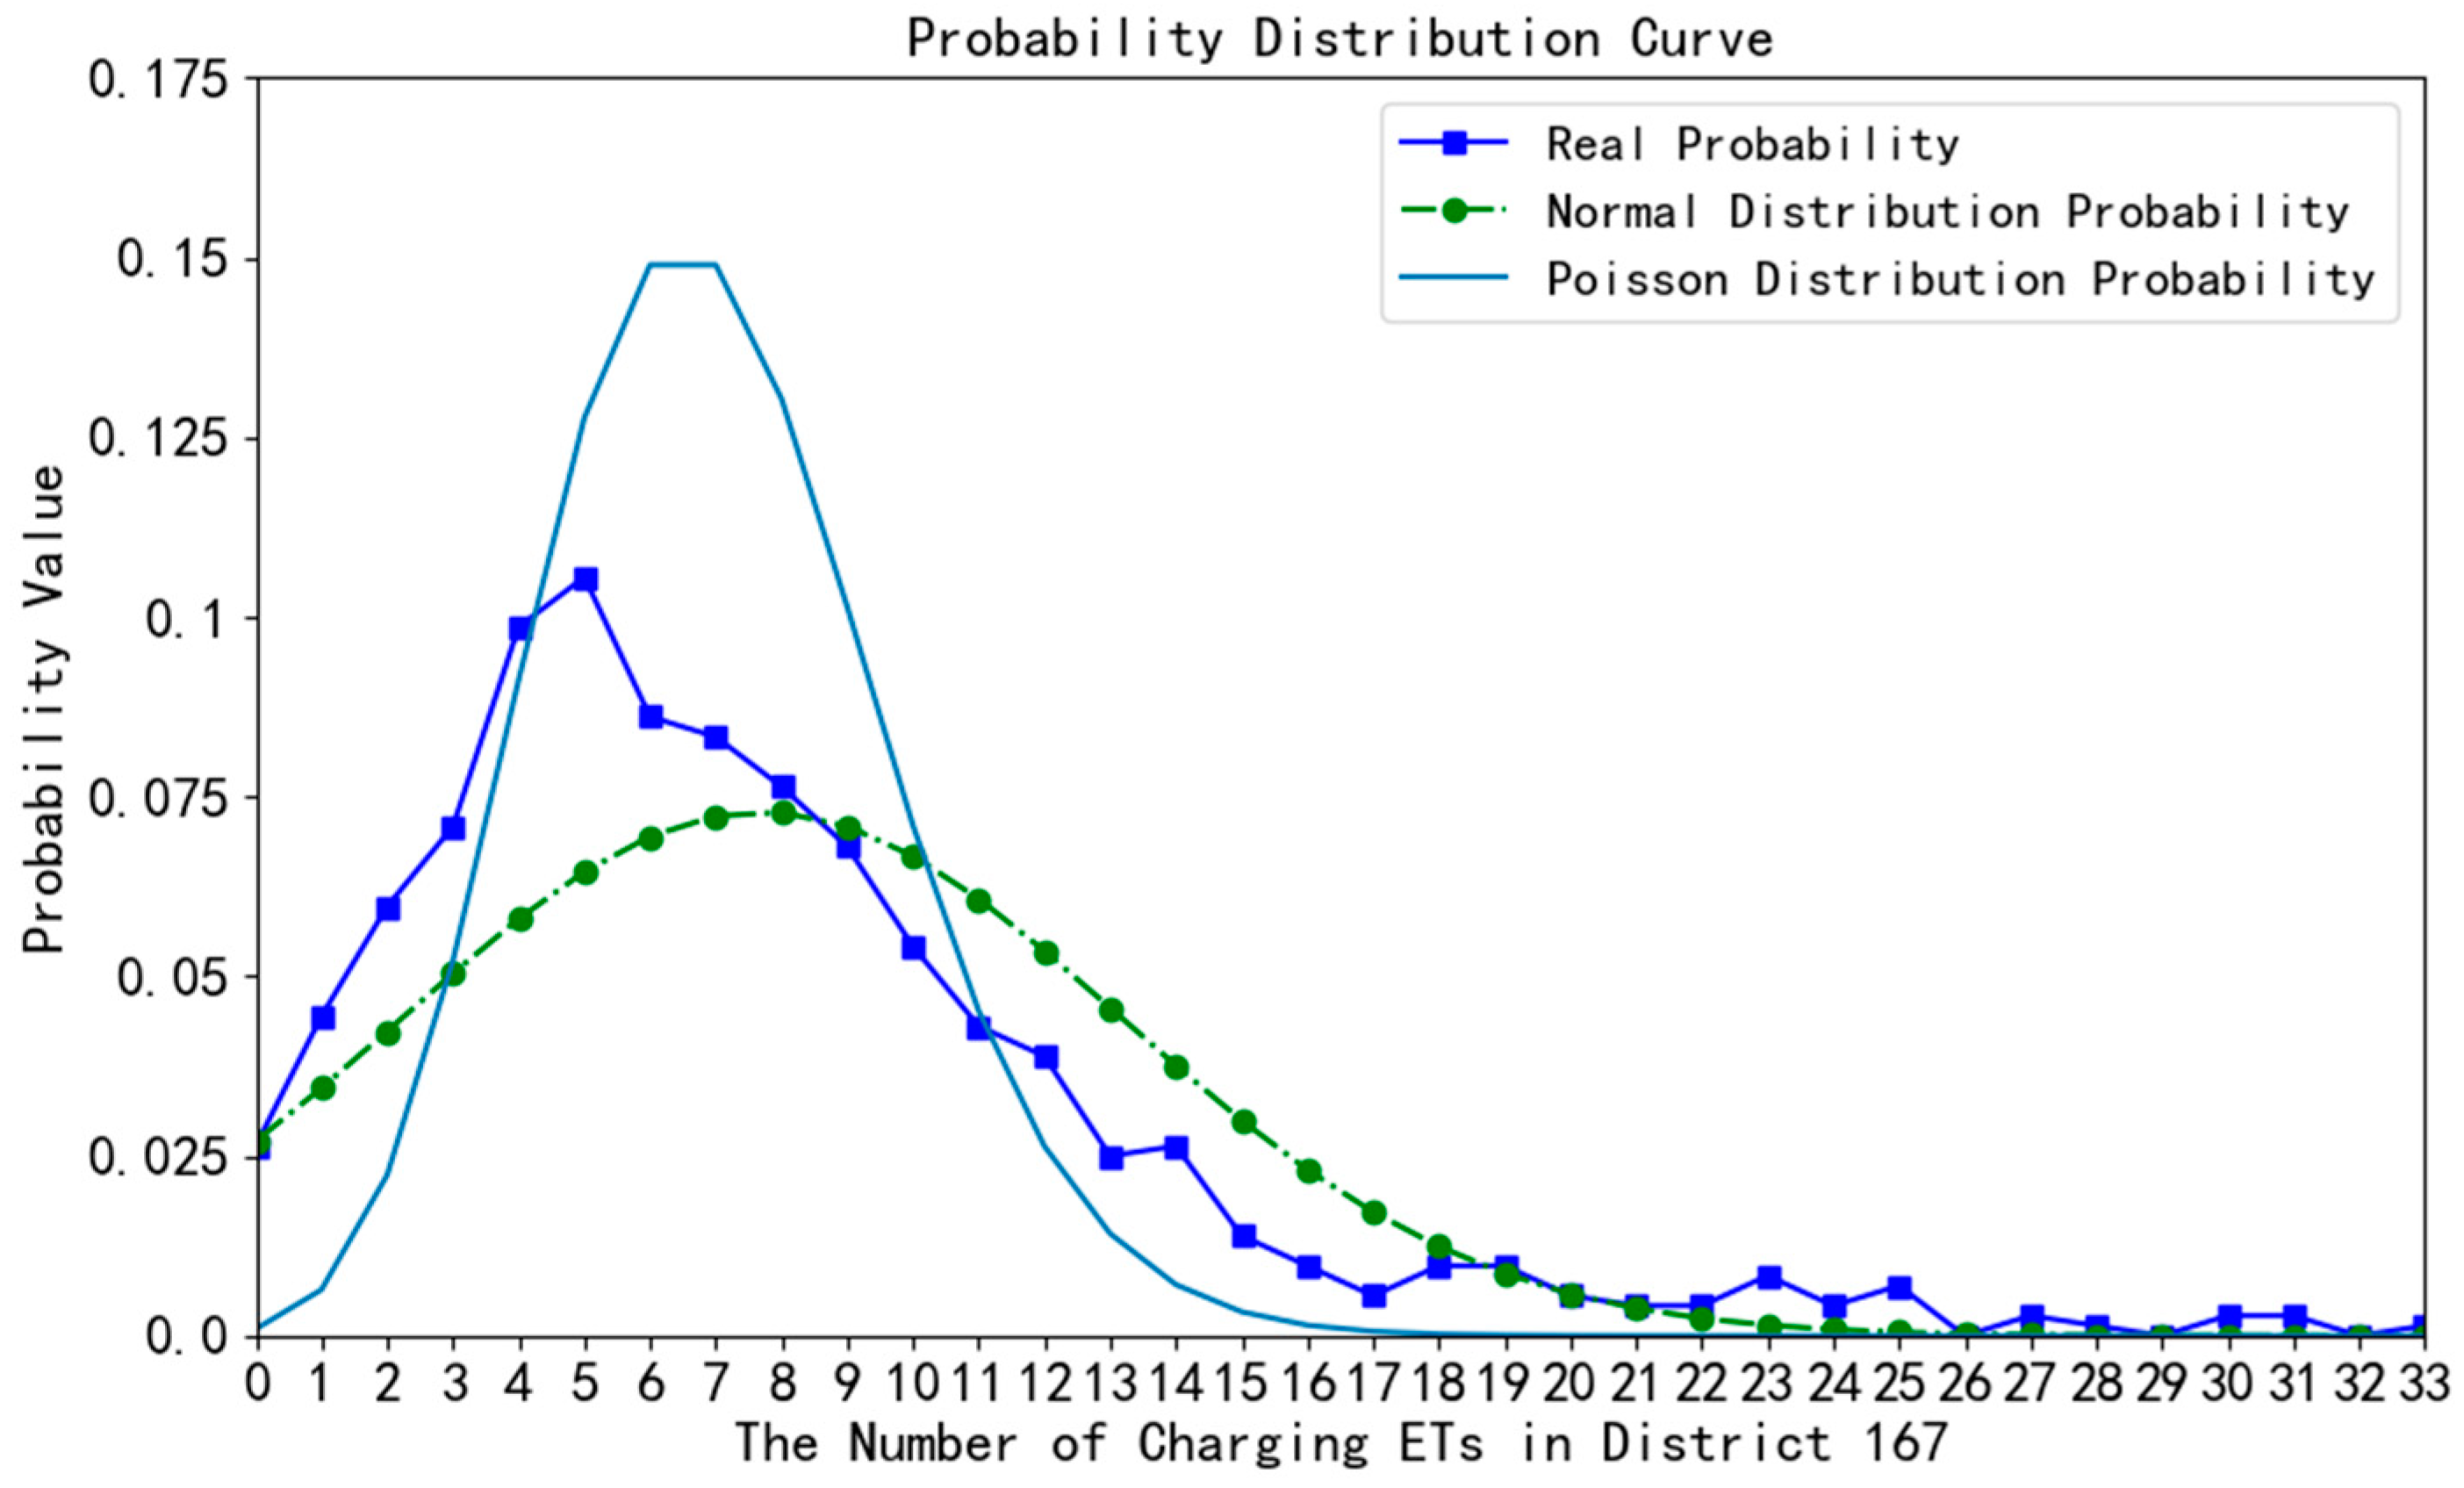
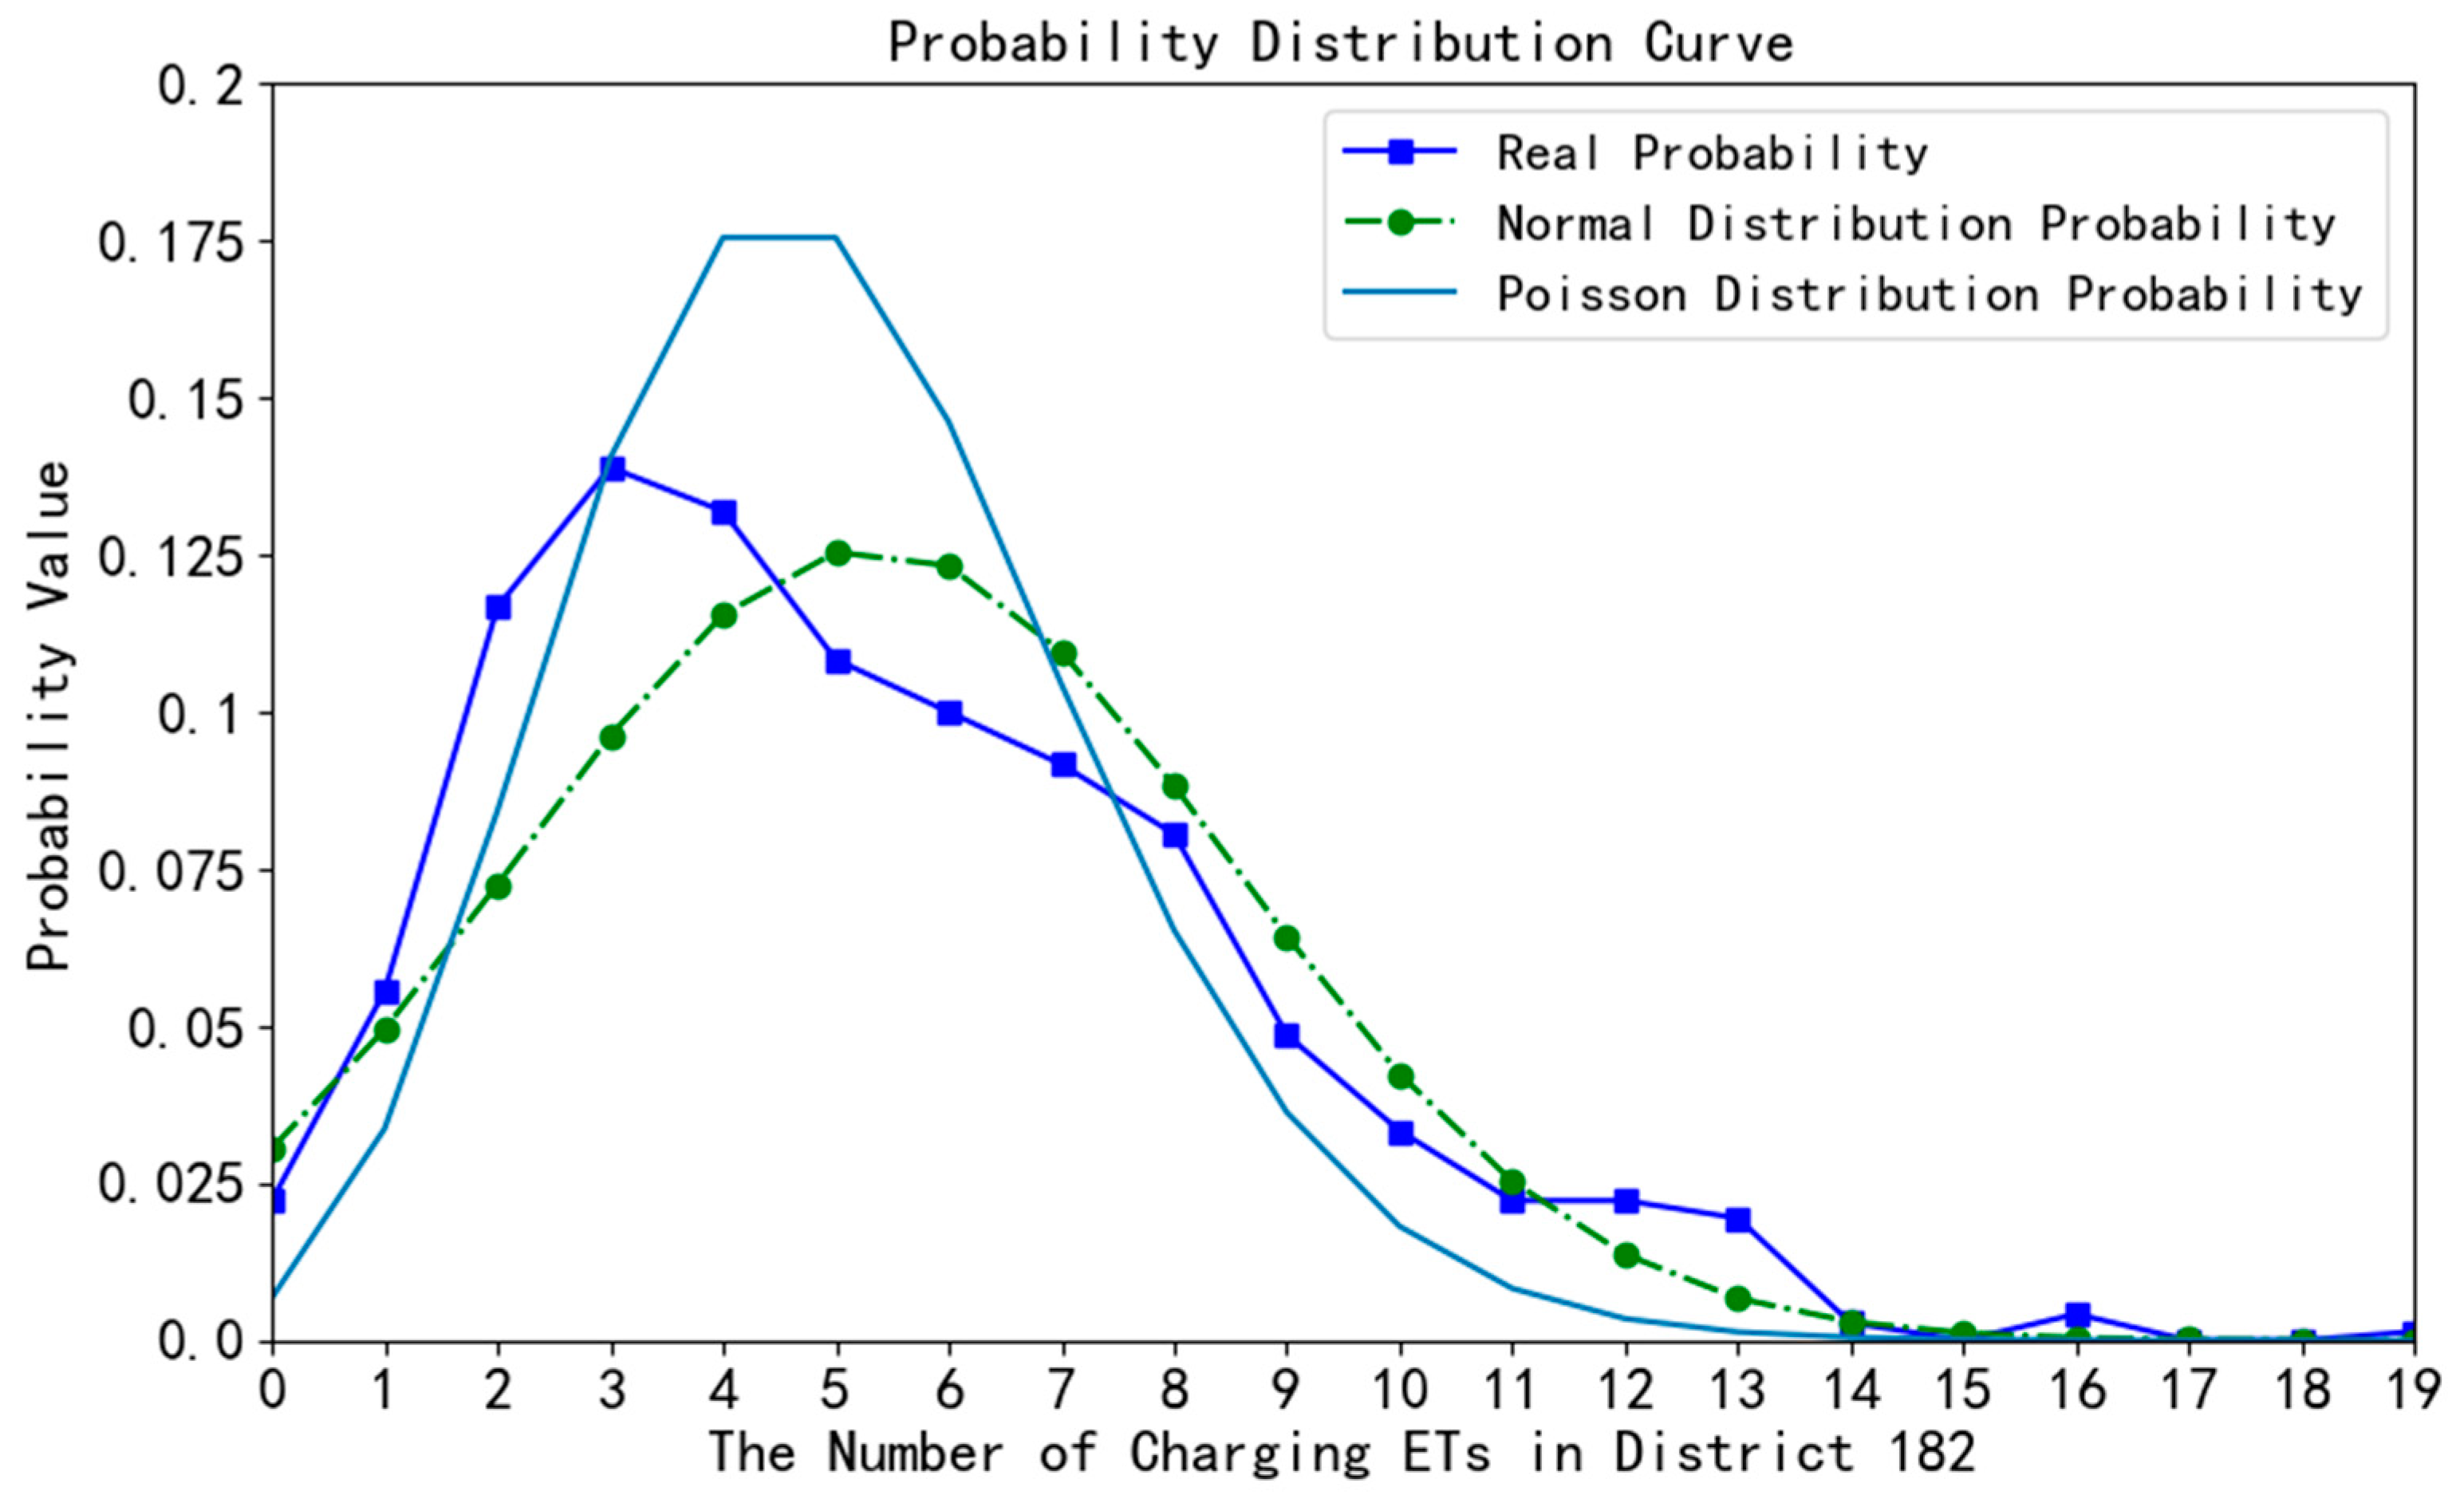
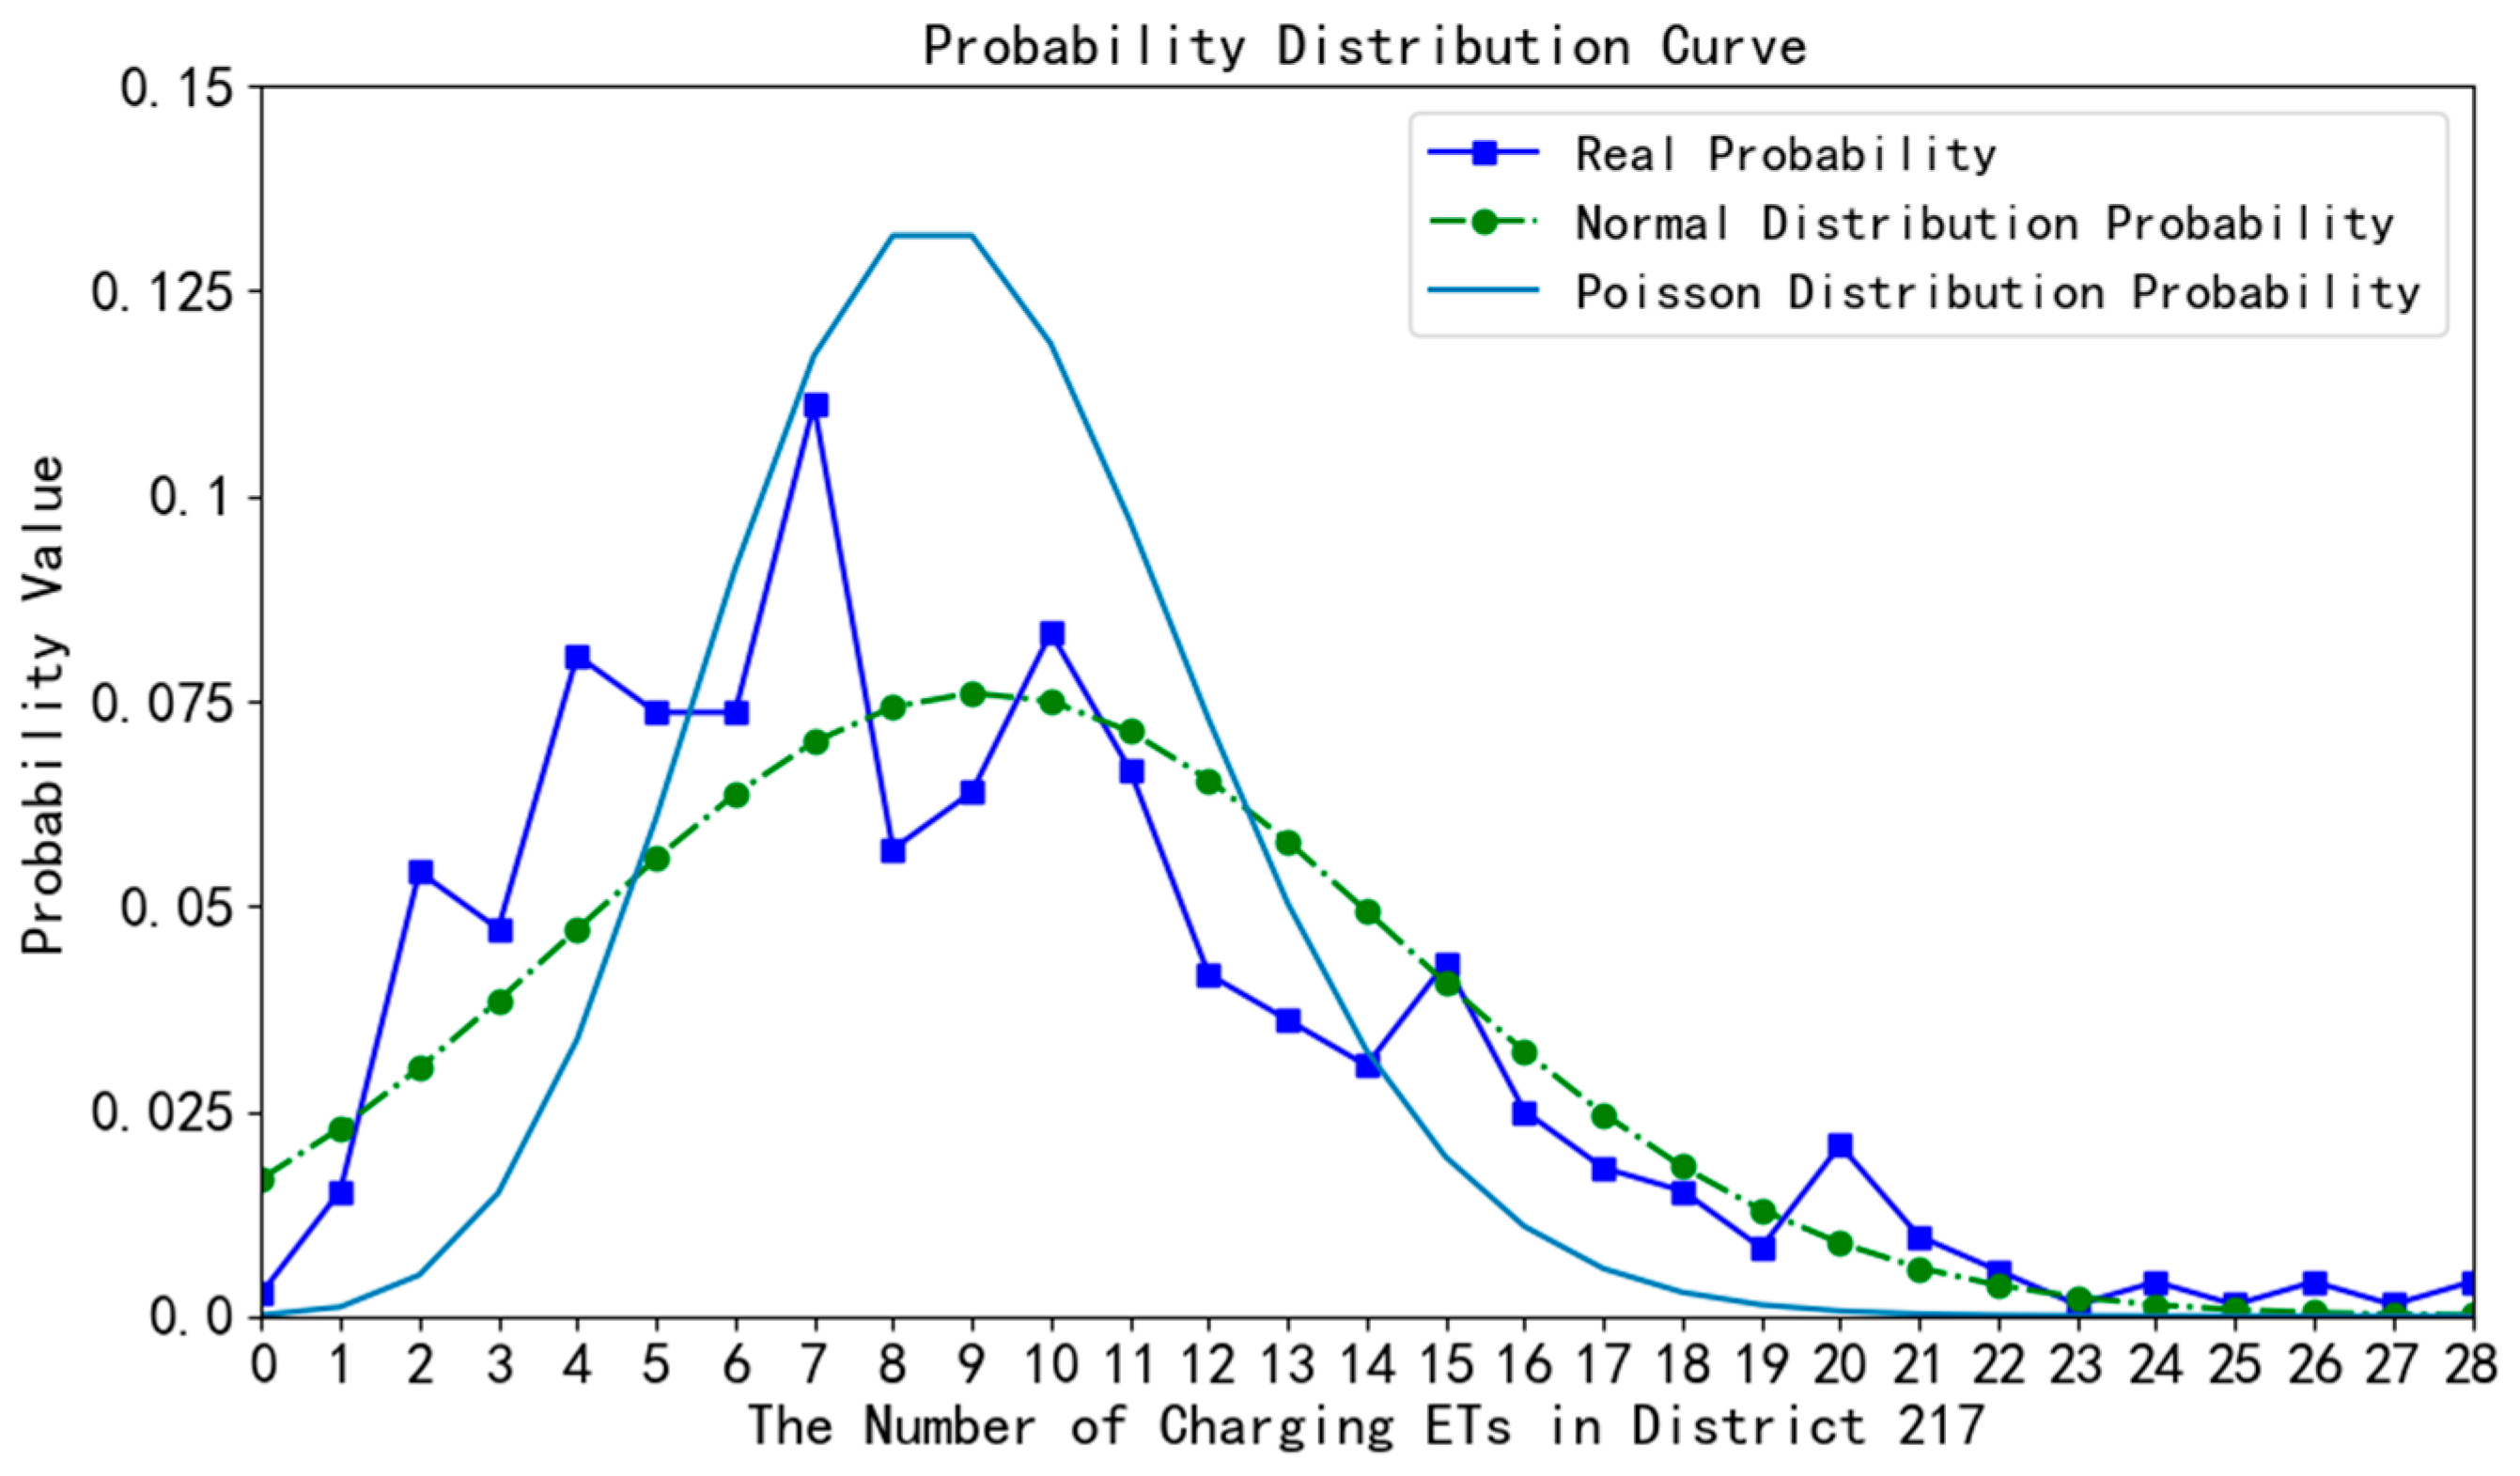
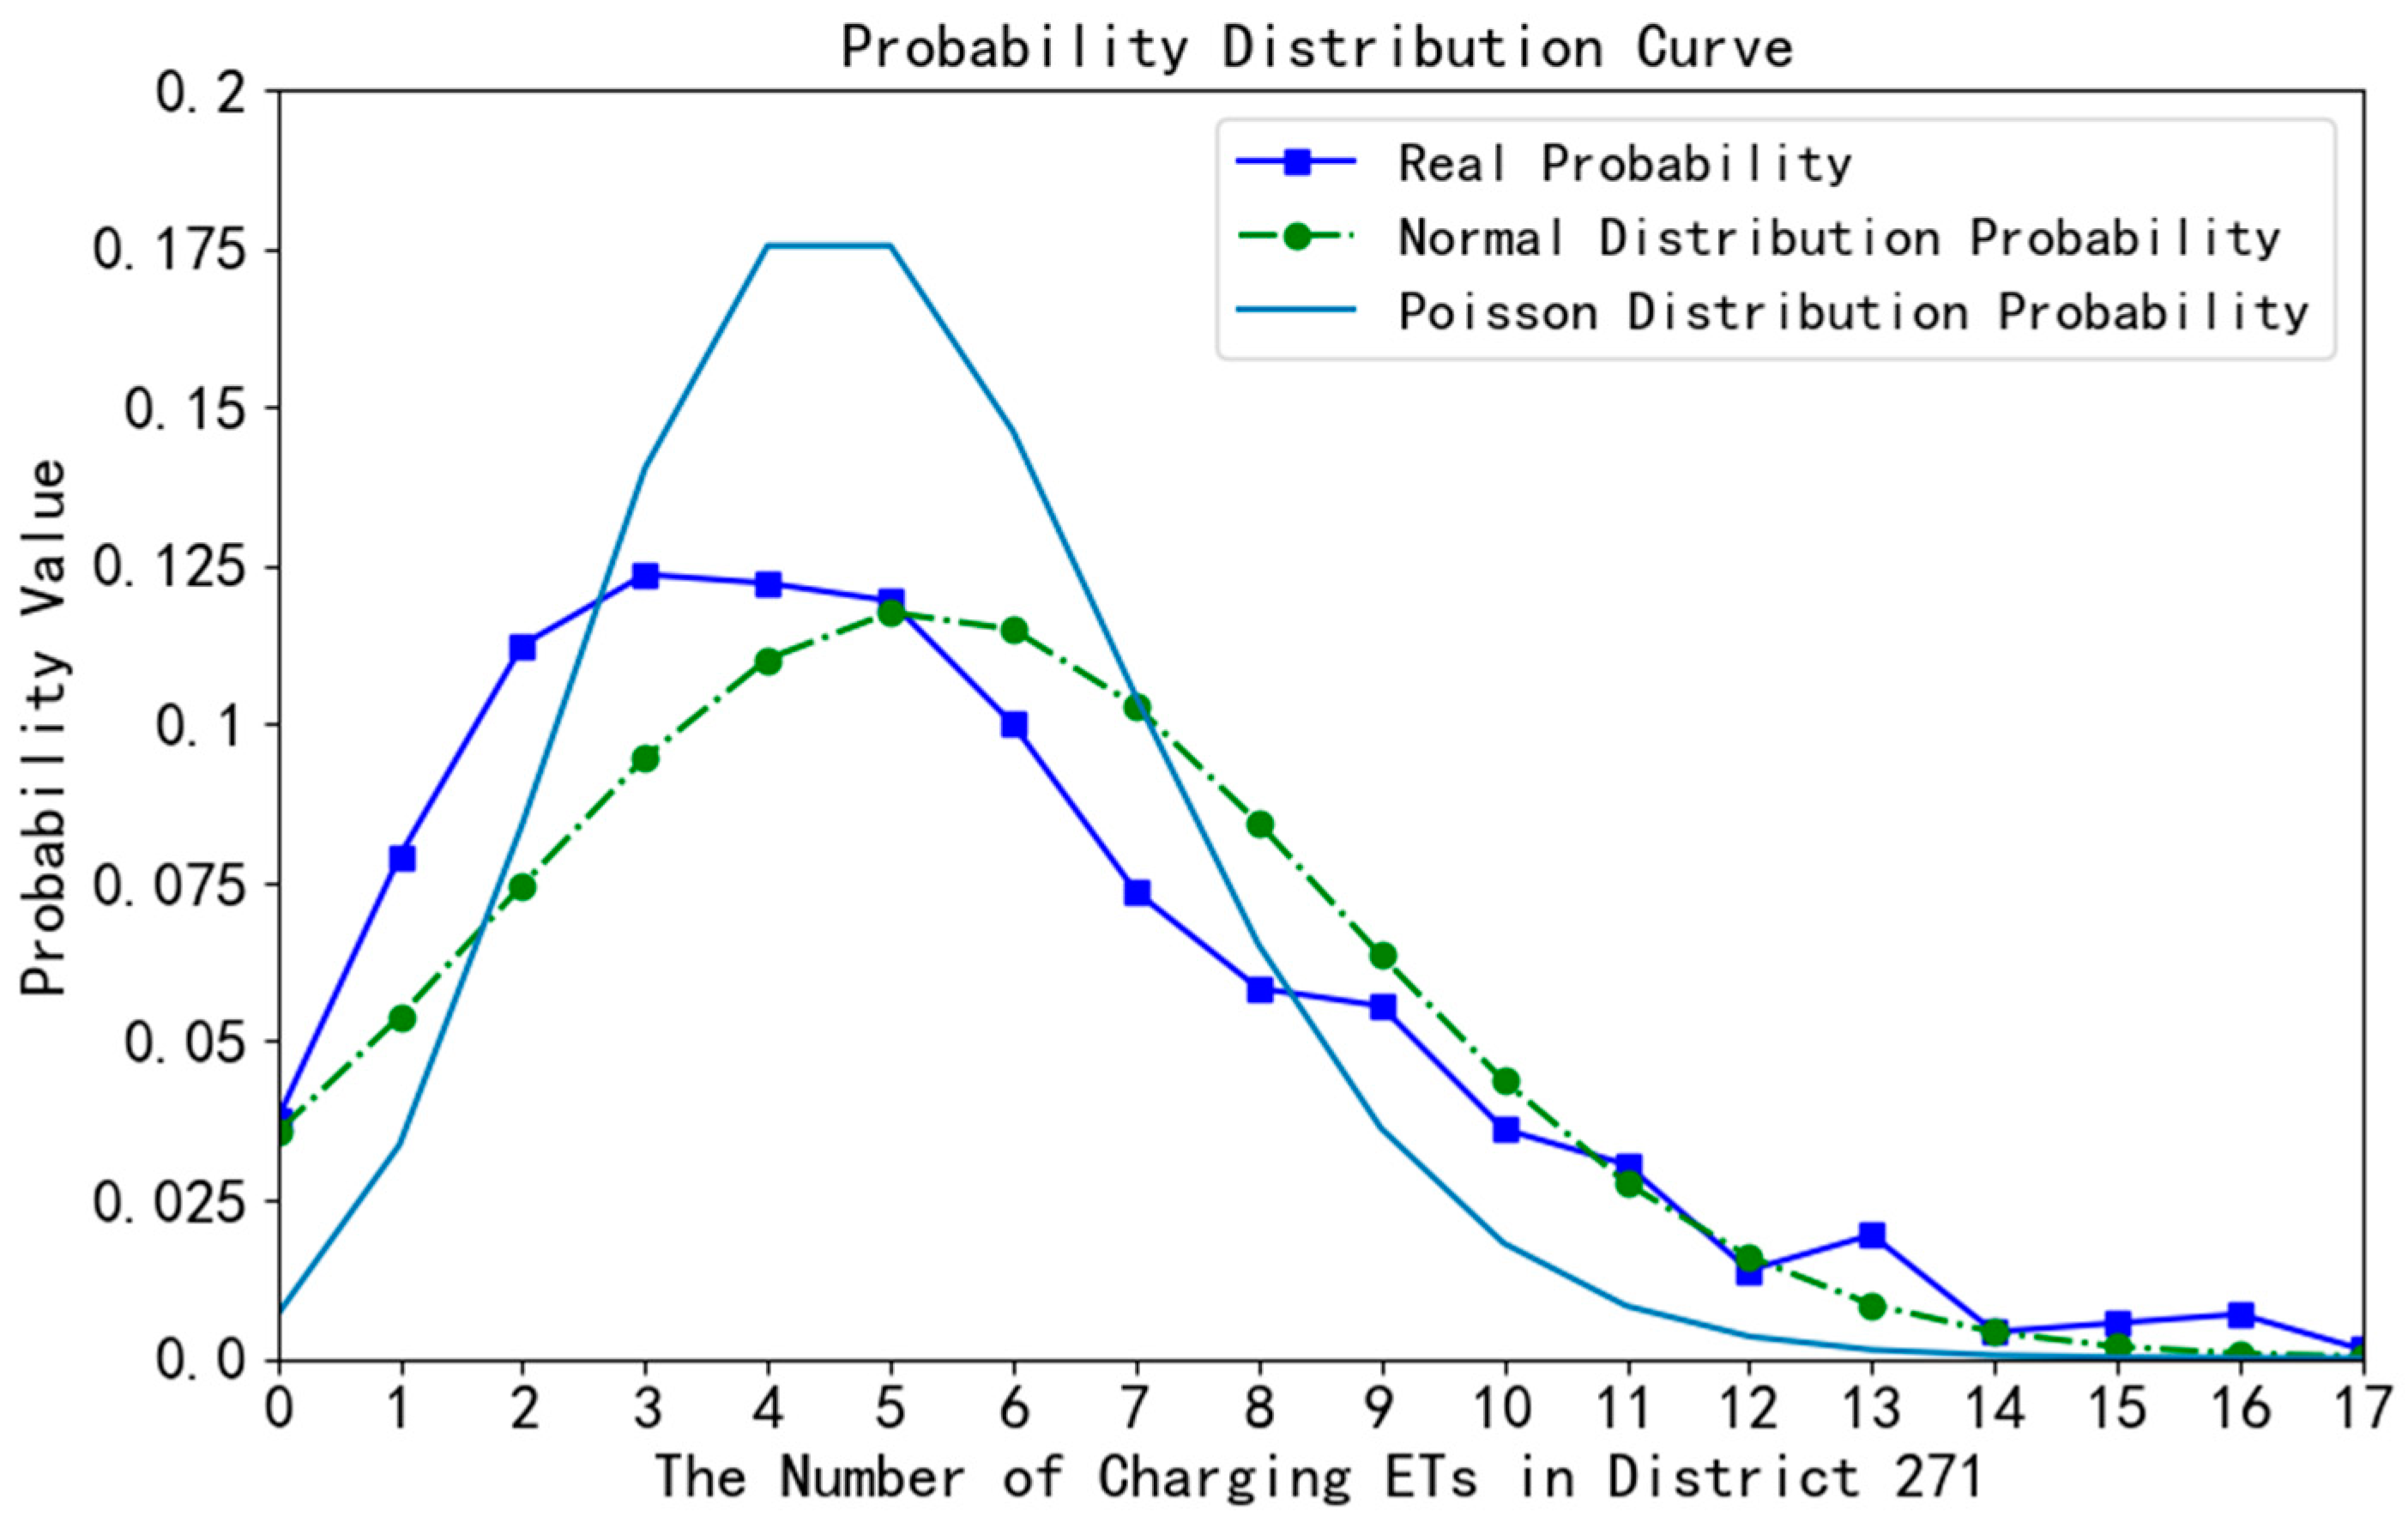
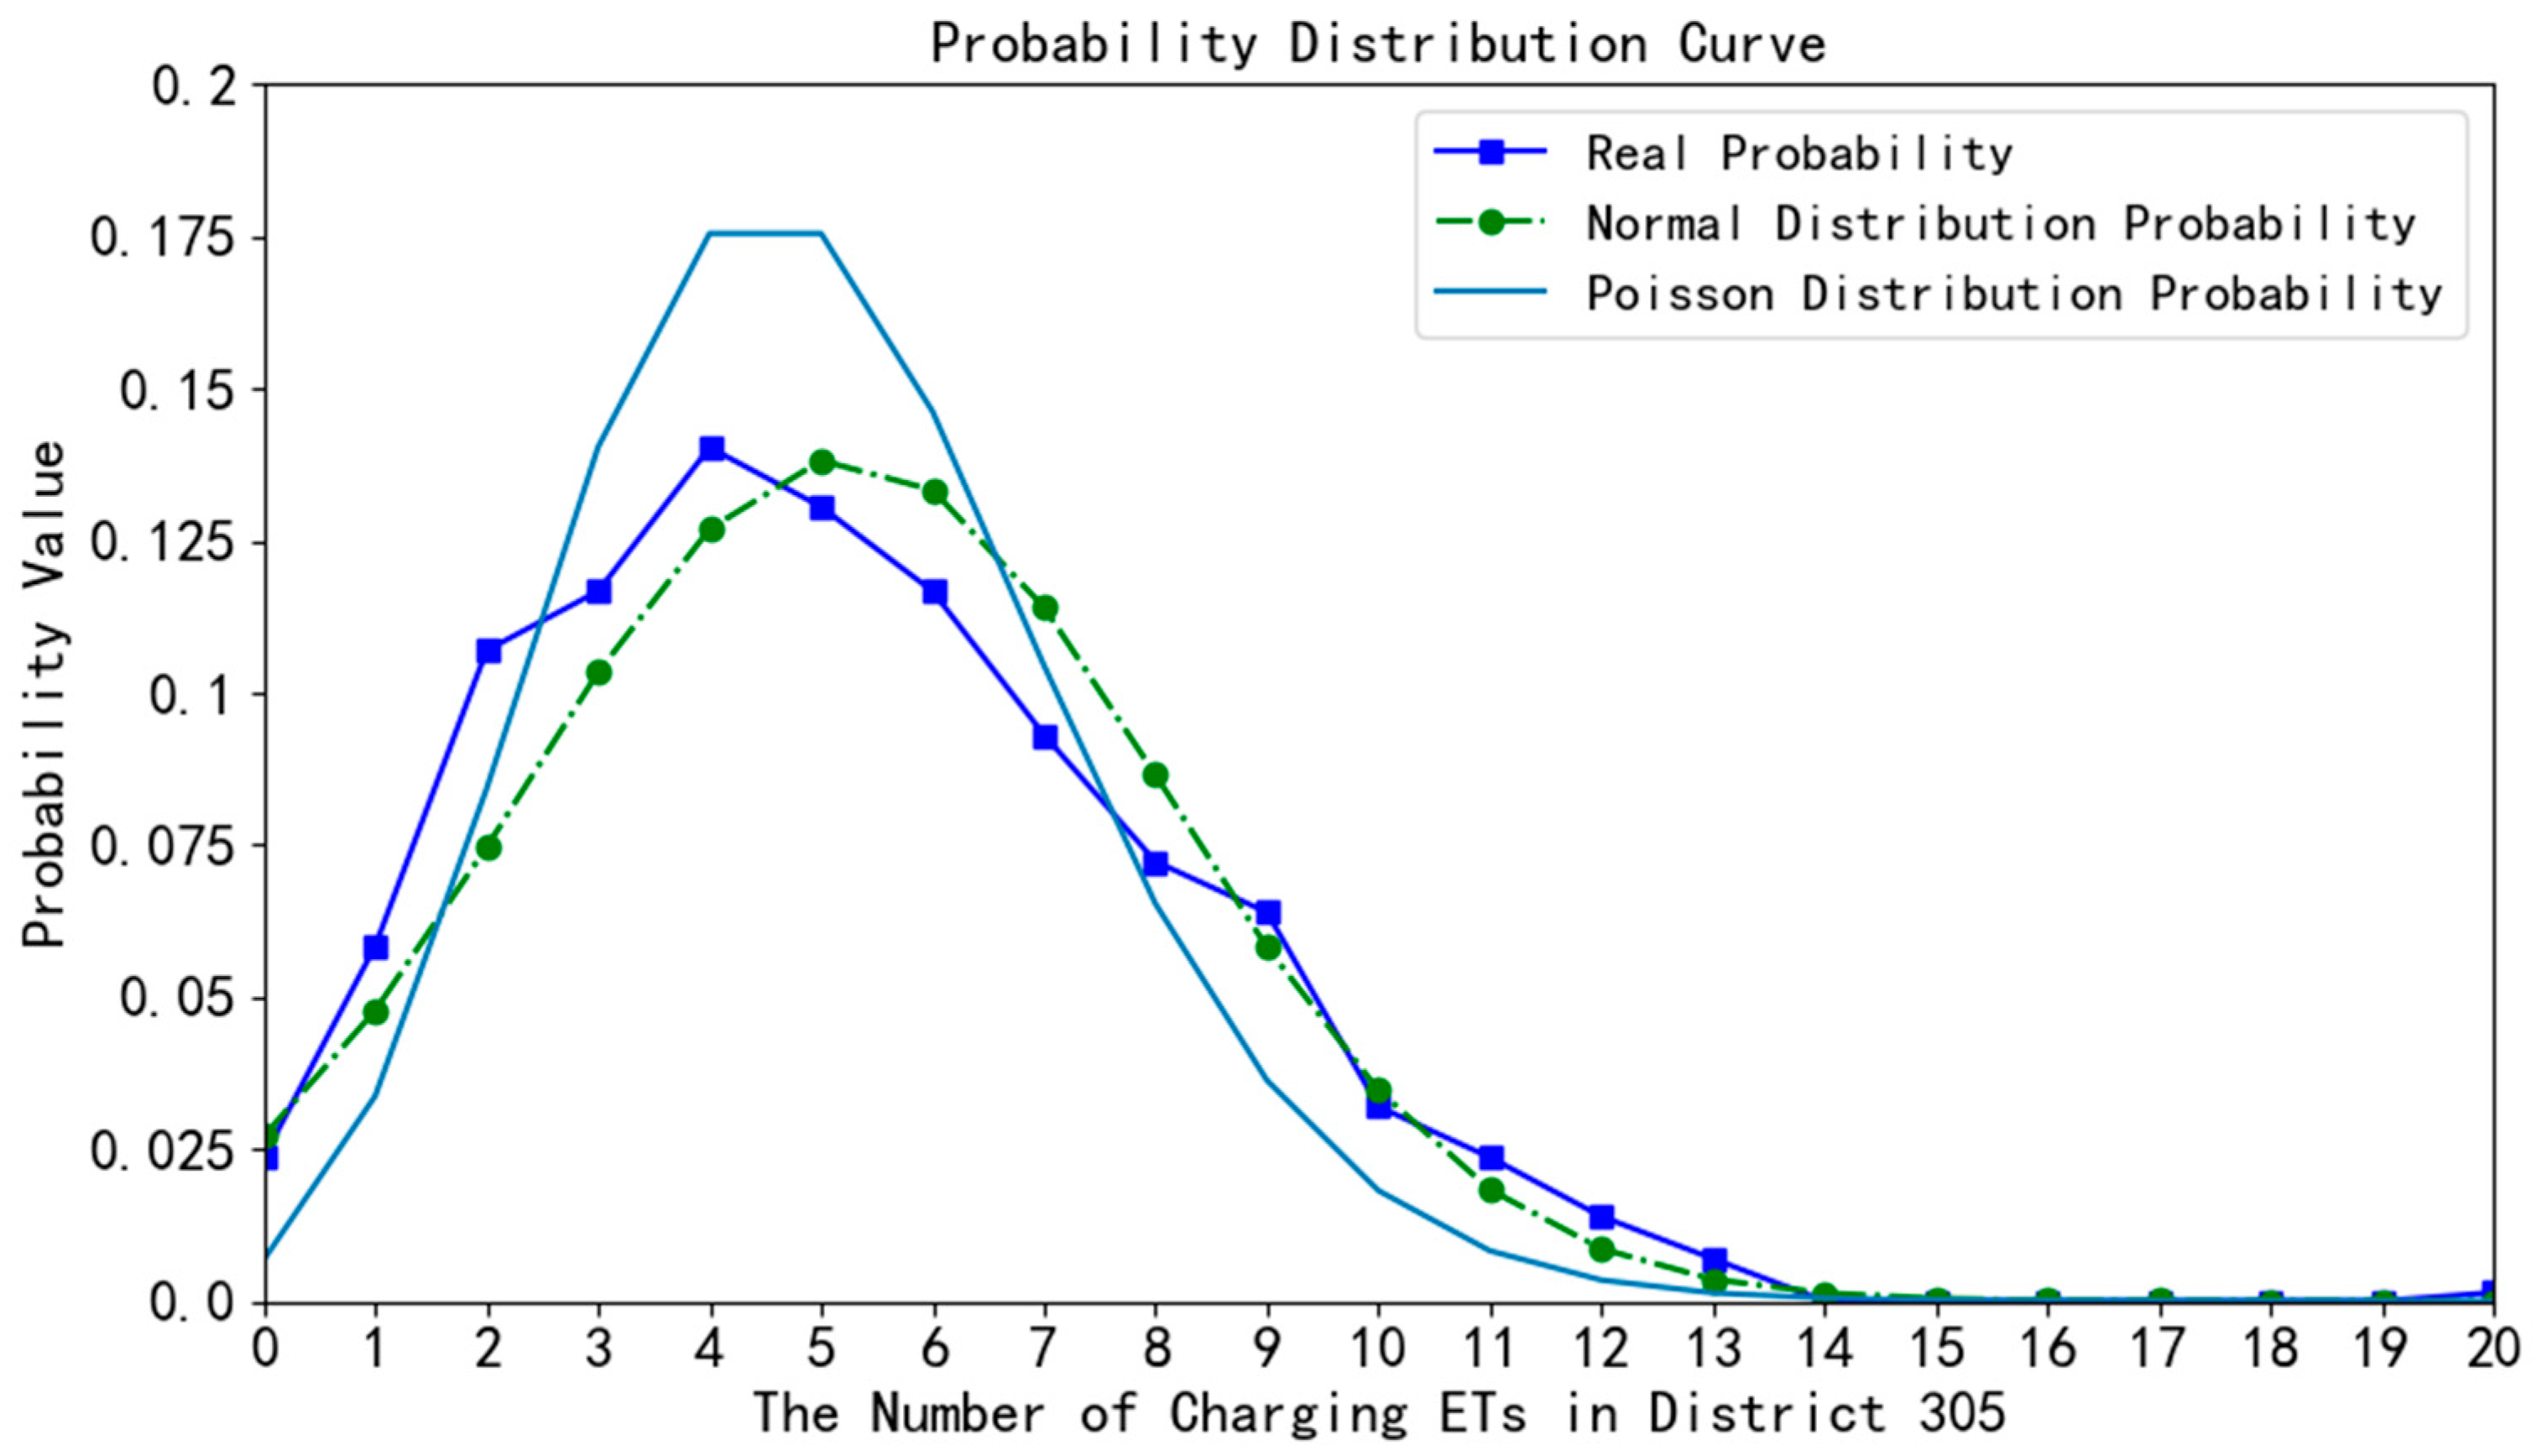
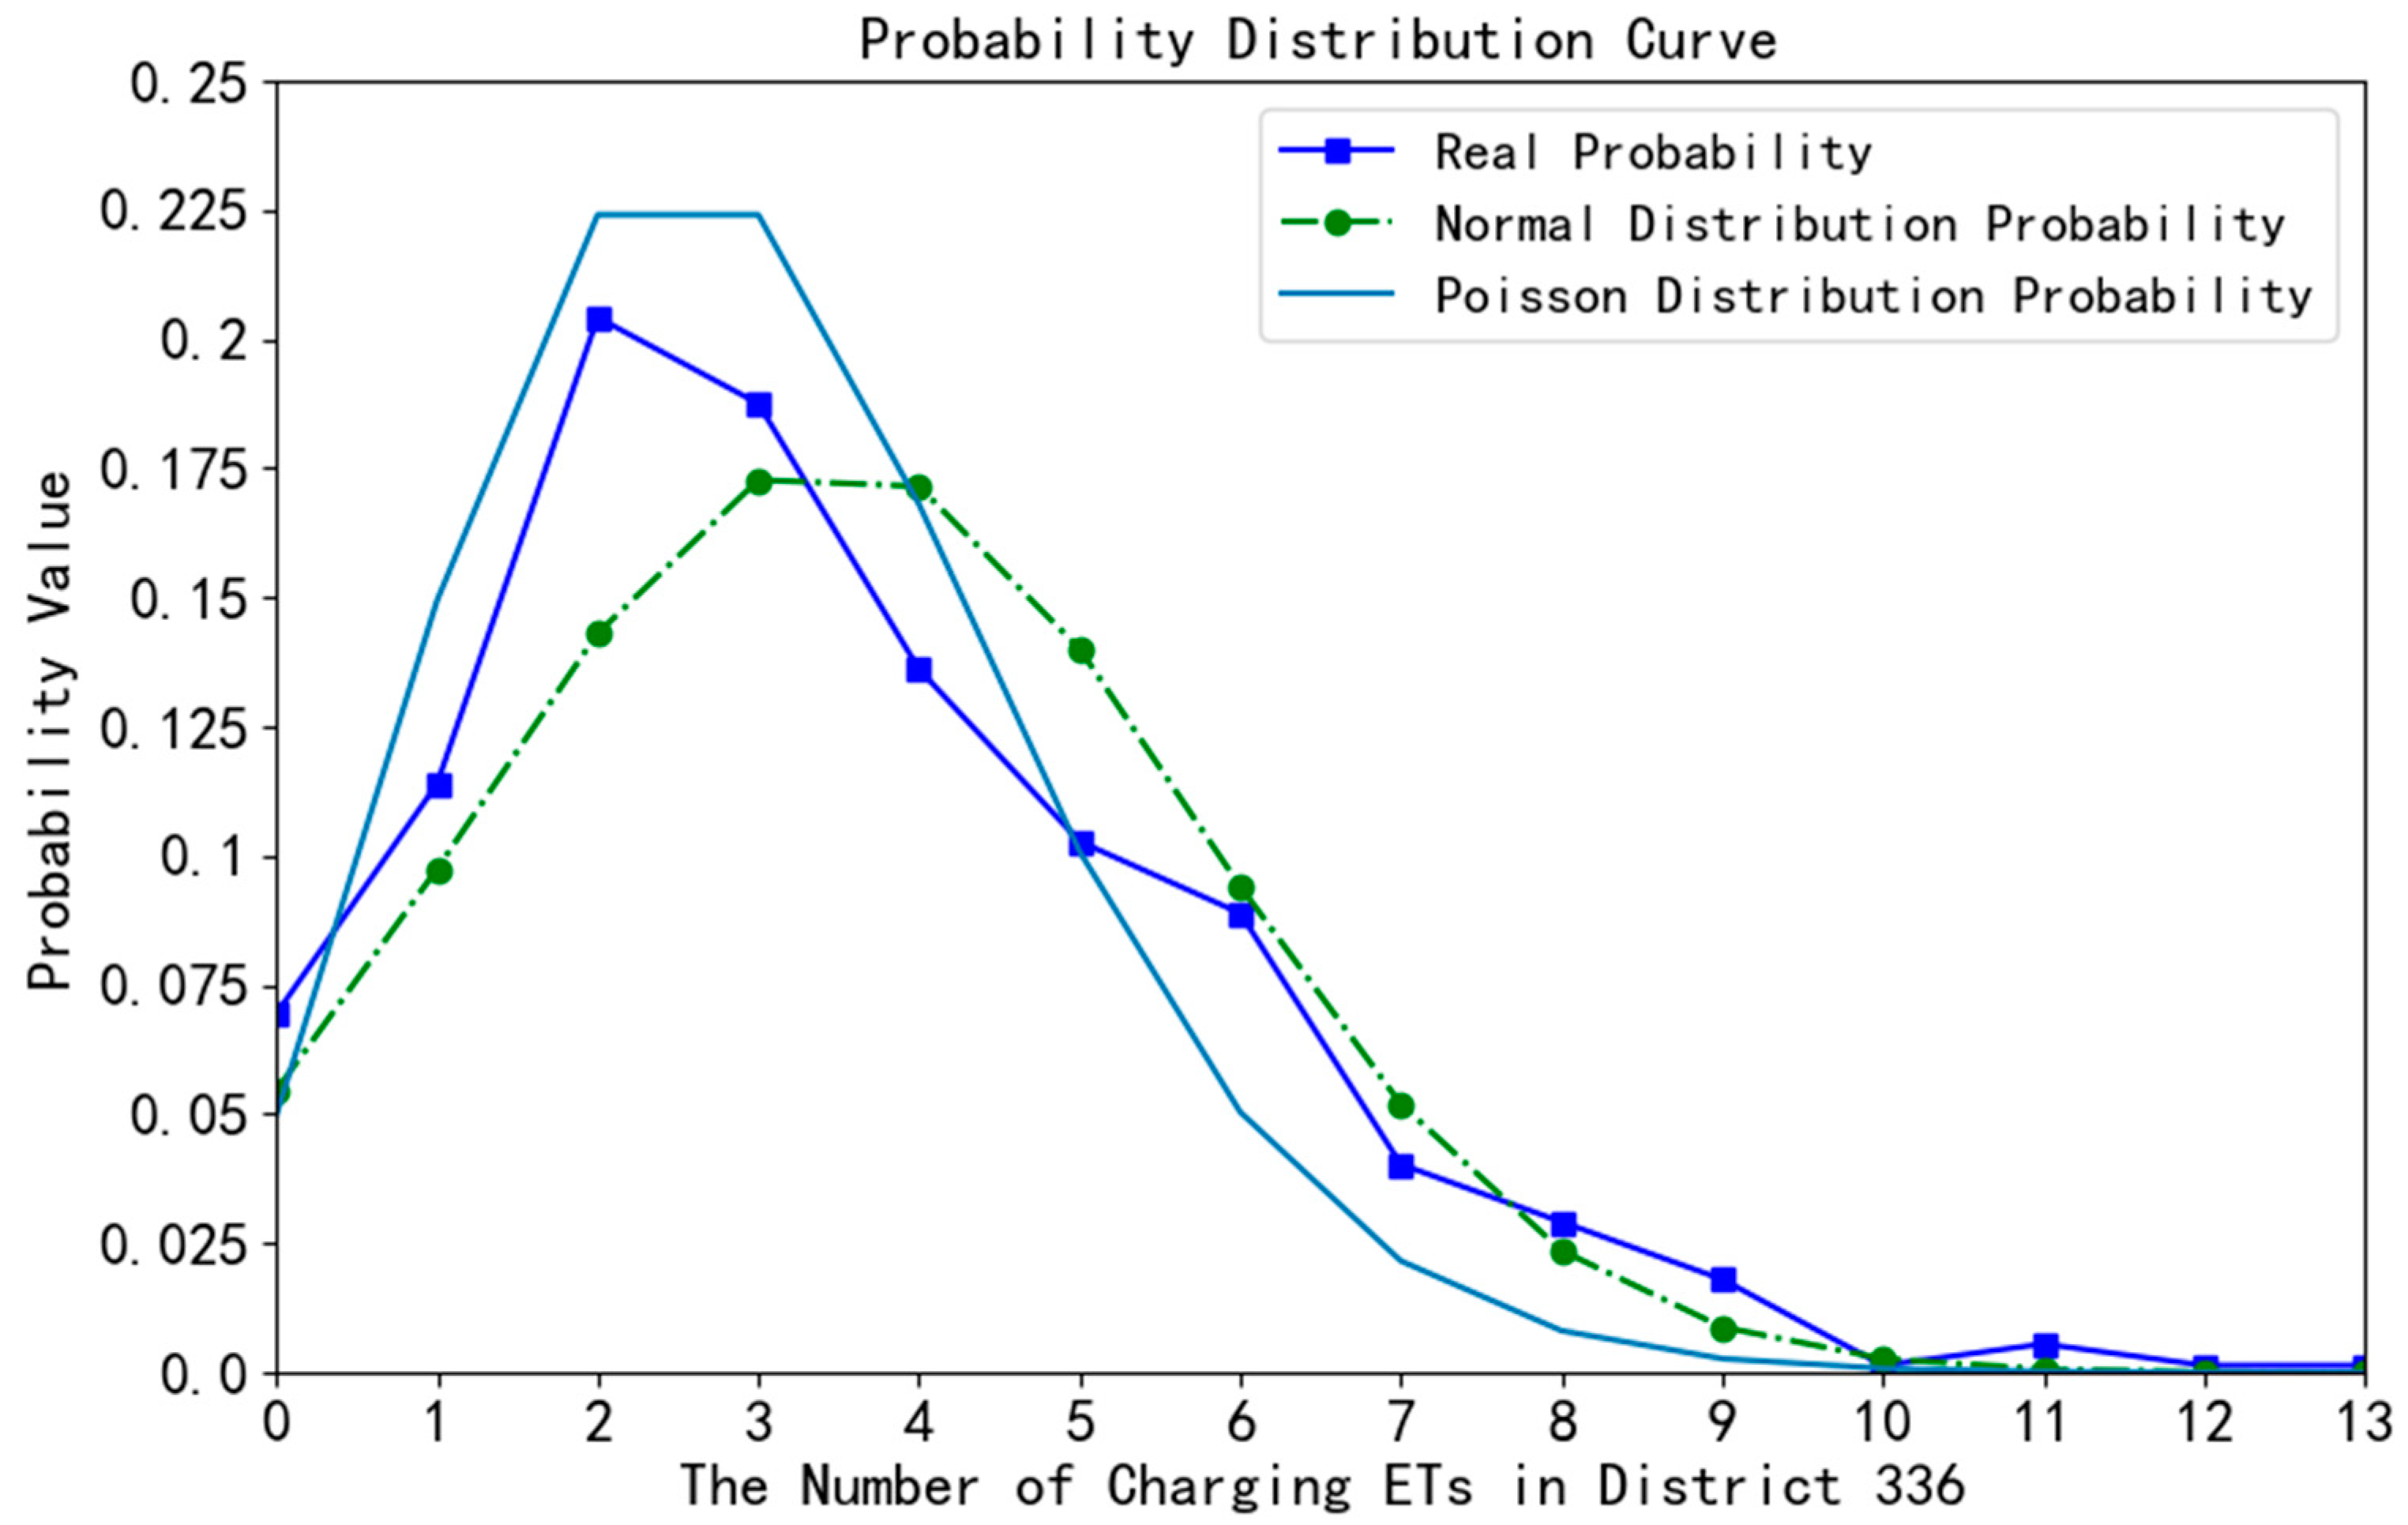
- With the help of statistical knowledge, we can give the proper number of charging devices in every station under different confidence intervals.
- (4)
- Based on the Beijing real-time data obtained using Baidu map statistics to verify the method proposed in this paper, the result has good practicability.
Author Contributions
Funding
Conflicts of Interest
Appendix A
Appendix B


References
- Li, Z.; Guo, Q.; Sun, H.; Wang, Y.; Xin, S. Emission-Concerned Wind-EV Coordination on the Transmission Grid Side with Network Constraints: Concept and Case Study. IEEE Trans.Smart Grid 2013, 4, 1692–1704. [Google Scholar] [CrossRef]
- Hu, Z.; Song, Y.; Xu, Z.; Zhan, Q.; Jia, L. Impacts and utilization of electric vehicles integration into power systems. Proc. CSEE 2012, 32, 1–10. [Google Scholar]
- Zhang, Q.; Han, W.; Yu, J.; Li, C.; Shi, L. Simulation model of electric vehicle charging station and the harmonic analysis on power grid. Trans. China Electrotech. Soc. 2012, 27, 159–164. [Google Scholar]
- Zheng, Y.; Sun, J.; Zhang, C.; Lin, X. Study of voltage stability margin for the distribution network with electric vehicle integration. Trans. China Electrotech. Soc. 2014, 29, 20–26. [Google Scholar]
- Jiang, Y.; Ding, X.; Zheng, C.; Zheng, N.; Guan, Z. Distributed Generation Planning for Active Distribution Network with Electric Vehicle. Guangdong Electr. Power 2017, 30, 1–6. [Google Scholar]
- Schroeder, A.; Traber, T. The economics of fast charging infrastructure for electric vehicles. Energy Policy 2012, 43, 136–144. [Google Scholar] [CrossRef]
- Lam, A.Y.S.; Leung, Y.W.; Chu, X. Electric Vehicle Charging Station Placement: Formulation, Complexity, and Solutions. IEEE Trans. Smart Grid 2014, 5, 2846–2856. [Google Scholar] [CrossRef] [Green Version]
- Ribberink, H.; Entchev, E. Exploring the potential synergy between micro-cogeneration and electric vehicle charging. Appl. Therm. Eng. 2014, 71, 677–685. [Google Scholar] [CrossRef]
- Zhang, H.; Tang, L.; Yang, C.; Lan, S. Locating electric vehicle charging stations with service capacity using the improved whale optimization algorithm. Adv. Eng. Inform. 2019, 41, 100901. [Google Scholar] [CrossRef]
- Wan, P.; Cheng, Y.; Wu, B.; Wang, G. An algorithm to optimize deployment of charging base stations for WRSN. EURASIP J. Wirel. Commun. Netw. 2019, 2019, 63. [Google Scholar] [CrossRef] [Green Version]
- Liu, Z.; Wen, F.; Ledwich, G. Optimal Planning of Electric-Vehicle Charging Stations in Distribution Systems. IEEE Trans. Power Deliv. 2013, 28, 102–110. [Google Scholar] [CrossRef]
- Wang, G.; Xu, Z.; Wen, F.; Wong, K.P. Traffic-Constrained Multiobjective Planning of Electric-Vehicle Charging Stations. IEEE Trans. Power Deliv. 2013, 28, 2363–2372. [Google Scholar] [CrossRef]
- Xi, X.; Sioshansi, R.; Marano, V. Simulation–optimization model for location of a public electric vehicle charging infrastructure. Transp. Res. Part D Transp. Environ. 2013, 22, 60–69. [Google Scholar] [CrossRef]
- Shukla, A.; Verma, K.; Kumar, R. Multi-objective synergistic planning of EV fast-charging stations in the distribution system coupled with the transportation network. IET Gener. Transm. Distrib. 2019, 13, 3421–3432. [Google Scholar] [CrossRef]
- Battapothula, G.; Yammani, C.; Maheswarapu, S. Multi-objective simultaneous optimal planning of electrical vehicle fast charging stations and DGs in distribution system. J. Mod. Power Syst. Clean Energy 2019, 7, 923–934. [Google Scholar] [CrossRef] [Green Version]
- Benedetto, A.; Sergio, B.; Luca, D.; Maria, D.; Giuseppe, F.; Michele, T. DC-Microgrid Operation Planning for an Electric Vehicle Supply Infrastructure. Appl. Sci. 2019, 9, 2687. [Google Scholar] [Green Version]
- Asif, A.; Singh, R.; Venayagamoorthy, G. Ultra-low Cost and Solar Storm Secured Local Dc Electricity to Address Climate Change Challenges for all Economies. In Proceedings of the 2016 Clemson University Power Systems Conference (PSC), Clemson, SC, USA, 8–11 March 2016; pp. 1–7. [Google Scholar]
- Liu, G.; Kang, L.; Luan, Z.; Qiu, J.; Zheng, F. Charging Station and Power Network Planning for Integrated Electric Vehicles (EVs). Energies 2019, 12, 2595. [Google Scholar] [CrossRef]
- Afshin, P.; Mohammad, S. Optimal planning of PEV fast charging stations using nash bargaining theory. J. Energy Storage 2019, 25, 100831. [Google Scholar]
- Yang, Q.; Sun, S.; Deng, S.; Zhao, Q.; Zhou, M. Optimal Sizing of PEV Fast Charging Stations with Markovian Demand Characterization. IEEE Trans. Smart Grid 2019, 10, 4457–4466. [Google Scholar] [CrossRef]
- Baouche, F.; Billot, R.; Trigui, R.; Faouzi, N.E. Electric Vehicle Green Routing with Possible En-Route Recharging. In Proceedings of the IEEE International Conference on Intelligent Transportation Systems, Qingdao, China, 8–11 October 2014; pp. 2787–2792. [Google Scholar]
- Baouche, F.; Billot, R.; Trigui, R.; Faouzi, N.E. Efficient Allocation of Electric Vehicles Charging Stations: Optimization Model and Application to a Dense Urban Network. IEEE Intell. Transp. Syst. Mag. 2014, 6, 33–43. [Google Scholar] [CrossRef]
- Fu, F.; Fang, Y.; Dong, H.; Chen, W. Optimized Allocation of Charging Stations for Electric Vehicles Based on Historical Trajectories. Autom. Electr. Power Syst. 2018, 42, 72–80. [Google Scholar]
- Zhang, Q.; Wang, Z.; Tan, W.; Liu, H.; Li, C. Spatial-Temporal Distribution Prediction of Charging Load for Electric Vehicle Based on MDP Random Path Simulation. Autom. Electr. Power Syst. 2018, 42, 59–66. [Google Scholar]
- Liu, D.; Zhang, H.; Nie, H.; Zhao, Y. Location Analysis of Electric Vehicle Charging Station Based on Improved PSO. In Proceedings of the 2018 Chinese Automation Congress, Xi’an, China, 30 November–2 December 2018; pp. 2184–2188. [Google Scholar]
- Vazifeh, M.M.; Zhang, H.; Santi, P.; Ratti, C. Optimizing the Deployment of Electric Vehicle Charging Stations Using Pervasive Mobility Data. Comput. Sci. 2015, 121, 1–14. [Google Scholar] [CrossRef]
- Kong, W.; Luo, Y.; Feng, G.; Li, K.; Peng, H. Optimal location planning method of fast charging station for electric vehicles considering operators, drivers, vehicles, traffic flow and power grid. Energy 2019, 186, 115826. [Google Scholar] [CrossRef]
- Liu, L.; Liu, T.; Zhang, T.; Liu, J. Orderly charging and discharging strategy optimization for electric vehicles considering dynamic battery-wear model. Autom. Electr. Power Syst. 2016, 40, 83–90. [Google Scholar]
- Asif, A.; Singh, R. Further Cost Reduction of Battery Manufacturing. Batteries 2017, 3, 17. [Google Scholar] [CrossRef]
- Michael, J.; Joseph, M.; Ben, E. Predicting the Future Manufacturing Cost of Batteries for Plug-In Vehicles for the U.S. Environmental Protection Agency (EPA) 2017–2025 Light-Duty Greenhouse Gas Standards. World Electr. Veh. J. 2018, 9, 42. [Google Scholar]
- Wang, X.; Zhou, B.; Tang, H. Ordered Charging/discharging Strategy for Electric Vehicles with V2V Technology. Proc. CSU-EPSA 2018, 30, 96–102. [Google Scholar]
- Sun, B.; Sun, X.; Tsang, D.; Whitt, W. Optimal battery purchasing and charging strategy at electric vehicle battery swap stations. Eur. J. Oper. Res. 2019, 279, 524–539. [Google Scholar] [CrossRef]
- Pagany, R.; Camargo, L.; Dorner, W. A review of spatial localization methodologies for the electric vehicle charging infrastructure. Int. J. Sustain. Transp. 2019, 13, 433–449. [Google Scholar] [CrossRef]
- Chen, Y.; Liu, J.; Fang, Y. Utility-Maximization, Logit Transformation and the Basic Mathematical Models for Analytical Urban Geography. Sci. Geogr. Sin. 2002, 22, 581–586. [Google Scholar]


| M | 10.0 | 100.0 | 200.0 | 500.0 | 1000.0 |
|---|---|---|---|---|---|
| 2.0 | 10.0 | 10.0 | 20.0 | 20.0 | |
| 5.0 | 10.0 | 20.0 | 25.0 | 50.0 | |
| C1 | 25.0 | 115.0 | 215.0 | 515.0 | 1015.0 |
| C2 | 16.0 | 33.0 | 43.0 | 63.0 | 88.0 |
| η (%) | 36.0 | 71.3 | 80.0 | 87.8 | 91.3 |
| Subject | District Number |
|---|---|
| Existing station | 38, 51, 64, 152, 167, 182, 217, 271, 305, 336 |
| Mall | 47, 56, 62, 65, 86, 99, 108, 124, 134, 157, 163, 170, 184, 187, 190, 196, 197, 205, 208, 234, 238, 248, 321, 369 |
| Wholesale market | 127, 158, 168, 254, 261, 278, 339, 353, 374, 384 |
| Bar | 88, 132, 156, 176, 234 |
| Residential area | 14, 15, 20, 33, 38, 39, 60, 102, 122, 146, 285, 297, 304, 319, 328, 329, 336, 343, 344, 362 |
| Station | 108, 215, 220, 245, 291, 310, 333, 352 |
| Scenic spot | 94, 106, 131, 165, 172, 192, 273 |
| Office area | 2, 3, 6, 11, 22, 23, 29, 42, 71, 86, 97, 104, 105, 108, 115, 135, 136, 156, 157, 164, 177, 179, 182, 188, 197, 203, 226, 229, 243, 247, 257, 258 |
| Subject | 7:00–10:00 | 10:00–18:00 | 18:00–22:00 | 22:00–7:00 |
|---|---|---|---|---|
| Mall | 2 | 3 | 4 | 1 |
| Station | 3 | 5 | 3 | 2 |
| Office area | 4 | 5 | 4 | 2 |
| Bar | 1 | 1 | 1 | 4 |
| Wholesale market | 1 | 5 | 3 | 1 |
| Residential area | 4 | 3 | 4 | 2 |
| Scenic spot | 2 | 4 | 2 | 1 |
| Traffic Rank | I | II | III | IV |
|---|---|---|---|---|
| Rank Index | >70 | 50–70 | 30–50 | <30 |
| Time | 15 min | 8 min | 4 min | 2 min |
| Electricity consuming | 2 kWh | 1.8 kWh | 1.5 kWh | 1.2 kWh |
| Destination | Times | Destination | Times |
|---|---|---|---|
| 1 | 68 | 11 | 57 |
| 2 | 42 | 12 | 24 |
| 3 | 128 | 13 | 9 |
| 4 | 62 | 14 | 5 |
| 5 | 128 | 15 | 3 |
| 6 | 132 | 16 | 2 |
| 7 | 91 | 17 | 1 |
| 8 | 57 | 18 | 0 |
| 9 | 99 | 19 | 0 |
| 10 | 92 | 20 | 0 |
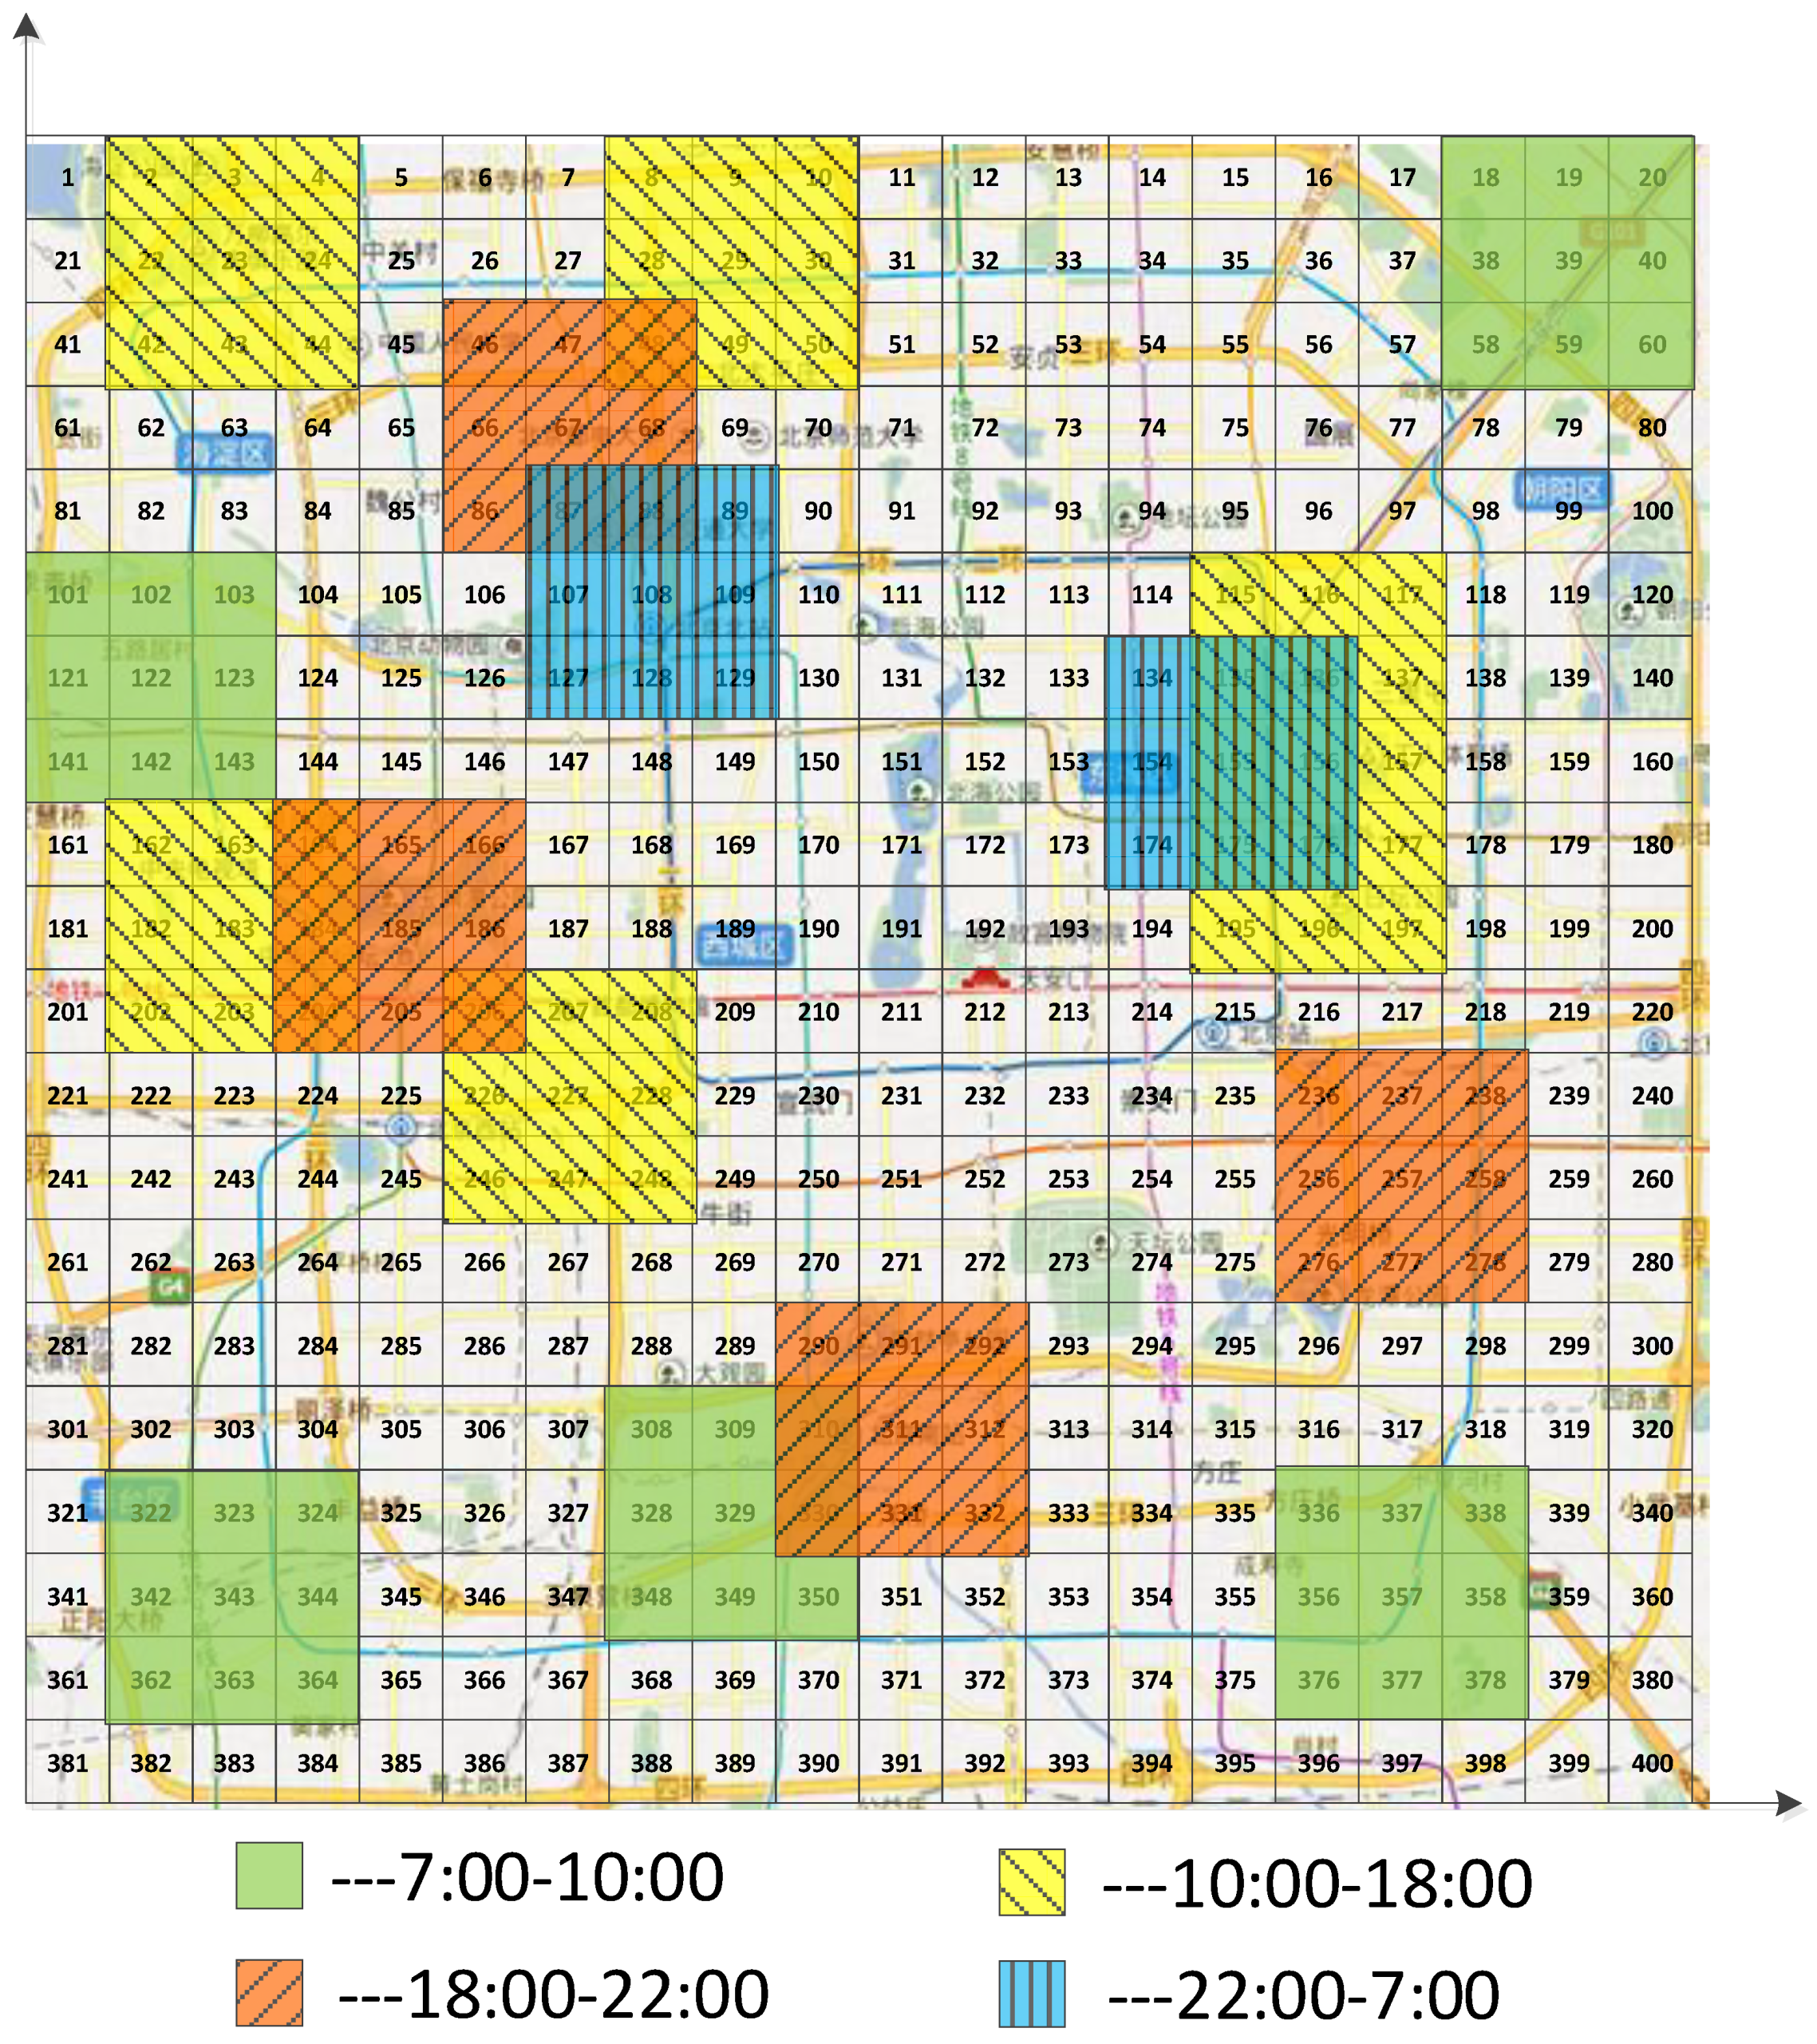
| Period | District Number |
|---|---|
| 7:00–10:00 | 18, 19, 20, 38, 39, 40, 58, 59, 60, 101, 102, 103, 121, 122, 123, 141, 142, 143, 308, 309, 310, 328, 329, 330, 348, 349, 350, 322, 323, 324, 342, 343, 344, 362, 363, 364, 336, 337, 338, 356, 357, 358, 376, 377, 378 |
| 10:00–18:00 | 2, 3, 4, 22, 23, 24, 42, 43, 44, 8, 9, 10, 28, 29, 30, 48, 49, 50, 115, 116, 117, 135, 136, 137, 155, 156, 157, 175, 176, 177, 195, 196, 197, 162, 63, 164, 182, 183, 184, 202, 203, 204, 206, 207, 208, 226, 227, 228, 246, 247, 248 |
| 18:00–22:00 | 46, 47, 48, 66, 67, 68, 86, 87, 88, 164, 165, 166, 184, 185, 186, 204, 205, 206, 236, 237, 238, 256, 257, 258, 276, 277, 278, 290, 291, 292, 310, 311, 312, 330, 331, 332 |
| 22:00–7:00 | 87, 88, 89, 107, 108, 109, 127, 128, 129, 134, 135, 136, 154, 155, 156, 174, 175, 176 |
| Charging Station District | Charging Station Deployment | |||
|---|---|---|---|---|
| Normal Distribution | Poisson Distribution | |||
| 95% Confidence Interval | 85% Confidence Interval | 95% Confidence Interval | 85% Confidence Interval | |
| 38 | 11 | 10 | 9 | 7 |
| 51 | 13 | 10 | 10 | 9 |
| 64 | 13 | 11 | 10 | 9 |
| 152 | 17 | 13 | 12 | 10 |
| 167 | 17 | 14 | 12 | 10 |
| 182 | 11 | 9 | 9 | 7 |
| 217 | 18 | 15 | 14 | 12 |
| 271 | 11 | 9 | 9 | 7 |
| 305 | 10 | 9 | 9 | 7 |
| 336 | 8 | 6 | 6 | 5 |
© 2019 by the authors. Licensee MDPI, Basel, Switzerland. This article is an open access article distributed under the terms and conditions of the Creative Commons Attribution (CC BY) license (http://creativecommons.org/licenses/by/4.0/).
Share and Cite
Shi, R.; Liu, J.; Liao, Z.; Niu, L.; Ibrahim, E.; Fu, F. An Electric Taxi Charging Station Planning Scheme Based on an Improved Destination Choice Method. Energies 2019, 12, 3781. https://doi.org/10.3390/en12193781
Shi R, Liu J, Liao Z, Niu L, Ibrahim E, Fu F. An Electric Taxi Charging Station Planning Scheme Based on an Improved Destination Choice Method. Energies. 2019; 12(19):3781. https://doi.org/10.3390/en12193781
Chicago/Turabian StyleShi, Ruifeng, Jiahua Liu, Zhenhong Liao, Li Niu, Eke Ibrahim, and Fang Fu. 2019. "An Electric Taxi Charging Station Planning Scheme Based on an Improved Destination Choice Method" Energies 12, no. 19: 3781. https://doi.org/10.3390/en12193781
APA StyleShi, R., Liu, J., Liao, Z., Niu, L., Ibrahim, E., & Fu, F. (2019). An Electric Taxi Charging Station Planning Scheme Based on an Improved Destination Choice Method. Energies, 12(19), 3781. https://doi.org/10.3390/en12193781