First, both the existing and the proposed methods were tested using simulation tests. A 20 kV, 10 km cable was simulated. The exact values of the parameters of simulated 3-phase cables were known. The obtained results were evaluated based on the analysis of the residuals of the OLS problem shown in Equation (
4). If the residual vector seemed to satisfactorily pass the tests to check the assumptions
, then the uncertainty of the parameters was calculated considering the presence of random errors and bias errors in modeling caused by exclusion of the correction coefficients
,
and
.
In each of the simulation tests, all the other operating and measurement conditions were kept the same for the purpose of a fair comparison. The number of samples collected, the variance in the power flow process, and the noise levels in the measurement process were kept the same across all the tests. A steady-state linear Kalman filter was used to filter out the PMU measurements to avoid any outliers in the PMU data streams. Since the proposed method filters the data before applying them to the regression model, there are no outliers present in the measurements. The robust estimator used in [
8] minimized the influence of outliers on the estimation results presented in [
5]. Since the outliers are filtered already using the Kalman filter, the existing method is represented by the results from the OLS-based solution used in [
5].
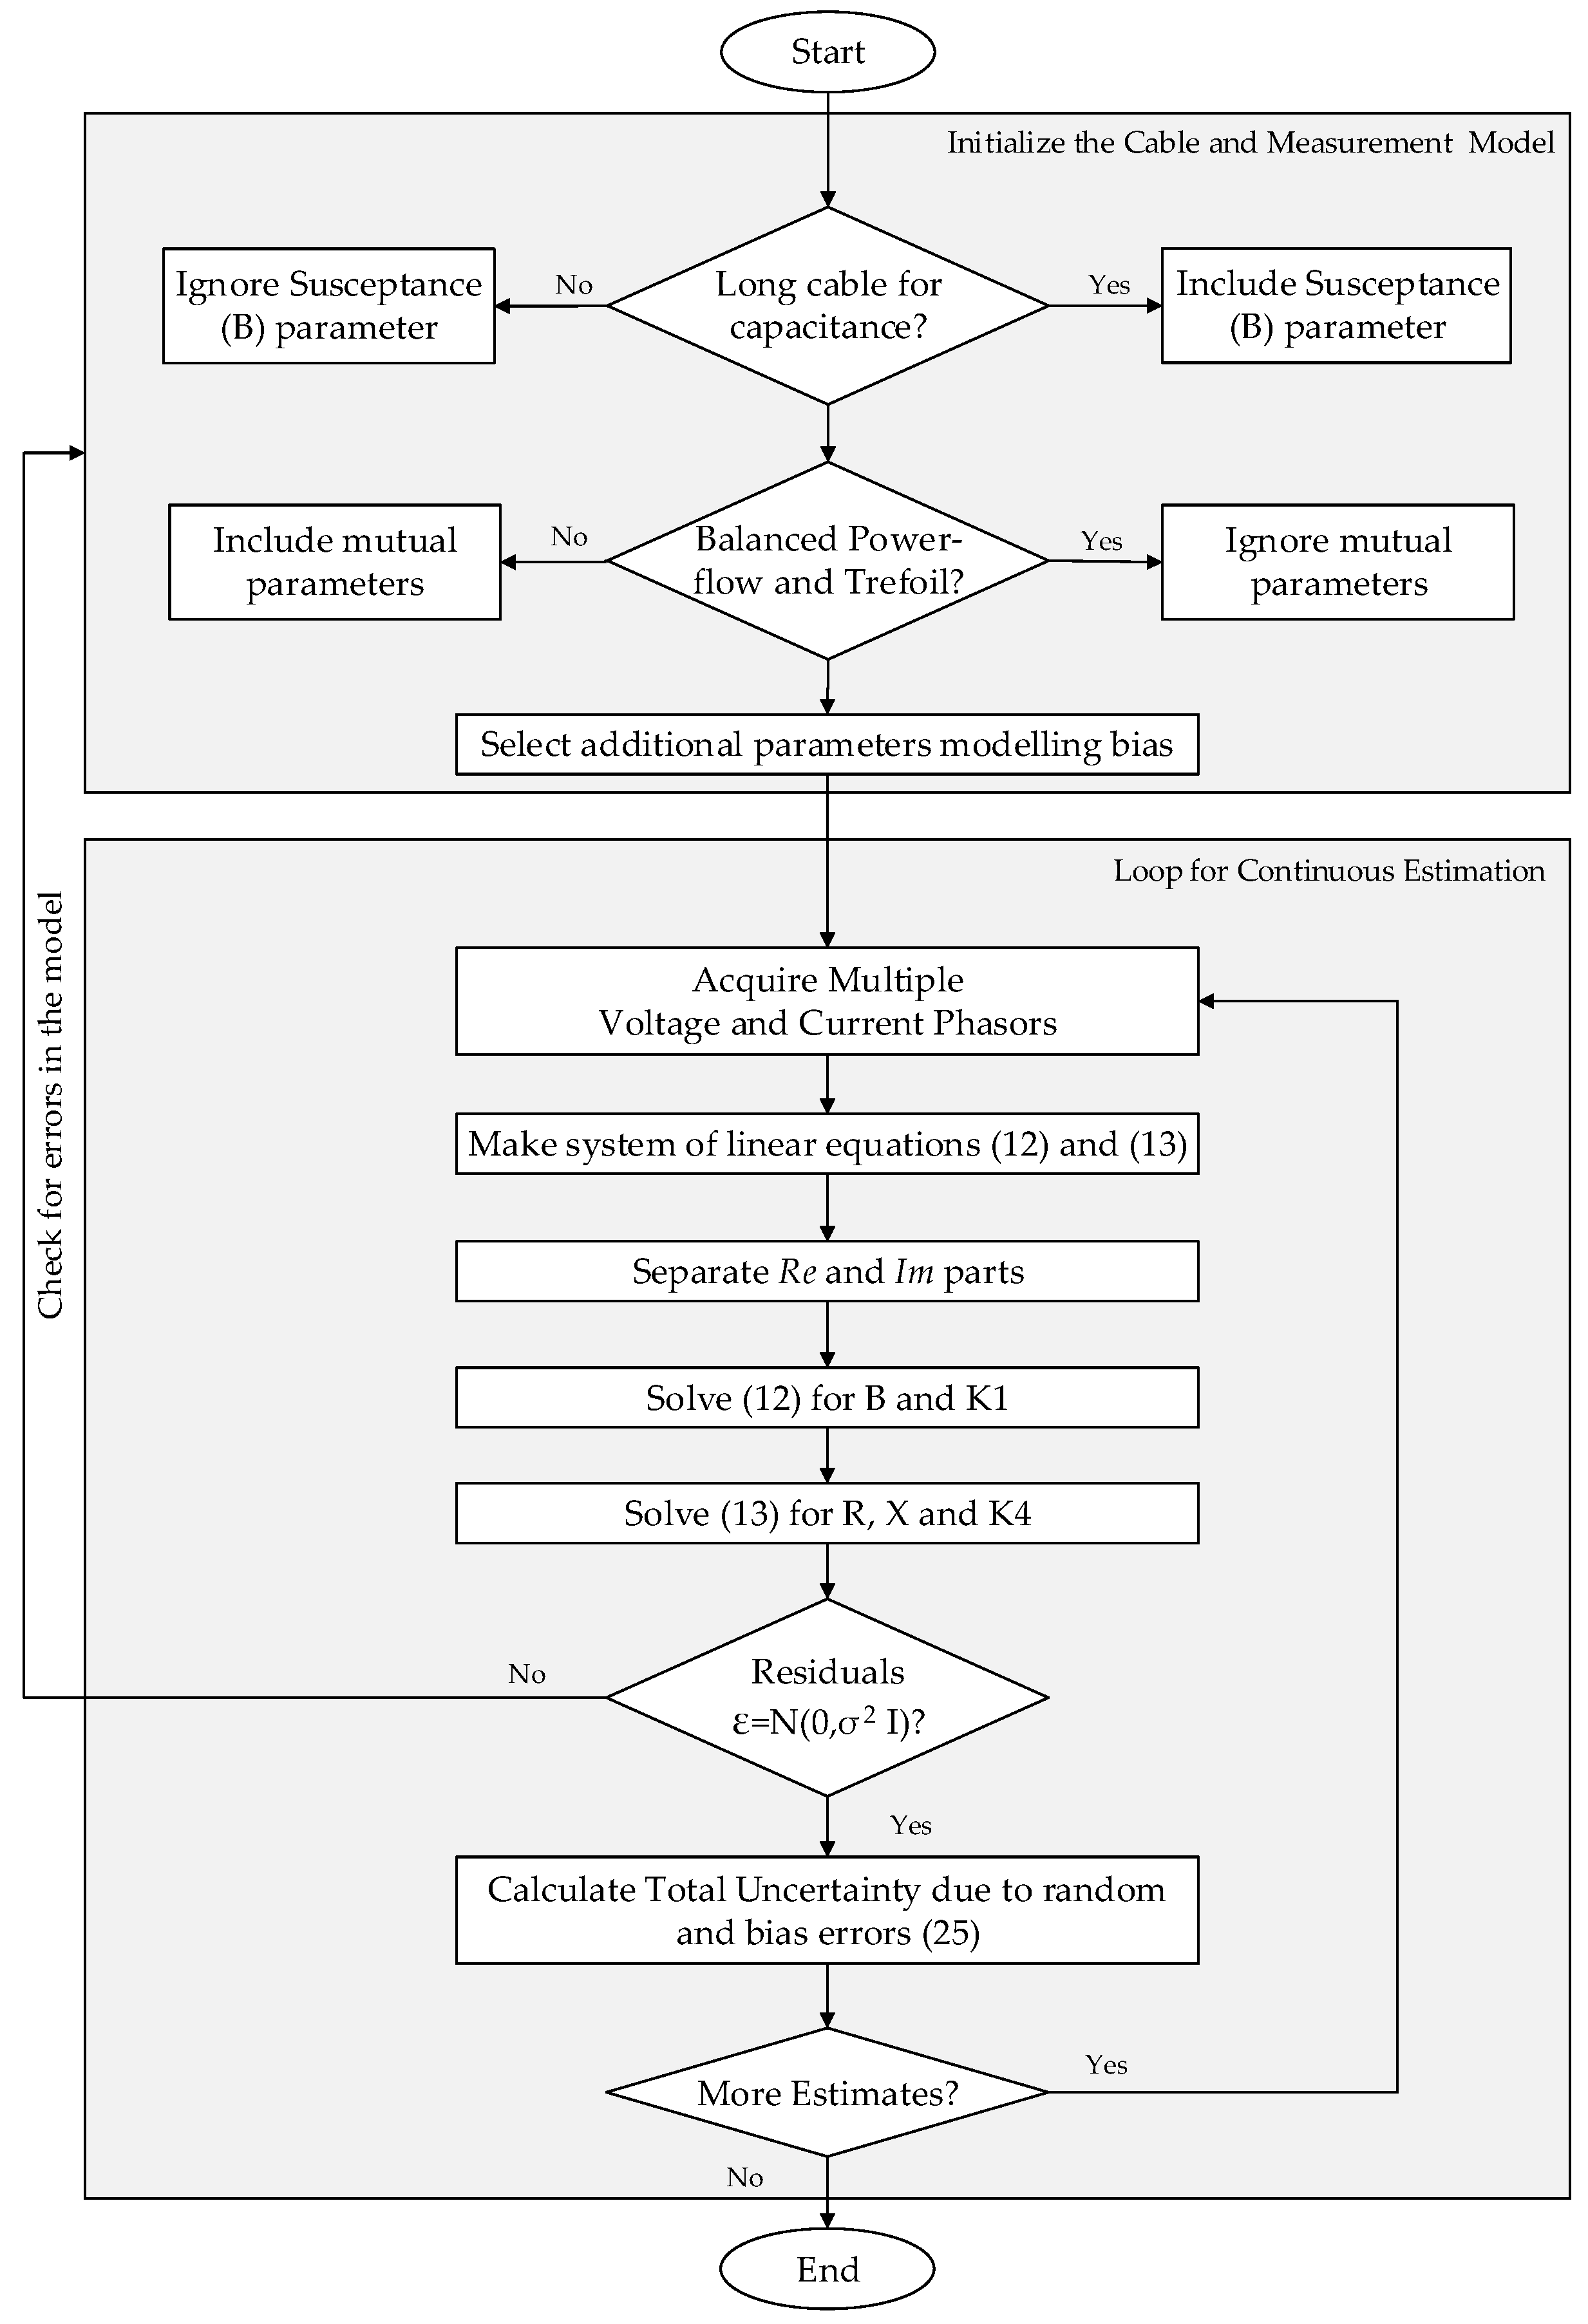
After filtering the phasor estimates, the data are used in the estimation process. To examine the results, the residuals were checked for the assumptions of normality and homoscedasticity. To test normality for large data set, a more visual approach was applied, and a QQ-plot was used to evaluate the normality of the residuals. A QQ-plot displays the quantiles of the data under test versus the expected quantile values of a normal distribution [
16]. If the distribution of residual is normal, then the plotted residuals in the QQ-plot appear linear. Visual tests can also be done to check for heteroscedasticity to verify that the variance of the residuals does not vary at different measurement values. The same approach was adopted for the following tests. If residuals did not satisfy the criteria for normality and homoscedasticity, then it was an indication that the measurements did not explain the system modeled by Equations (
12) and (
13) correctly. Simulation and laboratory tests done to show the results of the proposed method and comparison with the existing method are presented next.
5.2. Measurements with Only Random Noise Error
Based on the error specifications given by a commercial PMU manufacturer [
17], the random noise errors in PMU phasor estimates were taken to be
and
in voltage and current magnitude, respectively, and
in phase angles for both voltage and current. The given errors are the maximum uncertainty expected in the magnitude and phase angles of the estimated phasors. The errors are uniformly distributed with a standard deviation of
specified error divided by . The existing and the proposed methods were applied to the filtered PMU data. The number of distinct samples for each measurement was the same. The analysis for results obtained is presented below.
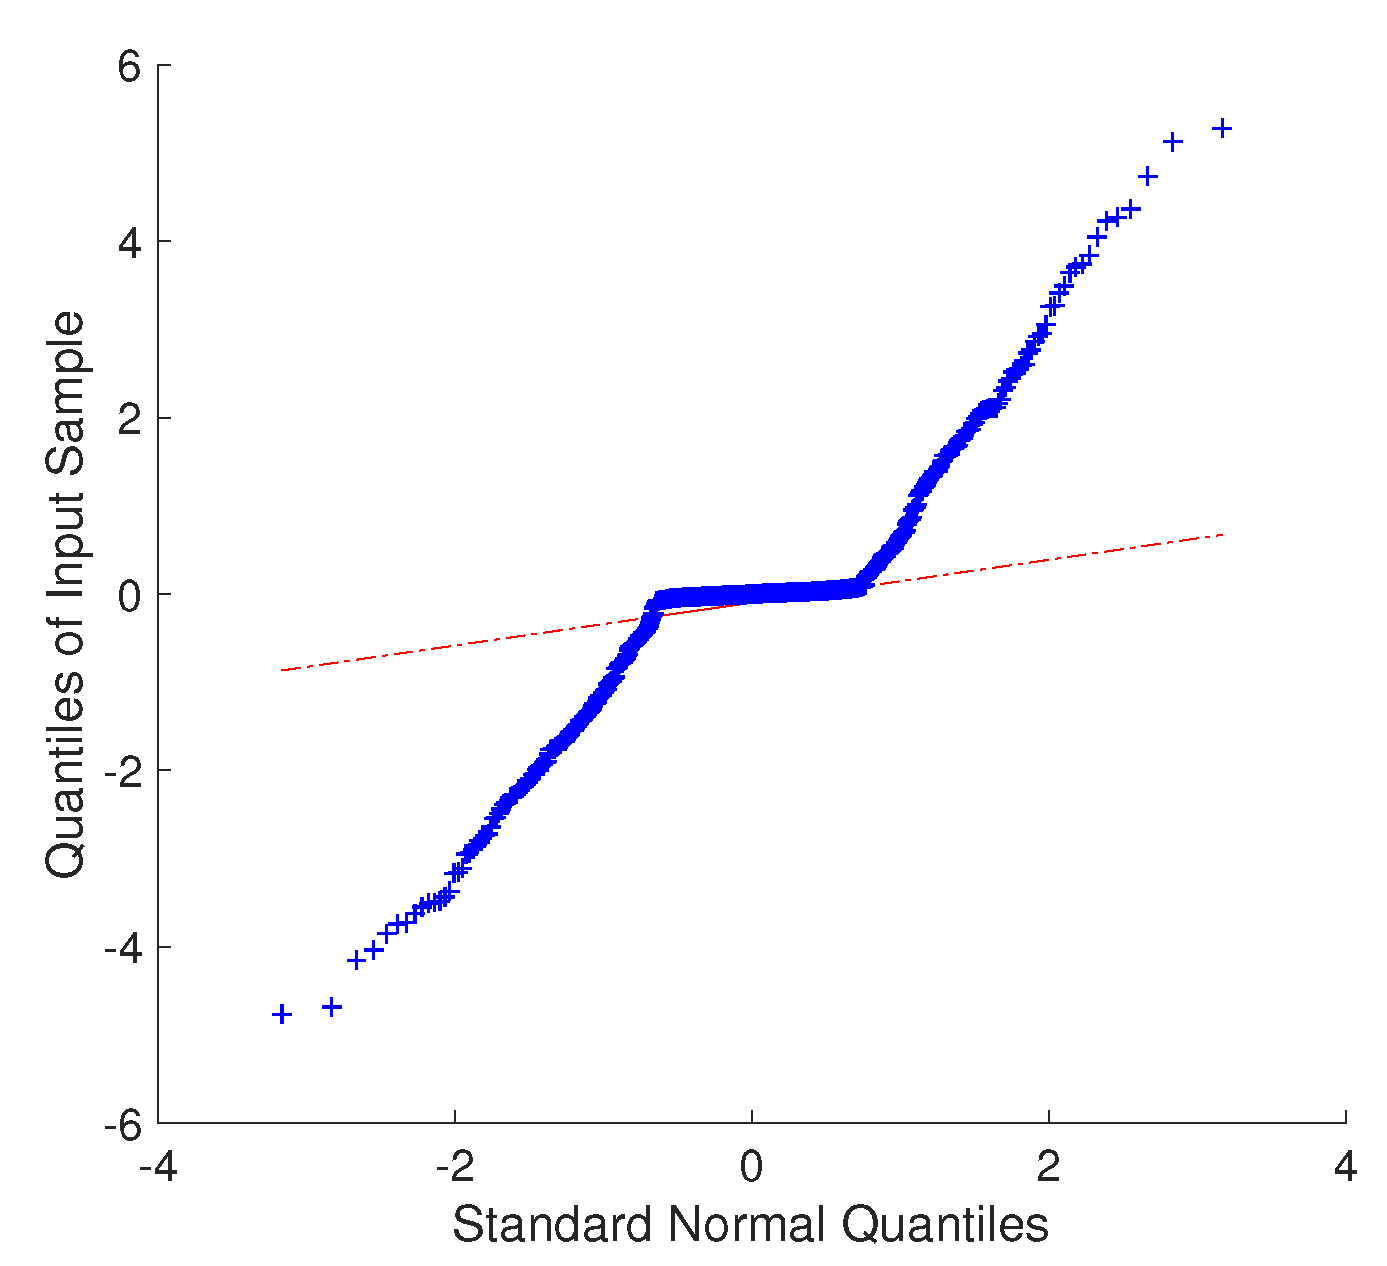
First, the residuals were analyzed. The QQ-plot for the residuals of the existing method are shown in
Figure 5. The residuals do not appear to be distributed normally. This is caused by the design of the model in which all the parameters were evaluated using a single set of equations. The
Y vector consisted of both
and
values. The magnitude of residuals for
and
is of different scales. Thus, the final residuals are made up of two data sets which are normally distributed with different variances. The uncertainty was given by the deviation calculated using Method 1. Since the assumptions
b and
d about heteroscedasticity and normality were invalid, the CIs of the parameters were not correct. The actual percentage error was calculated based on the known reference values of the parameters. However, in the field measurements, accurate reference would not be available. In that case, the computed CIs give the expected error in the parameter estimates. Thus, a comparison between the calculated CIs and actual percentage errors is presented in
Table 2. To simplify the result analysis and comparison process, the CIs are mentioned as the percentage deviation from the expected value of the parameters.
It is observed that the error in the estimates has increased in the presence of random errors in the phasor estimates. It was established that as there were no magnitude and phase errors in the CTs and VTs, the parameter estimates would be free from bias errors. Hence, the precision of the estimates given by the CI would be suggestive of the overall accuracy. However, for the existing method, the CIs for individual parameters are narrow and fail to include the actual error percentage.
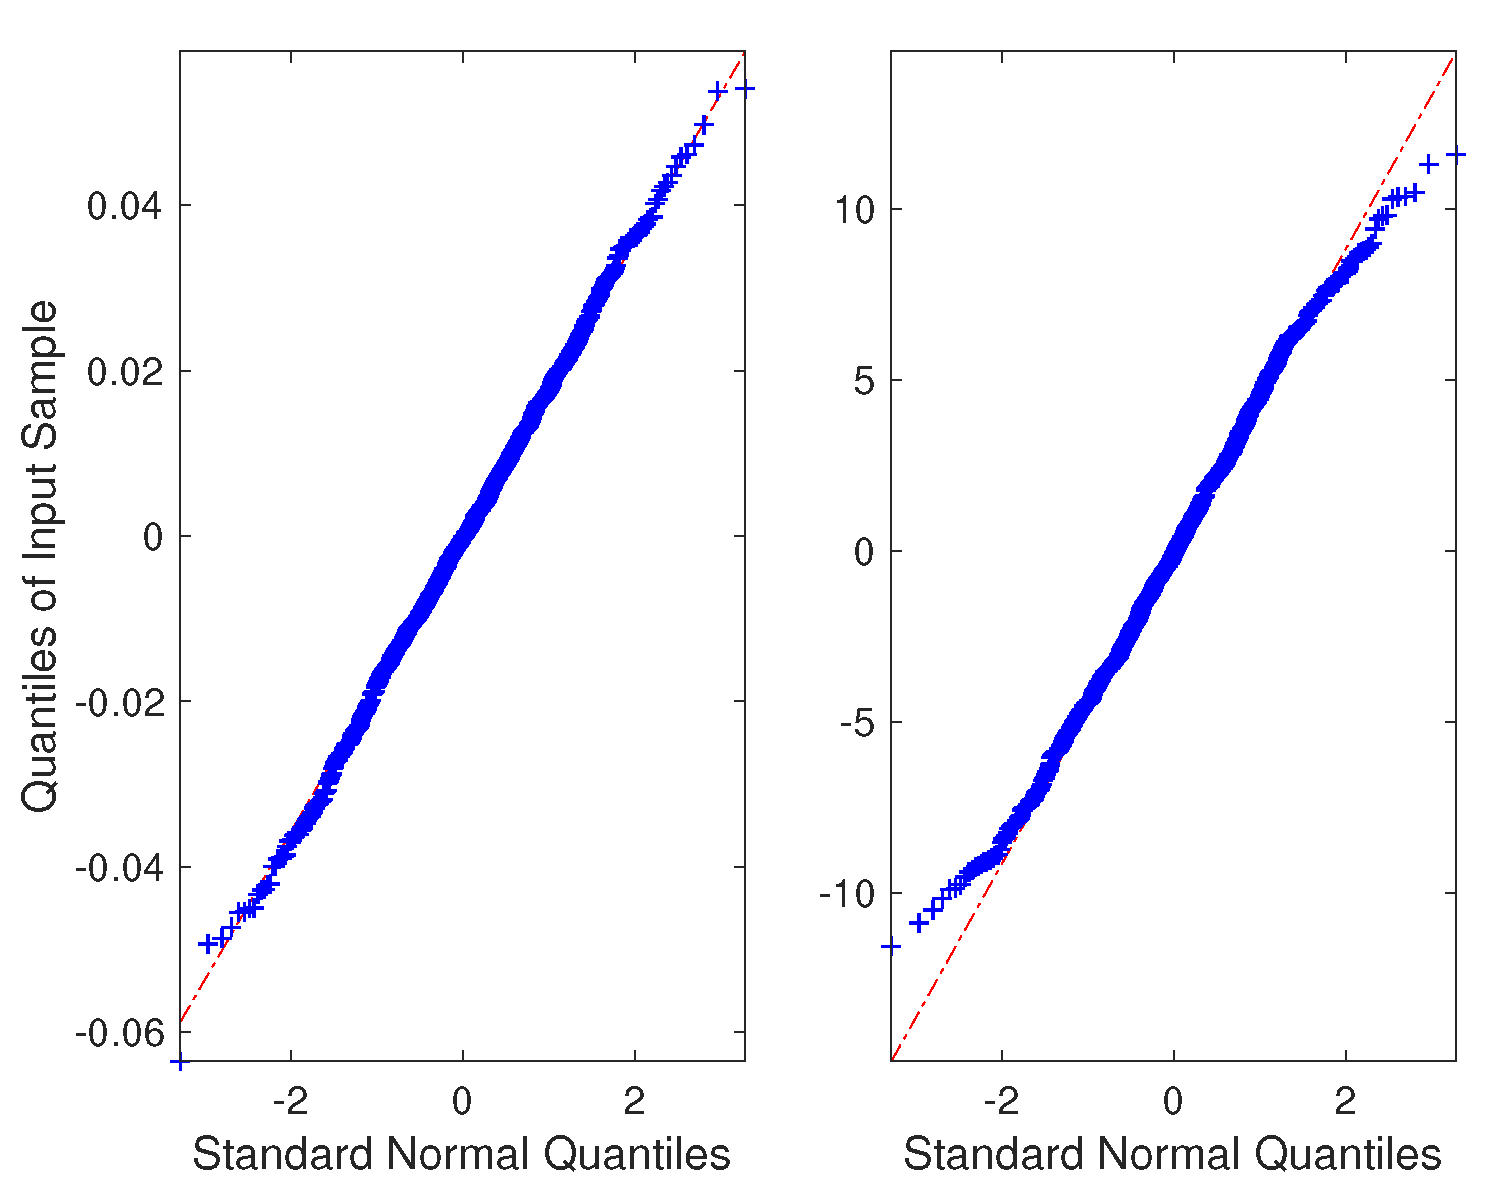
In the proposed method, the two sets of Equations (
12) and (
13) are solved separately, and the two sets of residuals are obtained. Separate uncertainty estimates are calculated based on the statistical properties of both the equation sets. The QQ-plot for the residuals of the existing method are shown in
Figure 6. It was observed by the plots that the residuals from both the subsystems appear to have a normal distribution. These plots validate that the system modeled by the equations sets is explained by the measurements and the calculated uncertainty limits can be trusted. Component-wise confidence intervals using Method 1 and Method 3 for the parameters estimated using the proposed method are presented in
Table 3. Also presented are the actual error percentages associated with each parameter. For the sake of simplicity, the 3-phase cable simulated for the new method was modeled with no mutual susceptance. Norm-wise confidence interval using Method 2 and norm-wise actual errors in the parameters are presented in
Table 4.
On comparing the results shown in
Table 2 with the results shown in
Table 3 and
Table 4, two improvements can be observed. The absolute percentage error in the parameters caused by the random errors in measurements have been reduced by the new method. Secondly, the CI computed by the methods actually encompasses the absolute errors. However, as shown in
Table 3, it was found that the CIs given by Method 3 are very wide compared to the actual percentage errors. Hence, Method 1 was selected to compute component-wise CI, and Method 2 was selected to compute norm-wise CI. The effect of fixed bias errors in the measurements on the parameter estimates is presented in
Section 5.3.
5.3. Measurements with Only Fixed Bias Errors
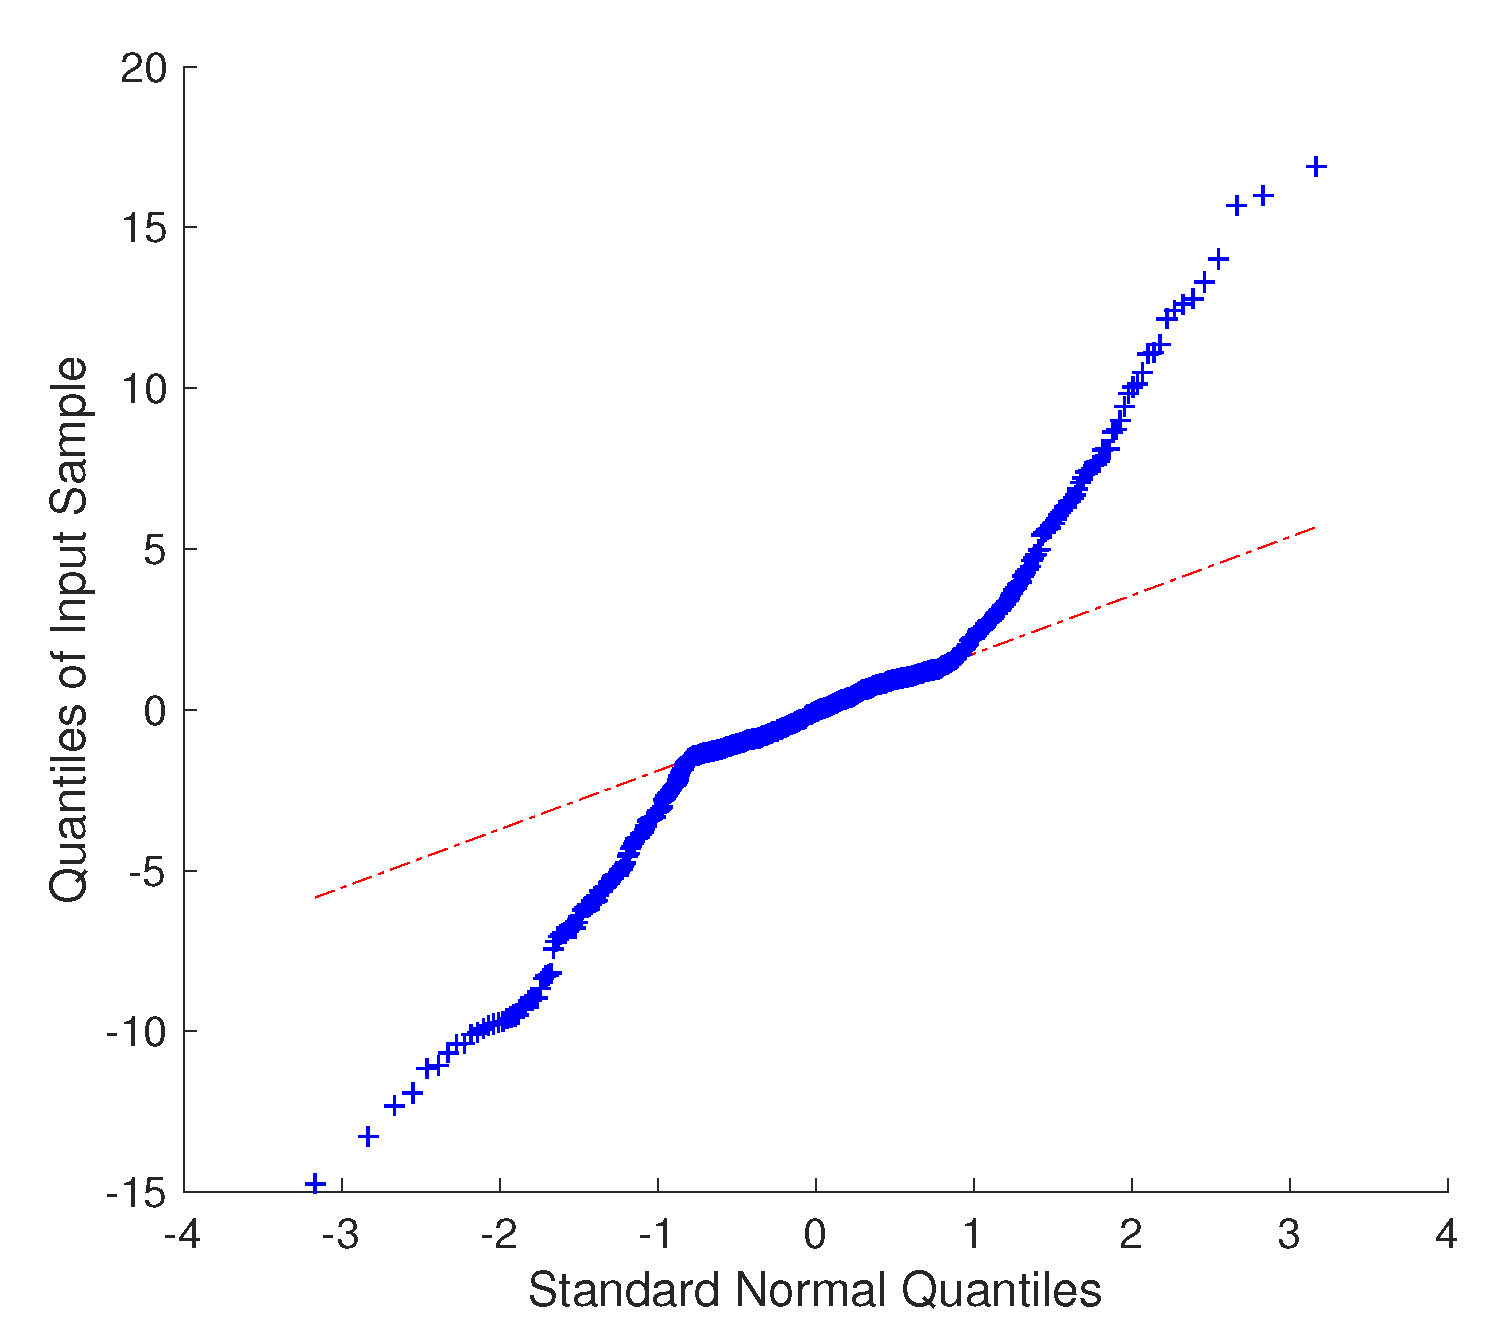
Class 1.0 CTs and VTs are used, and they are not calibrated. That means the correction coefficients are not known, and the actual magnitude and phase errors could be anywhere in the range of class 1.0 CTs and VTs. Thus, there was an unknown bias present in the used voltage and current measurements. No random noise errors were imposed on the measurements. The same power flow profile was used, and current and voltage signals were recorded and filtered. The data were fed to both methods, and cable parameters were estimated. The QQ-plots for residuals for both methods are plotted in
Figure 7 and
Figure 8. It was observed that the residuals obtained using the existing method do not appear to have a normal distribution. In comparison, the residuals obtained while estimating the parameters using the proposed method seem to have a better fit for a normal distribution. It is also observed the residuals from the proposed method are smaller in magnitude in comparison with the residuals from the existing method. These factors suggest that the proposed method gives better accuracy parameter estimates.
The CIs of parameters calculated using the existing method along with the actual errors are presented in
Table 5. It can be seen that there is a significant difference between the estimated CIs and the actual errors of the parameters. For the proposed method, the uncertainty caused by the bias errors in the measurements is calculated as per
Section 4.4 and is presented in
Table 6. It was observed that the actual errors for all the parameters are enveloped by the CIs.
Table 2,
Table 3,
Table 4,
Table 5 and
Table 6 show the superiority of the new proposed line parameter estimation and the uncertainty computation methods. In the existing method, the residuals in the presence of bias errors and random noise appear to have a non-normal distribution, and as predicted, the accuracy of the estimated parameters is not in accordance with the calculated CIs. When compared to the reference value of the parameters, the estimated parameters were outside the CIs. The parameter estimates from the proposed method when compared to reference values were found to be more accurate. In field measurements, the actual reference could be unavailable or misleading. Hence, the CIs should be reliable and precise. The proposed method gave reliable and precise CIs in the presence of bias and random errors. After the comparison, Method 1 from
Section 4.1 was chosen to estimate the uncertainty caused by the random errors and the uncertainty caused by bias errors in the measurements was estimated using the Monte Carlo-based method shown in
Section 4.4. Combined uncertainty in terms of a CI was then calculated according to Equation (
23).
5.5. Laboratory Test with Random and Bias Errors
This test presents the performance of the proposed method in the presence of random and bias measurement errors in the sensors. The power quality laboratory at the university has a 4-core (3 phase + 1 Neutral) Al cable of a total cross-section area of 70 2 feeding a flexible power source to a number of household connections via short 16 2 (3 phase + 1 Neutral) Cu cables. The new proposed method was tested for its accuracy while estimating the impedance parameters of the combination of the Al cable and the Cu cable until the last household. The exact length of the main Al and smaller Cu cables was unknown. To set a reference, the DC resistance of the combined cable was calculated using several measurements at varying DC current levels from 1 A to 10 A. The DC current was measured by the and the voltage difference between the two ends of the cable was measured by high accuracy devices. The reference DC resistance between the two ends of the cable system was calculated to be 0.0935
. For the parameter estimation test, time domain voltage waveforms were measured and digitally acquired at two ends of the line using two National Instruments NI-9225 voltage input modules based on cRIO-9038 chassis. The line current was measured by a rogowsky coil and acquired by an NI-9234 input module. All of the measurement signals were acquired with a sampling frequency of 25 kHz. All the input channels of the cRIO chassis were also time-synchronized with an accuracy of
ns. Bias associated with each individual component of the measurement chain was taken from the manufacturer’s specification sheet. This bias uncertainty associated with each equipment is presented in
Table 8. These values are the maximum possible fixed deviations in the measured signals.
The combined bias in the measured current and voltage signals was estimated using Type B uncertainty calculation as suggested in the GUM. The absolute uncertainty of the individual component is computed as the sum of all of the associated errors for that device. Thus, for each component
x, the uncertainty variance
is calculated as the sum of its gain and offset errors. The combined uncertainty of two devices in a chain is given as the euclidean norm of the individual absolute uncertainty. For current measurement, the rogowski coil is used along with the NI-9234 acquisition block. Hence, the combined uncertainty in the current signals (
) due to bias in each of the components is given by:
The signals were converted into phasors using the DFT-based method. The combined bias in voltage and current phasors was calculated to be and , respectively. For the sake of simplicity, these bias errors were assumed to be solely magnitude errors of the CTs and VTs. These bias errors in the measure current and voltage signals were utilized to estimate the uncertainty in the resistance and reactance parameters of the cable.
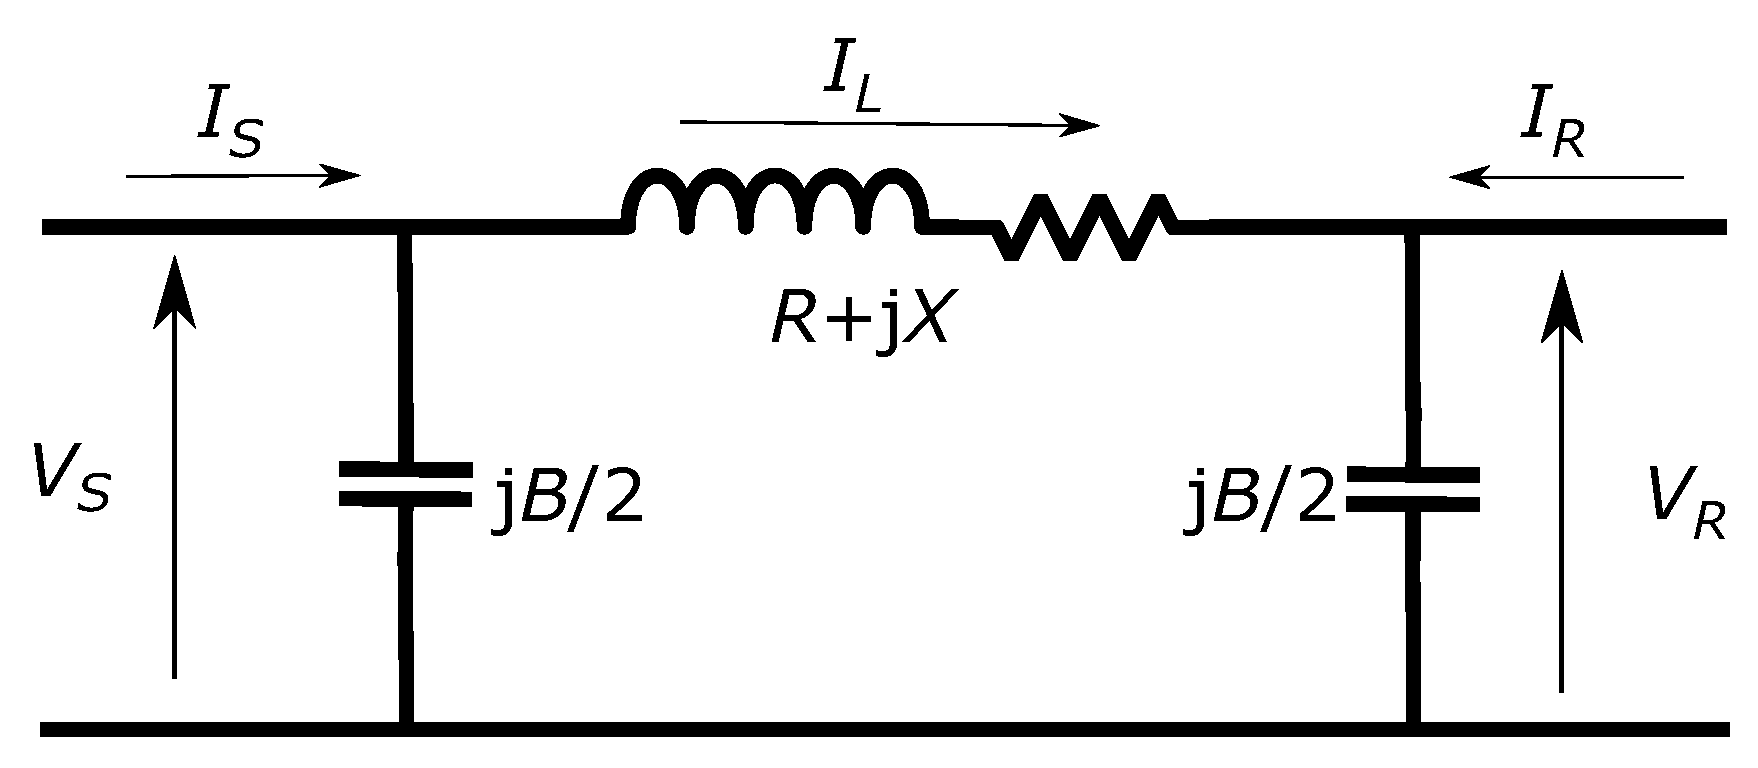
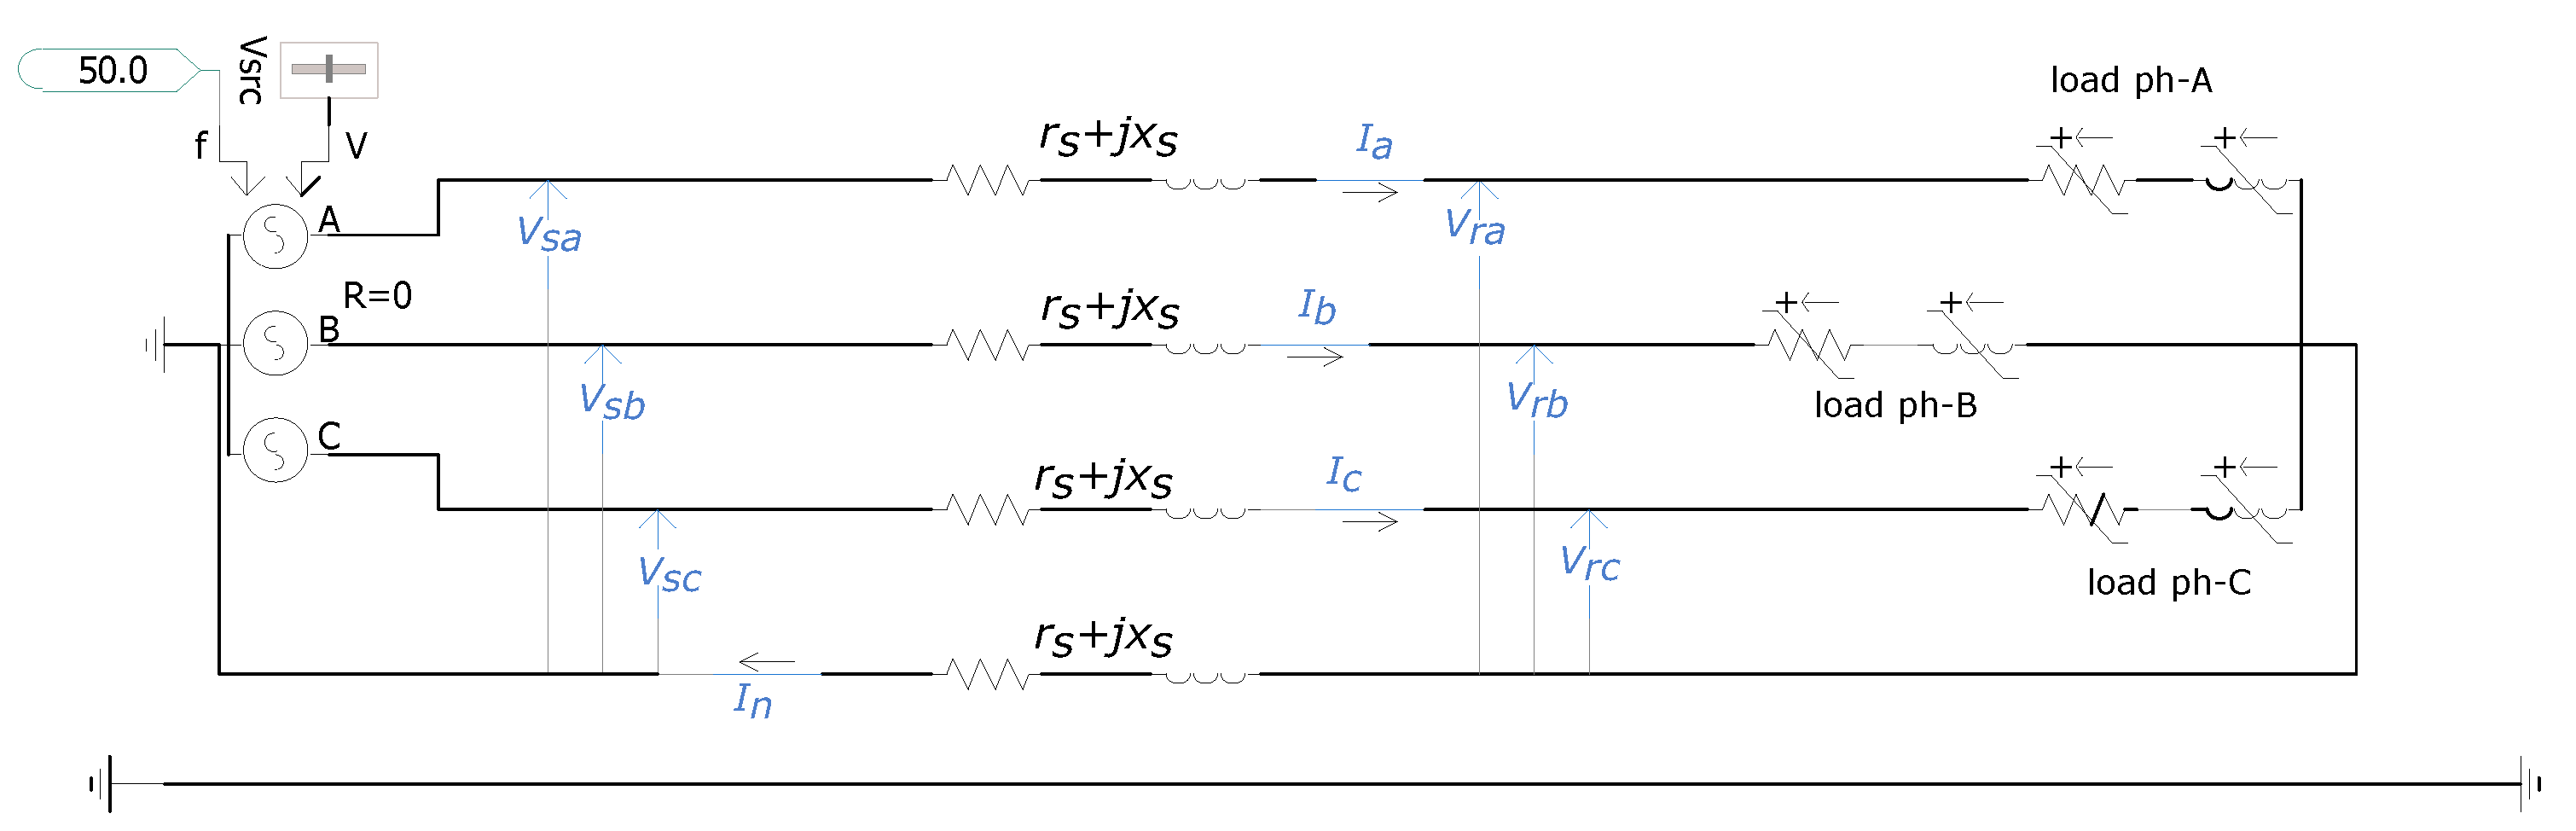
Since the length of the cables was very small, the effect of charging capacitance was ignored. Due to the small charging capacitance, there would not be any measurable difference between the current at two ends, and hence, current measurement was done only at one end and the current difference Equation (
1) was ignored. Voltage and current phasors were calculated using the synchronized waveforms. Only the voltage difference in Equation (
2) and hence, Equation (
11) was used to make the system of linear equations. The 3-phase voltage difference equation can be written in matrix form as:
that is :
Figure 9 gives a basic overview of the laboratory cable and the measurement set-up. At the source end, there is a flexible and controllable voltage source and at the load end, there is a controllable load bank. The load bank was controlled to vary the load over a period of time. To facilitate the estimation of mutual reactance, a voltage drop due to the mutual reactance is required. Unbalanced loading of each phase excites the voltage drops due to mutual reactances. Hence, the load of each phase was kept different from each other. To model the laboratory cable, it was assumed that:
Self-impedance of all the three phases and the return path (neutral) is the same;
Self-resistance of single core of the cable (all phases and neutral) : ;
Self-reactance of single core of the cable (all phases and neutral) : ;
Mutual reactance coupling between all the phases is the same: ;
The mutual coupling effect of the neutral current on other phases is ignored.
The voltage difference equation can then be written with the help of parameters
,
, and
. The current in neutral (
) is the summation of
,
, and
. These conditions make the voltage difference equations:
Using Equations (
26)–(
28), we can write the
in the form:
where the effective mutual reactance in phasor form
. Comparing
with
matrix, it can be seen that:
Thus, for accurate construction of the impedance matrix in phasor form () the parameters required to be estimated are: .
The existing and the proposed methods were used for estimation of parameters of the cable system. No correction coefficients for the bias present in the measurement sensors was applied in the model of Equation (
9). Thus, for the proposed method, the model Equation (
13) with adjusted correction coefficient
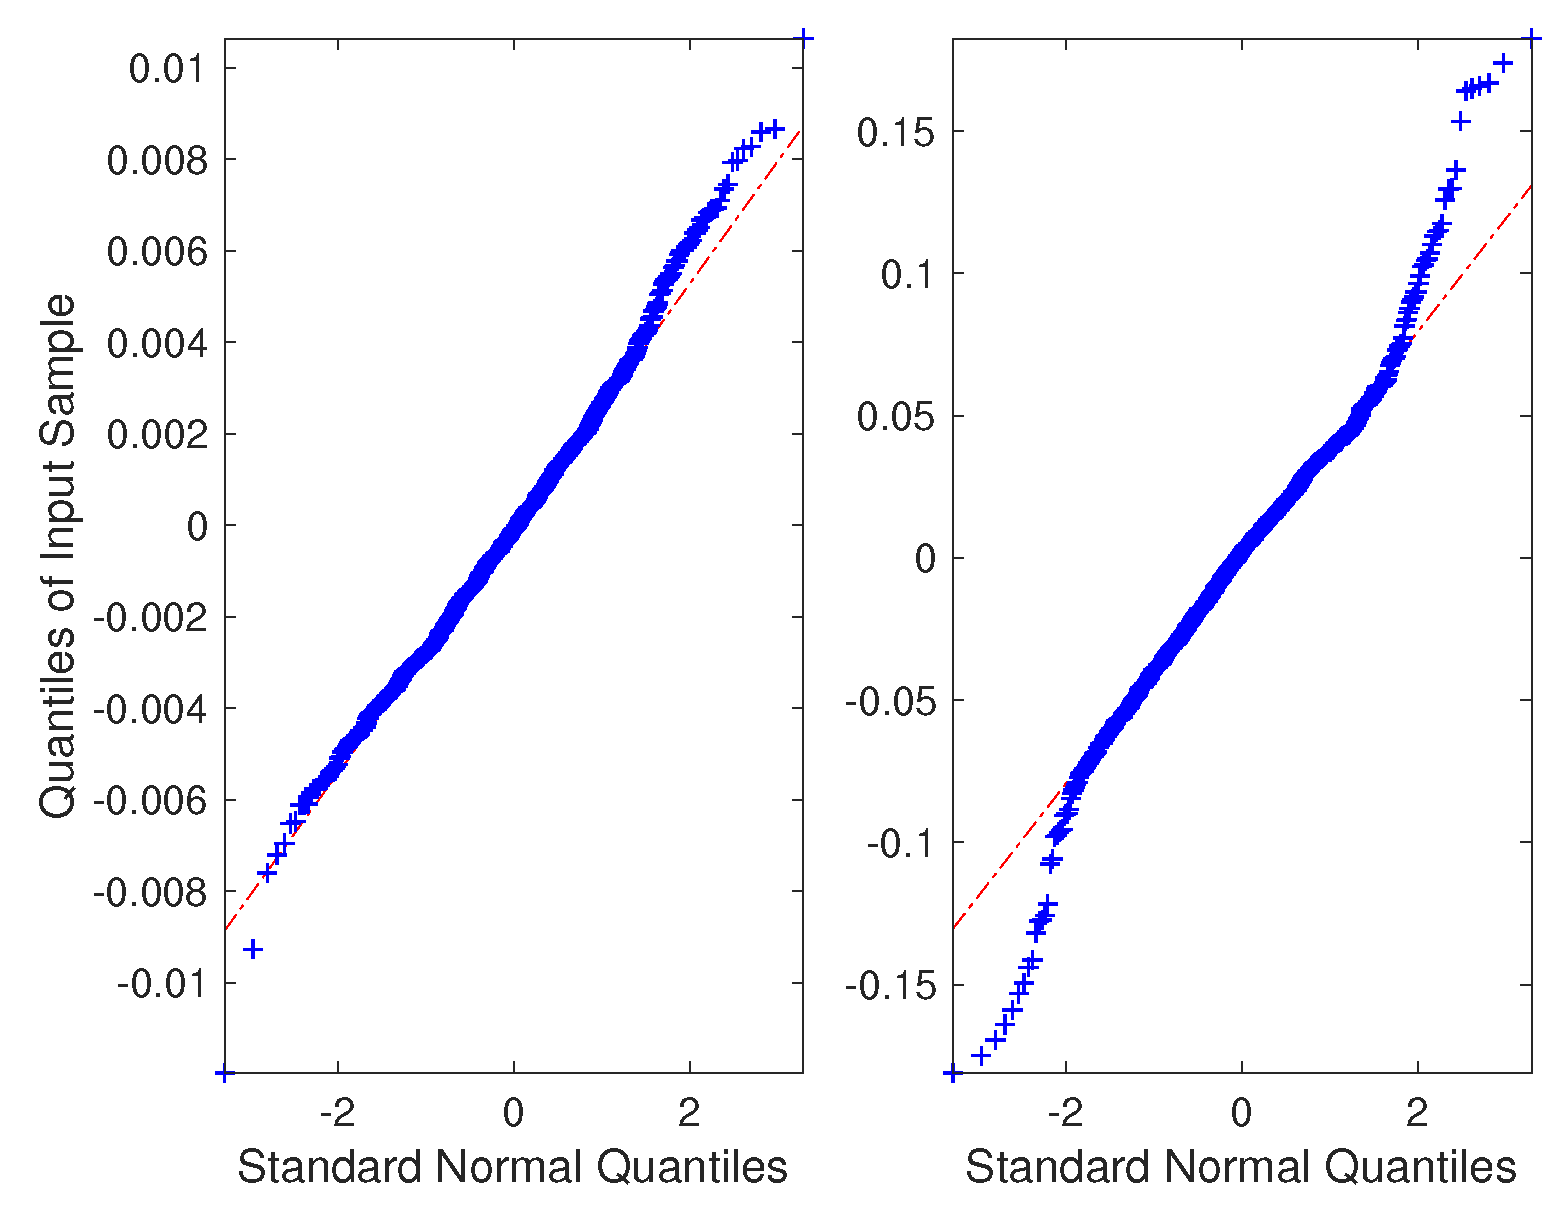
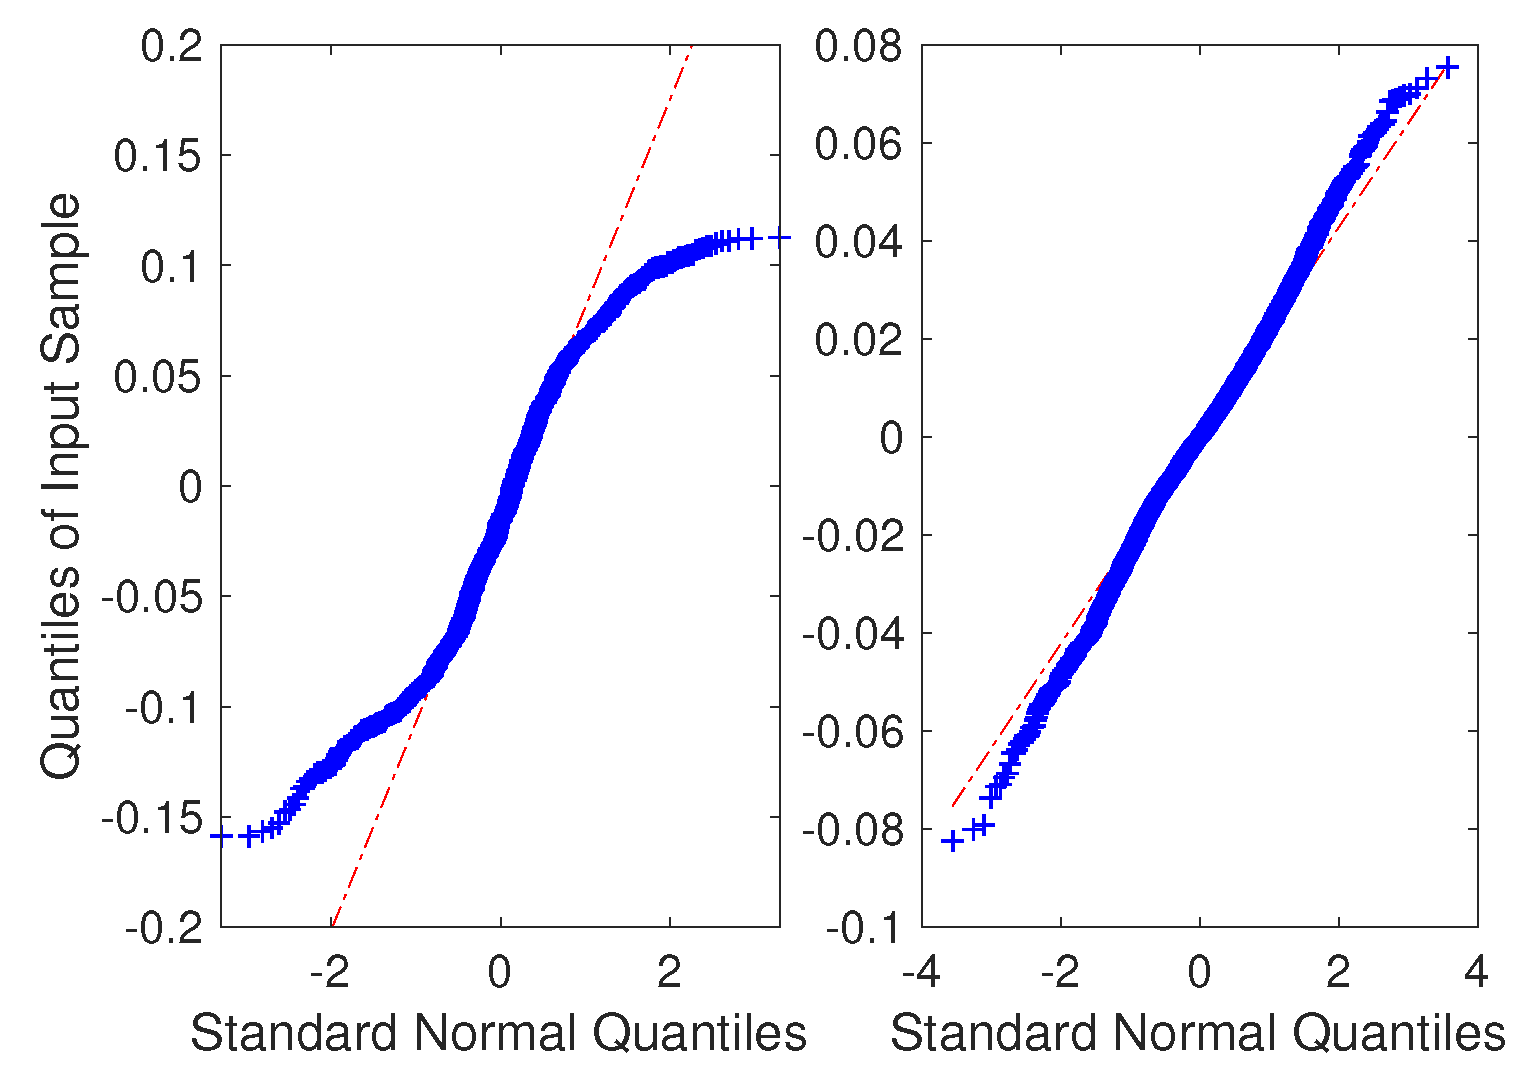
was utilized to estimate the impedance parameters. The QQ-plots of the residuals of the two methods are presented in
Figure 10. The left side plot from the existing method does not appear to have a normal distribution. This indicates that there is an unaccounted bias error present in the measurement system. Comparison of the magnitude of the residuals from both the methods was done by comparing the ratio of euclidean norms of residuals (
s) and the norms of corresponding measurement vector (
Y). The ratio was 0.0721 for the existing method, while the new method resulted in a much smaller ratio of 1.0413
. The smaller norms ratio along with the QQ-plot comparison suggests that the results obtained from the proposed method are more accurate and have reliable uncertainty estimates when compared to the existing method. The results in terms of expected values and combined confidence intervals of the parameters are presented in
Table 9.
The
matrix was composed with the estimated parameters using Equation (
29). It was then converted into sequence components:
The positive sequence resistance is quite close to the reference value measured by the DC measurement system. Further, the fact that the zero sequence impedance is about four times the positive sequence impedance (especially for the resistance estimate) also suggests that the estimates are supporting the considered cable model. For a 3-phase 4-wire system with neutral as a return path, it is known that:
and in this case,
. This validates the condition stated in Equation (
30).
This subsection demonstrated the application of the proposed method for cable parameter estimation for an LV cable in a laboratory. A comparison with the results from the existing method was done to show the superiority of the proposed method. The next section presents some general discussion about the application of the proposed method in a real field.

 ,
, 


