Does Reduction of Material and Energy Consumption Affect to Innovation Efficiency? The Case of Manufacturing Industry in South Korea


Abstract
:1. Introduction
2. Theoretical Background
2.1. Material and Energy Reduction as Innovation Objectives
2.2. Material and Energy Reduction and Firm Performance
2.3. Innovation Efficiency
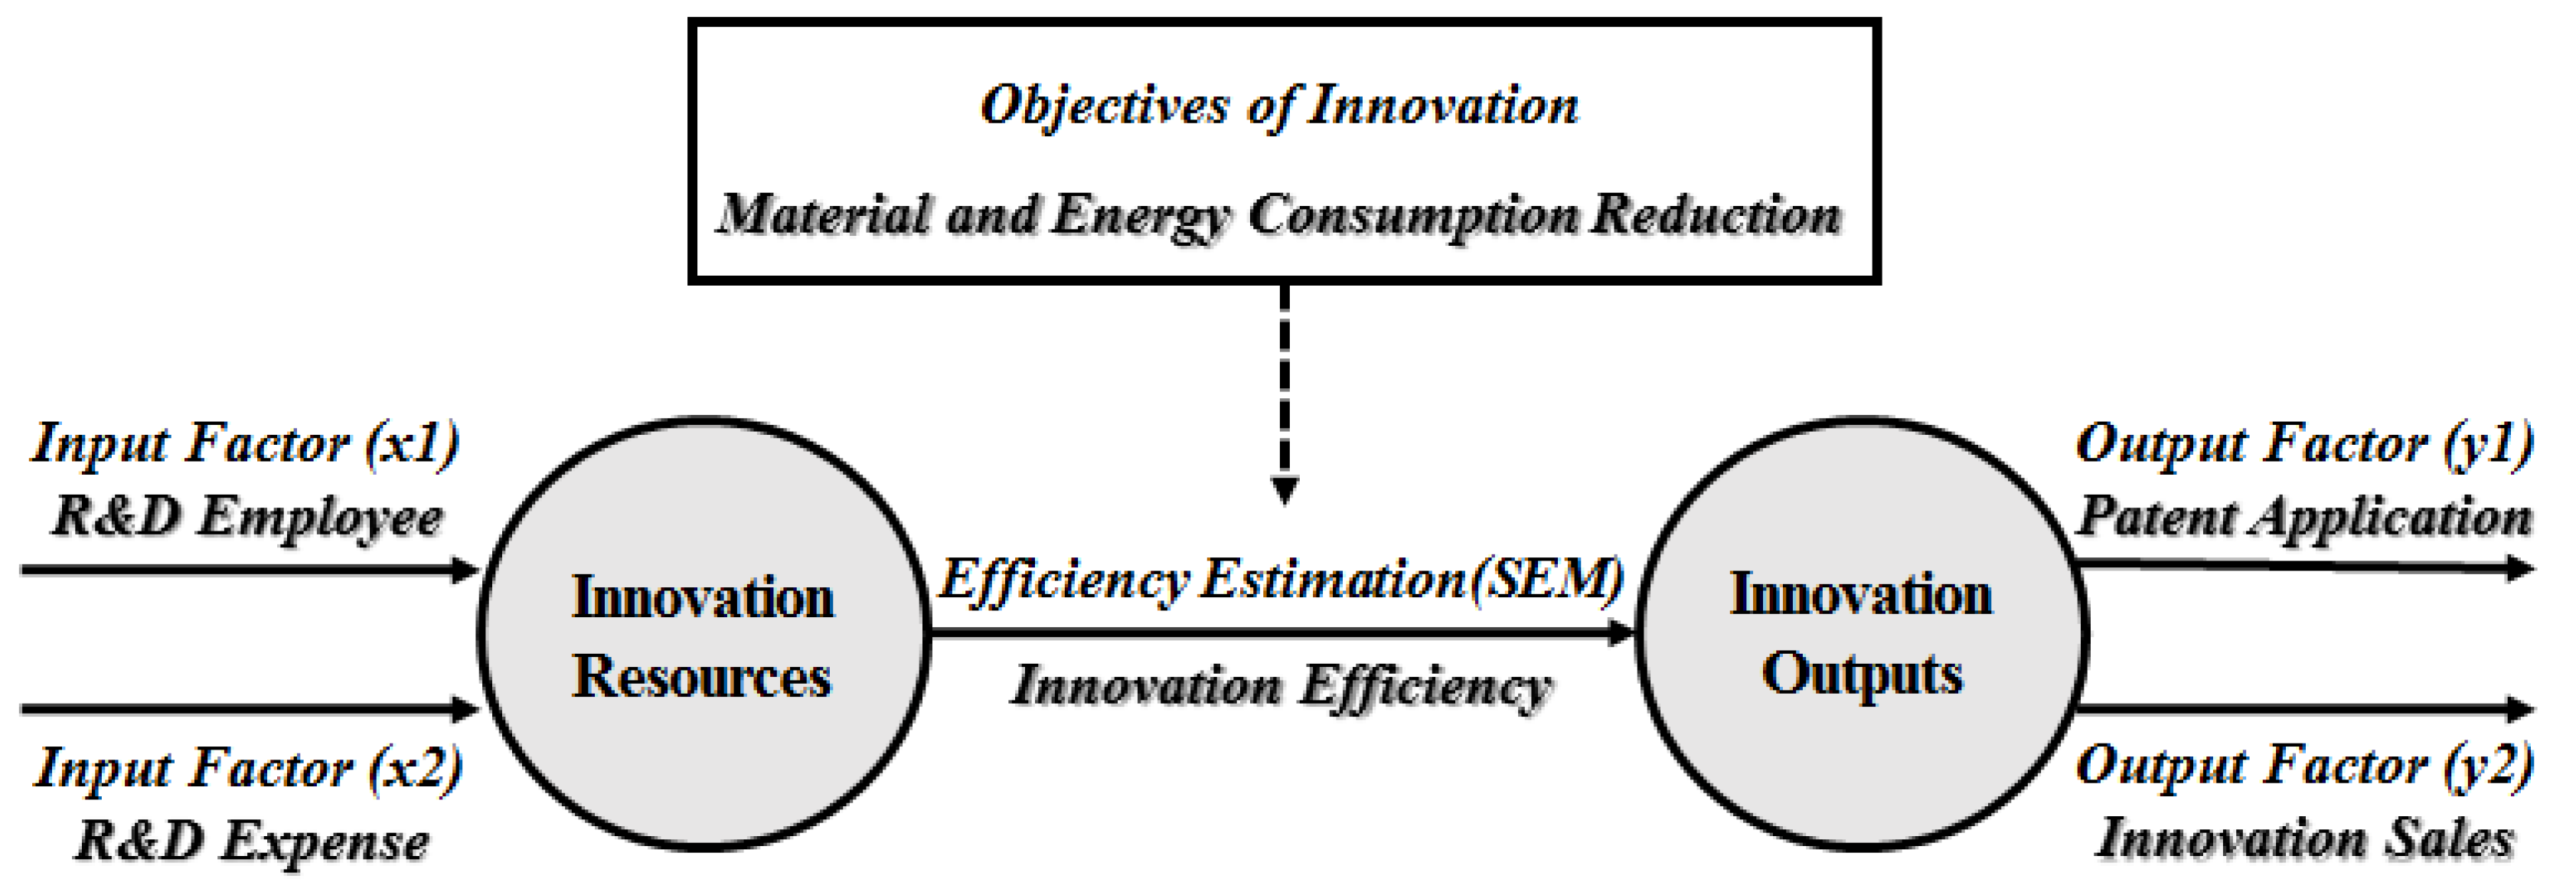
3. Methodology and Model
3.1. Data Envelopment Analysis (DEA) and Tobit Regression Analysis
3.2. Data and Measurement
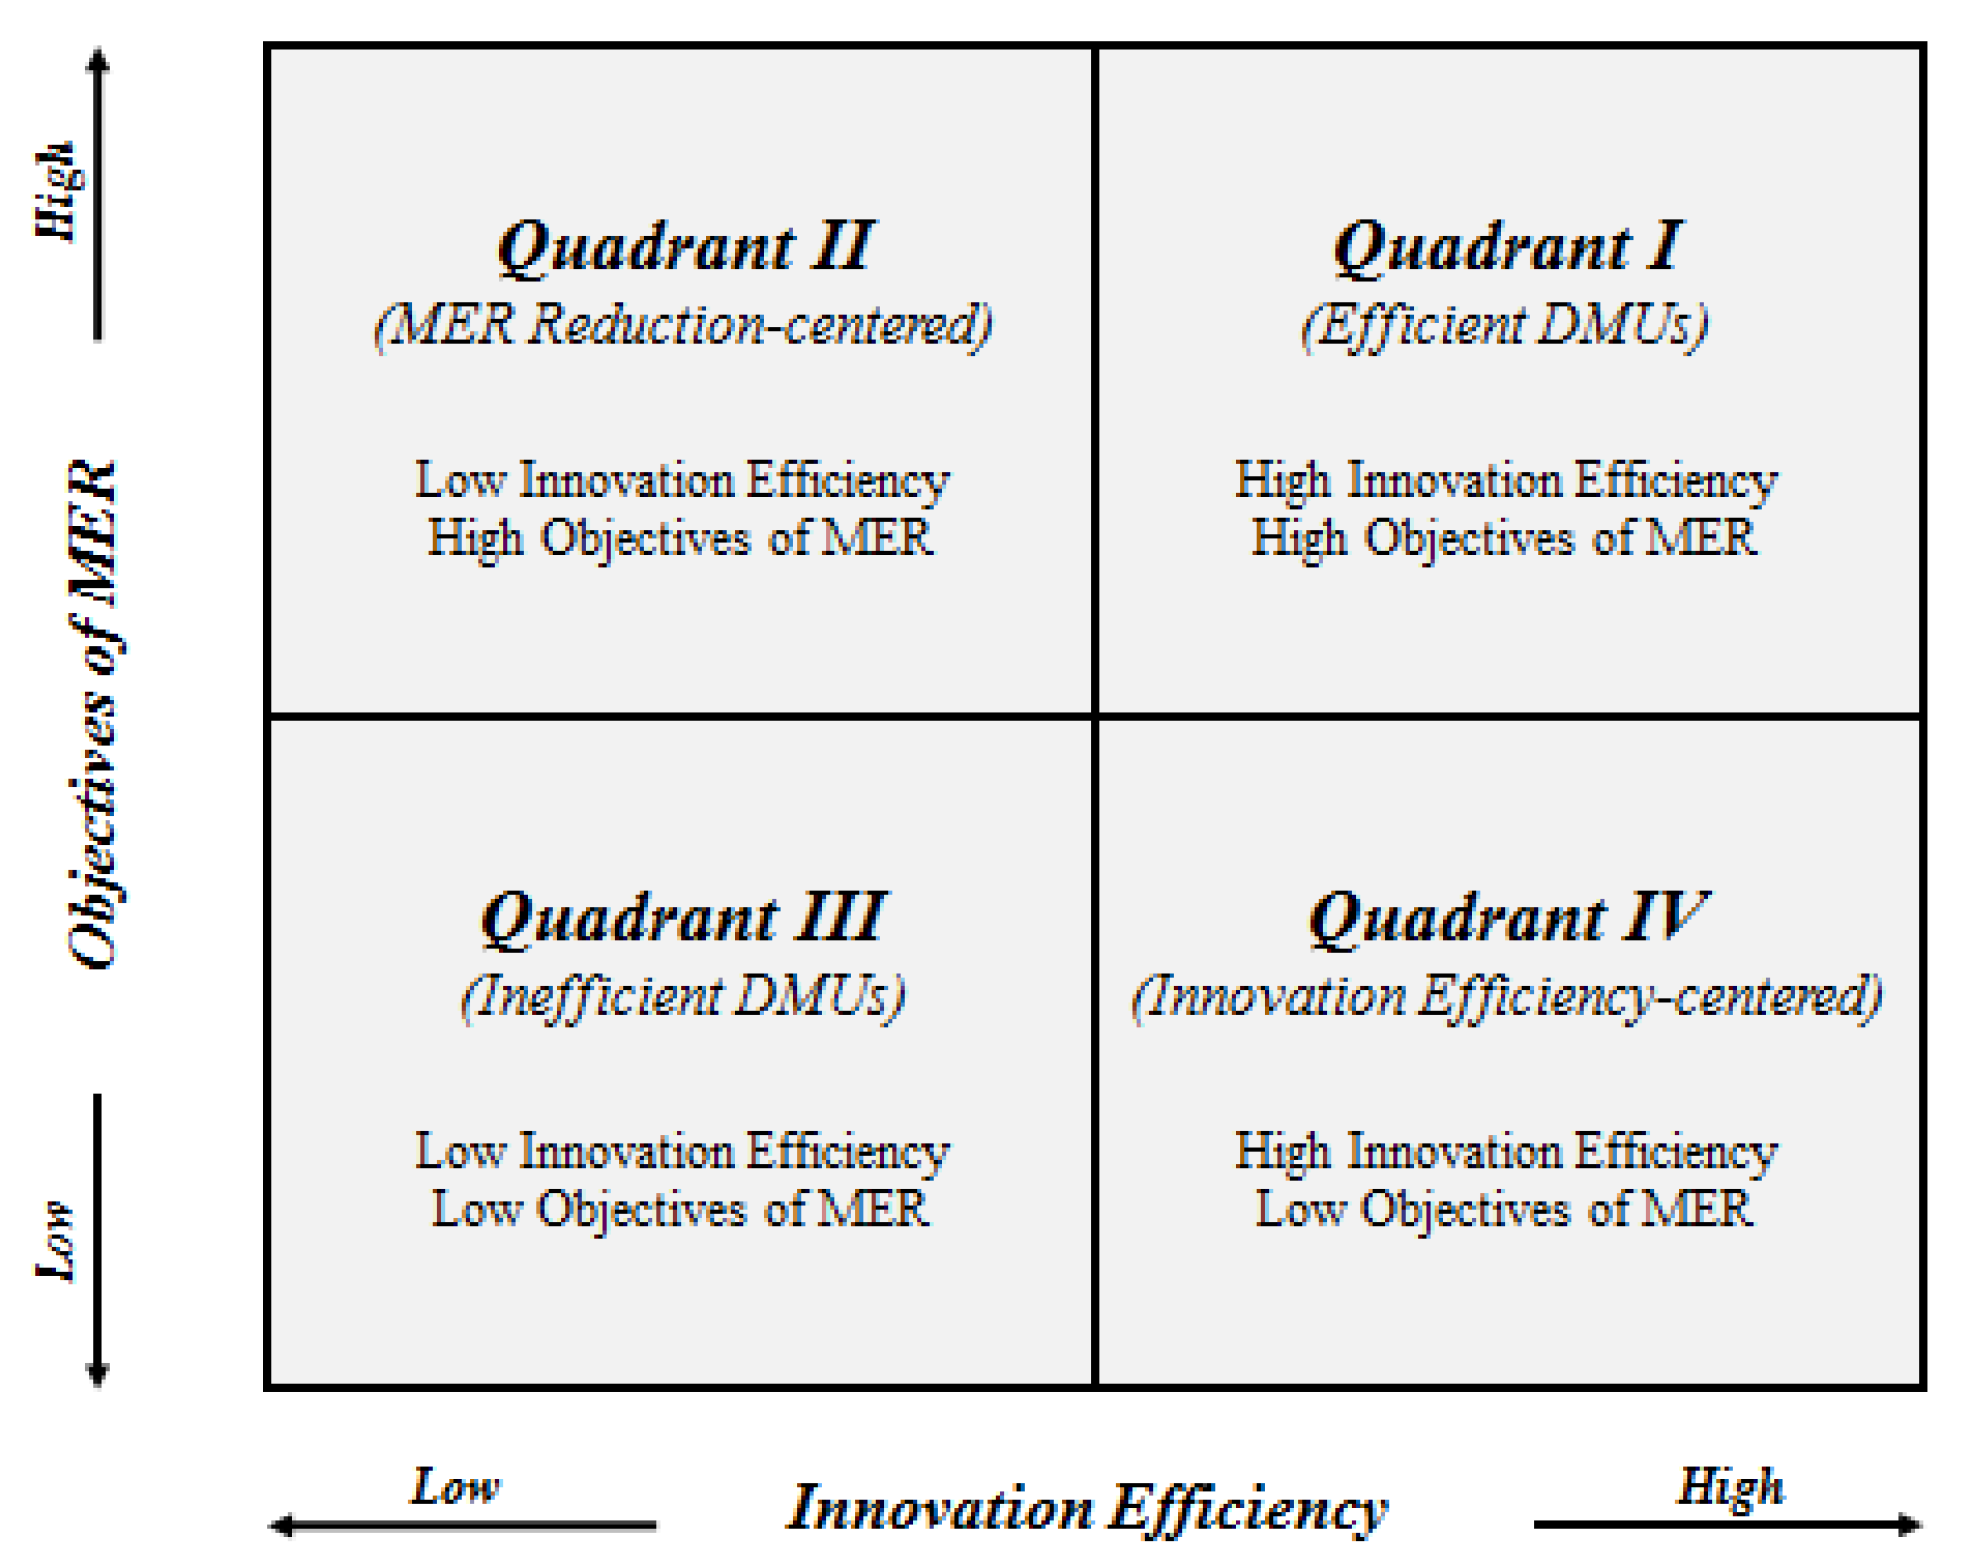
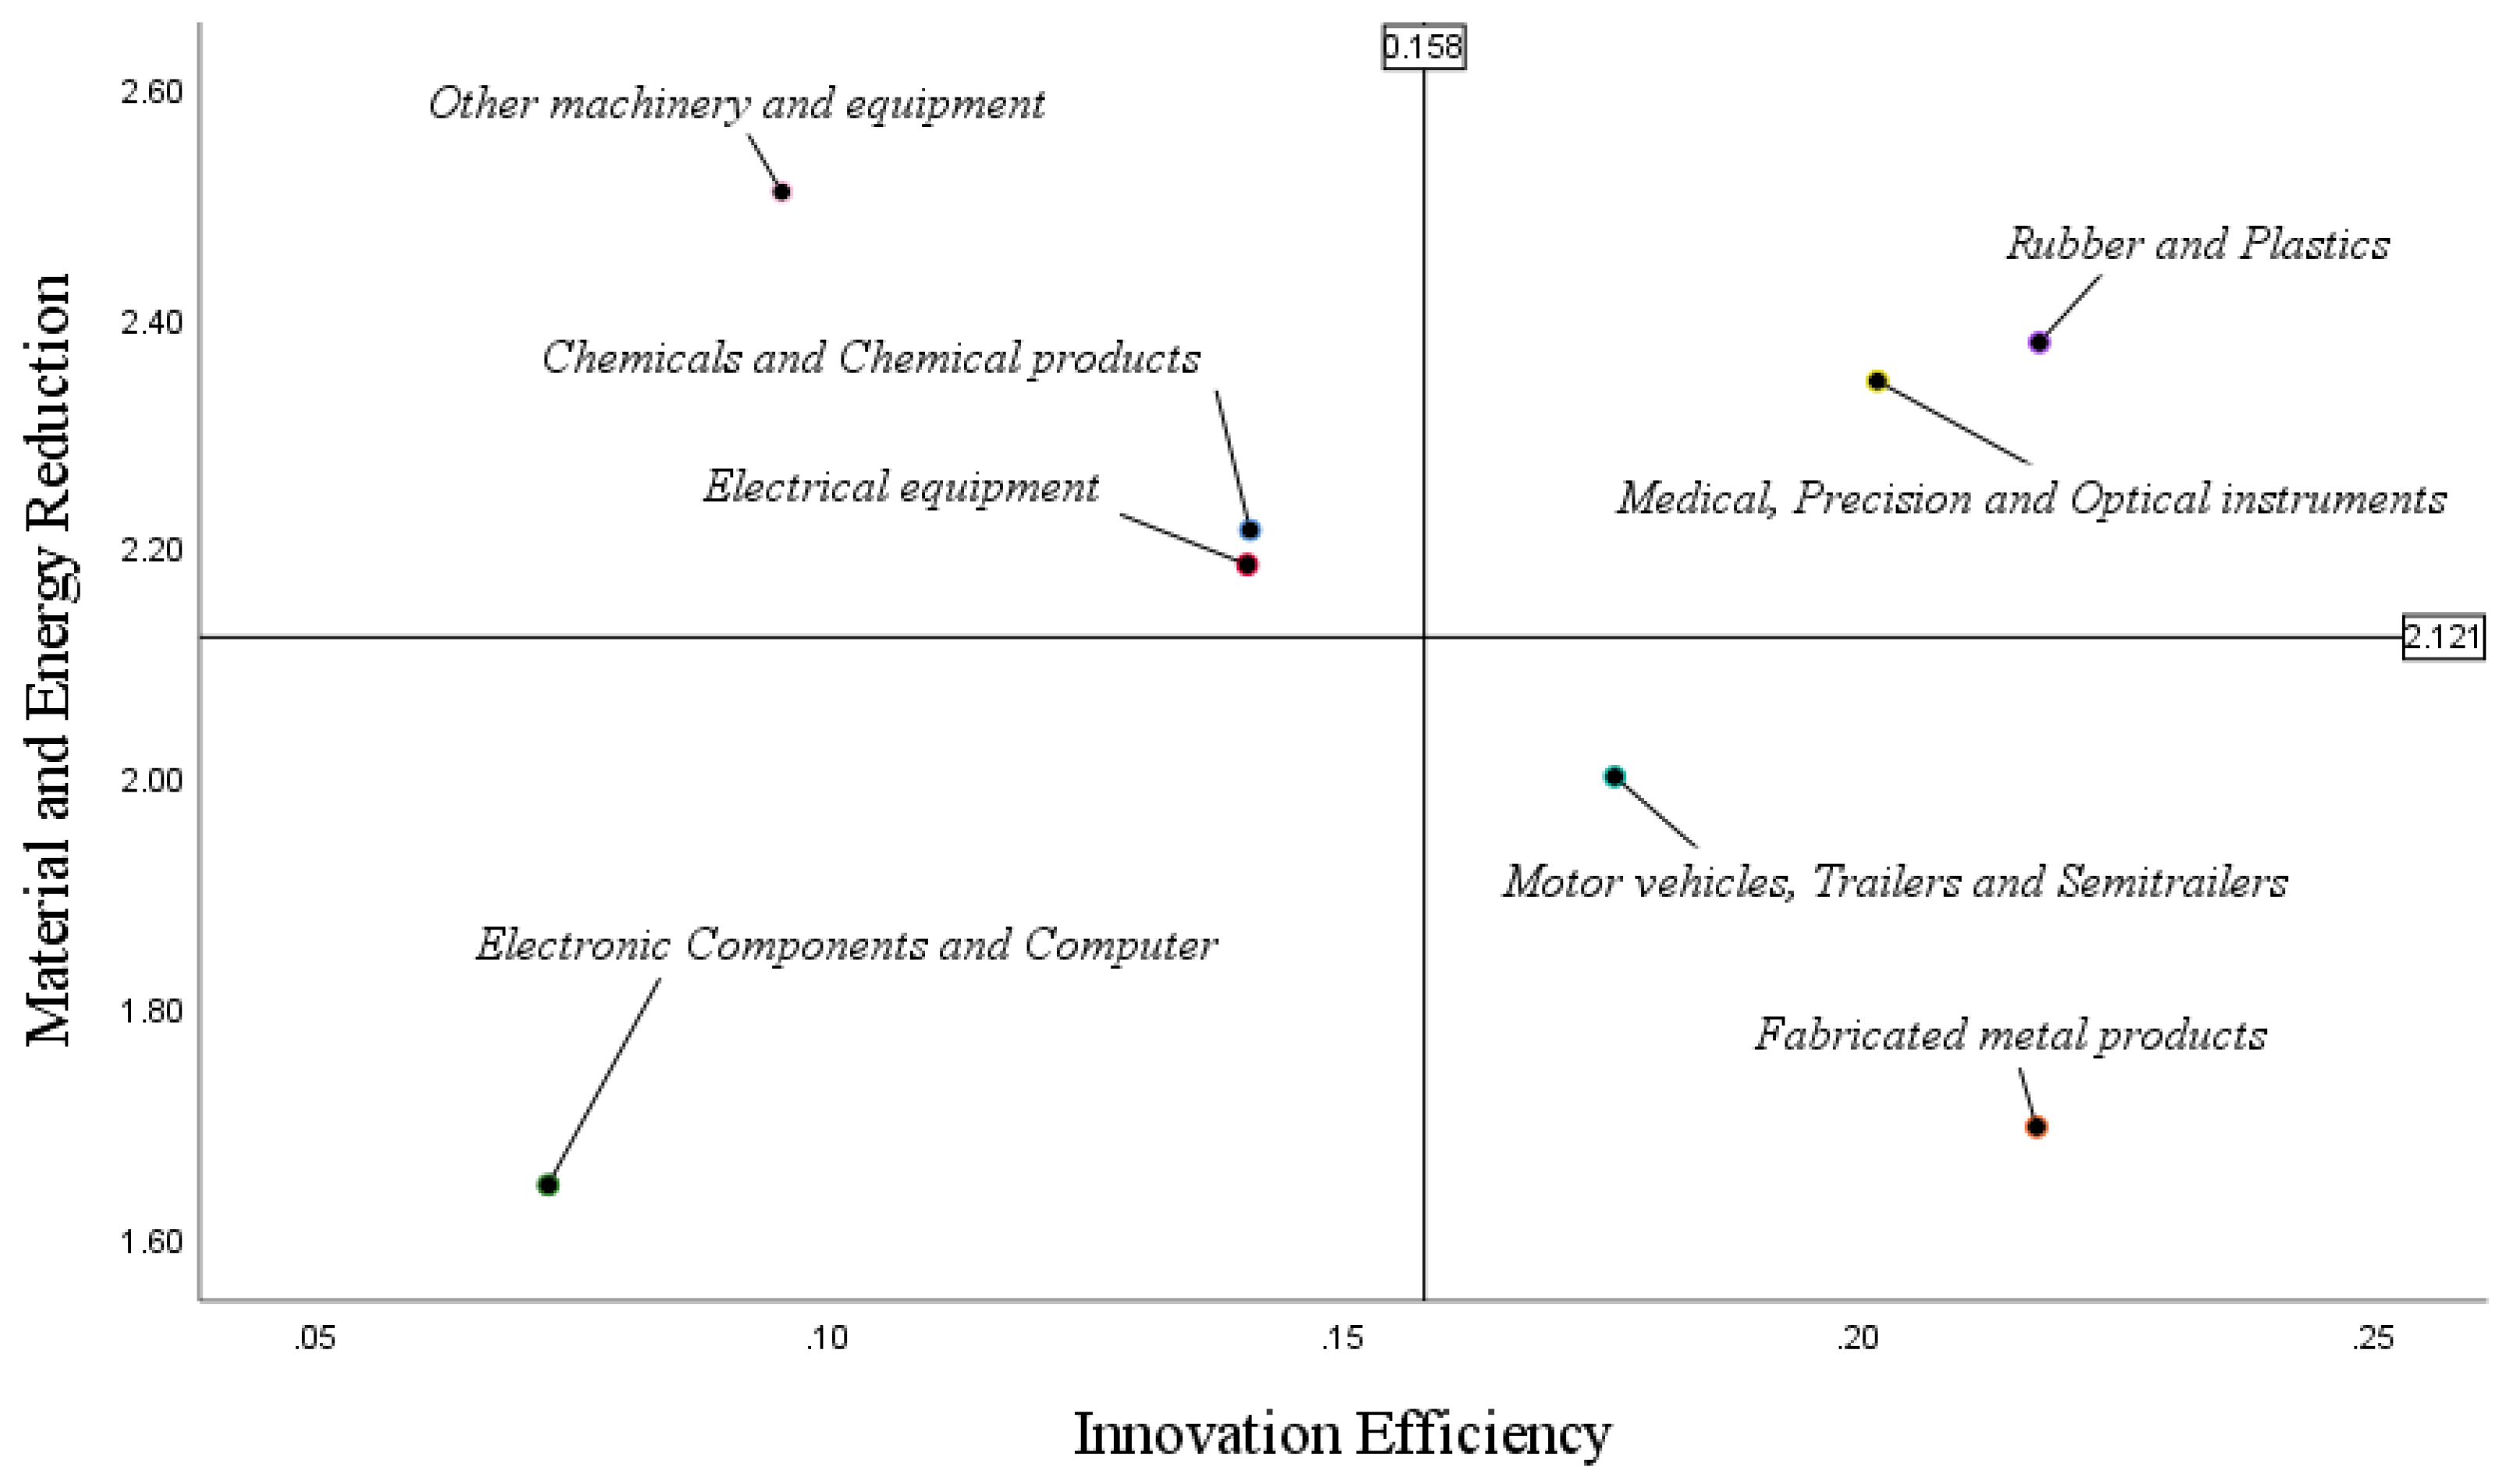
4. Results
5. Conclusions
5.1. Discussion and Implications
5.2. Limitations and Directions of Future Research
Author Contributions
Funding
Conflicts of Interest
References
- Schiederig, T.; Tietze, F.; Herstatt, C. Green innovation in technology and innovation management—An exploratory literature review. R D Manag. 2012, 42, 180–192. [Google Scholar] [CrossRef]
- Fichter, K.; Clausen, J. Diffusion dynamics of sustainable innovation-insights on diffusion patterns based on the analysis of 100 sustainable product and service innovations. J. Innov. Manag. 2016, 4, 30–67. [Google Scholar] [CrossRef]
- Fu, X.; Zanello, G.; Essegbey, G.O.; Hou, J.; Mohnen, P. Innovation in Low Income Countries: A Survey Report; DFID-ESRC Growth Research Programme (DEGRP) and Technology Management Centre for Development (TMCD): Oxford, UK, 2014. [Google Scholar]
- Wintjes, R. Systems and Modes of ICT Innovation; JRC Science for Policy Report; European Commission-Joint Research Centre: Bruselas, Belgium, 2016. [Google Scholar]
- Schultze, J.; Schröder, A.; Hölsgens, R. Report on the Pilot Application of CASI-F for Assessing Sustainable Social Innovation; Applied Research and Communications Fund (ARC Fund): Sofia, Bulgaria, 2016. [Google Scholar]
- Robinson, S.; Stubberud, H.A. Green innovation and environmental impact in Europe. J. Int. Bus. Res. 2015, 14, 127. [Google Scholar]
- Hojnik, J.; Ruzzier, M. The driving forces of process eco-innovation and its impact on performance: Insights from Slovenia. J. Clean. Prod. 2016, 133, 812–825. [Google Scholar] [CrossRef]
- Ghisetti, C.; Rennings, K. Environmental innovations and profitability: How does it pay to be green? An empirical analysis on the German innovation survey. J. Clean. Prod. 2014, 75, 106–117. [Google Scholar] [CrossRef]
- Chen, Y.S.; Lai, S.B.; Wen, C.T. The influence of green innovation performance on corporate advantage in Taiwan. J. Bus. Ethics 2006, 67, 331–339. [Google Scholar] [CrossRef]
- Peng, Y.S.; Lin, S.S. Local responsiveness pressure, subsidiary resources, green management adoption and subsidiary’s performance: Evidence from Taiwanese manufactures. J. Bus. Ethics 2008, 79, 199–212. [Google Scholar] [CrossRef]
- Kunapatarawong, R.; Martínez-Ros, E. Towards green growth: How does green innovation affect employment? Res. Policy 2016, 45, 1218–1232. [Google Scholar] [CrossRef]
- González-Moreno, A.; Sáez-Martínez, F.J.; Díaz-García, C. Attitudes towards eco-innovation in the chemical industry: Performance implications. Environ. Eng. Manag. J. 2014, 13, 2431–2436. [Google Scholar] [CrossRef]
- Jugend, D.; Rojas Luiz, J.V.; Chiappetta Jabbour, C.J.; a Silva, S.L.; Lopes de Sousa Jabbour, A.B.; Salgado, M.H. Green product development and product portfolio management: Empirical evidence from an emerging economy. Bus. Strateg. Environ. 2017, 26, 1181–1195. [Google Scholar] [CrossRef]
- Yang, H.; Hsiao, S. Mechanisms of developing innovative IT-enabled services: A case study of Taiwanese healthcare service. Technovation 2009, 29, 327–337. [Google Scholar] [CrossRef]
- Leiponen, S.; Helfat, C.E. Innovation objectives, knowledge sources, and the benefits of breadth. Strateg. Manag. J. 2010, 31, 224–236. [Google Scholar] [CrossRef]
- Guan, J.; Yam, R.; Tang, E.; Lau, A. Innovation strategy and performance during economic transition: Evidences in Beijing, China. Res. Policy 2009, 38, 802–812. [Google Scholar] [CrossRef]
- Wang, T.; Chien, S. Forecasting innovation performance via neural networks—A case of Taiwanese manufacturing industry. Technovation 2006, 26, 635–643. [Google Scholar] [CrossRef]
- Olomu, M.; Akinwale, Y.; Adepoju, A. Harnessing technological and nontechnological innovations for SMEs profitability in the Nigerian Manufacturing Sector. Am. J. Bus. Econ. Manag. 2016, 4, 75–88. [Google Scholar]
- Naidoo, V. Firm survival through a crisis: The influence of market orientation, marketing innovation and business strategy. Ind. Mark. Manag. 2010, 39, 1311–1320. [Google Scholar] [CrossRef]
- Meroño-Cerdan, A.L.; López-Nicolas, C. Understanding the drivers of organizational innovations. Serv. Ind. J. 2013, 33, 1312–1325. [Google Scholar] [CrossRef]
- Kotabe, M.; Murray, J. Linking product and process innovations and modes of international sourcing in global competition: A case of foreign multinational firms. J. Int. Bus. Stud. 1990, 21, 383–408. [Google Scholar] [CrossRef]
- Albers, J.A.; Brewer, S. Knowledge management and the innovation process: The eco-innovation model. J. Knowl. Manag. Pract. 2003, 4, 1–6. [Google Scholar]
- Shin, J.; Kim, C.; Yang, H. The Effect of Sustainability as Innovation Objectives on Innovation Efficiency. Sustainability 2018, 10, 1966. [Google Scholar] [CrossRef]
- Poussing, N. Investigating the role of Corporate Social Responsibility in the adoption of sustainability oriented innovation. In Proceedings of the RIODD, Saint-Étienne, France, 6–8 June 2016. [Google Scholar]
- Ulvenblad, P.O.; Ulvenblad, P.; Tell, J. An overview of sustainable business models for innovation in Swedish agri-food production. J. Integr. Environ. Sci. 2019, 16, 1–22. [Google Scholar] [CrossRef]
- Hollanders, H.; Celikel-Esser, F. Measuring Innovation Efficiency; European Commission: Brussels, Belgium, 2007. [Google Scholar]
- Liu, Z.; Chen, X.; Chu, J.; Zhu, Q. Industrial development environment and innovation efficiency of high-tech industry: Analysis based on the framework of innovation systems. Technol. Anal. Strateg. Manag. 2018, 30, 434–446. [Google Scholar] [CrossRef]
- Park, J.H. Open innovation of small and medium-sized enterprises and innovation efficiency. Asian J. Technol. Innov. 2018, 26, 115–145. [Google Scholar] [CrossRef]
- Wang, Q.; Hang, Y.; Sun, L.; Zhao, Z. Two-stage innovation efficiency of new energy enterprises in China: A non-radial DEA approach. Technol. Forecast. Soc. 2016, 112, 254–261. [Google Scholar] [CrossRef]
- Suh, Y.; Kim, M.S. A taxonomy of service innovations based on the innovative activity efficiency of service firms: A DEA approach. Int. J. Serv. Technol. Manag. 2014, 20, 267–289. [Google Scholar] [CrossRef]
- Cruz-Cázares, C.; Bayona-Sáez, C.; García-Marco, T. You can’t manage right what you can’t measure well: Technological innovation efficiency. Res. Policy 2013, 42, 1239–1250. [Google Scholar] [CrossRef]
- Wang, C.H.; Lu, Y.H.; Huang, C.W.; Lee, J.Y. R&D, productivity, and market value: An empirical study from high-technology firms. Omega 2013, 41, 143–155. [Google Scholar]
- Claudio, C.C.; Teresa, G.M.; Cristina, B.S. Does technological innovation efficiency really matter for firm performance? Res. Policy 2013, 42, 1239–1250. [Google Scholar]
- Chen, K.; Guan, J. Measuring the efficiency of China’s regional innovation systems: Application of network data envelopment analysis (DEA). Reg. Stud. 2012, 46, 355–377. [Google Scholar] [CrossRef]
- Bae, Y.; Chang, H. Efficiency and effectiveness between open and closed innovation: Empirical evidence in South Korean manufacturers. Technol. Anal. Strateg. Manag. 2012, 24, 967–980. [Google Scholar] [CrossRef]
- Guan, J.; Chen, K. Modeling the relative efficiency of national innovation systems. Res. Policy 2012, 41, 102–115. [Google Scholar] [CrossRef]
- Zhong, W.; Yuan, W.; Li, S.X.; Huang, Z. The performance evaluation of regional R&D investments in China: An application of DEA based on the first official China economic census data. Omega 2011, 39, 447–455. [Google Scholar]
- Guan, J.; Chen, K. Measuring the innovation production process: A cross-region empirical study of China’s high-tech innovations. Technovation 2010, 30, 348–358. [Google Scholar] [CrossRef]
- Charnes, A.; Cooper, W.W.; Rhodes, E. Measuring the efficiency of decision making units. Eur. J. Oper. Res. 1978, 2, 429–444. [Google Scholar] [CrossRef]
- Banker, R.D.; Charnes, A.; Cooper, W.W. Some models for estimating technical and scale inefficiencies in data envelopment analysis. Manag. Sci. 1984, 30, 1078–1092. [Google Scholar] [CrossRef]
- Andersen, P.; Petersen, N.C. A procedure for ranking efficient units in data envelopment analysis. Manag. Sci. 1993, 39, 1261–1264. [Google Scholar] [CrossRef]
- Chen, Y. Measuring super-efficiency in DEA in the presence of infeasibility. Eur. J. Oper. Res. 2005, 161, 545–551. [Google Scholar] [CrossRef]
- Simar, L.; Wilson, P.W. Sensitivity analysis of efficiency scores: How to bootstrap in nonparametric frontier models. Manag. Sci. 1998, 44, 49–61. [Google Scholar] [CrossRef]
- Kneip, A.; Simar, L.; Wilson, P.W. Asymptotics and consistent bootstraps for DEA estimators in nonparametric frontier models. Econ. Theory 2008, 24, 1663–1697. [Google Scholar] [CrossRef]
- Ariff, M.; Can, L. IMF bank-restructuring efficiency outcomes: Evidence from East Asia. J. Financ. Serv. Res. 2009, 35, 167–187. [Google Scholar] [CrossRef]
- Welte, J.W.; Barnes, G.M.; Wieczorek, W.F.; Tidwell, M.C.O.; Hoffman, J.H. Type of gambling and availability as risk factors for problem gambling: A Tobit regression analysis by age and gender. Int. Gambl. Stud. 2007, 7, 183–198. [Google Scholar] [CrossRef]
- Khoshroo, A.; Mulwa, R.; Emrouznejad, A.; Arabi, B. A non-parametric Data Envelopment Analysis approach for improving energy efficiency of grape production. Energy 2013, 63, 189–194. [Google Scholar] [CrossRef]
- Casu, B.; Molyneux, P. A comparative study of efficiency in European banking. Appl. Econ. 2003, 35, 1865–1876. [Google Scholar] [CrossRef] [Green Version]
- Perrigot, R.; Barros, C.P. Technical efficiency of French retailers. J. Retail. Consum. Serv. 2008, 15, 296–305. [Google Scholar] [CrossRef]
- Fera, M.; Macchiaroli, R.; Iannone, R.; Miranda, S.; Riemma, S. Economic evaluation model for the energy Demand Response. Energy 2016, 112, 457–468. [Google Scholar] [CrossRef]
- Chuang, M.; Yang, Y.S.; Lin, C.T. Production technology selection: Deploying market requirements, competitive and operational strategies, and manufacturing attributes. Int. J. Comput. Integr. Manuf. 2009, 22, 345–355. [Google Scholar] [CrossRef]
- Fera, M.; Macchiaroli, R.; Fruggiero, F.; Lambiase, A. A new perspective for production process analysis using additive manufacturing—Complexity vs production volume. Int. J. Adv. Manuf. Technol. 2018, 95, 673–685. [Google Scholar] [CrossRef]
- Peças, P.; Ribeiro, I.; Folgado, R.; Henriques, E. A Life Cycle Engineering model for technology selection: A case study on plastic injection moulds for low production volumes. J. Clean. Prod. 2009, 17, 846–856. [Google Scholar] [CrossRef]


| Source | Method | DMUs | Input Factors | Output Factors |
|---|---|---|---|---|
| Shin et al. (2018) [23] | DEA | 441 Korean manufacturing companies | (1) R&D employee (2) R&D expense | (1) Patent application (2) Innovation sales |
| Park (2018) [28] | DEA | 1778 Korean manufacturing SMEs | (1) R&D expenditure divided by total sales (2) share of R&D staff in total employment | (1) Percentage of sales from R&D activities |
| Wang et al. (2016) [29] | DEA | 38 Chinese new energy enterprises | (1) Fixed assets (2) Staff wages (3) R&D costs | (1) Total profits (2) Market value |
| Suh and Kim (2014) [30] | DEA | 300 Korean service firms | (1) Number of researchers (2) Investment in IT infrastructure (3) Innovation cost for physical resources | (1) Service innovation (2) Process innovation (3) patents |
| Cruz-Cázares et al. (2013) [31] | DEA/Malmquist index | 415 (first stage)/362 (second stage) Spanish manufacturing firms | (1) R&D capital stock (2) High-skill staff | (1) The number of product innovations (2) The number of patents |
| Wang et al. (2013) [32] | DEA | Top 65 high-technology firms | (1) Employees (2) Assets (3) Number of researchers (4) R&D expenditures | (1) Market value (2) Return on investment |
| Claudio et al. (2013) [33] | DEA | 3111 observations of 536 Spanish manufacturing firms | (1) R&D capital stock (2) High-skilled staff | (1) New products (2) Patents |
| Chen and Guan (2012) [34] | DEA | 30 Chinese province-level regions | (1) Expenditure on science and technology (2) Number of science and technology personnel (3) Foreign direct investment (4) Expenditure on the import of technology (5) Expenditure on the purchase of domestic technology (6) Value of contractual inflows in domestic technical markets | (1) Gross domestic products (2) Sale of new products (3) Value of exports (4) Annual income in urban residents per capita |
| Bae and Chang (2012) [35] | DEA | 1251 Korean manufacturing firms | (1) Innovation expenditures | (1) R&D personnel (2) The number of registered patents (3) The turnover (4) Operating profits |
| Guan and Chen (2012) [36] | DEA | 22 Countries | (1) Number of full-time equivalent scientists and engineers (2) Incremental R&D expenditure (3) Prior accumulated knowledge stock breeding upstream knowledge production | (1) Added value of industries (2) Export of new products in high-tech industries |
| Zhong et al. (2011) [37] | DEA | 30 Chinese province-level regions | (1) R&D expenditure (2) Full-time equivalent of R&D personnel | (1) Patent applications (2) Sales revenue of new products (3) Profit of primary business |
| Guan and Chen (2010) [38] | DEA | 26 Chinese province-level regions | (1) Internal expenditure of R&D funding (2) Full-time equivalence of scientists and technologists on R&D activities (3) Accumulated patents stock | (1) The value added taxes (2) The value added profits (3) The export value of new products (4) The sale revenue of new products |
| Hollanders and Celikel-Esser (2007) [26] | DEA | 35 Countries | (1) Innovation drivers (2) Knowledge creation (3) Innovation & entrepreneurship | (1) Applications (2) Intellectual property |
| Factors | Questionnaire in KIS Data | |
|---|---|---|
| Input | R&D employee | The number of regular employee |
| The percentage of R&D employee out of regular employee | ||
| R&D expense | Total innovation cost | |
| Output | Patent application | The number of patent application |
| Innovation sales | Total sales | |
| The percentage of innovative products sales out of total sales | ||
| Independent | Material and energy reduction | How important is the “material and energy cost reduction” as an objective of performing innovation |
| Industry Type | No. of Firms | Ave. R&D Employees | Ave. R&D Expense | Ave. Patent Application | Ave. Innovation Sales | Ave. MER |
|---|---|---|---|---|---|---|
| Manufacture of food products | 8 | 12.03 | 575.00 | 1.88 | 7015.00 | 2.38 |
| Manufacture of beverages | 1 | 30.00 | 1700.00 | 1.00 | 79,800.00 | 2.00 |
| Manufacture of textiles, except apparel | 6 | 6.75 | 585.83 | 2.83 | 27,985.38 | 1.83 |
| Manufacture of wearing apparel, clothing accessories and fur articles | 1 | 0.39 | 50.00 | 3.00 | 3250.00 | 3.00 |
| Tanning and dressing of leather, manufacture of luggage and footwear | 1 | 0.21 | 20.00 | 2.00 | 1620.00 | 2.00 |
| Manufacture of wood and of products of wood and cork; except furniture | 2 | 2.49 | 109.50 | 4.00 | 1129.65 | 3.00 |
| Manufacture of pulp, paper and paper products | 2 | 2.62 | 204.00 | 3.00 | 5204.05 | 2.00 |
| Printing and reproduction of recorded media | 2 | 16.20 | 400.00 | 3.50 | 25,325.95 | 2.00 |
| Manufacture of chemicals and chemical products except pharmaceuticals and medicinal chemicals | 14 | 9.98 | 898.00 | 7.14 | 7985.18 | 2.21 |
| Manufacture of pharmaceuticals, medicinal chemicals and botanical products | 6 | 26.81 | 1329.67 | 3.67 | 19,085.53 | 2.33 |
| Manufacture of rubber and plastic products | 53 | 7.71 | 343.79 | 2.81 | 14,907.65 | 2.38 |
| Manufacture of other non-metallic mineral products | 8 | 4.45 | 543.63 | 3.75 | 14,165.06 | 2.25 |
| Manufacture of basic metal products | 7 | 6.35 | 315.57 | 2.00 | 31,644.59 | 2.00 |
| Manufacture of fabricated metal products, except machinery and furniture | 23 | 8.67 | 345.22 | 3.39 | 22,929.02 | 1.70 |
| Manufacture of electronic components, computer, radio, television and communication equipment and apparatuses | 31 | 18.50 | 1132.00 | 7.81 | 15,842.41 | 1.65 |
| Manufacture of medical, precision and optical instruments, watches and clocks | 32 | 16.79 | 326.38 | 4.41 | 10,449.78 | 2.34 |
| Manufacture of electrical equipment | 38 | 11.66 | 602.76 | 3.26 | 10,463.06 | 2.18 |
| Manufacture of other machinery and equipment | 122 | 7.72 | 579.03 | 3.65 | 5320.44 | 2.51 |
| Manufacture of motor vehicles, trailers and semitrailers | 24 | 14.15 | 1320.29 | 4.29 | 22,745.88 | 2.00 |
| Manufacture of other transport equipment | 3 | 20.00 | 1436.67 | 15.67 | 30,478.80 | 2.00 |
| Manufacture of furniture | 2 | 4.41 | 350.00 | 8.00 | 9760.77 | 2.00 |
| Other manufacturing | 2 | 4.10 | 65.00 | 3.00 | 322.55 | 3.00 |
| Variables | Minimum | Maximum | Average | St.dev | Median |
|---|---|---|---|---|---|
| R&D employee | 0.00 | 134.40 | 10.60 | 13.70 | 6.00 |
| R&D expense | 20.00 | 3689.00 | 619.82 | 760.81 | 300.00 |
| Patent application | 1.00 | 130.00 | 4.06 | 7.75 | 2.00 |
| Innovation sales | 106.00 | 140,000.00 | 12,320.45 | 18,752.89 | 5021.25 |
| Material and energy reduction | 0.00 | 3.00 | 2.25 | 0.79 | 2.00 |
| Industry Type | No. of Firms | Ave. Innovation Efficiency | Ave. MER |
|---|---|---|---|
| Manufacture of food products | 8 | 0.04 | 2.38 |
| Manufacture of beverages | 1 | 0.11 | 2.00 |
| Manufacture of textiles, except apparel | 6 | 0.27 | 1.83 |
| Manufacture of wearing apparel, clothing accessories and fur articles | 1 | 0.47 | 3.00 |
| Tanning and dressing of leather, manufacture of luggage and footwear | 1 | 0.73 | 2.00 |
| Manufacture of wood and of products of wood and cork; except furniture | 2 | 0.18 | 3.00 |
| Manufacture of pulp, paper and paper products | 2 | 0.16 | 2.00 |
| Printing and reproduction of recorded media | 2 | 0.14 | 2.00 |
| Manufacture of chemicals and chemical products except pharmaceuticals and medicinal chemicals | 14 | 0.14 | 2.21 |
| Manufacture of pharmaceuticals, medicinal chemicals and botanical products | 6 | 0.05 | 2.33 |
| Manufacture of rubber and plastic products | 53 | 0.22 | 2.38 |
| Manufacture of other non-metallic mineral products | 8 | 0.16 | 2.25 |
| Manufacture of basic metal products | 7 | 0.14 | 2.00 |
| Manufacture of fabricated metal products, except machinery and furniture | 23 | 0.22 | 1.70 |
| Manufacture of electronic components, computer, radio, television and communication equipment and apparatuses | 31 | 0.07 | 1.65 |
| Manufacture of medical, precision and optical instruments, watches and clocks | 32 | 0.20 | 2.34 |
| Manufacture of electrical equipment | 38 | 0.14 | 2.18 |
| Manufacture of other machinery and equipment | 122 | 0.10 | 2.51 |
| Manufacture of motor vehicles, trailers and semitrailers | 24 | 0.18 | 2.00 |
| Manufacture of other transport equipment | 3 | 0.10 | 2.00 |
| Manufacture of furniture | 2 | 0.16 | 2.00 |
| Other manufacturing | 2 | 0.41 | 3.00 |
| Dependent Variable: Innovation Efficiency | Coefficient | Standard Error |
|---|---|---|
| (Intercept) | 0.399 * | 0.078 |
| MER | −0.067 ** | 0.033 |
| Log-sigma | −0.670 *** | 0.036 |
© 2019 by the authors. Licensee MDPI, Basel, Switzerland. This article is an open access article distributed under the terms and conditions of the Creative Commons Attribution (CC BY) license (http://creativecommons.org/licenses/by/4.0/).
Share and Cite
Shin, J.; Kim, C.; Yang, H. Does Reduction of Material and Energy Consumption Affect to Innovation Efficiency? The Case of Manufacturing Industry in South Korea. Energies 2019, 12, 1178. https://doi.org/10.3390/en12061178
Shin J, Kim C, Yang H. Does Reduction of Material and Energy Consumption Affect to Innovation Efficiency? The Case of Manufacturing Industry in South Korea. Energies. 2019; 12(6):1178. https://doi.org/10.3390/en12061178
Chicago/Turabian StyleShin, Jaeho, Changhee Kim, and Hongsuk Yang. 2019. "Does Reduction of Material and Energy Consumption Affect to Innovation Efficiency? The Case of Manufacturing Industry in South Korea" Energies 12, no. 6: 1178. https://doi.org/10.3390/en12061178
APA StyleShin, J., Kim, C., & Yang, H. (2019). Does Reduction of Material and Energy Consumption Affect to Innovation Efficiency? The Case of Manufacturing Industry in South Korea. Energies, 12(6), 1178. https://doi.org/10.3390/en12061178