3.1. Process Yield
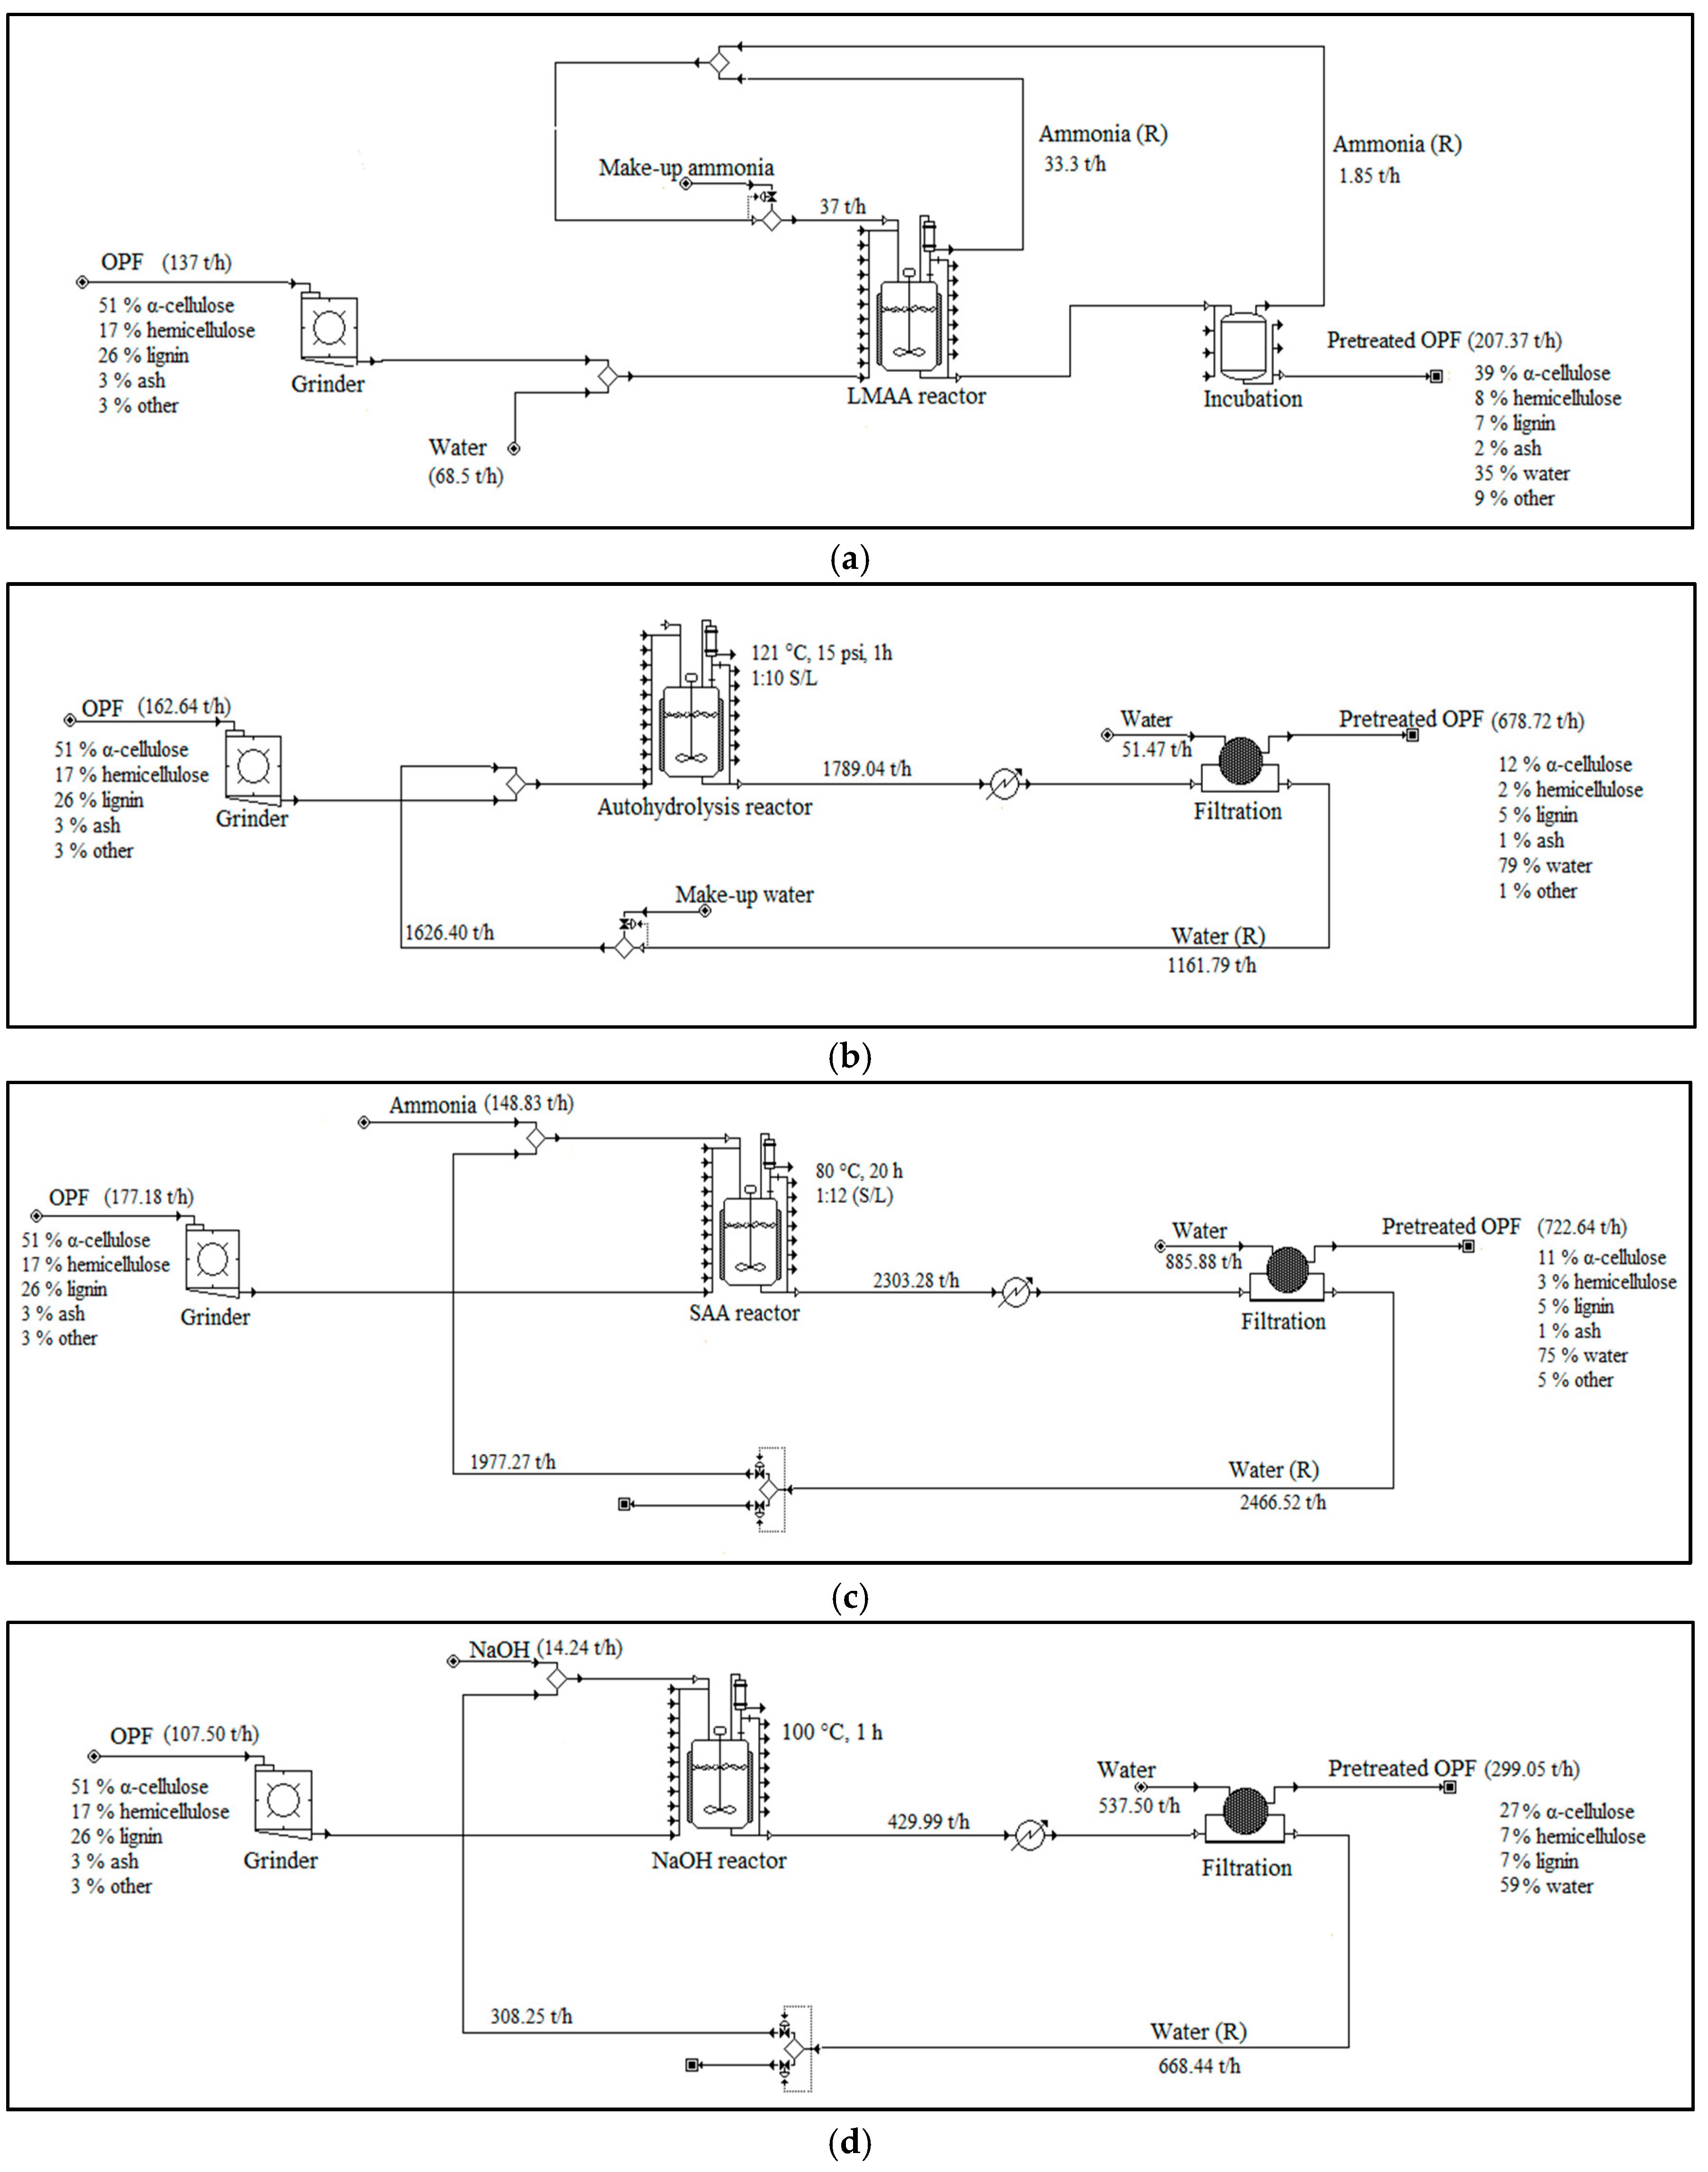
Each of the plant set-ups (i.e., different pretreatment and different product separation technologies) was used for the simulation of biobutanol production (
Figure 3,
Figure 4 and
Figure 5). The same product separation method (in-situ stripping) was applied when different pretreatment were modeled. The same pretreatment (LMAA) was used when different product separation were simulated. A fixed amount of OPF (1.09 × 10
6 t) was used in each simulated models. The results of the simulation were presented elsewhere [
23], as briefly summarized in
Table 3.
The analysis also found that the biobutanol production cost that was produced while using LMAA pretreatment was the lowest, being mainly contributed by its low operating cost (utilities, materials, labor, maintenance and repairs, waste treatment, overhead, tax, insurance, depreciation, and capital charges costs). The huge gap in butanol production costs between LMAA and those of SAA and autohydrolysis pretreatment were due to the differences in the materials cost and utility cost.
3.2. Life-Cycle Energy Metrics
Table 4 and
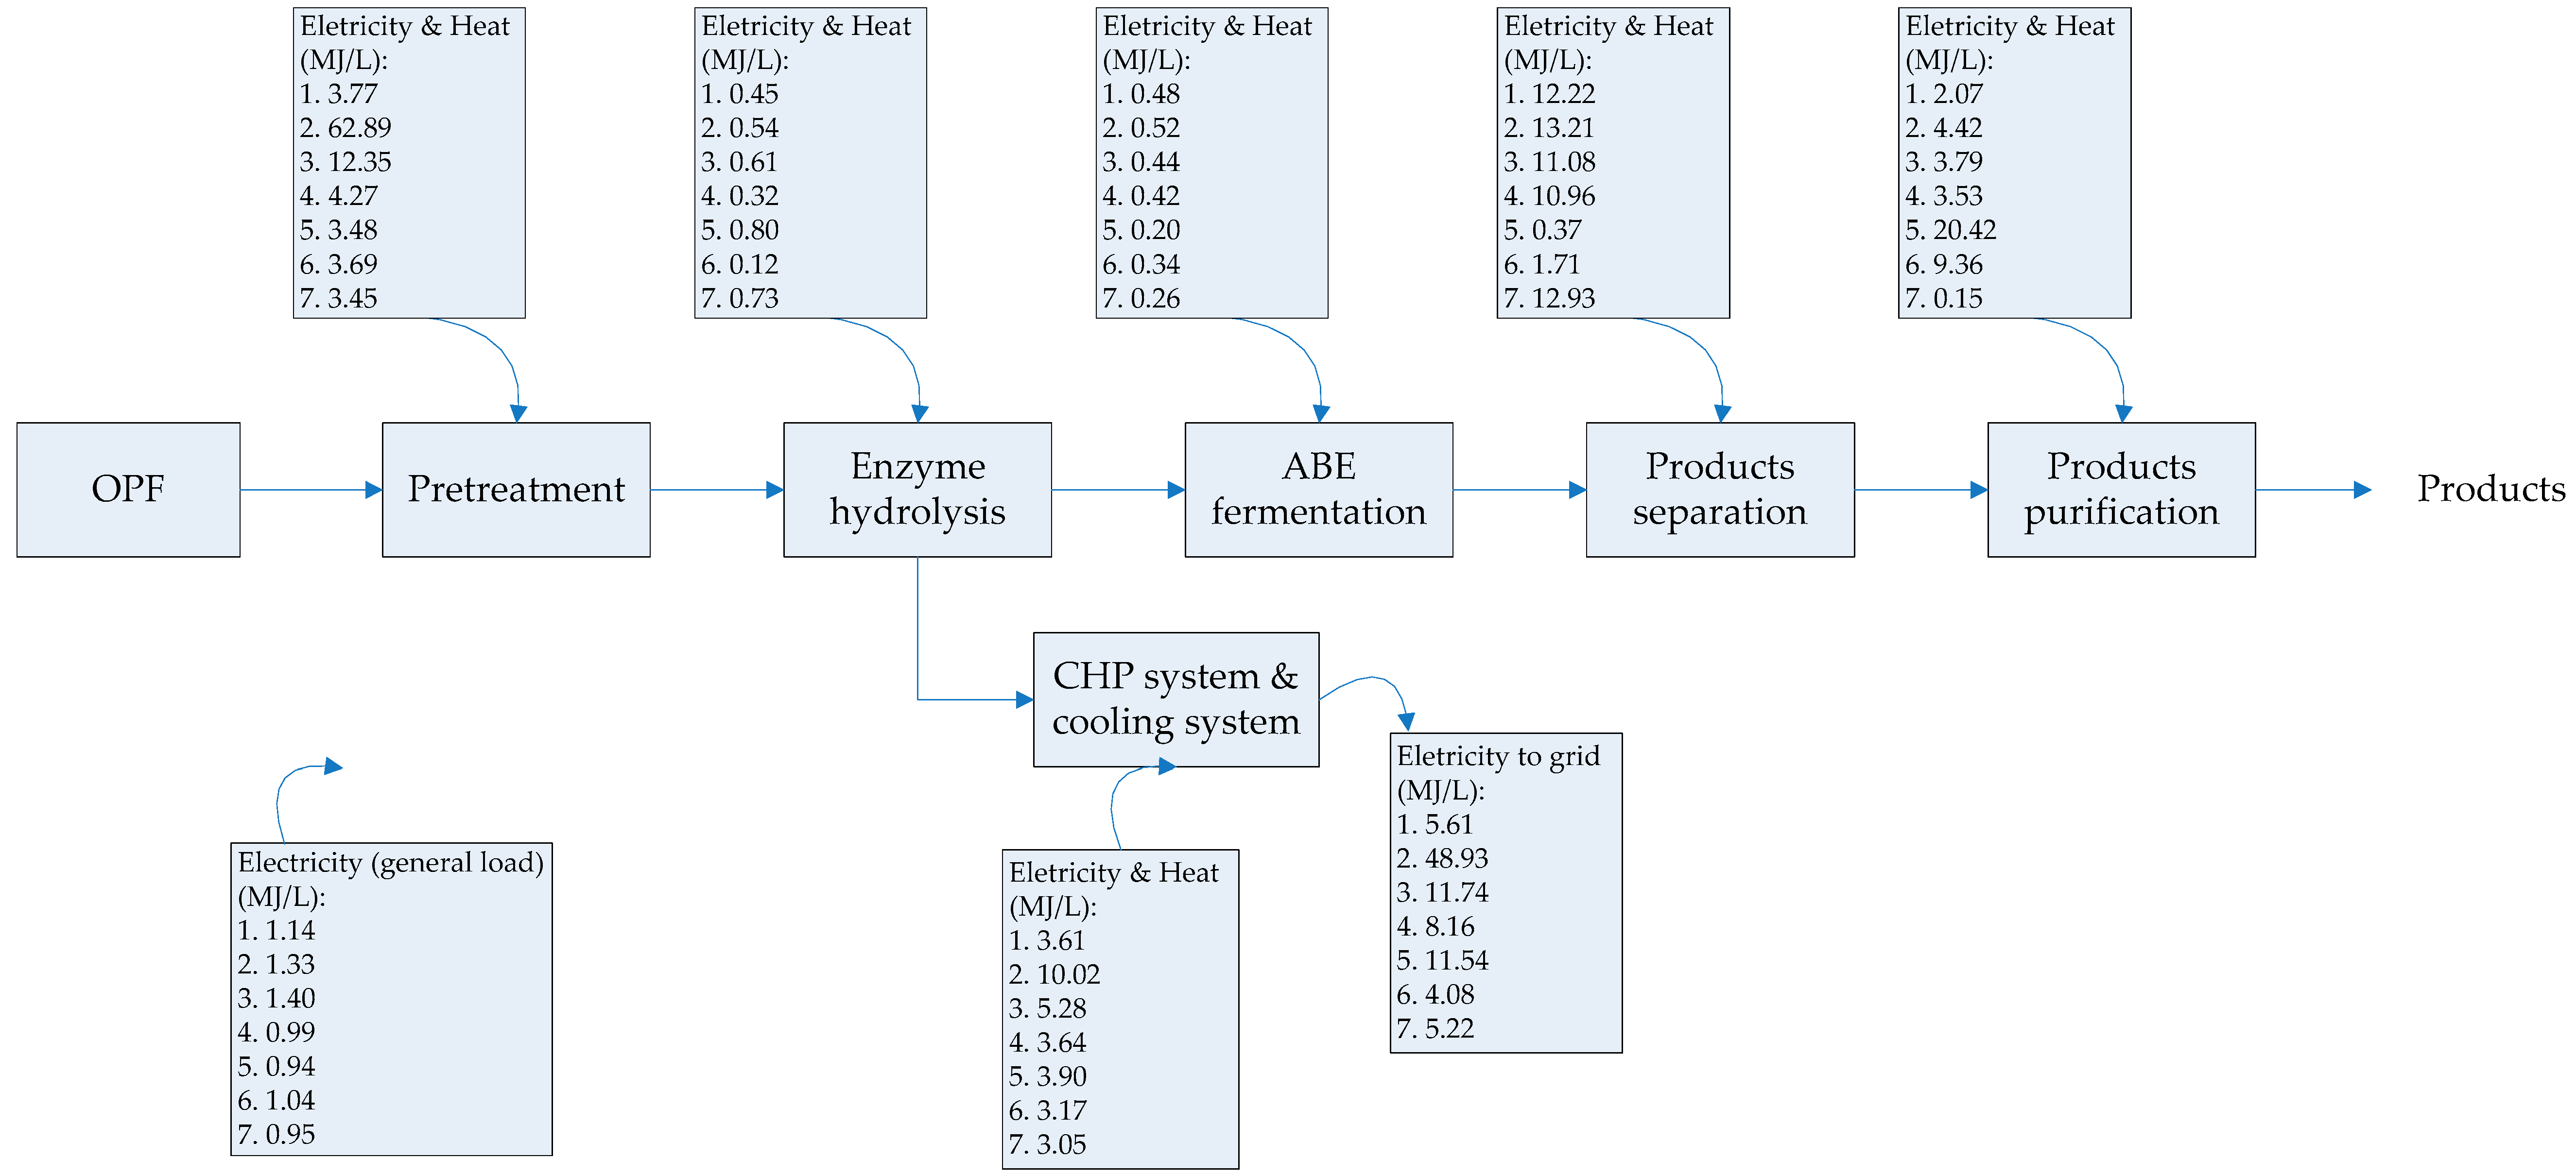
Table 5 show the life-cycle energy metrics comparisons for cellulosic butanol production simulated while using different pretreatment and product separation technologies, respectively. The fossil energy input was coming from natural gas combustion for heat and power generation in the CHP system. In general, the variation of electricity that was required by all models was small as compared to the variation of heat needed between models.
Among all of the pretreatment technologies evaluated, the autohydrolysis pretreatment model recorded the highest heat and electricity requirements because of the high amount of feedstock loading (hence increased milling work) and operated at a higher temperature than the other pretreatments. In fulfilling the high demand for energy, the CHP system in autohydrolysis model also generated a high amount of electricity that was sold to the grid. As mentioned in [
23], SAA pretreatment has the lowest efficiency and it required the highest amount of feedstock when compared to other pretreatments. Therefore, the SAA model was also generated the highest amount of fibers residues for the CHP system. The other pretreatment processes modeled have approximately similar total energy requirements.
When comparing different product separation technologies, in-situ stripping model recorded the highest electricity requirement (7.20 MJ/L), while the adsorption model recorded the highest heat requirement (23.44 MJ/L). The highest total energy requirement was recorded by the adsorption model (30.11 MJ/L), while the pervaporation process required the least energy (19.43 MJ/L). In general, all of the simulated models produced the same amount of fibers residues that were used to fuel the CHP system. However, varying products yield from each model rendered a different value of energy per unit butanol (
Table 4). Similar to the earlier simulations, those required the highest amount of heat had the highest amount of excess electricity sold to the grid. As elaborated in [
23], the adsorption process needed a high amount of heat in the products purification section due to the high volume of water that is available in the process.
NEV, NER, and FER were calculated to assess the energy performance of the processes. A positive NEV value is desired for biofuel to be a substitute for fossil fuel, because it means that more energy was generated than consumed [
49]. Among pretreatment technologies evaluated, NaOH pretreatment model recorded the highest NEV (23.87 MJ/L), followed by LMAA, SAA, and autohydrolysis pretreatment models (
Table 4). When comparing different product separation technologies, the pervaporation model recorded the highest NEV (24.69 MJ/L), followed by dual extraction, in-situ stripping, and adsorption model (
Table 5). As a comparison, Tao et al. [
49] recorded an NEV of 90 MJ/GGE (~15.00 MJ/L) for n-butanol produced from corn stover, and Morey et al. [
41] reported NEV of 30.50 MJ/L for ethanol produced from corn stover.
For NER, a value that is higher than 1.0 is desired, which indicates the positive energy balance [
42]. NER value for NaOH pretreatment model was the largest (1.99) as compared to other pretreatment technologies, while the pervaporation model recorded the highest NER value among all of the product separation approaches (2.27). Only the autohydrolysis pretreatment model had NER lower than 1.0, which indicated that it used higher energy for production process than the energy available in the products.
Baral et al. [
50], who treated corn stover for butanol production recorded NER of 1.78, 1.80, 1.73, 0.41, and 3.69 from the steam explosion, DA, AFEX, ionic liquid, and biological pretreatments, respectively. When only considering chemical pretreatment methods (DA and AFEX), their NER values were not far different from those that were recorded in this study. It could serve as a baseline value for this study, although they were assessing different pretreatment methods.
Another comparison on the NER value was from those recorded by [
49], which were 2.8 and 2.2 for corn stover-based n-butanol and isobutanol, respectively, higher than almost all NER values that were recorded in this study. However, their NER values without electricity displacement credits were 1.5 and 1.4 for n-butanol and isobutanol, respectively, which were similar to those that were recorded in almost all models in this study before the inclusion of electricity credits (1.68, 0.43, 1.14, 1.65, 1.68, 1.32, 2.06, and 1.80 for LMAA, autohydrolysis, SAA, NaOH, in-situ stripping, adsorption, pervaporation, and dual extraction models respectively—data not shown in the results table). It might indicate that their production plant had generated a greater amount of excess electricity than those that were generated in this study, probably because of the low consumption, or because of the high requirement of process steam that at the same time produced a high amount of electricity. In general, the NER value of cellulosic butanol cannot compete with the NER value of the cellulosic ethanol. Cronin et al. [
15] reported an NER value in the range of 4.96–9.00 for cellulosic ethanol that was produced from AFEX- and DA-treated corn stover, switchgrass, and miscanthus.
FER measures the degree of renewability of the produced butanol. The larger the FER indicates that the process generated a considerable output of renewable energy in comparison to the low amount of fossil energy input. FER for NaOH pretreatment model was the greatest (6.47) when compared to the other pretreatments, while FER for the pervaporation model was the highest (7.24) among other product separation technologies evaluated. No available study has provided any FER value of cellulosic butanol for comparison purposes.
Nevertheless, direct comparison with cellulosic ethanol showed agreement with the FER value that was obtained in this study; Morey et al. [
41] reported FER of 5.31 for corn stover ethanol, while [
51] estimated an FER value of cellulosic ethanol in the range of 4.4–6.6 [
52]. These FER values are far better than that of gasoline, which is 0.8. In general, there was no direct relationship between NEV, NER, and FER, i.e., those that recorded the highest NEV did not necessarily have the highest NER and FER. Nevertheless, all of the evaluated technologies have recorded values that were almost similar to available works. The LMAA pretreatment model recorded neither the best nor the lowest values of all energy metrics evaluated, which suggests its prospect for commercial application.
3.3. Process Emissions
All of the energy metrics evaluated above did not show any relationship with the emissions that were generated by the process, i.e., a process that has the highest energy metrics values does not necessarily have a specific amount (highest or lowest) of emissions.
Table 6 and
Table 7 tabulate the results of gate-to-gate process emissions from butanol production plant simulated while using different pretreatment and product separation technologies, respectively. The evaluated emissions include CO
2, N
2O, and CH
4, which then differentiated between biogenic and non-biogenic. In general, the process with a high-energy requirement recorded high emissions, which were mostly generated from the energy generation process (CHP system).
Baral et al. [
50] conducted an LCA on the steam explosion, sulfuric acid, ammonia fiber explosion, ionic liquid, and biological pretreatments for butanol production from corn stover. They estimated biogenic CO
2 between 5.21–11.46 kg CO
2/L butanol, which was only overlapped with the LMAA pretreatment model in this study (10.32 kg CO
2/L butanol). However, when comparing different product separation methods, the biogenic CO
2 emission of the process recorded much lower results—10.32, 8.30, 8.98, and 8.34 kg CO
2/L butanol for in-situ stripping, adsorption, pervaporation, and dual extraction models, respectively. The higher CO
2 emission recorded in in-situ stripping model was mainly due to the longer fermentation process in this model because of the immediate solvents-removal effect.
According to the IPCC, only non-biogenic CO
2 emissions should be considered as greenhouse gas (GHG) emissions, which eventually contribute towards an increase in global warming potential (GWP). The biogenic CO
2 is not considered as GHG emission, because, throughout plants’ life, they are conducting a photosynthesis process by taking CO
2 from the atmosphere [
49]. The biogenic CO
2 emissions fractions in most of the simulated models were higher than that of non-biogenic, because of the large fraction of CO
2 generated during the fermentation process and the waste fibers burning in the CHP generation system.
The case was different for N
2O and CH
4 emissions, in which both biogenic and non-biogenic fractions from these emissions were considered as GHG emissions, because growing plants have no abilities to utilize those gases throughout its life. The higher biogenic N
2O and CH
4 emissions than those of non-biogenic came from the combustion of fibers residues in the CHP system. In all simulation cases, the amount of natural gas that was required for energy generation was multiple degrees higher than the available amount of fibers residues. It indicated that burning biomass in CHP generating higher emission than burning fossil fuel (natural gas). By using fibers residues as the fuel for CHP system, the cost that is associated with energy generation could be reduced [
23]. However, it was creating more emissions.


