3.1. Leakage Flow of the Rotor
In this section of the study, the author has selected the maximum efficiency operation point (OP1) and near stall operation point (OP2) as the research objective for analysis and the instability characteristics of the compressor, blades are studied.
Figure 4a shows the relative total pressure distribution at the rotor outlet section at maximum efficiency point (i.e., OP1), and
Figure 4b shows the relative total pressure distribution at the rotor outlet section at stall point (i.e., OP2). PS represents the pressure side and SS represents the suction side, which is perpendicular to the axis of rotation and at 1% of chord length from the rotor outlet. It can be seen from the comparison that the instability of the rotor at reduced flow is mainly due to the deterioration of the flow field at the shroud. For OP1, the pressure loss occurs on the suction surface of the rotor. The higher total pressure loss is observed close to the shroud. As the flow decreases, in the OP2, the circumferential range of total pressure loss area on suction surface increases, and the radial vortex on the suction surface started to develop gradually. At the tip of the rotor, a large total pressure loss is formed. In order to analyze the causes of this total pressure loss at the casing and suction surface,
Figure 5a,b compares the limit streamline and relative static pressure coefficient contour at the hub end wall and suction surface at OP1 and OP2 conditions, respectively.
At OP1 condition, the low energy fluid in the boundary layer of the hub is at the intersection of the suction surface and the hub by the transverse pressure gradient. At the same time, a portion of the fluid on the pressure surface flows backward around the trailing edge in the corner of the stator. The two parts of low-energy fluid ascend under the radial force and flow out of the flow passage at about 40% of the blade height. Backflow forms weak reflux in the leading edge of the rotor. It spirals up and mixes with the clearance leakage. Two radial vortices (the backflow in the leading edge and the radial vortex in the trailing edge) form an open separation line on the suction surface of the rotor. When the flow decreases to near stall point (OP2), two radial vortices in OP1 increase with the loading. Open separation at the leading-edge changes to full separation along the blade span. The radial vortices at the trailing edge develop from 40% to 80% of the rotor height. Thus, the main reason for the low operating margin of the compressor is the aerodynamic instability at the rotor tip. Therefore, the ensuing discussion in this paper is focused on the analysis and research at the rotor tip flow field.
Figure 6 shows the vorticity contour at 0.99 of blade height. In order to describe the change in clearance leakage with flow reduction, two intermediate conditions are also analyzed, in addition to the peak efficiency condition and near stall condition. The flow coefficients of these four conditions are selected as 0.5, 0.46, 0.42, and 0.36, respectively. The flow coefficients are defined as
where
Vx is the average axial velocity and
Um is the tangent velocity at the middle span of the rotor.
Figure 7 shows the three-dimensional tip clearance streamline and the relative total pressure distribution on the section which is perpendicular to the rotating axis. The combination can be more intuitive to understand the development of tip clearance leakage in space, once the flow rate of the compressor is reduced.
It can be seen from
Figure 6 that the tip leakage at the compressor rotor originates from the tip of the leading edge. At the interface of the clearance streamline generated at the leading edge of the peak efficiency point and the main flow, an obvious clearance vortex is formed. There are three high vorticity regions at the tip of the blade. They are the main leakage (ML), the secondary leakage (SL), and the wake. The main leakage area is the clearance leakage caused by the rotor tip. In compressor design, the difference in loading close to the rotor tip is highest, so the momentum of clearance leakage is also on the higher side. The gap leakage formed here is called the main leakage area. Most of the gap leakage is generated here, which can be seen from the development of 3D leakage flow in
Figure 7. At the mid of the rotor top, the pressure difference on the rotor surface decreases, resulting in small leakage momentum at the clearance. The clearance leakage vortex cannot resist the reverse pressure gradient. After dissipation, one part flows out of the flow passage, and the other part is sucked by the main leakage. At the trailing edge of the moving blade, the high vortices region is formed by mixing the backflow of the pressure surface with the wake. The tip leakage vortex dissipates gradually under the reverse pressure gradient. With the flow coefficient decreasing, the development model of leakage vortex has changed. The increase of backpressure results in a greater reverse pressure gradient. Therefore, the leakage vortex is difficult to maintain at the tip of the blade. The axial position of the dissipation point moves forward one by one. The angle between the leakage vortex and the blade also increased. At the near stall point, it almost reaches the top 10% chord length of the adjacent rotor blade. However, it does not spill over the leading edge. At present, a large number of studies have shown that there are two reasons for the compressor stall. One is that the clearance flow path is blocked at the leading edge till the subsequent blade resultantly compressor tip stall. Another reason is that the tip leakage vortex breaks up after passing through the shock wave and the broken low-energy fluid blocks the top of the blade resulting in a compressor stall.
There is no overflow at the leading edge or backflow at the trailing edge near the stall point. At the same time, the compressor is at 0.6 N, and the whole field is subsonic without shock wave. Therefore, the reason for the stall of this compressor is different from the above mentioned two common reasons. With the decrease of the flow coefficient, the secondary leakage area gradually disappeared. The tip leakage in the middle of the rotor is weakened. The angle between the leakage flow and the blade in the main leakage area increases gradually when it develops in the middle of the blade, but it is closer to the suction surface. Finally, when the flow is near stall, the separation and backflow occur at the clearance flow. A large backflow area with low pressure is formed to block the flow passage. As a result, the compressor stalls. The tip leakage of the compressor is driven by the pressure difference on the rotor surface, so it is necessary to find out the cause of this abnormal flow analyzing the loading distribution on the rotor tip.
Figure 8a shows the distribution of the relative pressure coefficient at the top of the blade under four flow coefficients, which can be used to represent the top loading. With the decrease of flow coefficient, there is no obvious change in pressure surface loading. The curve is almost smooth. However, the loading on the suction surface clearly changes. The boundary point is about 25% of the chord length of the leading edge. The moving blade is divided into two parts i.e., A and B. With the decrease of flow coefficient, the loading difference in area A increases, and the strong pressure difference induces more momentum at the tip clearance leakage. Therefore, the scale and strength of clearance leakage vortex increases, and the separation of the boundary layer on the suction surface is delayed. In area B, the changing trend is completely opposite i.e., the pressure difference decreases. Subsequently, the transverse pressure gradient in the flow passage weakens. Therefore, the dissipation of the gap leakage vortex earlier under a larger reverse pressure gradient can be seen in
Figure 7. From
Figure 7, the distance between the total pressure contours of S3 flow surface is 10% chord length. It can approximately represent the dissipate position of the clearance leakage vortex. The dissipation point of gap leakage vortex moves forward. In
Figure 7d, the gap leakage vortex has an impact of the leakage flow in area B after fully dissipating and forms backflow under the reverse pressure gradient. Finally, it develops into a rotor stall.
Figure 8b shows the radial distribution of Average Velocity Density (AVD), which indicates the flow capacity of the blade. The main reason for the decrease of AVD at LOW (lower than 0.7 blade span as shown in
Figure 8b) is the radial vortex on the suction surface. The flow coefficient is reduced from 0.42 to 0.36 (near stall), but the AVD of the lower height does not change. It is shown that the radial vortex on the suction surface is not the cause of the rotor tip stall. In the top half, AVD decreased more obviously with the flow coefficient. When it is 0.36, the AVD in the rotor tip is almost zero. The loss of the flow passage capacity of the rotor leads to the stall of the compressor.
The AVD is defined as
where V
Z is the axial velocity and
ρ is the density.
3.2. Control Method of the Clearance of the Stator
The effect of clearance leakage on the stall of compressor blades with different flow coefficients is discussed earlier. For compressor stators, generally hub corner separation/stall is the main research content of the secondary flow. In this paper, a stall occurs in the stator of the compressor at a low flow coefficient. The partial stator clearance is used as a passive control method. A large number of scholars have done a detailed study on the formation mechanism of the stall and the development of hub corner separation. For different clearance schemes, the prototype stator which has the same boundary conditions as the near stall point is selected as the comparative study. The flow field of the hub corner at near stall point is shown in
Figure 9. It can be seen from the figure that the baseline compressor stall occurs at the hub corner. The flow in the upper part of the stator is relatively good. The small spiral points are caused by the tip wake and there is no stall at the shroud corner.
There are closed separation regions in the lower half of the hub corner, corresponding to the three spiral points N 1, N 2, and N 3 (N means the node) in the figure. The hub surface layer forms the hub spiral point N 1 due to the large incidence at the blade root. The vortex core is located at 0.5 chord length, which corresponds to the high static entropy concentration region. The fluid on the pressure surface flows toward the trailing edge, goes back along the suction surface under the entrainment of N 1, and then rises to form the spiral point N 2. However, the scale is relatively small. At the same time, the small-scale spiral point N 2 induces the spiral point N 3. It can be said that N 1 is the main flow blockage in the flow field. The radial development of N 1 blocks the hub corner of the stator and causes aerodynamic instability. Therefore, the control of the hub corner stall should be based on increasing the axial momentum for the low energy of the hub boundary layer. After clearance is set at the root of the stator, the flow field near the stall point has changed.
In
Figure 9b, the hub radial vortex interacts with the leakage flow generated by the clearance gap. The high momentum fluid produced by the leakage flow makes the radial vortex move towards the trailing edge. The radial vortex core moves from 0.5 chords to about 0.7 chords. At the same time, the radial vortex is unstable under the impact of leakage flow. After a part of the fluid is flushed to the trailing edge, two spiral points N 3 and N 4 connected by saddle point S 1 are formed at the trailing edge because of the lesser energy of the leakage flow. This is a closed separation formed by the typical saddle point spiral point, which has the nature of confinement. It can be seen from the entropy contour that the static entropy concentration region i.e., vortex core moves backward in comparison with the baseline flow field. However, the newly generated closed separation results in the expansion of the high entropy region and the increase of the root loss. At the same time, the clearance leakage is divided into two parts under the action of the radial vortex. One part is sucked by the unstable radial vortex system (N 1, N 3, N 4). The other part is thrown into the boundary layer of the suction surface of the blade under the rotating action of the vortex. It can be seen from the limit streamline of suction surface that the scale of concentrated shedding vortex on the suction surface is larger in comparison with the prototype because of the inflow of partial leakage flow. The radial scale of the concentrated vortex developed from 0.3 H to 0.5 H. Although the scale increases but the strength of the vortex weakens. It shows that the static pressure coefficient of the corner increases and the low-pressure area of the baseline decreases, which indicates the impact of the clearance leakage making the vortex into an unstable state.
It can be seen from the limit streamlines in
Figure 9c that the leakage flow generated by the tail gap has stronger momentum and the radial vortex is broken under the impact of the leakage flow. An obvious impact path of leakage flow can be seen between the broken small vortices. The whole hub area is composed of several small vortices after crushing. The leakage flow induces a new spiral point at the leading edge of the stator. In the entropy contour, the high entropy concentration area of the hub disappears. The high loss area of the hub is smaller than that of the hub compared with Case 1. Due to the lack of low energy fluid transport from the boundary layer of the hub, the central vortex in the rear gap is unstable. The whole spiral structure in the clearance of the trailing edge is destroyed. In topology, it turns into an unstable structure with a spiral point and saddle point closely connected.
Case 3 has maximum leakage momentum in
Figure 9d. The closed separation of the hub corner disappears completely, except for the spiral point N 1, which is induced by the leakage flow in the front of the clearance. There is no other closed separation in the stator. An open separation line L1 formed by clearance leakage is on the hub. At the same time, the effect of leakage restrains the formation of concentrated shedding vortex. The spiral point on the suction surface disappears. In
Figure 9a,b,c, the large-scale entropy increasing region is replaced by the leakage vortex. The entropy increase of open separation is much smaller than that of closed separation. Thus, it can be said that this control method is effective.
On the hub surface, the radial vortices break into small vortices in
Figure 9e, which is similar to Case 2. The difference is that Case 4 has more leakage momentum. The scale of the small vortex formed by Case 4 is smaller than that of the Case 2. At the same time, the forward movement of the leakage vortex makes the concentrated shedding vortex to regenerate. In the entropy contour diagram, it can be seen that there is a high entropy region at the front edge of the suction. This is formed by leakage flow and broken radial vortex.
The law of vortex evolution can be obtained by comparing the streamline distribution of S 3 flow surface at the stator. Starting from 0.1 C flow surface, there are six S 3 flow surfaces selected to be studied. The flow field structure is shown in
Figure 10. The radial scale of stall vortex and its development along chord can be clearly seen in S 3 flow surface.
Figure 10a is the baseline stator. The node starting at 0.1 C marks the beginning of flow separation on the suction surface i.e., at the radial height 0.1 H. It is affected by the low energy fluid in the downstream of the corner. On the one hand, it is developing along the blade span. However, On the other hand, it moves to the pressure surface. At the same time under the action of the reverse pressure gradient, the node changes to the spiral point. At 0.5 C, it is transformed into a spiral point of completed closed separation, which corresponds to the vortex core region of stall vortex. There are obvious saddle points at 0.9 C. According to the topological rule, the spiral point and saddle point always appear in pairs, which can determine the nodes in the flow field to be transformed into spiral points. At the same time, it can be seen that the radial dimension of the stall region in the hub corner is about 0.4 H.
In
Figure 10b, at 0.05 H, part of the fluid is sucked into the suction surface through the trailing edge clearance. There is obvious backflow on the surface of S 3, which starts at 0.9 C and ends at 0.5 C. Since the radial vortex is not changed by leakage, the node migration and transformation in
Figure 10a still occur at the trailing edge clearance. The radial scale of the high entropy region is slightly larger than that of the baseline because the entrainment makes the concentrated vortex stronger, which is consistent with the previous literature. The radial height of the high entropy region decreases in Case 2 compared to Case 1 and the saddle point is pushed back from 0.5 C to 1.1C. At the same time, the leading-edge fluid is transported to the clearance leakage flow at 0.3 C. The high entropy area in the stator field is obviously reduced in case 3. At 0.5 C, the gap leakage vortex begins to form, the height of which does not exceed 0.05 H. It can be said that the Case 3 can effectively control the angular separation. The control effect of Case 4 is similar to that of Case 3. Both of them can reduce the radial scale of the high entropy region. The difference is that the vortex-induced by leakage in Case 4 is closer to the suction surface, as the leakage vortex with stronger momentum in case 3 will induce the vortex to blow to the pressure surface. It is worth mentioning that case 4 formed a sudden increase of static entropy after 0.7 C and 0.9 C. Case 4 worsens the flow field at the trailing edge. This is caused by the angle of blade curvature. In the same stator, the more distant the clearance position is, the incidence of the jet becomes larger relative to the trailing edge. It is more likely to cause flow separation, which further explains the reason why the front clearance can broaden the stall margin better but cause greater loss at the design point.
The three-dimensional interaction of radial flow and clearance leakage flow in hub corner stall is further discussed in
Figure 11. The black streamline in the figure represents the radial vortex of the stall, and the yellow streamline represents the clearance leakage. In order to describe the existence of vortices, this paper selects the criterion of vortices i.e., Q criterion as the basis of identifying vortices. It is worth mentioning that the Q criterion proposed by Hunt et al. in 1988 is used as a criterion for vortex prediction. The value of the relative helicity is illustrated with variance in color. In this paper, Q = 50000 s
−2. The interaction of vortices mentioned in the previous literature can be seen in
Figure 11.
Figure 12 shows the reason why different clearance positions have different effects on the hub corner stall control. The main reason for corner separation/stall is that the low energy fluid in the boundary layer cannot resist the transverse pressure gradient in the flow passage and accumulate at the suction surface. With the decrease of the flow rate, the axial momentum of the low-energy fluid weakens. There will be backflow once the fluid cannot resist the reverse pressure gradient of the flow direction. The radial development of backflow forms the radial vortex of hub corner stall, which is like a tornado. The purpose of gap control technology is to strengthen the low-energy fluid in order to resist the transverse and reverse pressure gradient. Therefore, the difference in clearance control effect on different positions depends on the leakage momentum of clearance. The product of velocity and density of clearance leakage is defined as leakage momentum. In
Figure 12, it can be seen that the leakage momentum increases gradually as the clearance moves forward and reaches its maximum in Case 3, and Case 4 has the least momentum. This explains the relationship between the clearance position and the control effect.
The radial parameter distribution of the stator is obtained by averaging the numerical simulation results in the circumferential direction as shown in
Figure 13 and
Figure 14. In order to further analyze the influence of the clearance on the compressor performance.
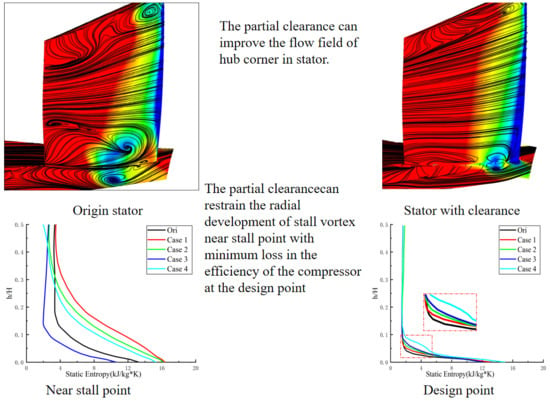
Figure 13a shows the near stall point. It can be seen that Case 3 can effectively reduce the static entropy at the blade root. The static entropy is larger because the fluid of case 1 is drawn toward the suction surface. For Case 2 and Case 4, the leakage flow vortex breaks the radial stall vortex. Consequently, the static entropy caused by the broken vortex is higher than that of the baseline stator at a 30% blade span. From 30% to 50% blade span, the static entropy decreases. This shows that the clearance can effectively control the radial development of stall vortex. In addition to the control effect at the near stall point, the control effect at the design point is also very important in the passive control. In
Figure 13b, it can be seen that all the clearance will increase the static entropy of the flow field under 10% blade height. However, except case 1, the rest cases have little effect on the static entropy at the blade root. This kind of local clearance control has the least damage to the design point in comparison with the uniform clearance.
The major effect of hub corner stall is that the stall fluid blocks the flow passage and reduces the flow capacity of the compressor. Therefore, this paper uses axial AVD to measure the flow capacity at the outlet. In addition to Case 4, other cases have little effect on AVD at the design point. At the near stall point, Case 3 can effectively increase AVD and the capacity of the flow passage. This is consistent with the previous static entropy contour in
Figure 10. Thus, it is concluded that Case 3 can improve the hub corner stall near the stall point and has the least impact on the flow field performance at the design point.


