
Differences in the Domestic Energy Consumption in Hungary: Trends between 2006–2017


Abstract
:1. Introduction
2. Materials and Methods
3. Results
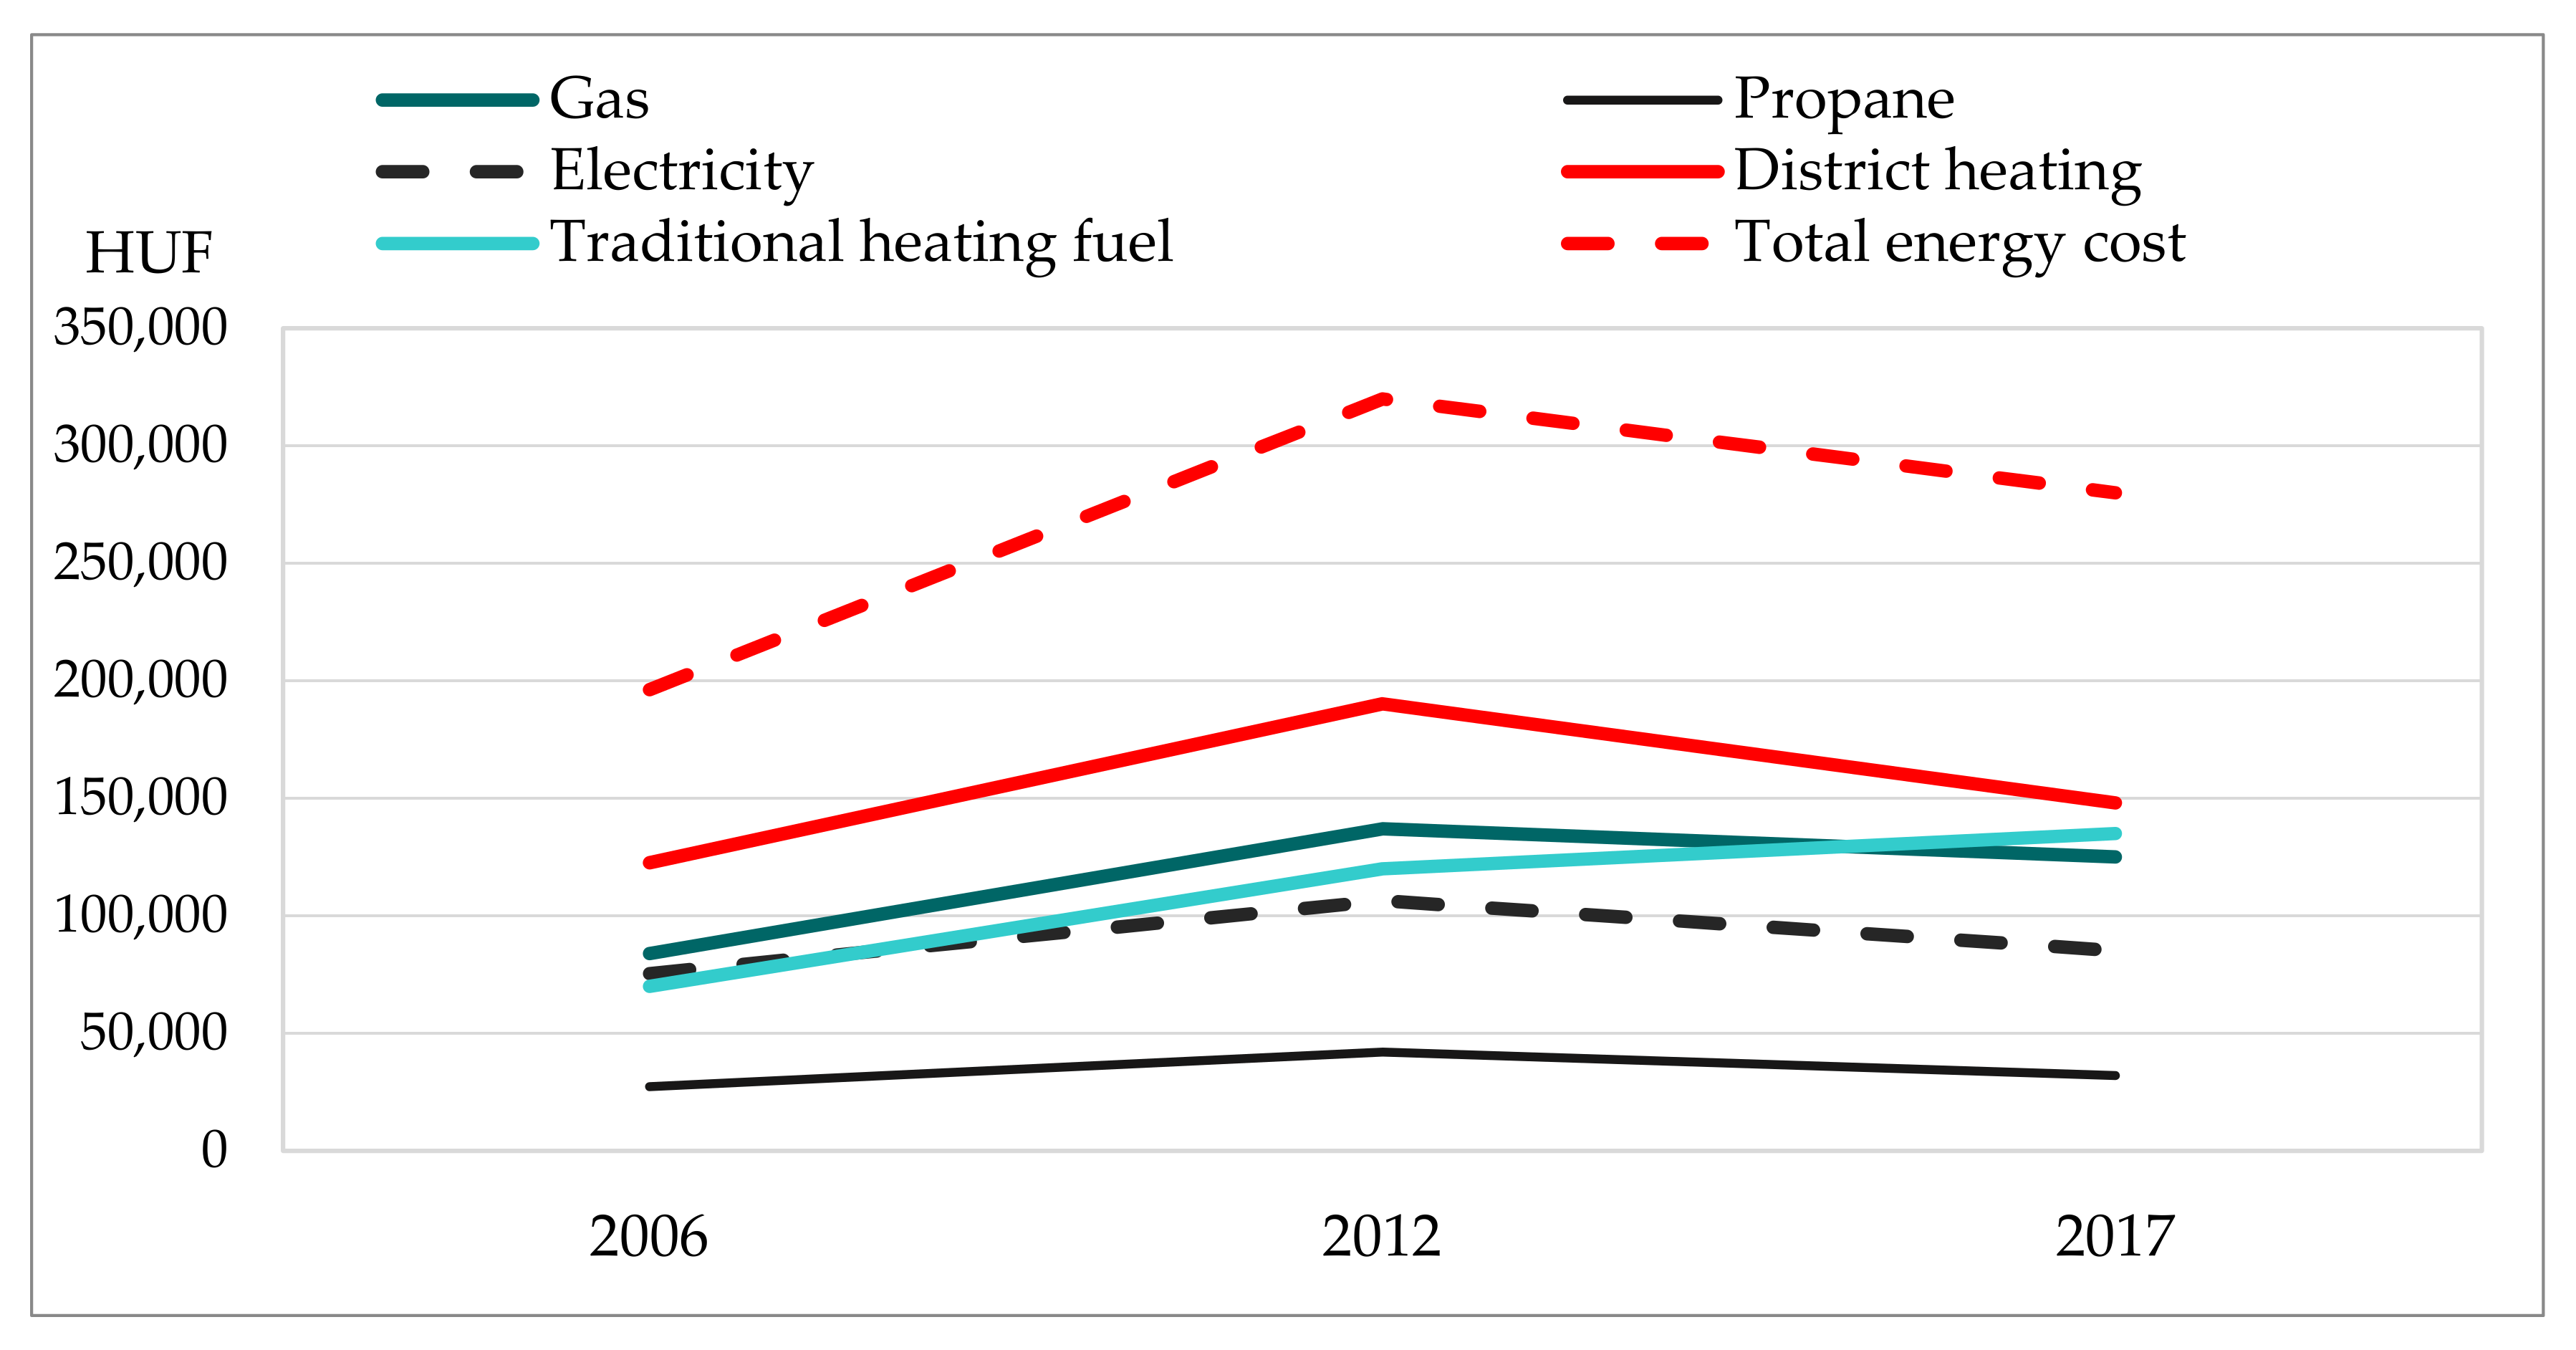
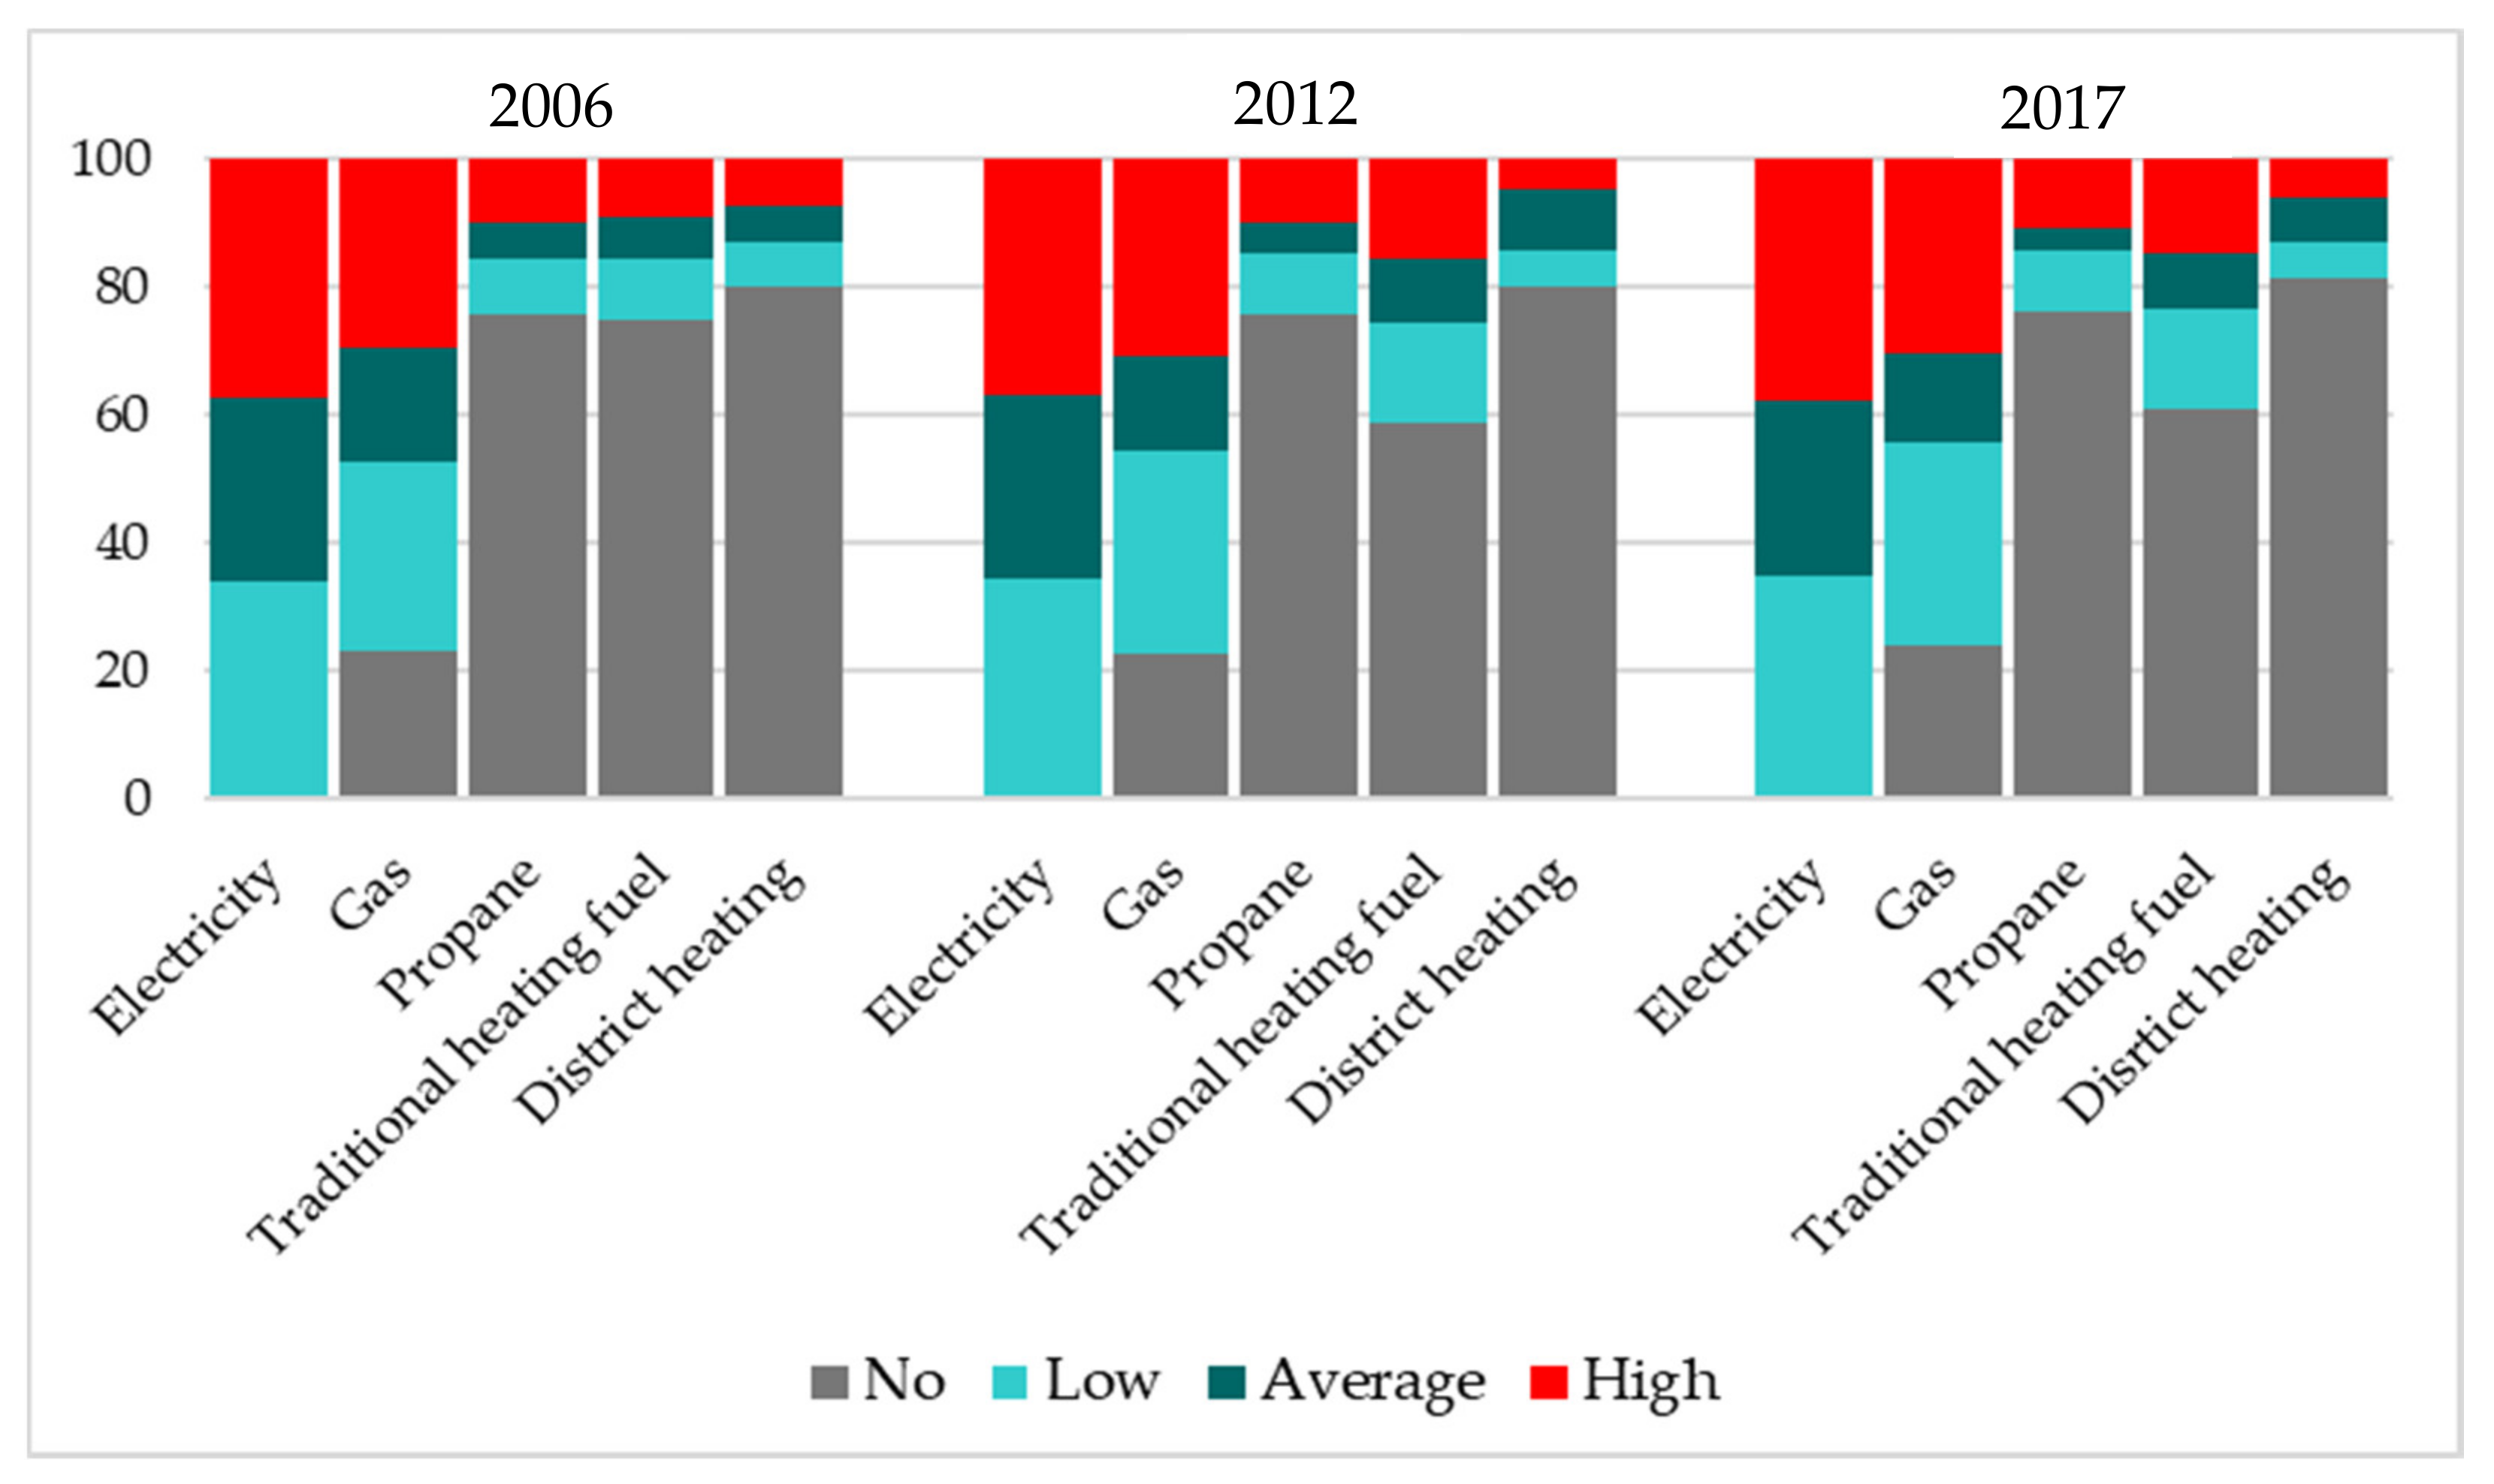
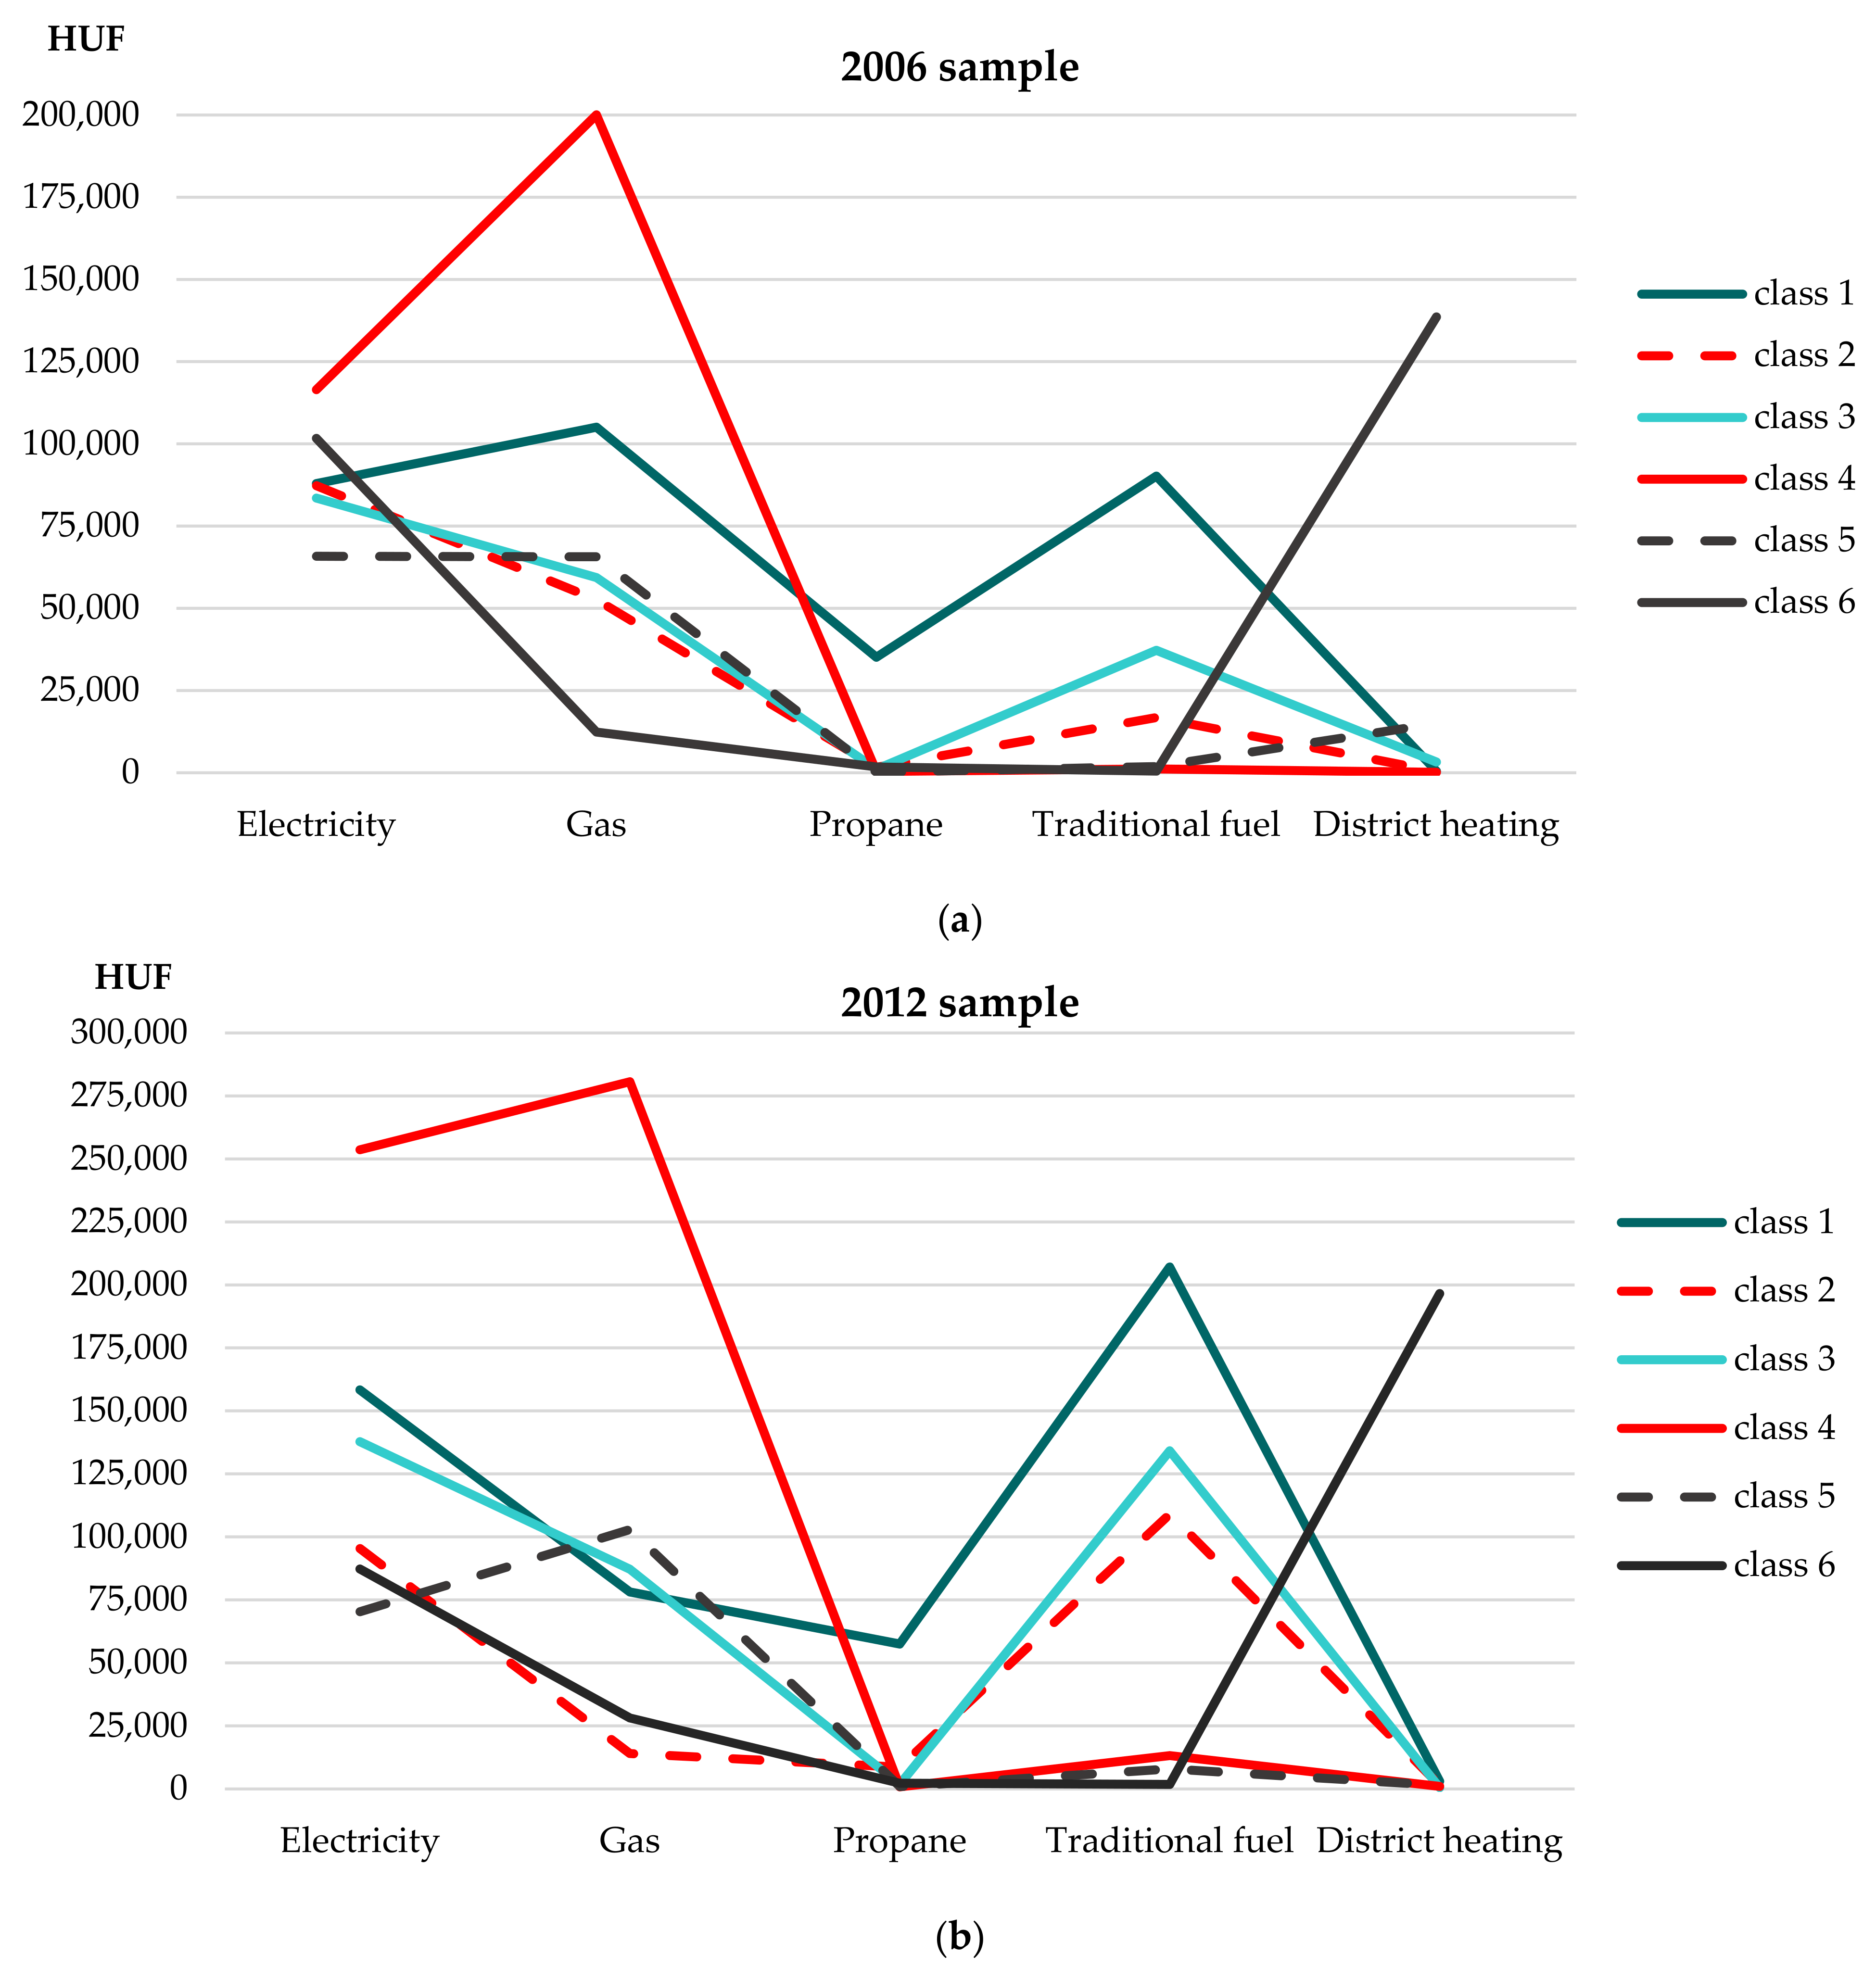
3.1. Energy Types Used, Heating Methods and Their Cost Ratio
3.2. Modes and Intensities of Domestic Energy Consumption
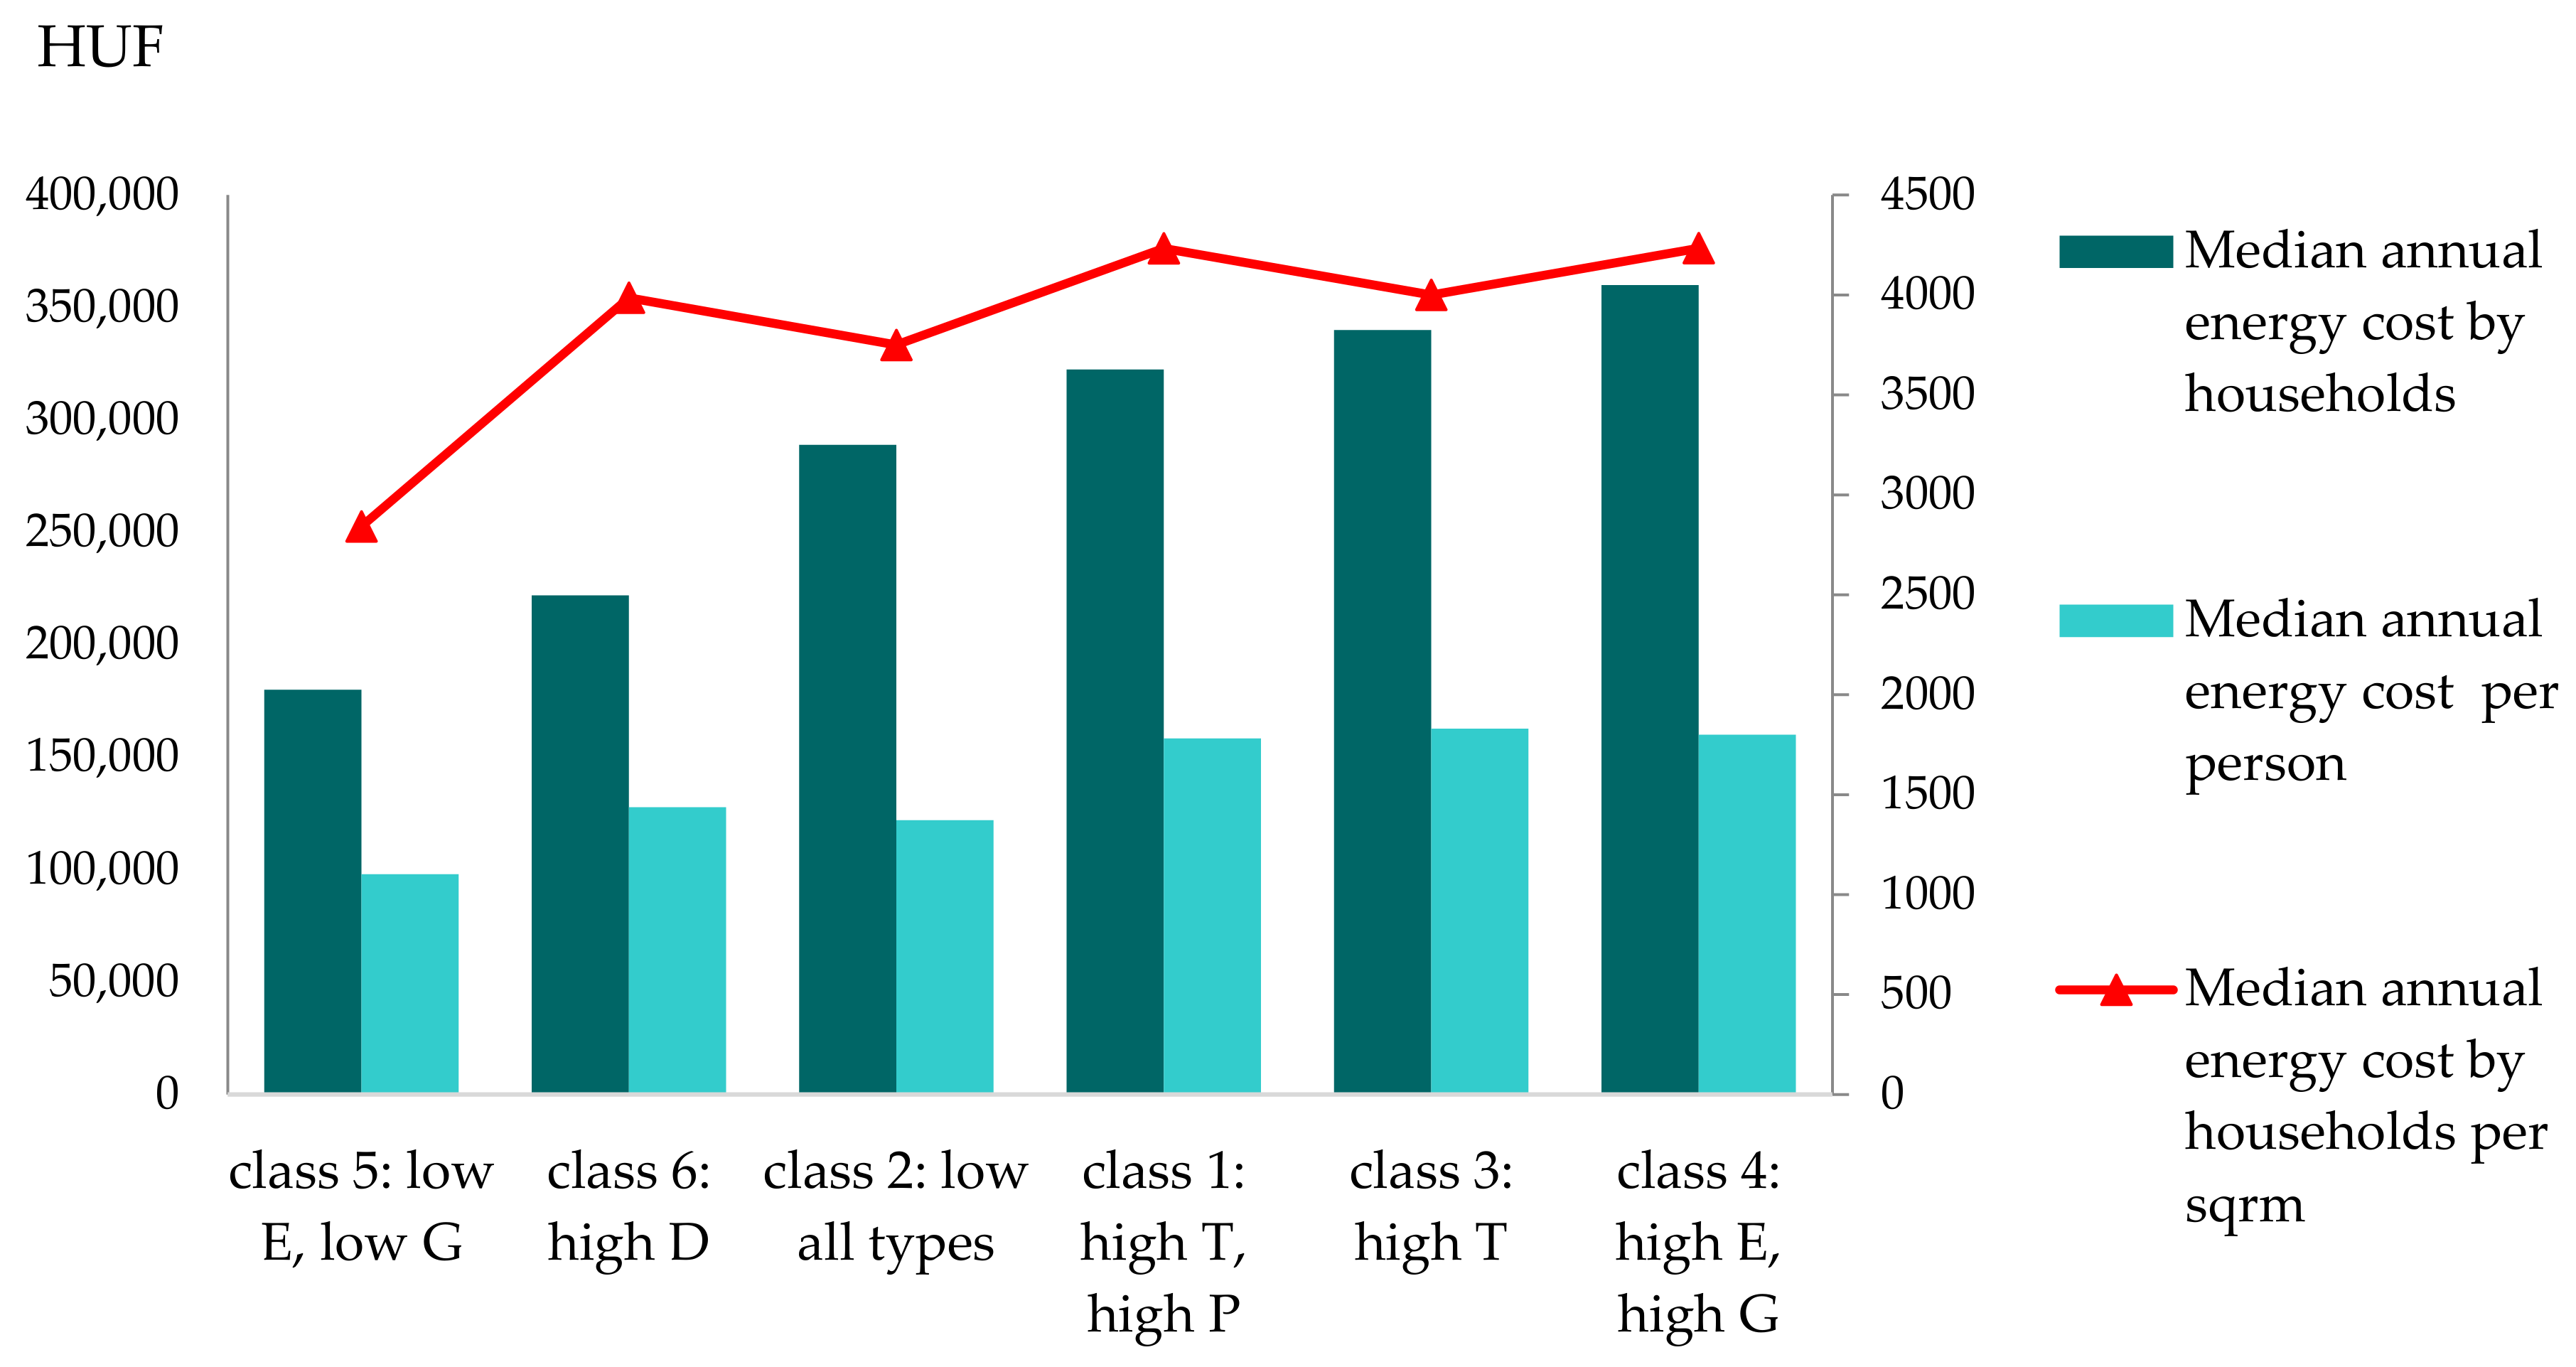
3.3. Typological Profiles of Domestic Energy Consumers
3.4. Factors of Domestic Energy Consumption
4. Discussion and Conclusions
Author Contributions
Funding
Institutional Review Board Statement
Informed Consent Statement
Data Availability Statement
Conflicts of Interest
Appendix A

| High Energy Consumer (%) | Low Energy Consumer (%) | |||||
|---|---|---|---|---|---|---|
| 2006 | 2012 | 2017 | 2006 | 2012 | 2017 | |
| Living environment | ||||||
| traditional urban design | 6.9 | 19.2 | 14.9 | 21.3 | 16.3 | 11.6 |
| housing estate | 19.5 | 16.9 | 17.7 | 26.7 | 23.9 | 18.3 |
| condominium and villa district | 2.1 | 3.2 | 4.9 | 3.4 | 4.1 | 3.4 |
| residential area with detached houses | 46.0 | 45.9 | 42.7 | 28.7 | 31.8 | 36.2 |
| residential area of rural character | 22.6 | 14.0 | 16.9 | 16.2 | 22.1 | 23.5 |
| suburbs and other | 2.9 | 0.8 | 2.8 | 3.8 | 1.8 | 7.0 |
| Property type | ||||||
| detached house | 68.4 | 55.1 | 59.6 | 42.7 | 62.5 | 62.1 |
| semi-detached or terraced house | 4.6 | 4.9 | 6.5 | 4.7 | 4.9 | 6.7 |
| condominium with less than 10 apartments | 2.3 | 5.7 | 4.6 | 5.6 | 3.9 | 5.1 |
| condominium with 10 or more apartments | 24.4 | 34.0 | 28.1 | 45.9 | 27.3 | 25.0 |
| other | 0.3 | 0.3 | 1.2 | 1.1 | 1.4 | 1.1 |
| Property age | ||||||
| Before 1945 | 10.5 | 16.6 | 16.2 | 29.4 | 22.1 | 21.1 |
| 1945–1969 | 21.9 | 20.0 | 24.6 | 35.2 | 37.7 | 35.7 |
| 1970–1989 | 63.6 | 58.9 | 51.1 | 34.1 | 37.4 | 37.6 |
| After 1999 | 4.0 | 4.5 | 8.0 | 1.3 | 2.9 | 5.6 |
| Floor-area | ||||||
| Below 36 m2 | 0.8 | 2.4 | 4.3 | 9.9 | 7.9 | 5.7 |
| 36–55 m2 | 12.7 | 17.9 | 17.3 | 36.8 | 27.2 | 25.8 |
| 56–75 m2 | 21.5 | 21.8 | 19.2 | 27.0 | 29.0 | 27.5 |
| 76–100 m2 | 36.9 | 32.1 | 30.9 | 22.6 | 27.9 | 30.9 |
| Over 100 m2 | 28.1 | 25.8 | 27.3 | 3.7 | 8.0 | 10.1 |
| Number of rooms | ||||||
| Up to 1 room | 1.1 | 5.5 | 6.5 | 19.7 | 15.0 | 10.9 |
| 2 rooms | 26.0 | 25.5 | 25.9 | 52.1 | 48.8 | 45.2 |
| 3–4 rooms | 62.6 | 59.2 | 54.3 | 27.0 | 34.9 | 40.2 |
| 5 or more rooms | 10.3 | 11.8 | 13.3 | 1.2 | 1.3 | 3.7 |
| Settlement type | ||||||
| Capital | 17.7 | 30.0 | 24.0 | 22.8 | 11.7 | 13.5 |
| County capital | 18.4 | 18.4 | 18.8 | 28.1 | 18.1 | 23.2 |
| Other town | 26.5 | 26.0 | 30.9 | 25.1 | 35.3 | 31.0 |
| Village | 38.1 | 25.7 | 26.4 | 24.0 | 34.9 | 32.3 |
| Class 1 | Class 2 | Class 3 | Class 4 | Class 5 | Class 6 | |
|---|---|---|---|---|---|---|
| N = 6960 = 100% | 18.6% | 8.8% | 17.8% | 22.1% | 17.5% | 15.2% |
| Living environment | ||||||
| traditional urban design | 3.3 | 9.9 | 6.6 | 12.4 | 21.5 | 15.7 |
| housing estate | 1.2 | 9.0 | 0.6 | 6.4 | 23.1 | 76.0 |
| condominium and villa district | 0.4 | 1.9 | 0.9 | 5.4 | 7.6 | 3.8 |
| residential area with detached houses | 32.0 | 38.8 | 55.4 | 57.0 | 33.2 | 3.0 |
| residential area of rural character | 45.6 | 34.2 | 34.8 | 16.0 | 13.0 | 1.1 |
| suburbs and other | 17.5 | 6.2 | 1.7 | 2.8 | 1.6 | 0.3 |
| Property type | ||||||
| detached house | 90.2 | 79.5 | 93.9 | 74.4 | 40.9 | 3.7 |
| semi-detached or terraced house | 5.7 | 3.0 | 4.0 | 9.5 | 7.2 | 1.0 |
| condominium with less than 10 apartments | 1.2 | 3.2 | 1.3 | 4.3 | 10.9 | 3.7 |
| condominium with 10 or more apartments | 1.6 | 12.5 | 0.7 | 11.5 | 39.8 | 90.5 |
| other | 1.3 | 1.9 | 0.0 | 0.3 | 1.1 | 1.0 |
| Property age | ||||||
| Before 1945 | 28.7 | 15.7 | 11.6 | 14.7 | 20.7 | 3.0 |
| 1945–1969 | 36.2 | 32.9 | 30.0 | 32.2 | 34.6 | 17.1 |
| 1970–1989 | 29.5 | 47.4 | 53.1 | 45.0 | 37.8 | 76.6 |
| After 1999 | 5.6 | 4.0 | 5.2 | 8.2 | 6.8 | 3.3 |
| Floor-area | ||||||
| Below 36 m2 | 1.5 | 2.0 | 0.2 | 0.7 | 6.0 | 8.9 |
| 36–55 m2 | 12.7 | 12.5 | 2.7 | 8.7 | 30.4 | 50.2 |
| 56–75 m2 | 29.5 | 18.5 | 13.7 | 21.0 | 30.6 | 35.5 |
| 76–100 m2 | 41.7 | 46.1 | 52.0 | 44.3 | 25.5 | 4.5 |
| Over 100 m2 | 14.7 | 20.9 | 31.4 | 25.3 | 7.5 | 0.9 |
| Number of rooms | ||||||
| Up to 1 room | 7.4 | 4.0 | 1.2 | 1.6 | 12.5 | 7.6 |
| 2 rooms | 41.0 | 29.8 | 21.6 | 27.7 | 45.5 | 52.7 |
| 3–4 rooms | 46.5 | 56.2 | 65.8 | 61.2 | 38.9 | 38.5 |
| 5 or more rooms | 5.1 | 10.0 | 11.4 | 9.6 | 3.1 | 1.1 |
| Settlement type | ||||||
| Capital | 0.9 | 2.6 | 1.6 | 17.1 | 26.4 | 22.7 |
| County capital | 5.3 | 10.0 | 11.8 | 23.1 | 26.9 | 57.6 |
| Other town | 27.2 | 36.1 | 37.0 | 32.5 | 31.0 | 18.0 |
| Village | 66.6 | 51.3 | 49.7 | 27.3 | 15.7 | 1.7 |
| Grounds for using the property | ||||||
| owner. beneficiary | 91.7 | 94.0 | 97.8 | 95.9 | 88.3 | 83.4 |
| flat rented on market price | 3.3 | 2.4 | 1.4 | 2.5 | 4.7 | 7.5 |
| flat rented not on market price | 3.6 | 2.1 | 0.3 | 1.2 | 5.1 | 7.2 |
| free user. other | 1.4 | 1.4 | 0.5 | 0.3 | 2.0 | 1.9 |
| Household type | ||||||
| Young couple without a child or a young single person | 3.8 | 1.4 | 1.3 | 1.6 | 2.9 | 4.6 |
| Couple with children (30–54 y.o.) | 26.1 | 22.3 | 23.5 | 21.4 | 17.1 | 25.7 |
| Couple without children (30–54 y.o.) | 21.6 | 12.3 | 13.4 | 15.2 | 12.7 | 13.0 |
| Elderly couple without children (55–64 y.o.) | 21.3 | 24.6 | 24.1 | 19.2 | 18.5 | 18.6 |
| Elderly retired couple or single pensioner | 27.2 | 39.3 | 37.8 | 42.5 | 48.9 | 38.2 |
| Income status | ||||||
| 1st quintile | 33.2 | 13.6 | 10.5 | 6.3 | 14.5 | 9.3 |
| 2nd quintile | 24.9 | 18.2 | 22.4 | 14.2 | 17.3 | 13.5 |
| 3rd quintile | 21.7 | 22.9 | 26.1 | 23.0 | 21.6 | 22.6 |
| 4th quintile | 12.8 | 24.2 | 23.2 | 27.6 | 22.9 | 25.7 |
| 5th quintile | 7.5 | 21.1 | 17.8 | 28.9 | 23.6 | 28.9 |
| Educational attainment of HRP | ||||||
| Elementary | 46.3 | 24.9 | 22.3 | 15.9 | 21.4 | 11.0 |
| Secondary without high-school diploma | 34.8 | 34.5 | 35.3 | 25.4 | 21.9 | 23.4 |
| Secondary with high-school diploma | 15.5 | 28.7 | 29.4 | 31.8 | 35.7 | 39.5 |
| Higher | 3.4 | 11.9 | 13.0 | 26.8 | 20.9 | 26.1 |
| Explanatory Power of Models Constructed to Explain Energy Consumer Types (R2) | ||||||
|---|---|---|---|---|---|---|
| Class 1 | Class 2 | Class 3 | Class 4 | Class 5 | Class 6 | |
| Building model | 0.347 | 0.117 | 0.286 | 0.397 | 0.231 | 0.671 |
| Socio-dempgraphic model | 0.312 | 0.063 | 0.114 | 0.141 | 0.207 | 0.255 |
| Final model | 0.415 | 0.184 | 0.301 | 0.440 | 0.312 | 0.692 |
References
- Owusu, P.A.; Asumadu-Sarkodie, S. A review of renewable energy sources, sustainability issues and climate change mitigation. Cogent Eng. 2016, 3, 1167990. [Google Scholar] [CrossRef]
- United Nations. The 17 Goals. Available online: https://sdgs.un.org/goals (accessed on 12 July 2021).
- IEA. Energy Access Outlook 2017; IEA: Paris, France, 2017; Available online: https://www.iea.org/reports/energy-access-outlook-2017 (accessed on 12 July 2021).
- Halkos, G.E.; Gkampoura, E.C. Coping with Energy Poverty: Measurements, Drivers, Impacts, and Solutions. Energies 2001, 14, 2807. [Google Scholar] [CrossRef]
- Bollino, C.A.; Botti, F. Energy poverty in Europe: A multidimensional approach. PSL Q. Rev. 2017, 70, 473–507. [Google Scholar] [CrossRef]
- Kytka, I.; Vácha, T.; Malík, Z.; Včelák, J.; Nosková, S. Study on Energy Poverty in the Danube Region; Czech Technical University: Prague, Czech Republic, 2019; Available online: https://energy.danube-region.eu/wp-content/uploads/sites/6/sites/6/2020/02/Studie_Energy_Poverty_in_the_Danube_Region.pdf (accessed on 12 July 2021).
- Herrero, S.T. Energy poverty indicators: A critical review of methods. Indoor Built Environ. 2017, 26, 1018–1031. [Google Scholar] [CrossRef]
- Boardman, B. Opportunities and constraints posed by fuel poverty on policies to reduce the greenhouse effect in Britain. Appl. Energy 1993, 2, 185–195. [Google Scholar] [CrossRef]
- EU Energy Poverty Observatory. Member State Reports on Energy Poverty. 2019. Available online: Chrome-extension://efaidnbmnnnibpcajpcglclefindmkaj/viewer.html?pdfurl=https%3A%2F%2Fwww.energypoverty.eu%2Fsites%2Fdefault%2Ffiles%2Fdownloads%2Fobservatory-documents%2F20-06%2Fmj0420245enn.en_.pdf&clen=2350753&chunk=true (accessed on 12 July 2021).
- Primc, K.; Dominko, M.; Slabe-Erker, R. 30 years of energy and fuel poverty research: A retrospective analysis and future trends. J. Clean. Prod. 2021, 301, 127003. [Google Scholar] [CrossRef]
- Feldmár, N.; Kiss, C.; Betlen, A.; Sáfrány, R.; Bajomi, A.Z. Helyzetkép a Magyarországi Energiaszegénységről. 2020. Available online: https://www.elosztoprojekt.hu/wp-content/uploads/2021/05/Z%C3%A1r%C3%B3tanulm%C3%A1ny_ELOSZT%C3%93.pdf (accessed on 12 July 2021).
- OpenExp. European Energy Poverty Index (EEPI). 2019. Available online: https://www.openexp.eu/sites/default/files/publication/files/european_energy_poverty_index-eepi_en.pdf (accessed on 12 July 2021).
- Feldmár, N. Energiaszegénység. In Éves Lakhatási Jelentés 2020; Gosztonyi, Á., Ed.; Habitat for Humanity: Budapest, Hungary, 2020; pp. 42–54. Available online: https://habitat.hu/sites/lakhatasi-jelentes-2020/wp-content/uploads/sites/9/2020/10/hfhh_lakhatasi_jelentes_2020.pdf (accessed on 12 July 2021).
- Fülöp, O.; Lehoczki-Krajsak, A. Energiaszegénység Magyarországon. Stat. Szemle 2014, 92, 820–831. [Google Scholar]
- Fellegi, D.; Fülöp, O. Szegénység vagy Energiaszegénység? Az Energiaszegénység Definiálása Európában és Magyarországon; Energiaklub: Budapest, Hungary, 2012; Available online: https://energiaklub.hu/files/study/energiaklub_szegenyseg_vagy_energiaszegenyseg.pdf (accessed on 12 July 2021).
- Collins, L.M.; Lanta, S.T. Latent Class and Latent Transition Analysis: With Applications in the Social, Behavioral, and Health Sciences; John Wiley & Sons, Inc.: Hoboken, NJ, USA, 2010. [Google Scholar] [CrossRef]
- Available online: https://www.ksh.hu/docs/hun/xstadat/xstadat_eves/i_qsf003a.html?down=1116 (accessed on 12 July 2021).
- Fraley, C.; Raftery, A.E. Model-based clustering, discriminant analysis and density estimation. J. Am. Stat. Assoc. 2002, 97, 611–631. [Google Scholar] [CrossRef]
- Nylund, K.L.; Asparouhov, T.; Muthén, B.O. Deciding on the number of classes in latent class analysis and growth mixture modeling: A Monte Carlo simulation study. Struct. Equ. Modeling 2007, 14, 535–569. [Google Scholar] [CrossRef]
- Bordass, B.; Cohen, R.; Standeven, M.; Leaman, A. Assessing building performance in use 3: Energy performance of probe buildings. Build. Res. Inf. 2001, 29, 114–128. [Google Scholar] [CrossRef]
- Huebner, G.M.; Hamilton, I.; Chalabi, Z.; Shipworth, D.; Oreszczyn, T. Explaining domestic energy consumption—The comparative contribution of building factors, socio-demographics, behaviours and attitudes. Appl. Energy 2015, 159, 589–600. [Google Scholar] [CrossRef] [Green Version]
- Menezes, A.; Cripps, A.; Bouchlaghem, D.; Buswell, R. Predicted vs. actual energy performance of non-domestic buildings: Using post-occupancy evaluation data to reduce the performance gap. Appl. Energy 2012, 97, 355–364. [Google Scholar] [CrossRef] [Green Version]
- Guerra Santin, O.; Itard, L.; Visscher, H. The effect of occupancy and building characteristics on energy use for space and water heating in Dutch residential stock. Energy Build. 2009, 41, 1223–1232. [Google Scholar] [CrossRef]
- Yohanis, Y.G.; Mondol, J.D.; Wright, A.; Norton, B. Real-life energy use in the UK: How occupancy and dwelling characteristics affect domestic electricity use. Energy Build. 2008, 40, 1053–1059. [Google Scholar] [CrossRef]
- Theodoridou, I.; Papadopoulos, A.M.; Hegger, M. Statistical analysis of the Greek residential building stock. Energy Build. 2011, 43, 2422–2428. [Google Scholar] [CrossRef]
- Steemers, K.; Young Yun, G. Household energy consumption: A study of the role of occupants. Build. Res. Inf. 2009, 37, 625–637. [Google Scholar] [CrossRef]


| Class | % | Energy Types and Intensities | Profile |
|---|---|---|---|
| 1 | 18.6 | high T, high P | intensive use of conventional fuels and propane gas |
| 2 | 8.8 | low all types | low energy consumption |
| 3 | 17.8 | high T | intensive use of conventional fuels |
| 4 | 22.1 | high E, high G | intensive electricity and gas consumption |
| 5 | 17.5 | low E, low G | low electricity and gas consumption |
| 6 | 15.2 | high D, low E, low G | intensive use of central-district heating |
| 2006 | 2012 | 2017 | ||||||
|---|---|---|---|---|---|---|---|---|
| Class | % | Energy Types | Class | % | Energy Types | Class | % | Energy Types |
| class 1 | 15.2 | high T, high P | class 1 | 19.1 | high T, high P, high E | class 1 | 18.6 | high T, high P |
| class 2 | 6.9 | low all types | class 2 | 8.9 | low E,G,P,D, high T | class 2 | 8.8 | low all types |
| class 3 | 11.9 | high T | class 3 | 14.4 | high T | class 3 | 17.8 | high T |
| class 4 | 27.7 | high E, high G | class 4 | 30.8 | high E, high G | class 4 | 22.1 | high E, high G |
| class 5 | 22.8 | low E, low G | class 5 | 13.5 | low E, low G | class 5 | 17.5 | low E, low G |
| class 6 | 15.5 | high D, high E, low G | class 6 | 12.4 | high D, low E, low G | class 6 | 15.2 | high D, low E, low G |
| Factors | Class 1 | Class 2 | Class 3 | Class 4 | Class 5 | Class 6 |
|---|---|---|---|---|---|---|
| High T, High P | Low all Types | High T | High E, High G | Low E, Low G | High D, Low E, Low G | |
| Building Variables | ||||||
| Living environment (Ref: rural residential area) | ||||||
| traditional urban design | 0.213 *** | 0.961 *** | 0.842 *** | 1.076 *** | 1.362 *** | 2.810 *** |
| housing estate | 0.315 *** | 0.501 *** | 0.172 *** | 0.835 *** | 1.079 *** | 2.886 *** |
| condominium and villa district | 0.112 *** | 0.694 *** | 0.852 *** | 2.121 *** | 0.955 *** | 1.016 * |
| residential area with detached houses | 0.456 *** | 0.890 *** | 1.645 ** | 3.114 *** | 1.024 *** | 0.957 |
| Property type (Ref: semi-detached, or terraced house) | ||||||
| detached house | 1.455 *** | 1.484 *** | 1.441 *** | 2.898 *** | 0.542 *** | 0.432 *** |
| condominium with less than 10 apartments | 0.610 *** | 1.733 *** | 0.656 *** | 0.428 *** | 2.278 *** | 1.995 *** |
| condominium with 10 or more apartments | 0.131 *** | 1.538 *** | 0.142 *** | 0.301 *** | 1.742 *** | 4.638 *** |
| Property age (Ref: pre 1945) | ||||||
| 1946–1969 | 0.590 *** | 0.998 | 1.086 *** | 1.156 *** | 0.941 *** | 1.848 *** |
| 1970–1999 | 0.480 *** | 0.922 *** | 1.394 *** | 1.059 ** | 0.709 *** | 6.094 *** |
| post 1999 | 0.476 *** | 0.587 *** | 1.039 ** | 1.411 *** | 0.871 *** | 2.395 *** |
| Floor area (Ref: below 36 m2) | ||||||
| 36–55 m2 | 2.980 *** | 0.1140 ** | 1.684 *** | 1.388 *** | 1.234 *** | 1.510 *** |
| 56–75 m2 | 3.376 *** | 0.708 *** | 2.657 *** | 2.053 *** | 1.517 *** | 0.243 *** |
| 76–100 m2 | 1.765 *** | 1.731 *** | 3.449 *** | 2.659 *** | 1.224 *** | 0.117 *** |
| over 100 m2 | 1.780 *** | 0.643 *** | 4.021 *** | 3.081 *** | 0.793 *** | 0.049 *** |
| Number of rooms (Ref: up to 1 room) | ||||||
| 2 rooms | 0.566 *** | 1.210 *** | 0.876 *** | 2.275 *** | 1.604 *** | 1.484 *** |
| 3–4 rooms | 0.331 *** | 1.535 *** | 1.181 *** | 2.657 *** | 0.442 *** | 0.049 |
| 5 rooms or more | 0.274 *** | 1.704 *** | 1.296 *** | 2.857 *** | 0.486 *** | 0.383 *** |
| Wall type (Ref: panel, medium- or large building blocks, concrete) | ||||||
| Brick, stone | 1.805 *** | 0.814 *** | 1.156 *** | 3.547 *** | 4.906 *** | 0.143 *** |
| Adobe | 1.643 *** | 1.033 * | 0.893 *** | 0.010 * | 3.922 *** | 0.070 *** |
| Technical problem in the property a (Ref: Not typical) | ||||||
| Typical | 1.996 *** | 1.113 *** | 0.734 *** | 0.848 *** | 0.765 *** | 0.616 *** |
| Settlement type (Ref: village) | ||||||
| Capital | 0.086 *** | 0.170 *** | 0.246 *** | 3.057 *** | 3.061 *** | 2.627 *** |
| County capital | 0.210 *** | 0.287 *** | 0.808 *** | 2.315 *** | 1.919 *** | 2.510 *** |
| Other town | 0.651 *** | 0.856 *** | 1.272 *** | 1.385 *** | 1.796 *** | 0.967 ** |
| Region (Ref: the Southern Great Plain) | ||||||
| Central-Hungary | 0.800 | 0.417 *** | 0.874 | 1.312 *** | 2.939 | 1.945 *** |
| Central-Transdanubia | 2.966 *** | 1.263 *** | 1.036 ** | 1.185 *** | 0.332 *** | 1.950 *** |
| Western-Transdanubia | 2.150 *** | 0.605 *** | 1.545 *** | 0.430 *** | 0.632 *** | 2.036 *** |
| Southern-Transdanubia | 5.447 *** | 1.258 *** | 0.701 *** | 0.489 *** | 0.440 *** | 2.610 *** |
| North-Hungary | 3.104 *** | 0.680 *** | 1.763 *** | 0.681 *** | 0.576 *** | 1.164 *** |
| Northern Great Plain | 1.124 *** | 0.848 ** | 3.580 *** | 0.758 *** | 0.796 *** | 1.355 *** |
| Socio-Demographic Variables | ||||||
| Household size (Ref: 5 people or more) | ||||||
| 1 or 2 people | 0.595 *** | 2.745 *** | 0.642 *** | 2.789 *** | 3.721 *** | 1.204 *** |
| 3 or 4 people | 1.821 *** | 0.650 *** | 1.718 *** | 1.959 ** | 2.887 *** | 0.888 *** |
| Household type (Ref: Elderly retired couple or single pensioner) | ||||||
| Young couple without a child or a young single person | 1.595 *** | 0.272 *** | 0.822 *** | 0.559 *** | 1.886 *** | 2.221 *** |
| Couple with children (30–54 y.o.) | 2.863 *** | 0.665 *** | 2.145 *** | 0.745 *** | 0.882 * | 1.136 *** |
| Couple without children (30–54 y.o.) | 2.506 *** | 0.624 *** | 1.034 * | 1.738 *** | 0.896 *** | 1.871 *** |
| Elderly couple without children (55–64 y.o.) | 1.948 *** | 0.858 *** | 1.171 *** | 0.751 *** | 1.013 * | 1.169 *** |
| Income status (Ref: 5th quintile) | ||||||
| 1st quintile | 2.995 *** | 0.714 *** | 0.891 *** | 0.329 *** | 2.264 *** | 0.729 *** |
| 2nd quintile | 1.746 *** | 0.641 *** | 1.212 *** | 0.554 *** | 1.905 *** | 1.154 *** |
| 3rd quintile | 1.464 ** | 0.785 *** | 1.234 *** | 0.757 *** | 3.505 *** | 0.998 |
| 4th quintile | 0.981 * | 1.114 *** | 1.011 * | 0.905 *** | 1.287 *** | 0.870 ** |
| Grounds for using the property (Ref: free accommodation) | ||||||
| Owner | 3.648 *** | 1.403 *** | 1.901 *** | 2.410 *** | 0.533 *** | 1.808 *** |
| Private sector tenant | 1.446 *** | 0.380 *** | 1.069 | 1.001 | 1.645 *** | 2.793 *** |
| Educational attainment ofHRP (Ref: Higher) | ||||||
| Elementary | 5.952 *** | 1.2976 *** | 0.910 *** | 0.664 *** | 0.706 *** | 0.742 *** |
| Secondary without high-school diploma | 4.109 *** | 1.433 *** | 1.244 *** | 0.662 *** | 0.687 *** | 0.980 |
| Secondary with high-school diploma | 2.171 *** | 1.218 *** | 1.149 *** | 0.847 *** | 0.957 *** | 0.995 |
| Economic activity of HRP (Ref: Other inactive) | ||||||
| Employment | 1.149 *** | 0.938 *** | 3.102 *** | 1.277 *** | 1.959 *** | 1.663 *** |
| Pensioner | 0.892 *** | 1.624 *** | 1.201 *** | 1.064 * | 1.611 *** | 0.878 *** |
| Length of residency (Ref: more than 30 years) | ||||||
| 4 years or less | 0.553 *** | 0.979 ** | 0.721 *** | 0.636 *** | 1.925 *** | 0.842 *** |
| 5–10 years | 1.720 *** | 0.740 *** | 1.167 *** | 0.875 *** | 1.175 *** | 1.405 *** |
| 11–20 years | 1.671 *** | 1.022 * | 1.855 *** | 1.270 *** | 1.210 *** | 0.937 ** |
| 21–30 years | 0.890 *** | 1.019 * | 0.895 *** | 0.991 | 1.240 *** | 1.245 ** |
| N | 6444 | 6444 | 6444 | 6444 | 6444 | 6444 |
| R2 | 0.415 | 0.184 | 0.301 | 0.440 | 0.312 | 0.692 |
Publisher’s Note: MDPI stays neutral with regard to jurisdictional claims in published maps and institutional affiliations. |
© 2021 by the authors. Licensee MDPI, Basel, Switzerland. This article is an open access article distributed under the terms and conditions of the Creative Commons Attribution (CC BY) license (https://creativecommons.org/licenses/by/4.0/).
Share and Cite
Győri, Á.; Huszár, Á.; Balogh, K. Differences in the Domestic Energy Consumption in Hungary: Trends between 2006–2017. Energies 2021, 14, 6718. https://doi.org/10.3390/en14206718
Győri Á, Huszár Á, Balogh K. Differences in the Domestic Energy Consumption in Hungary: Trends between 2006–2017. Energies. 2021; 14(20):6718. https://doi.org/10.3390/en14206718
Chicago/Turabian StyleGyőri, Ágnes, Ákos Huszár, and Karolina Balogh. 2021. "Differences in the Domestic Energy Consumption in Hungary: Trends between 2006–2017" Energies 14, no. 20: 6718. https://doi.org/10.3390/en14206718
APA StyleGyőri, Á., Huszár, Á., & Balogh, K. (2021). Differences in the Domestic Energy Consumption in Hungary: Trends between 2006–2017. Energies, 14(20), 6718. https://doi.org/10.3390/en14206718