
The Dynamic Spillover between Renewable Energy, Crude Oil and Carbon Market: New Evidence from Time and Frequency Domains

Abstract
:1. Introduction
2. Empirical Methodology
2.1. Measuring Connectedness in the Time Domain
2.2. Measuring Connectedness in the Frequency Domain
3. Data
3.1. Data Description
3.2. Preliminary Analysis
4. Empirical Results
4.1. Connectedness Analysis in Time Domain
4.1.1. Static Connectedness Analysis
4.1.2. Dynamic Connectedness Analysis
4.2. Connectedness Analysis in the Frequency Domain
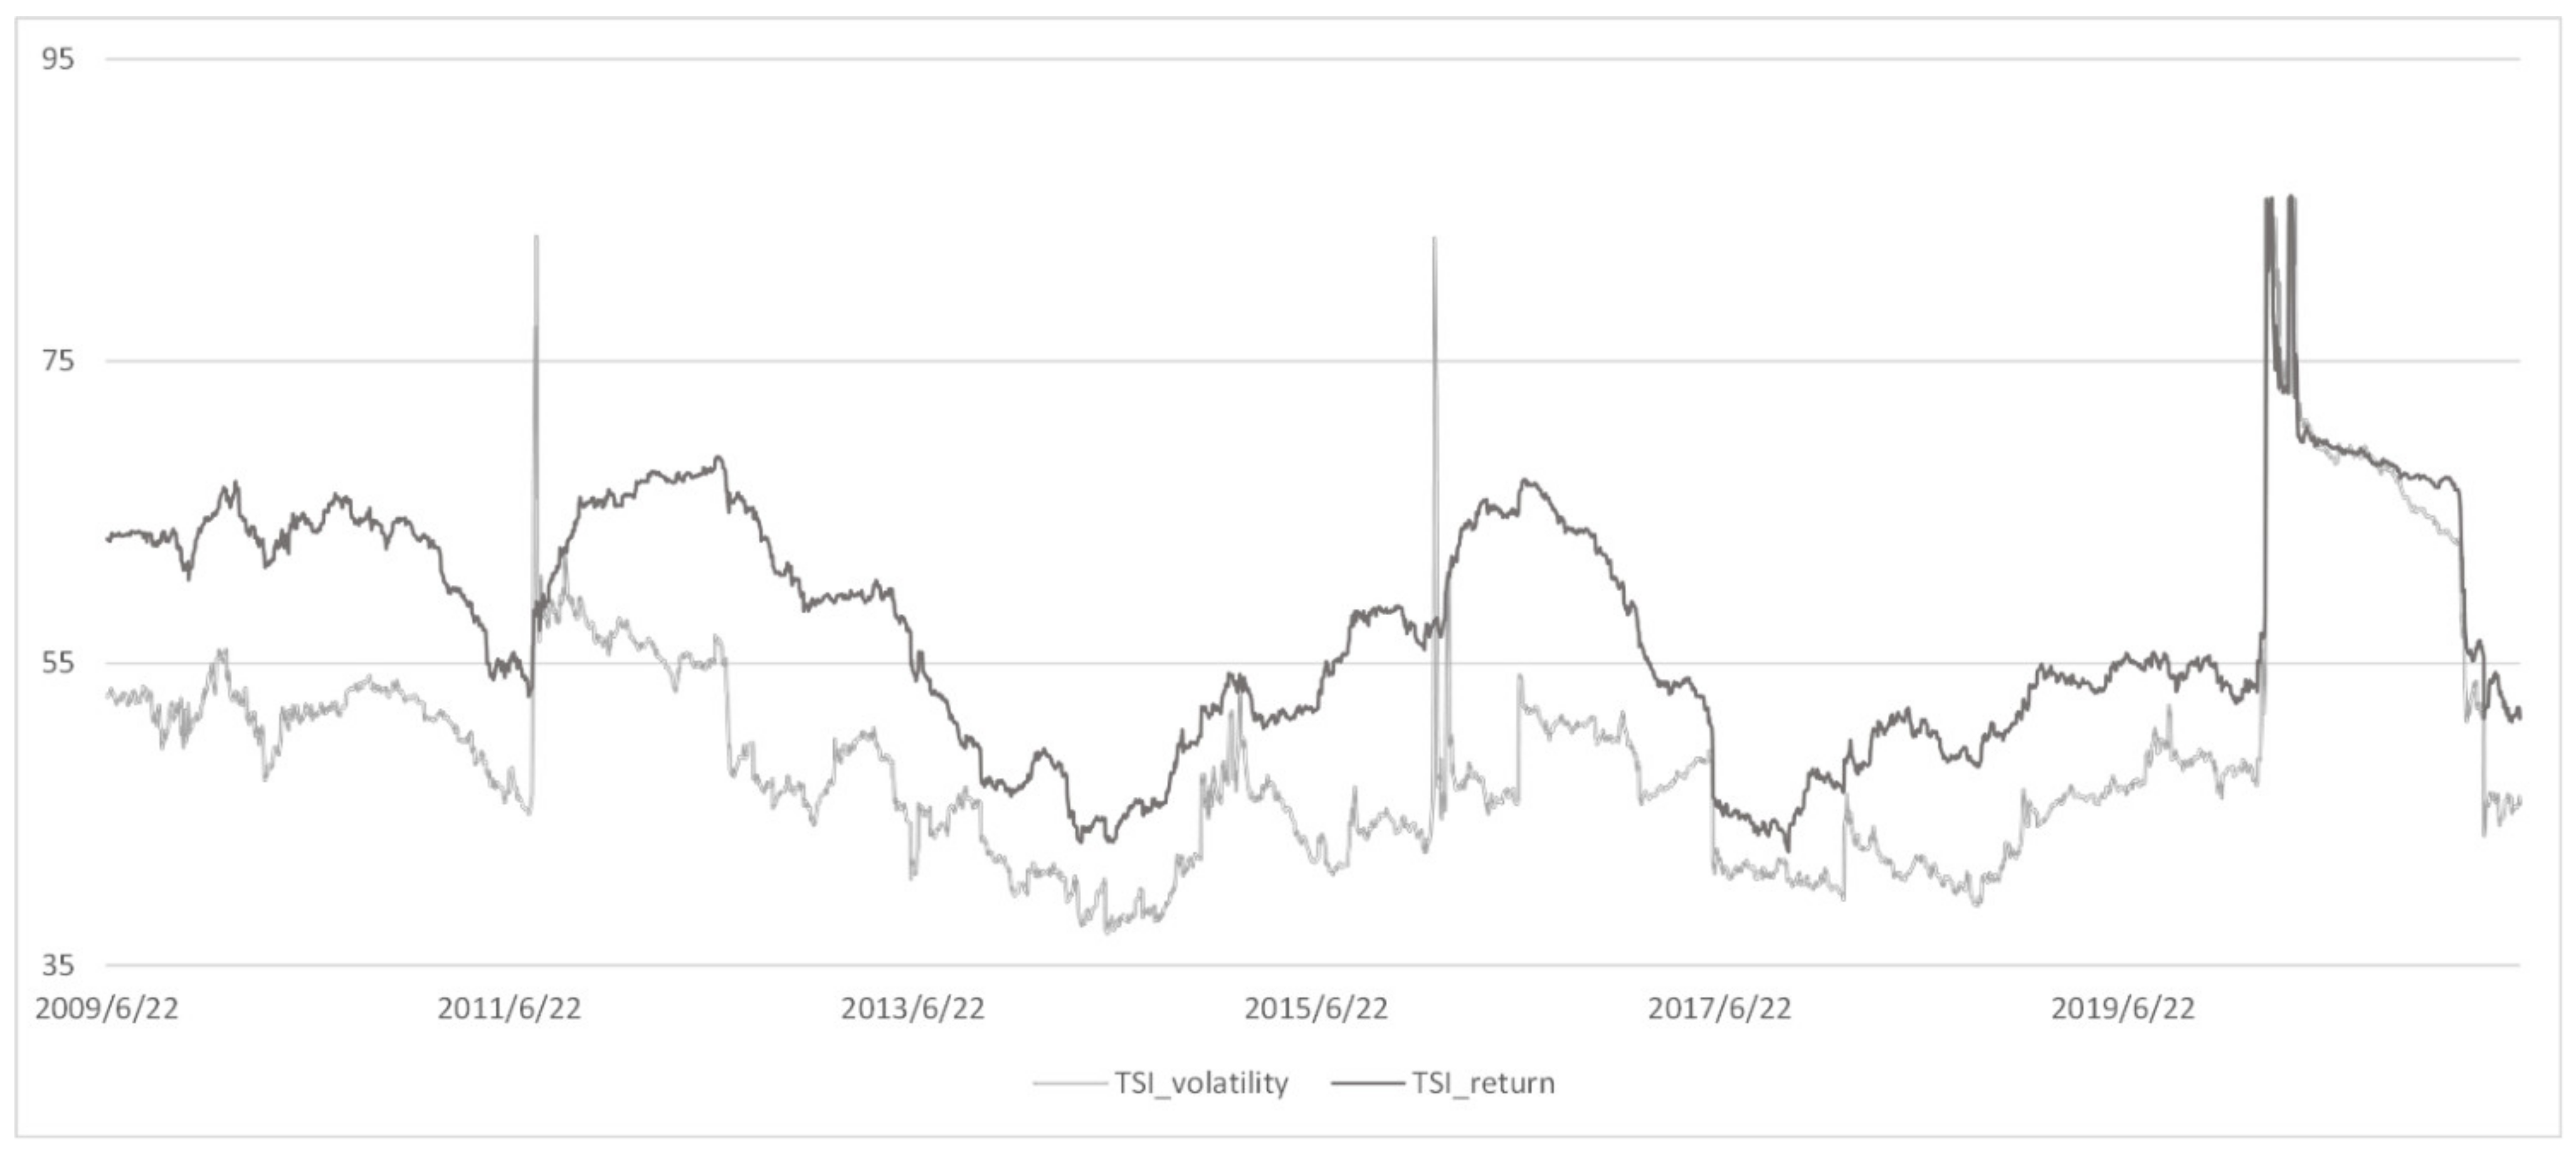
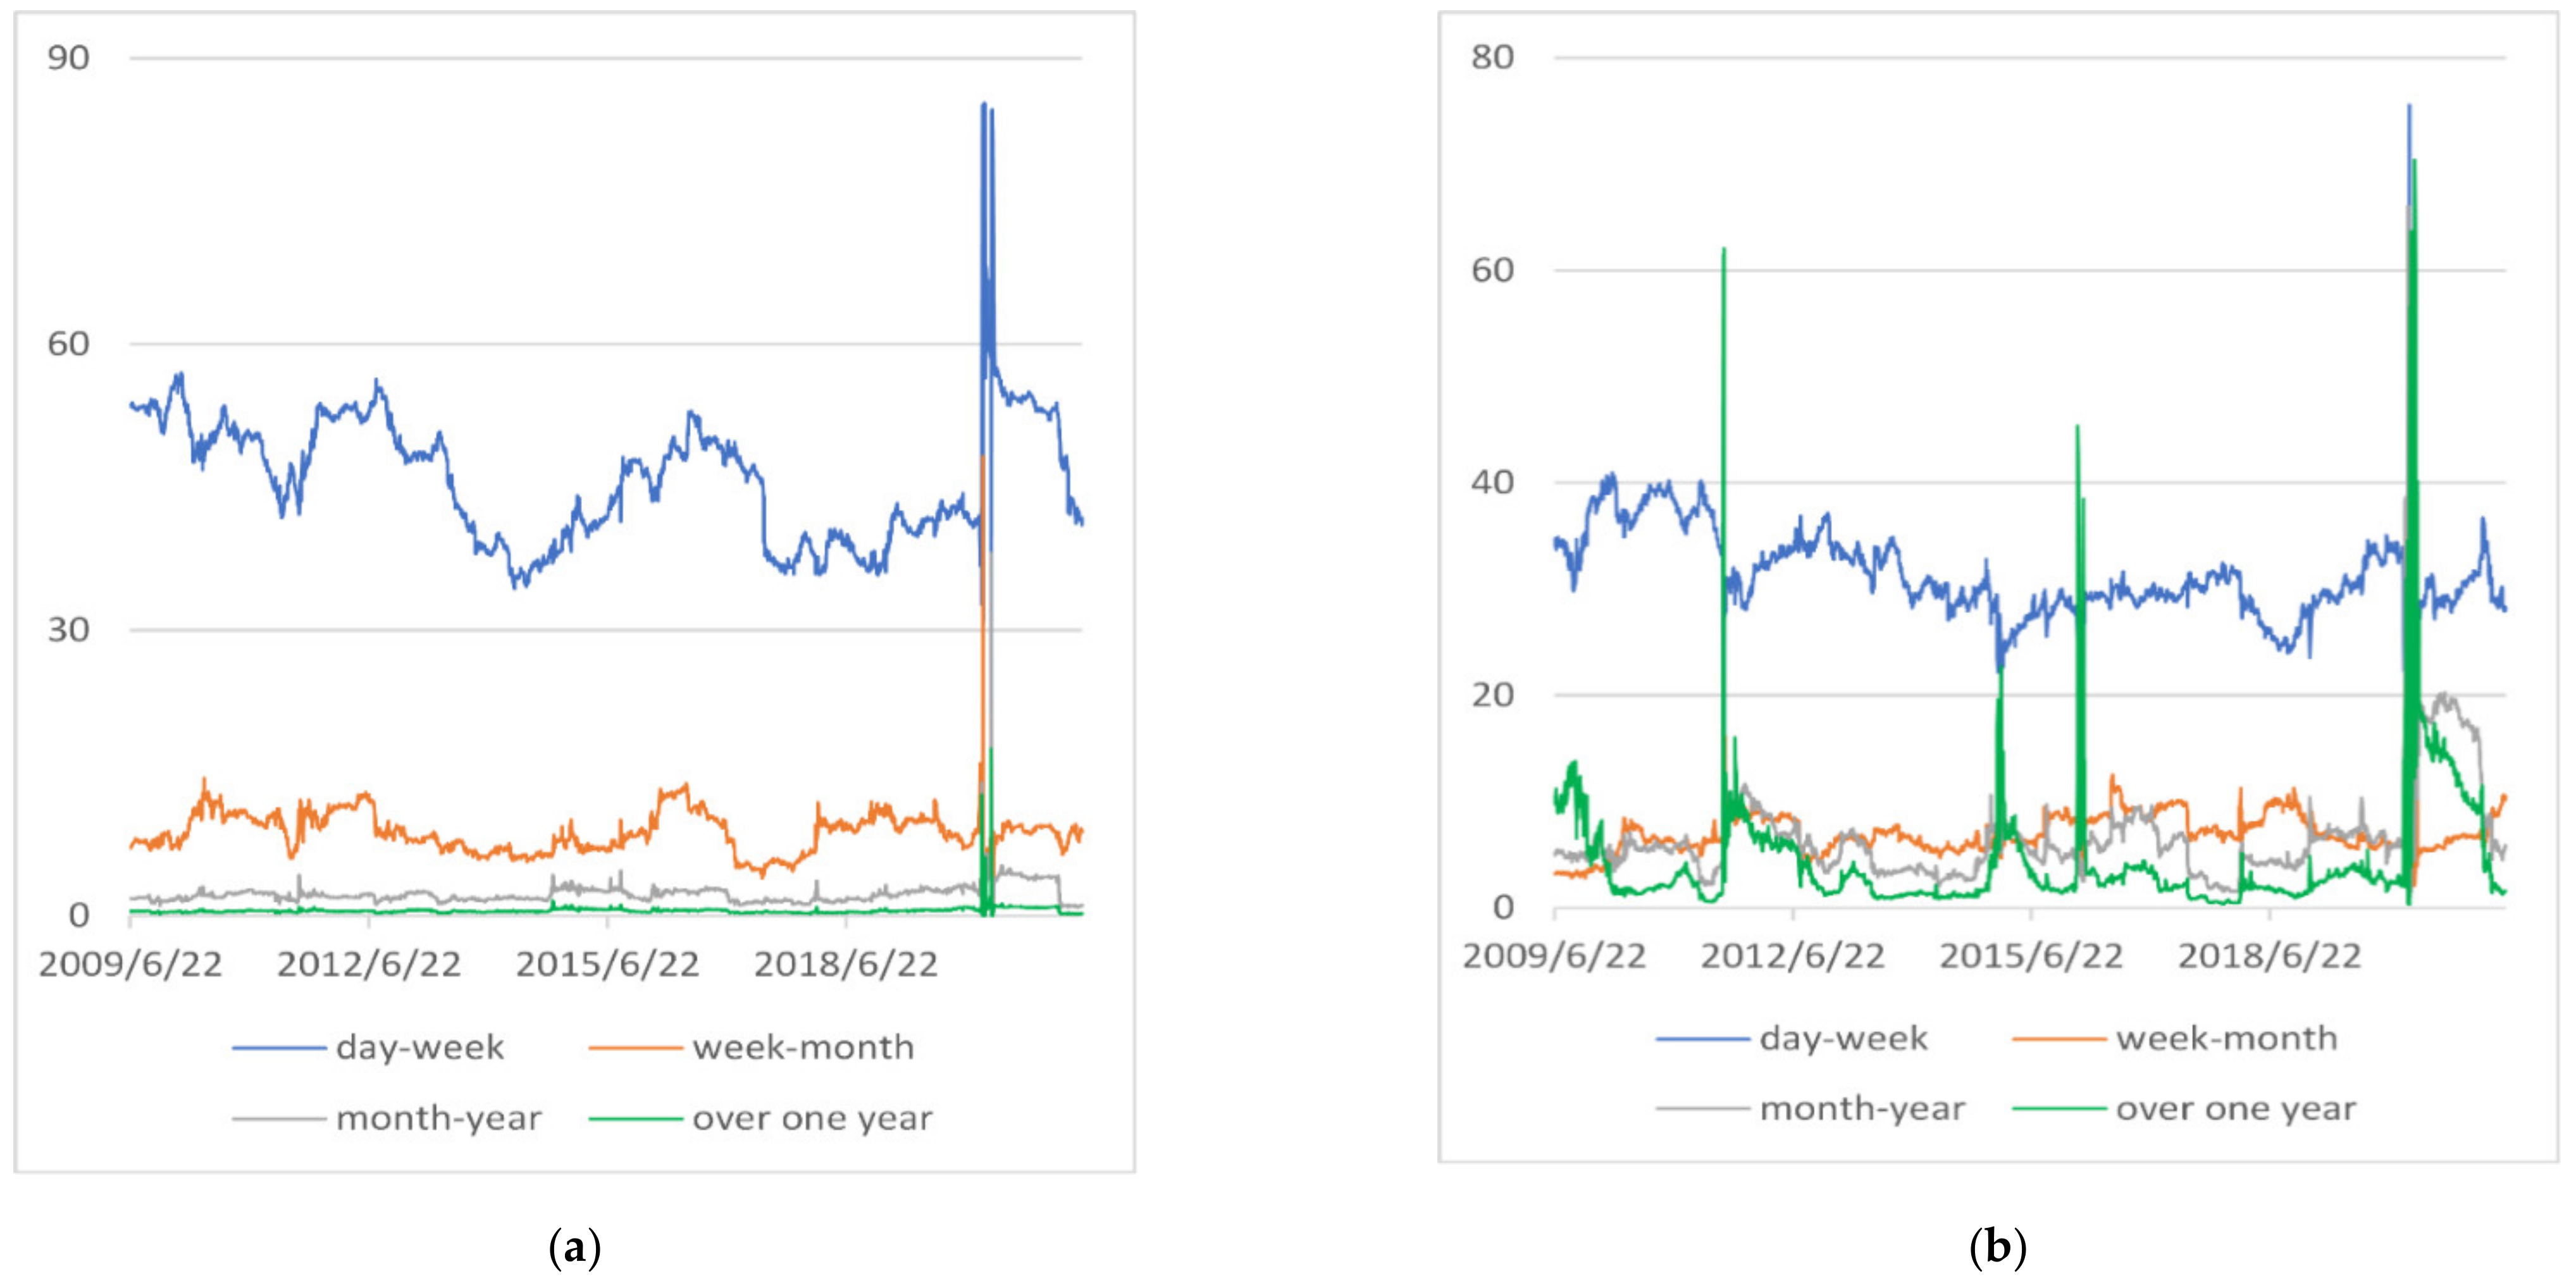
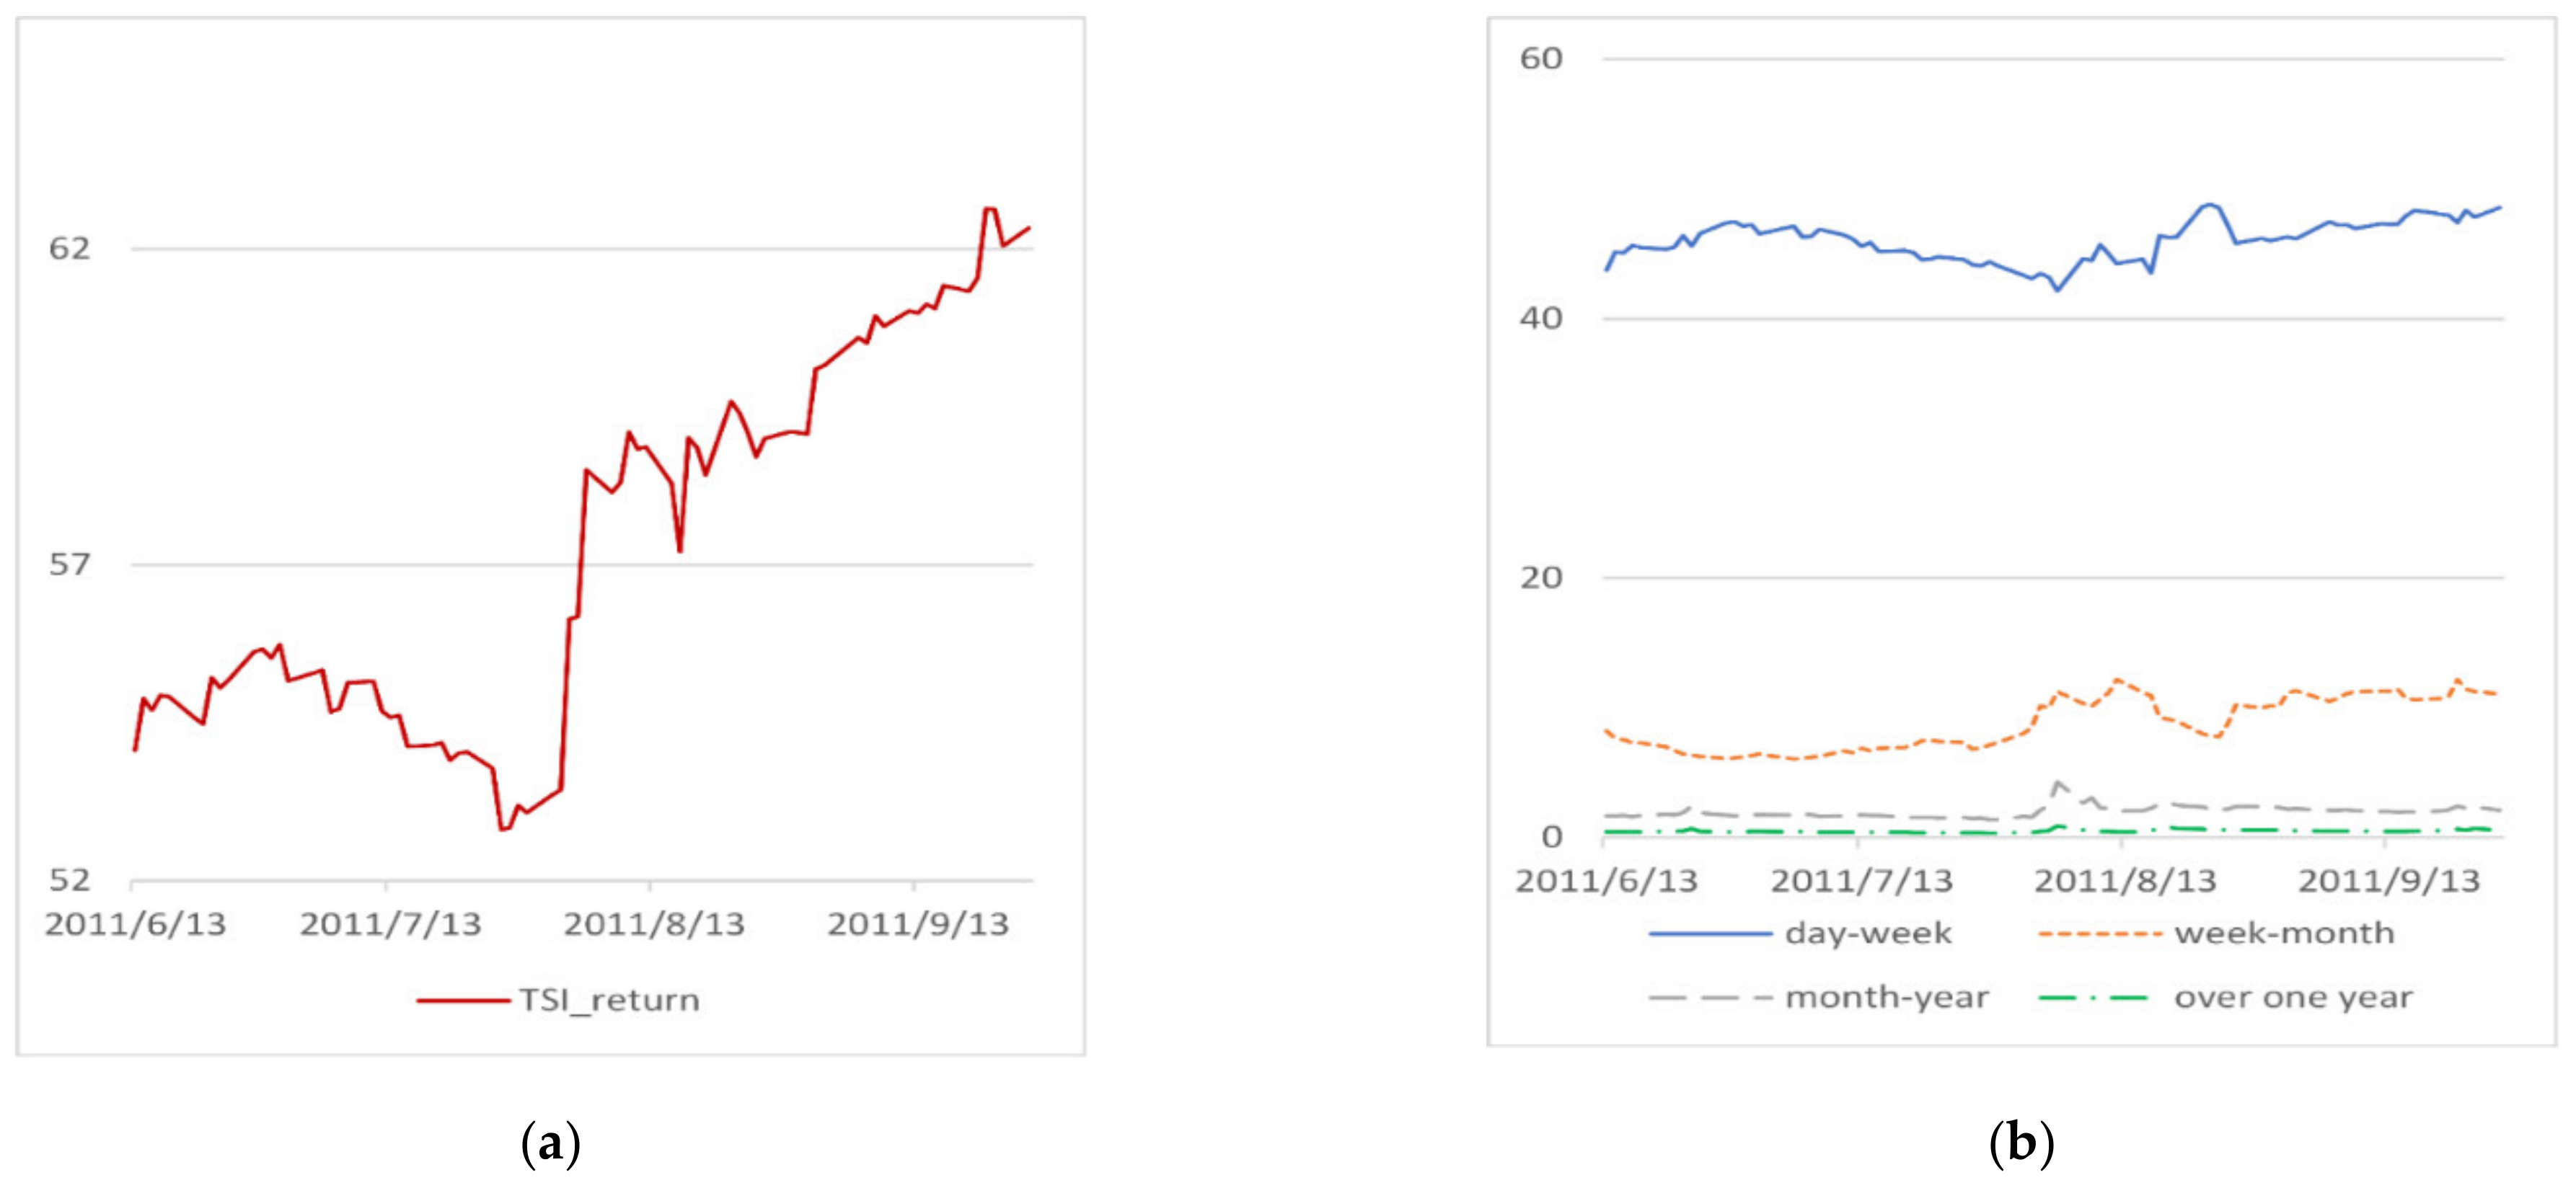
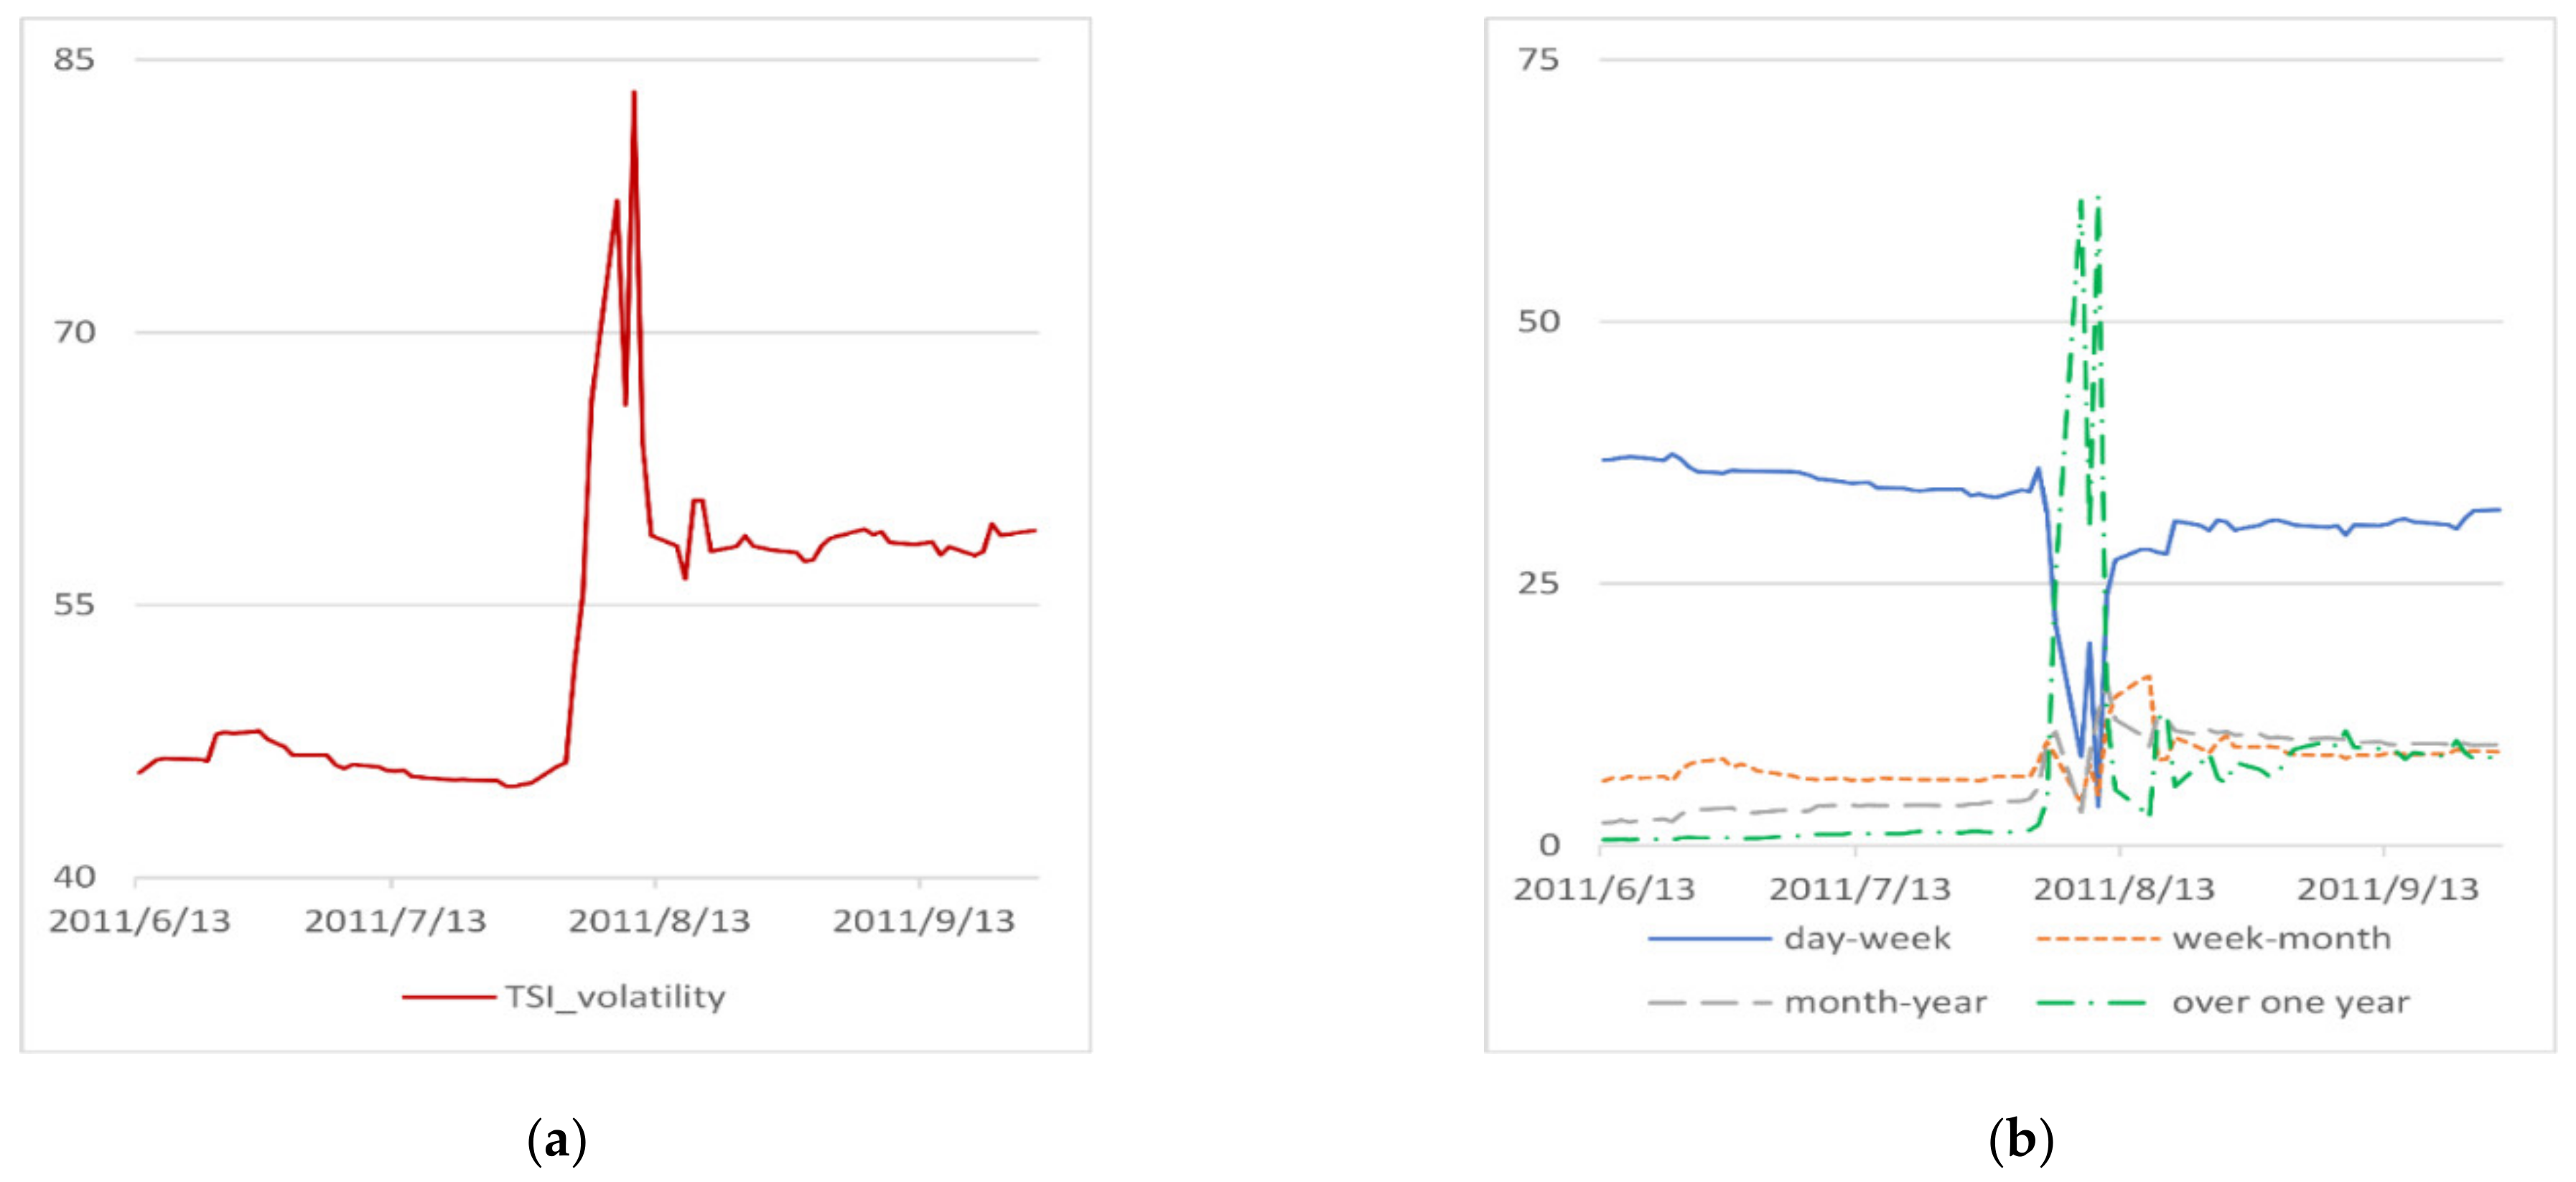
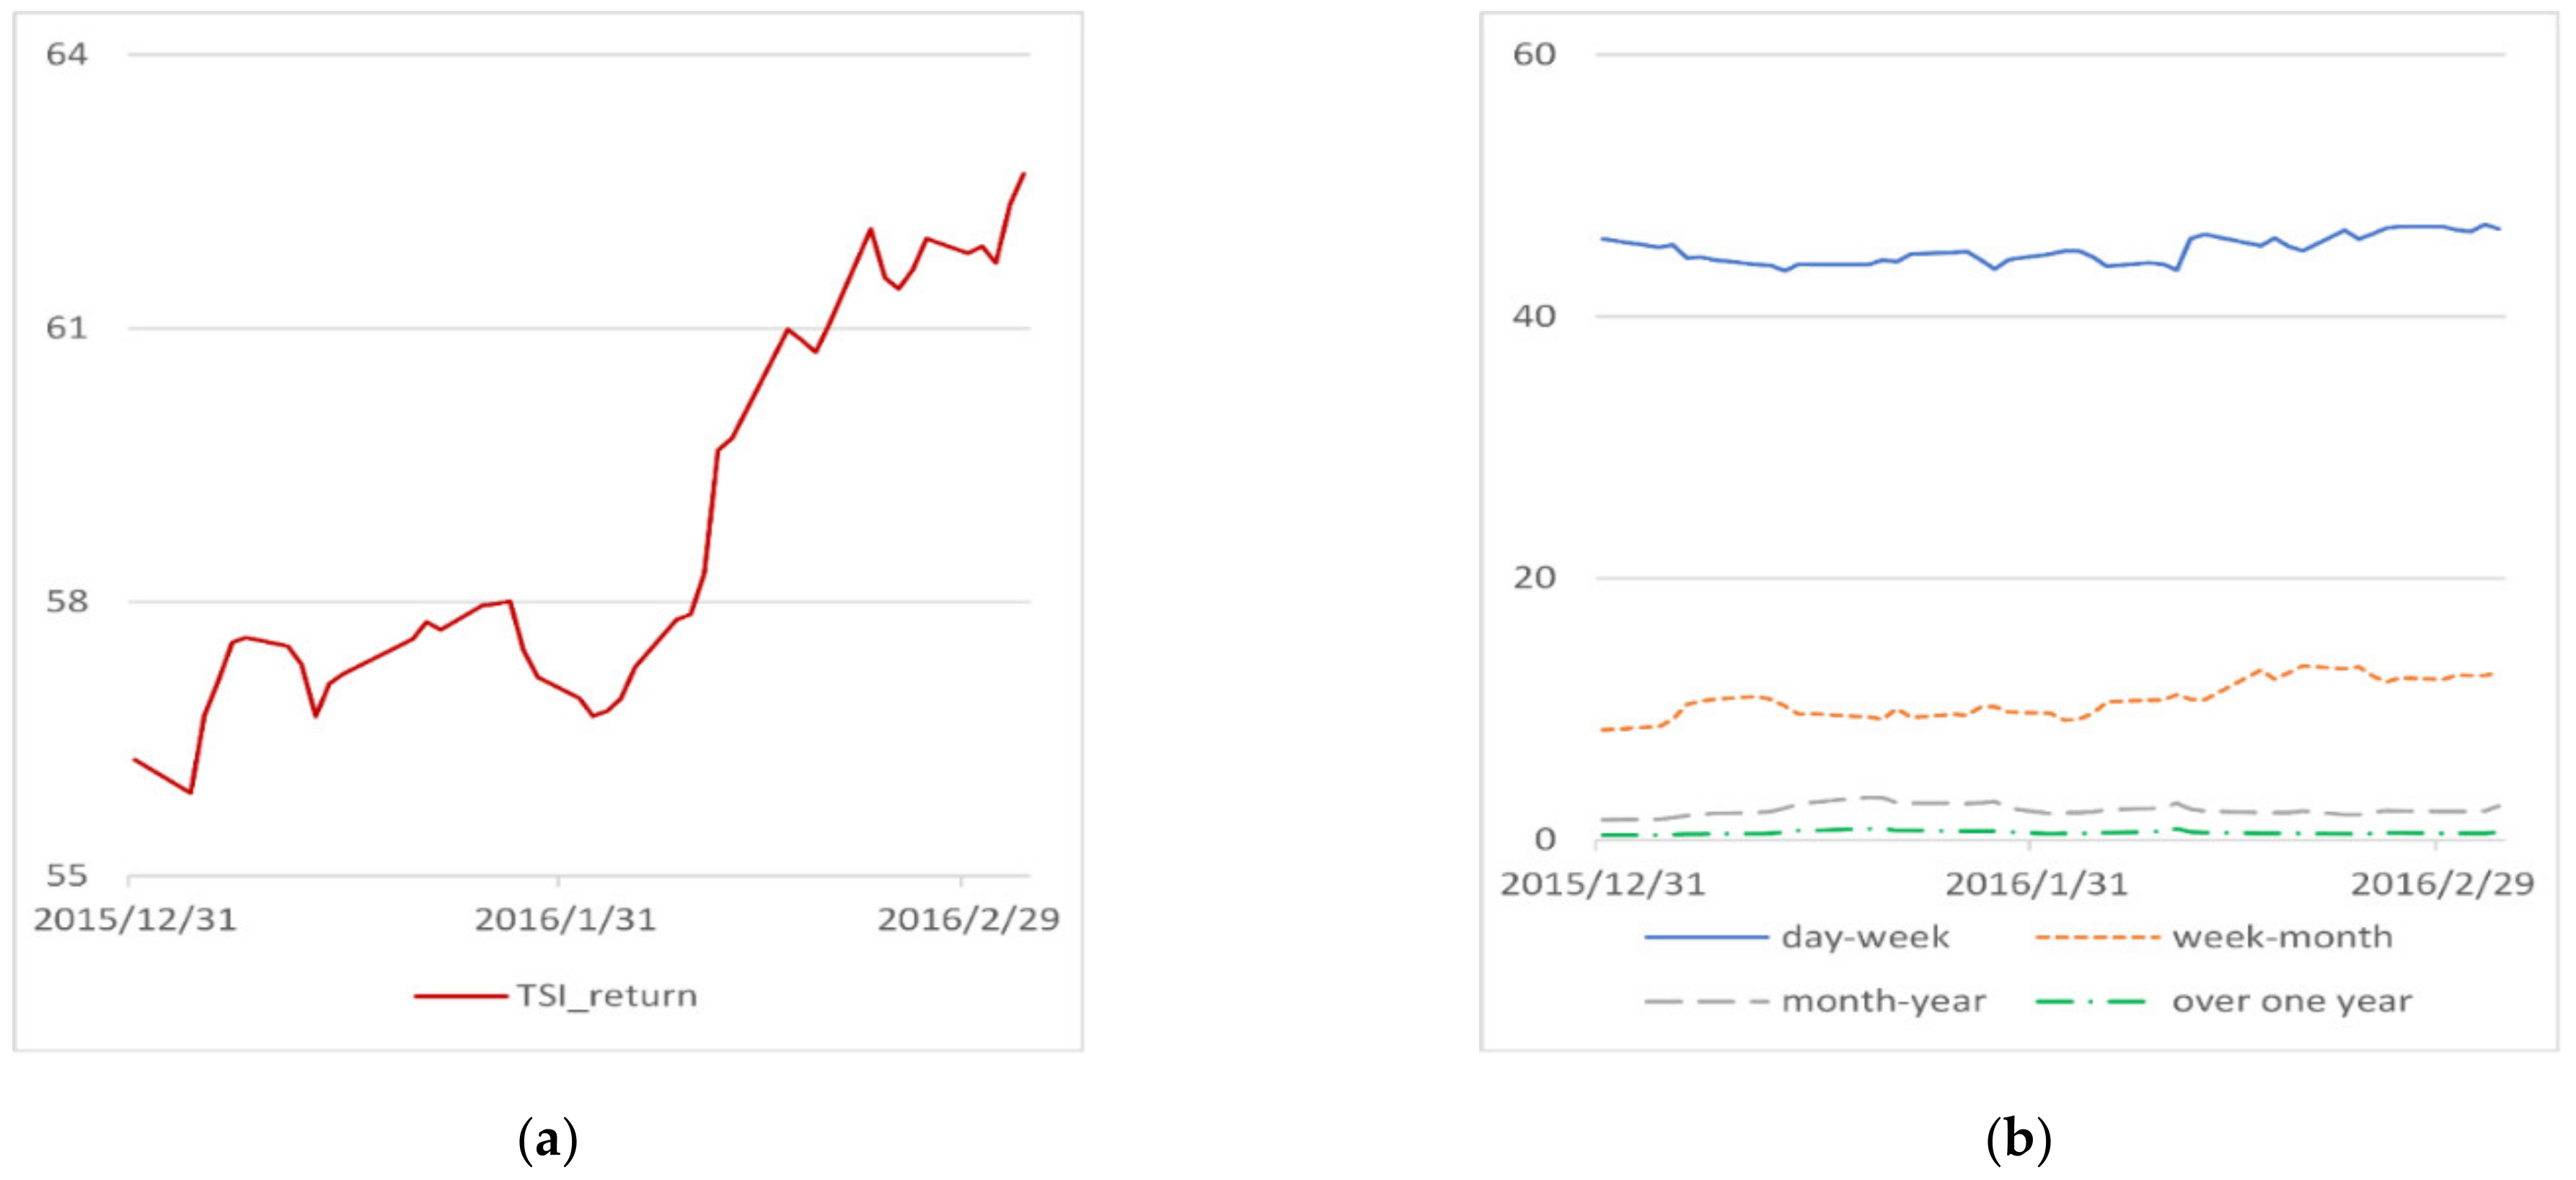
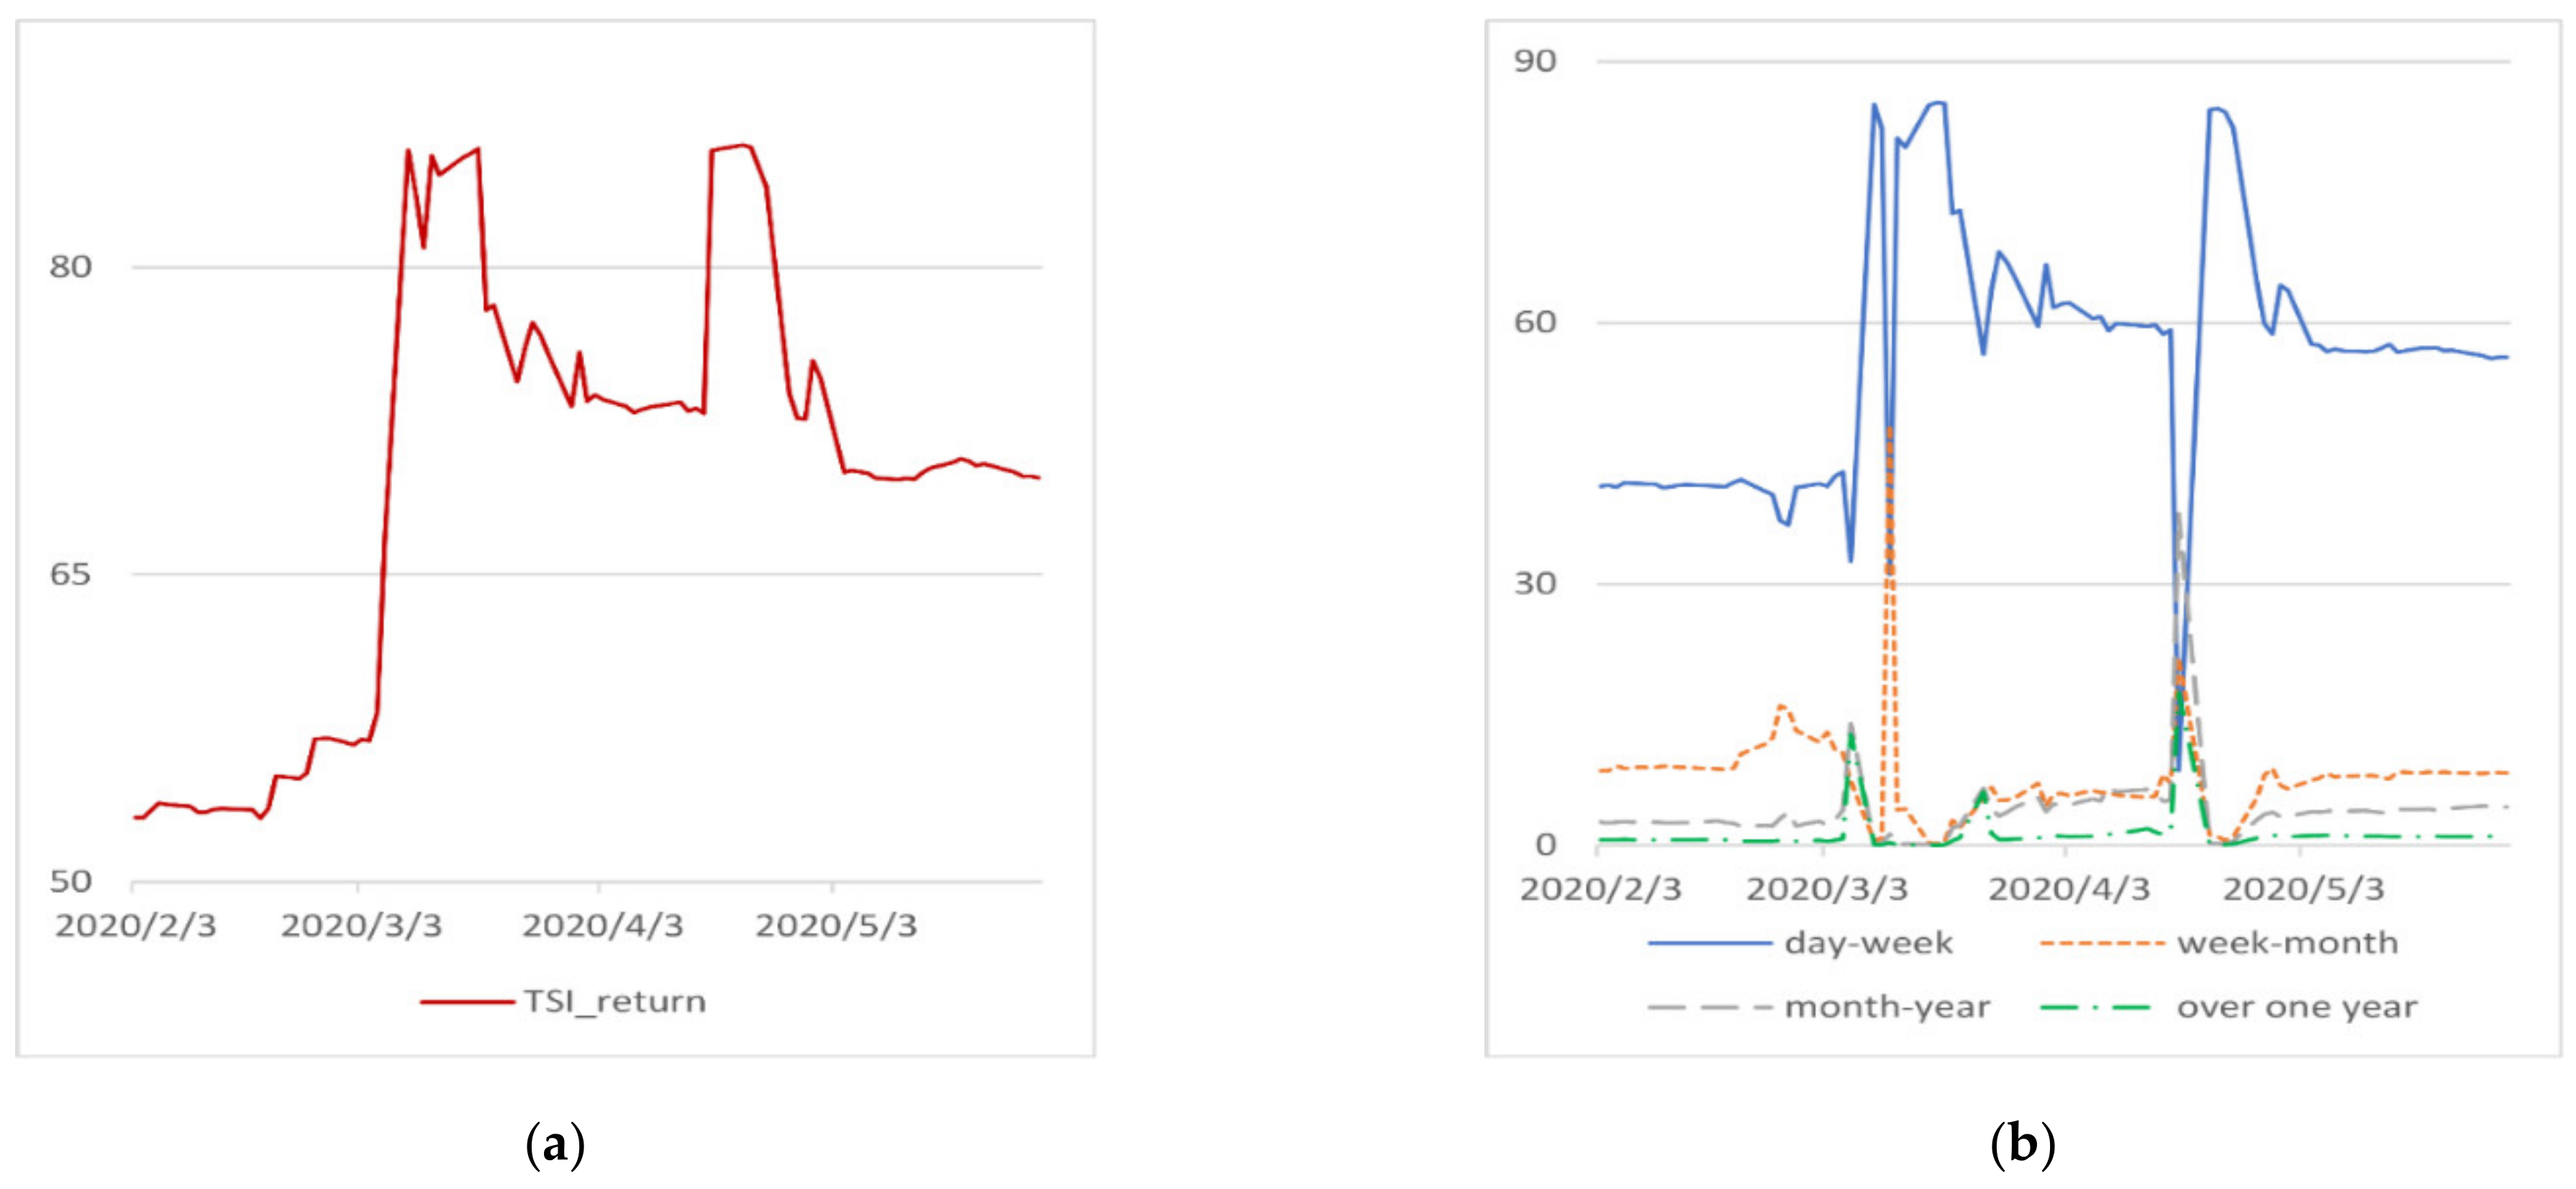
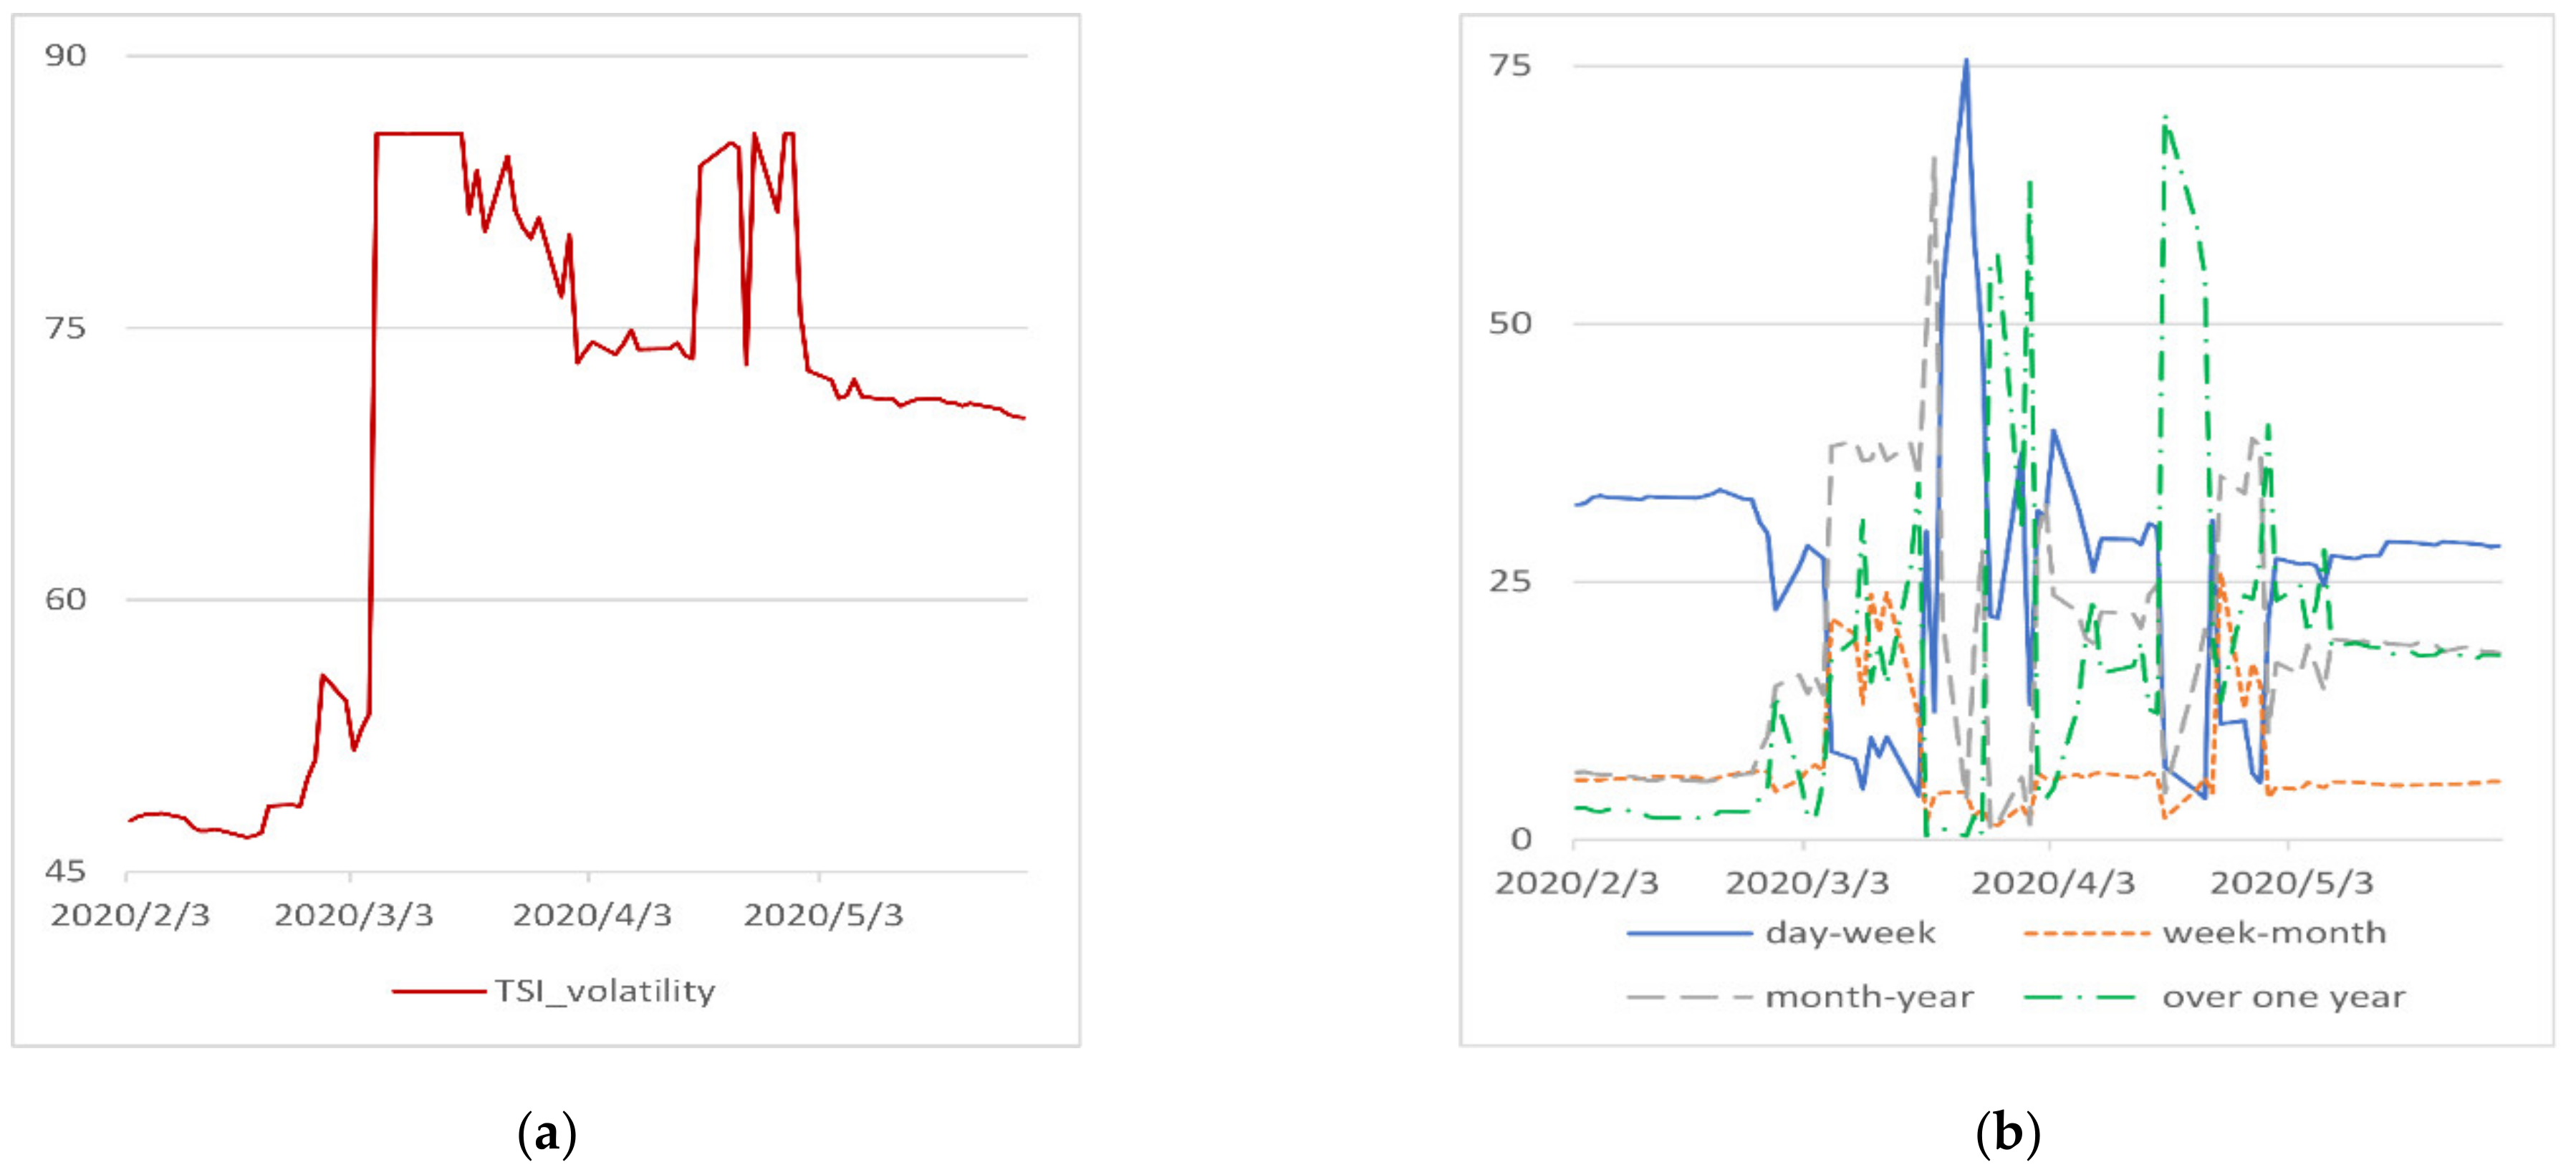
4.2.1. Total Return and Volatility Connectedness
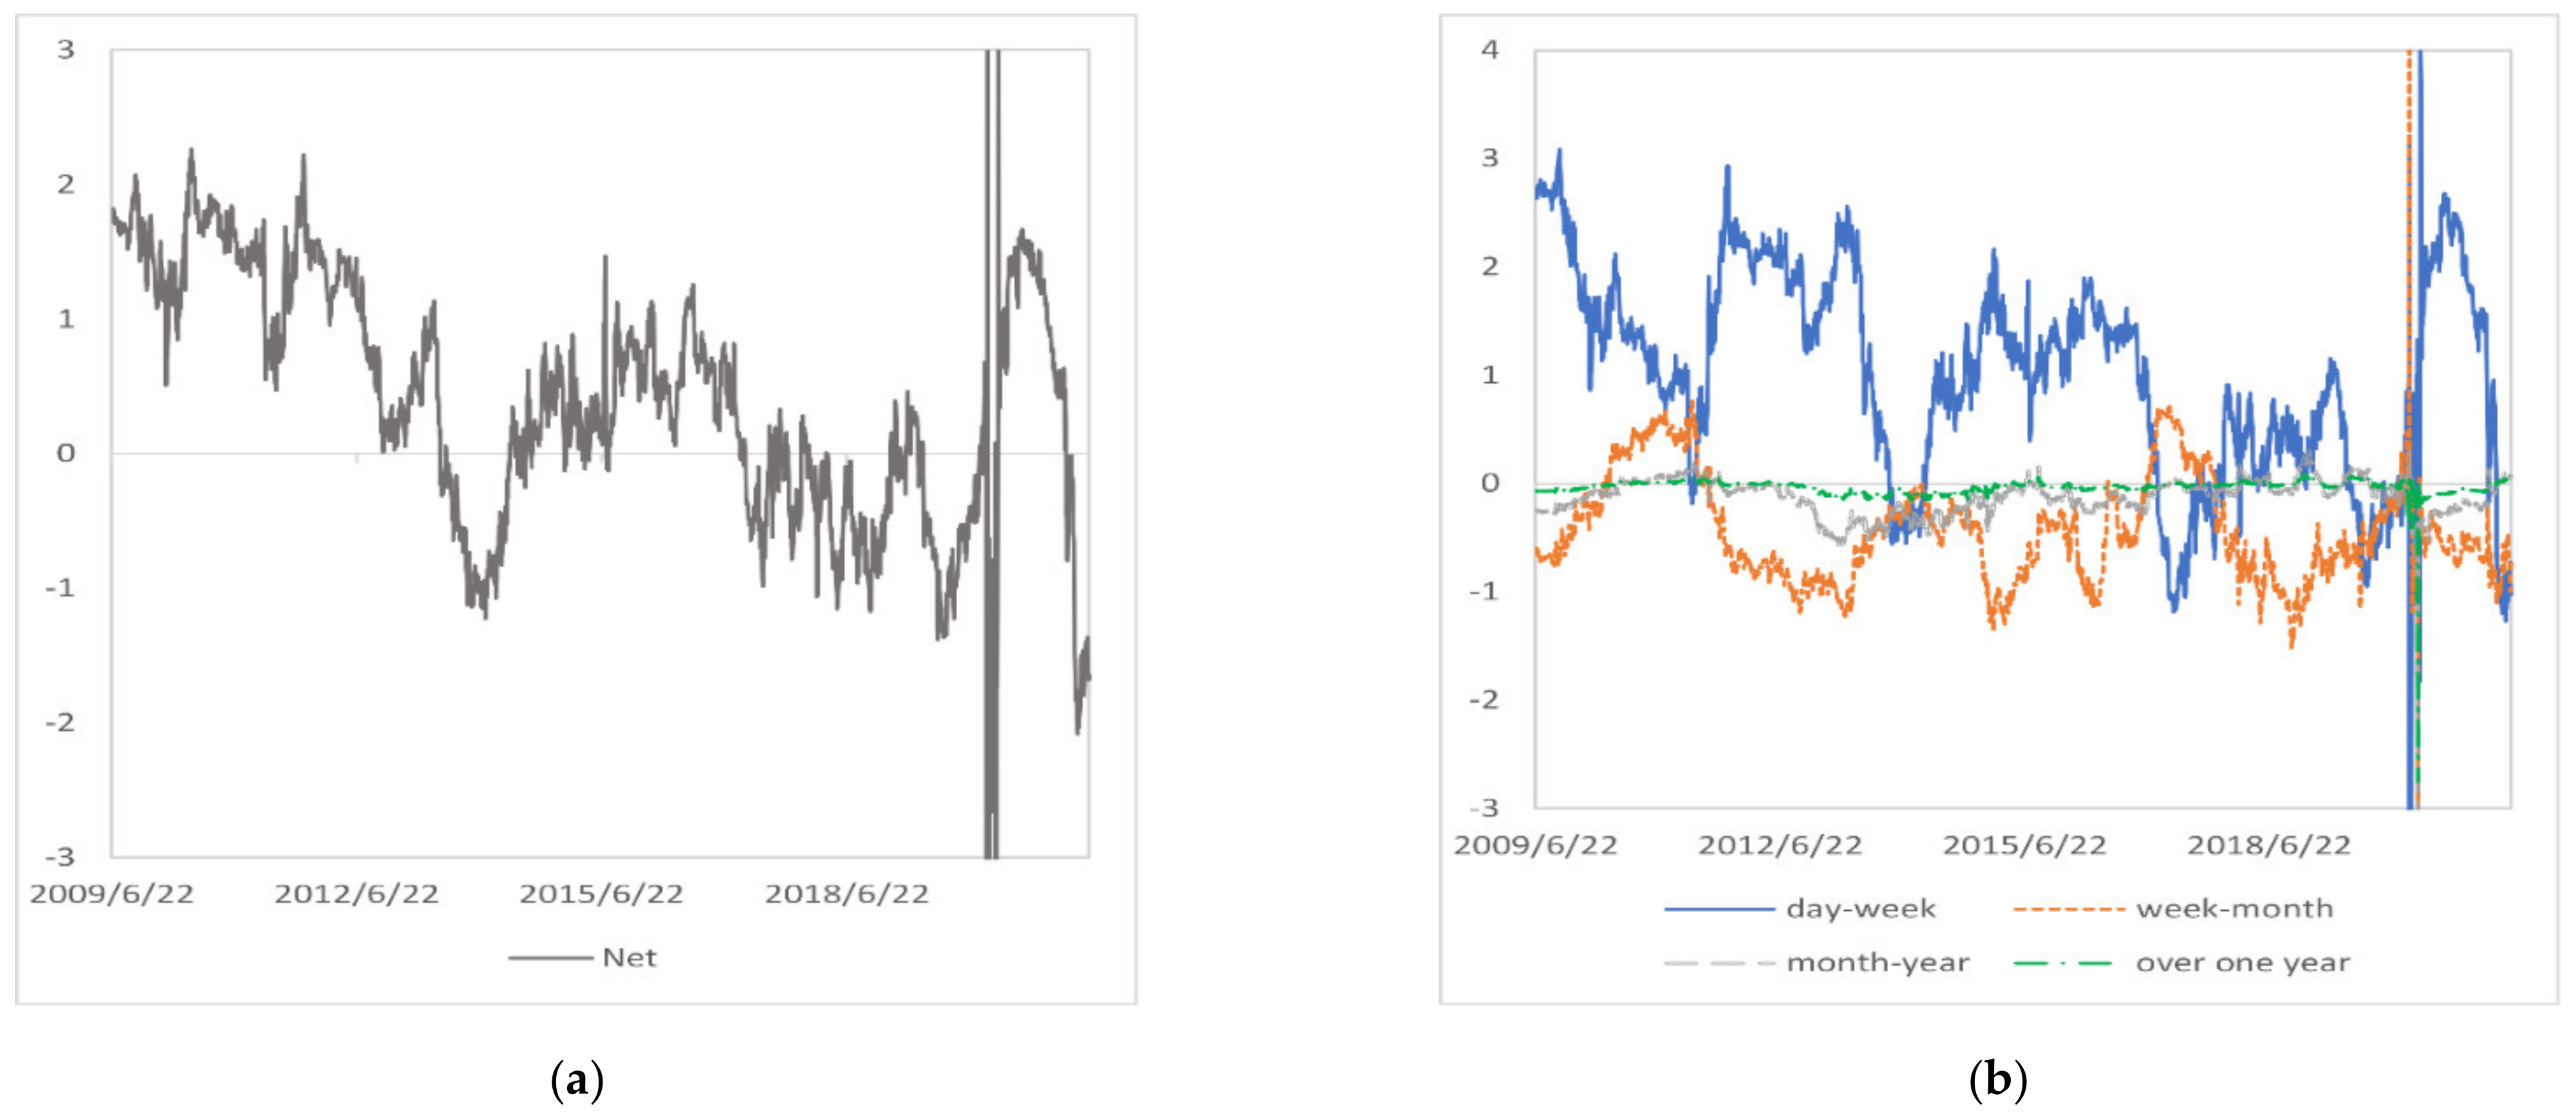
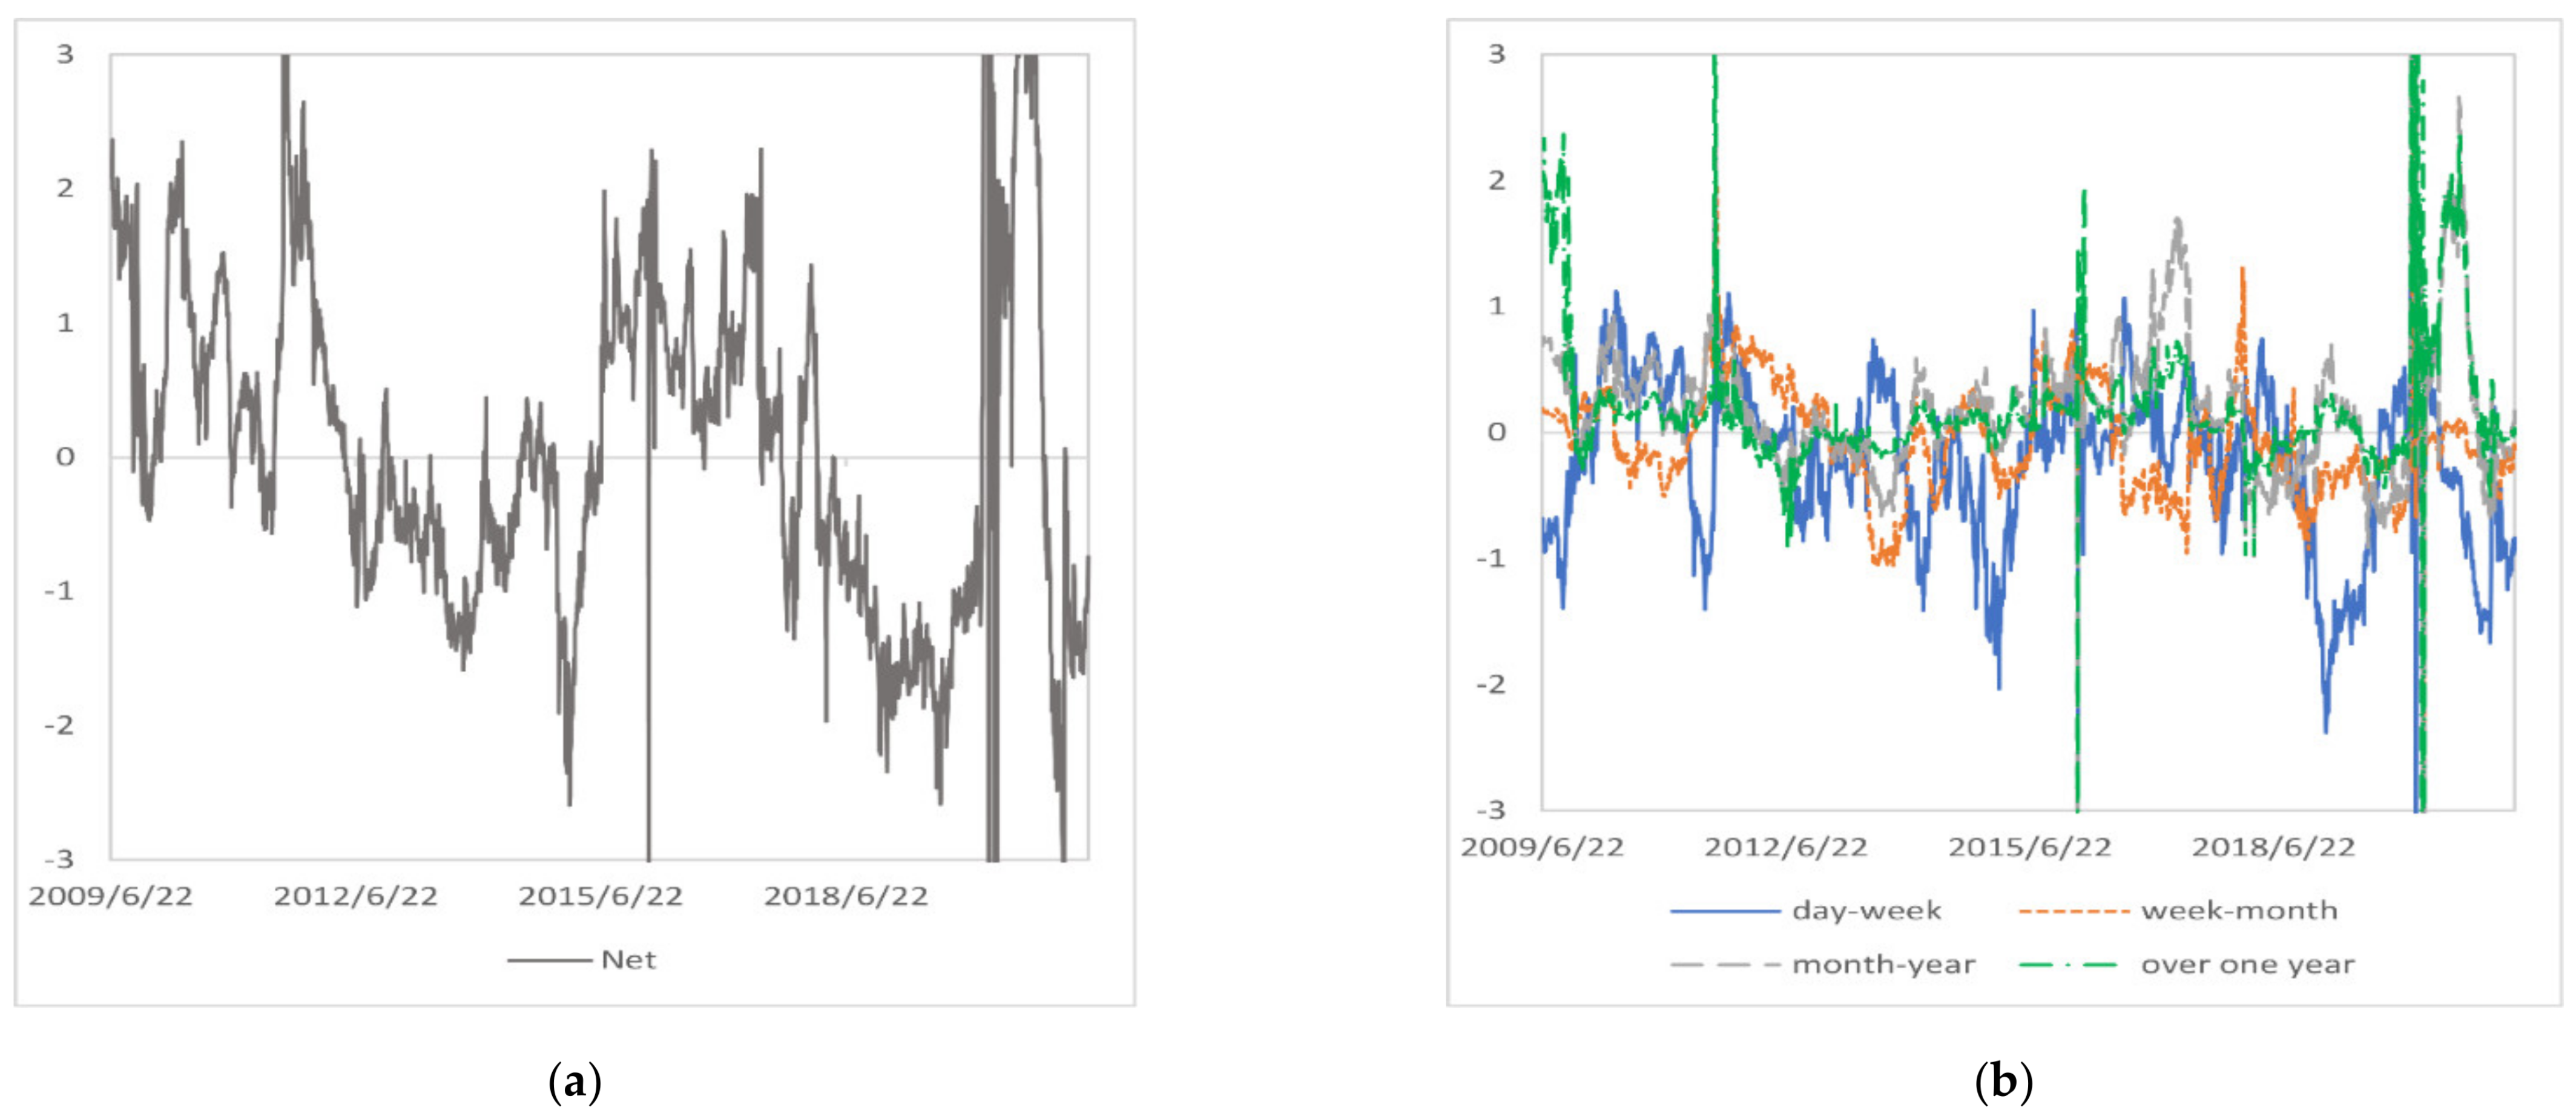
4.2.2. Net Directional Return and Volatility Connectedness
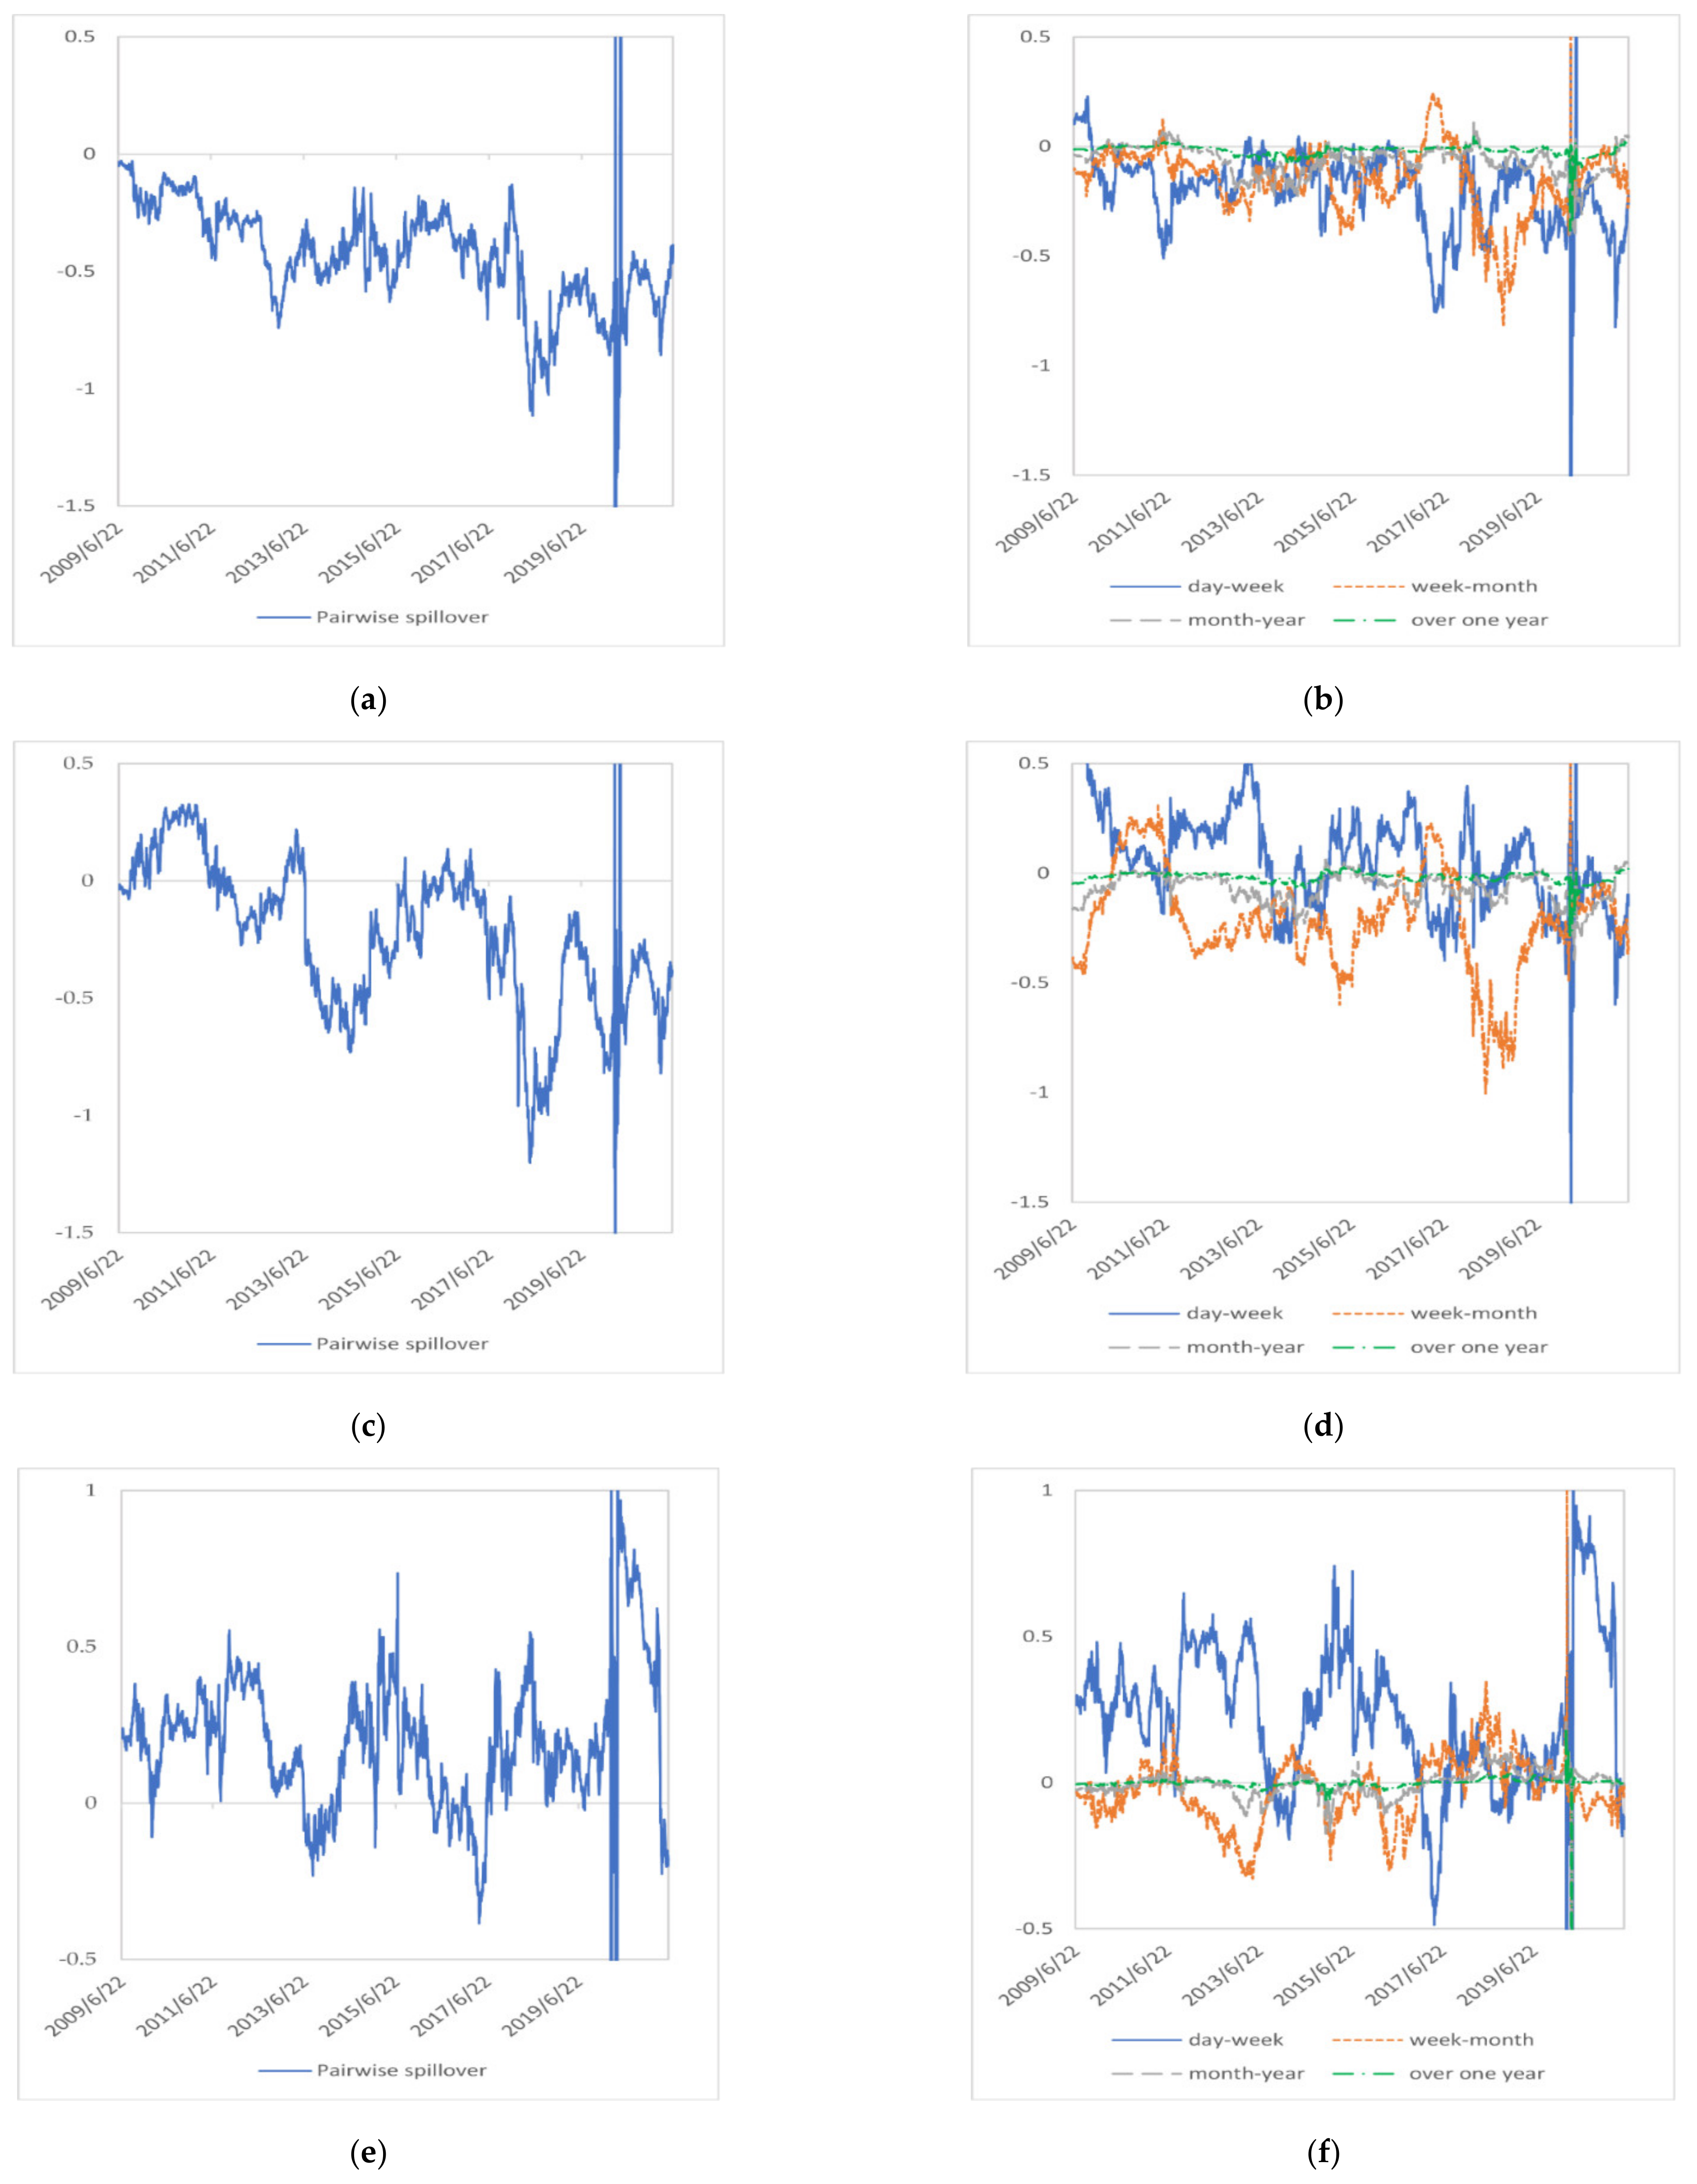
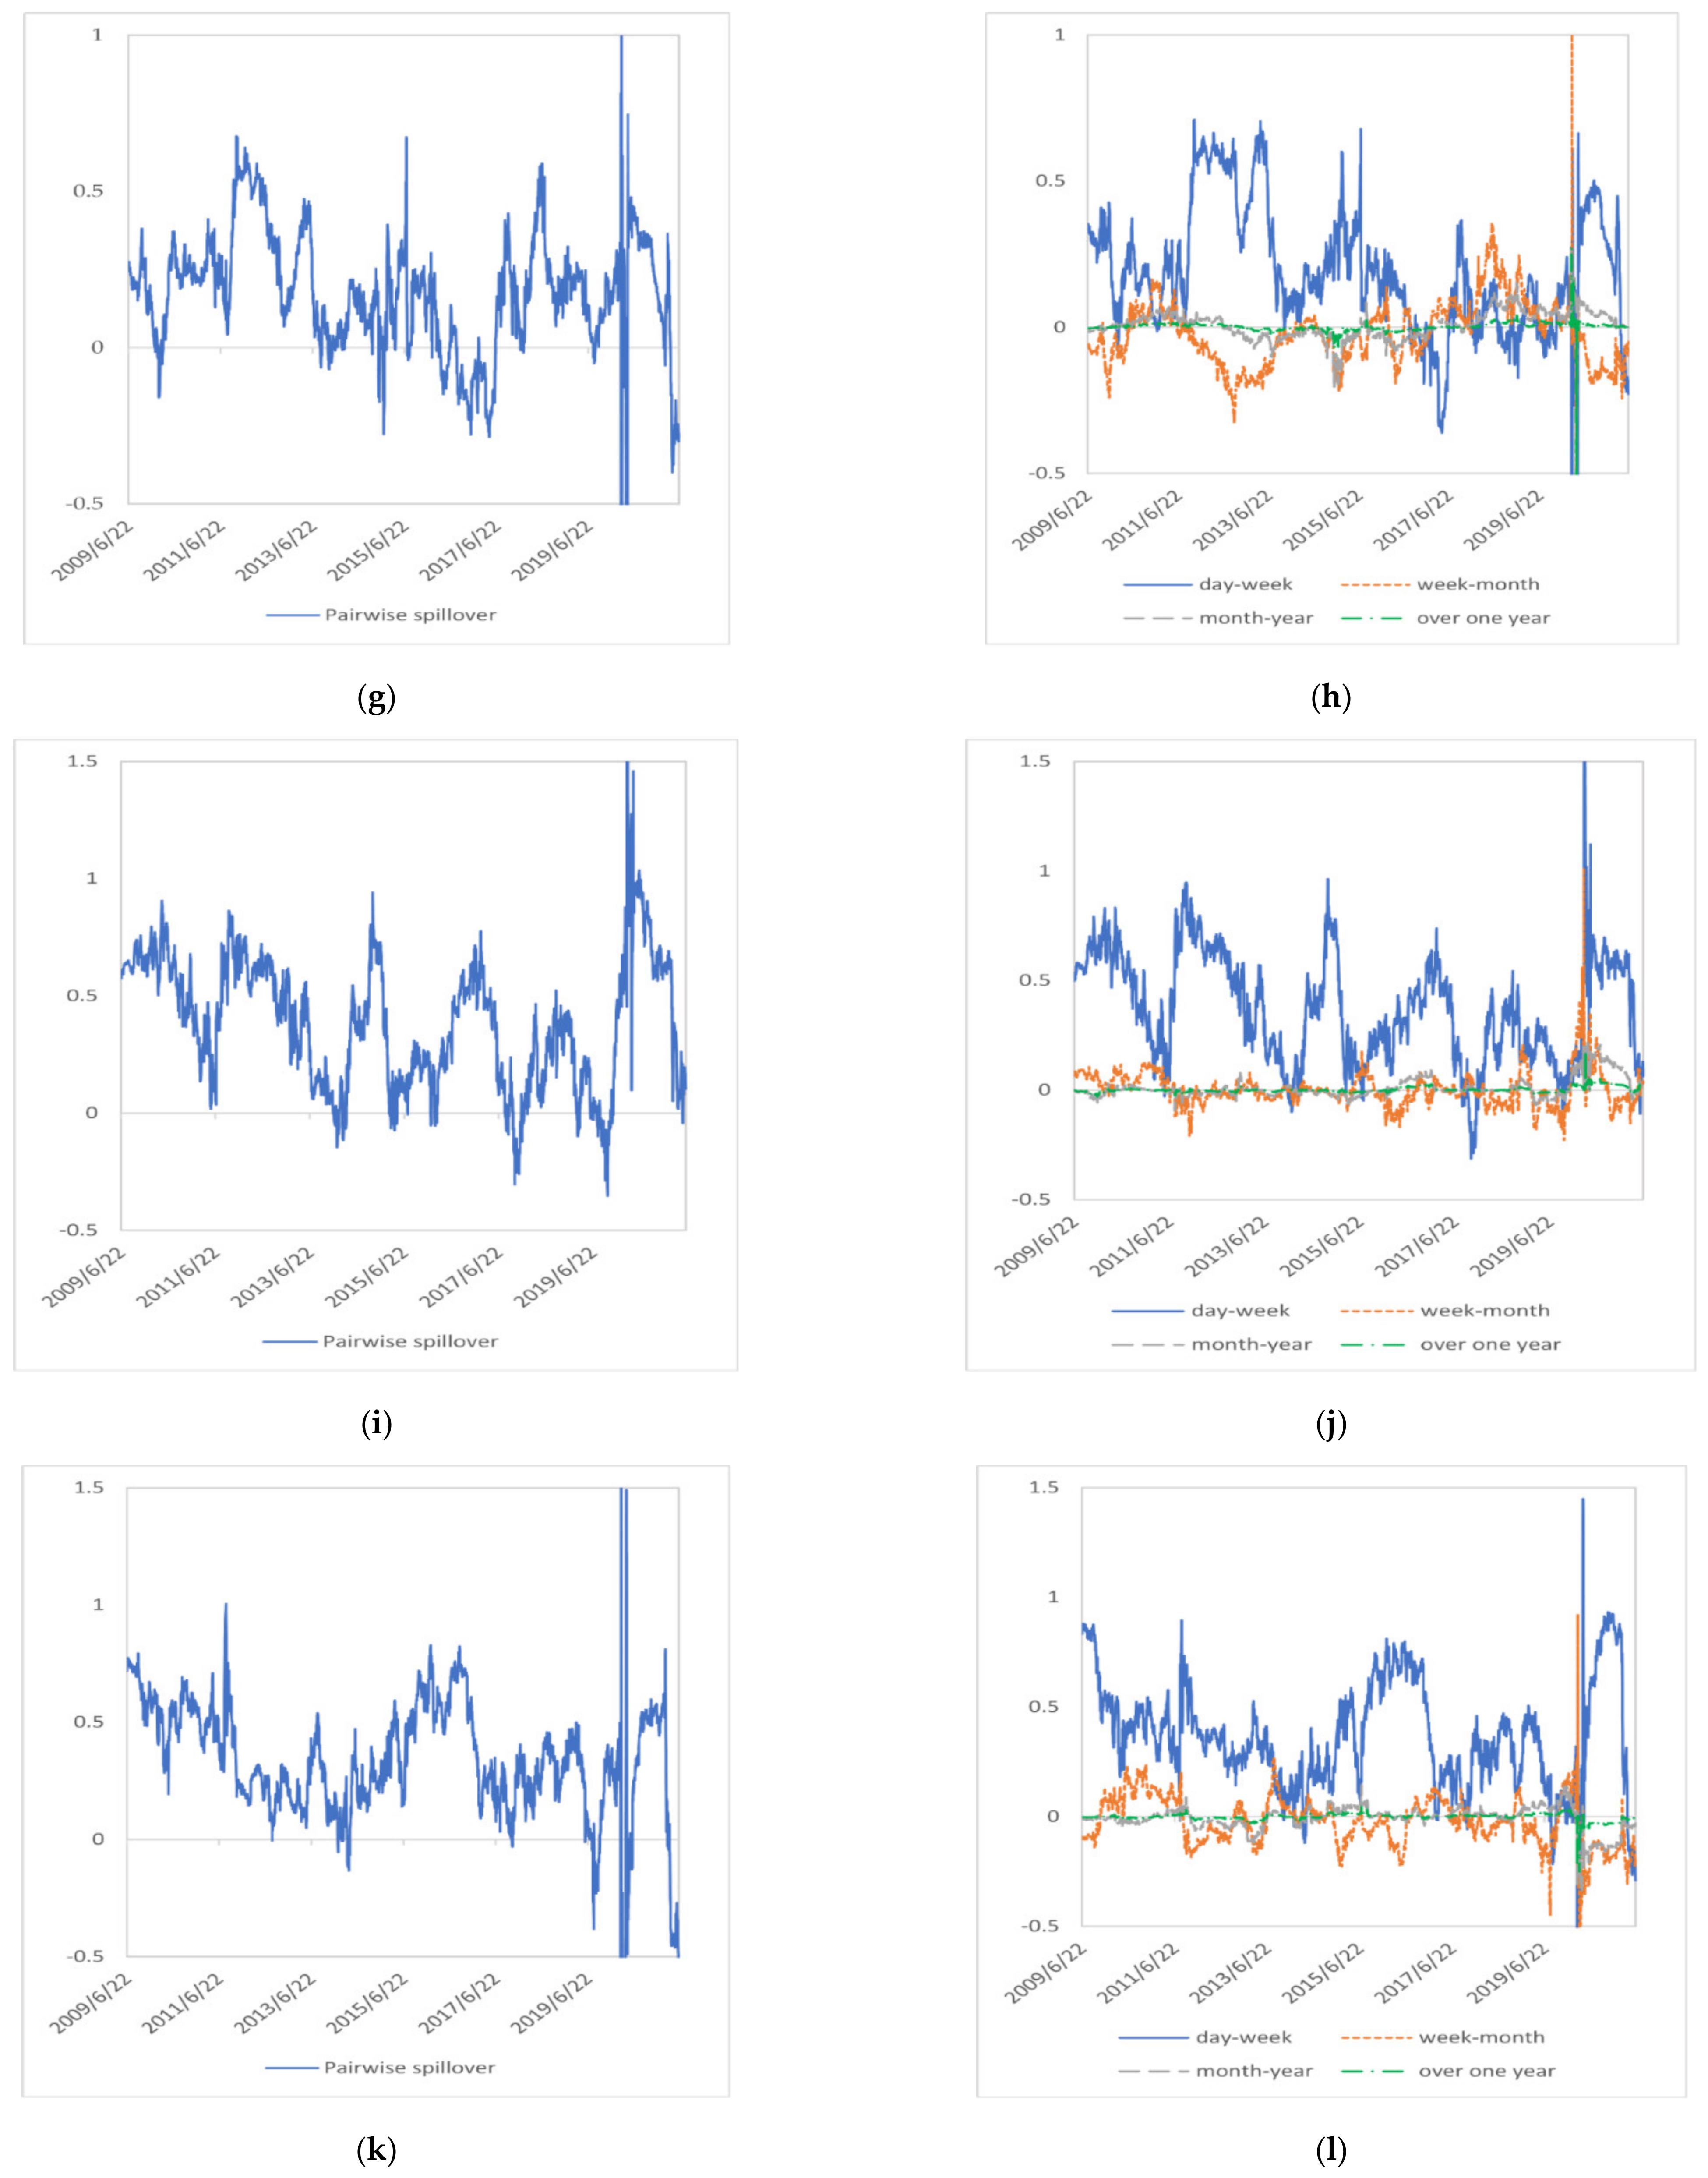
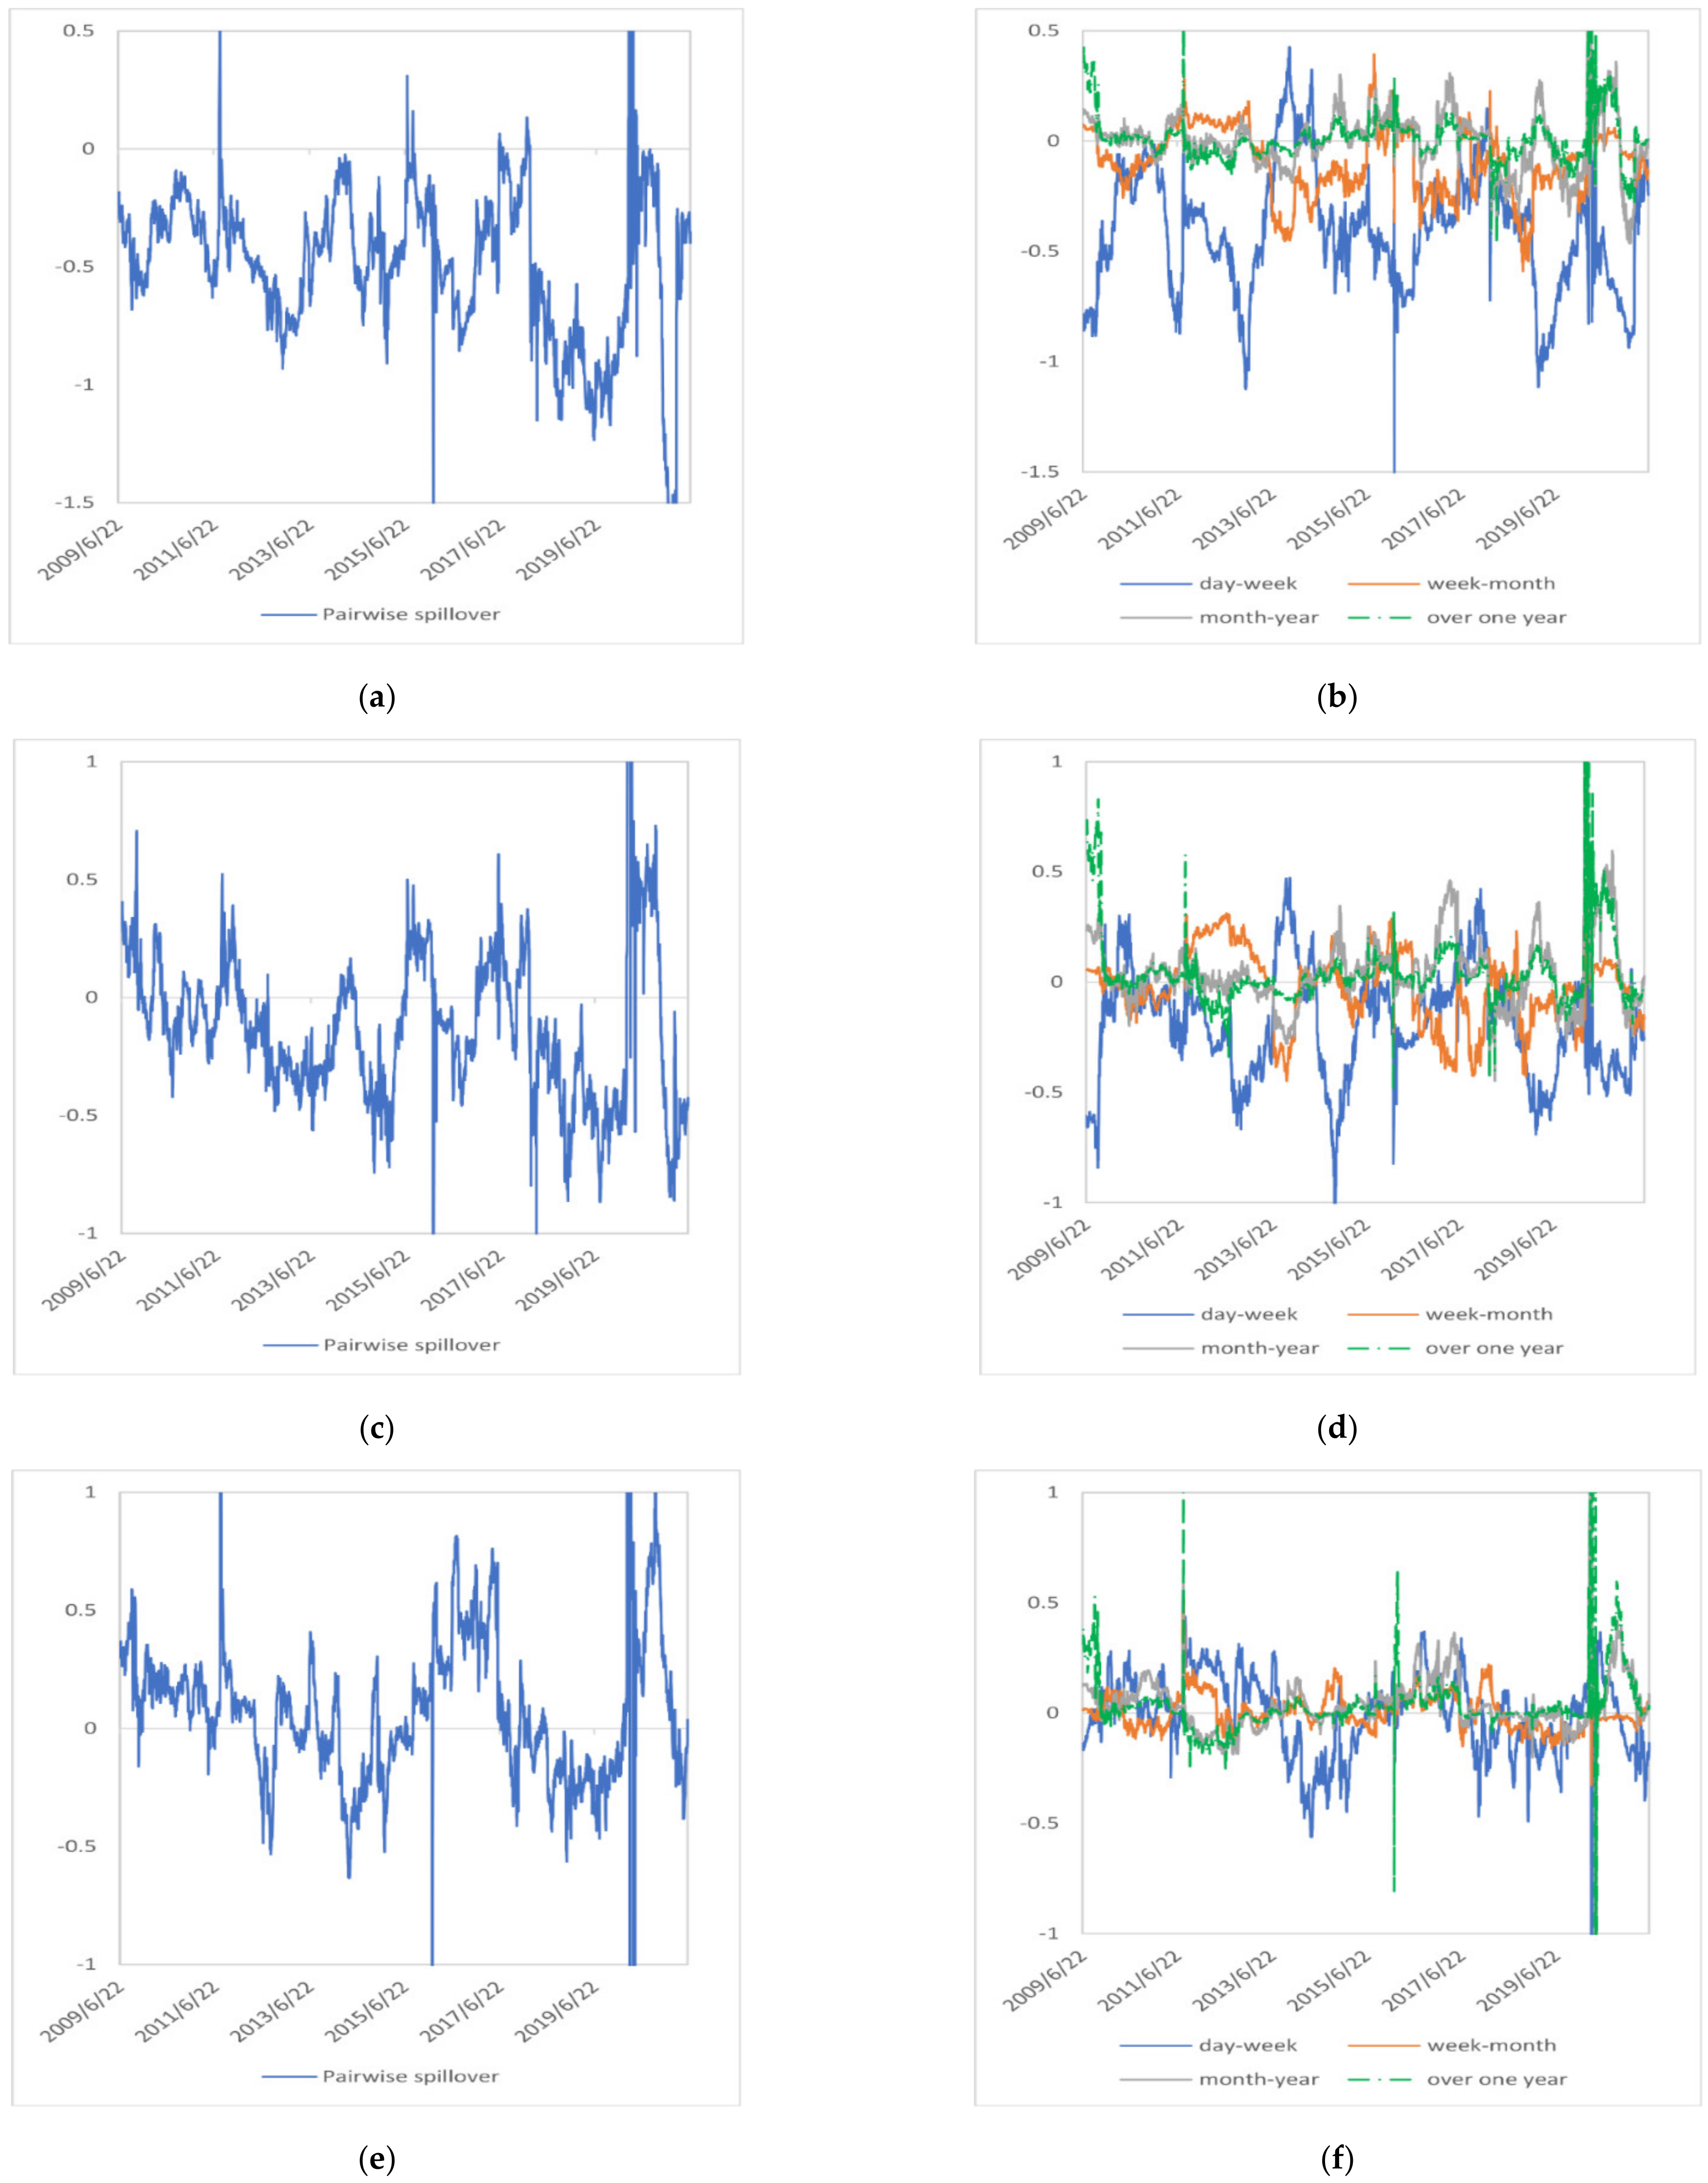
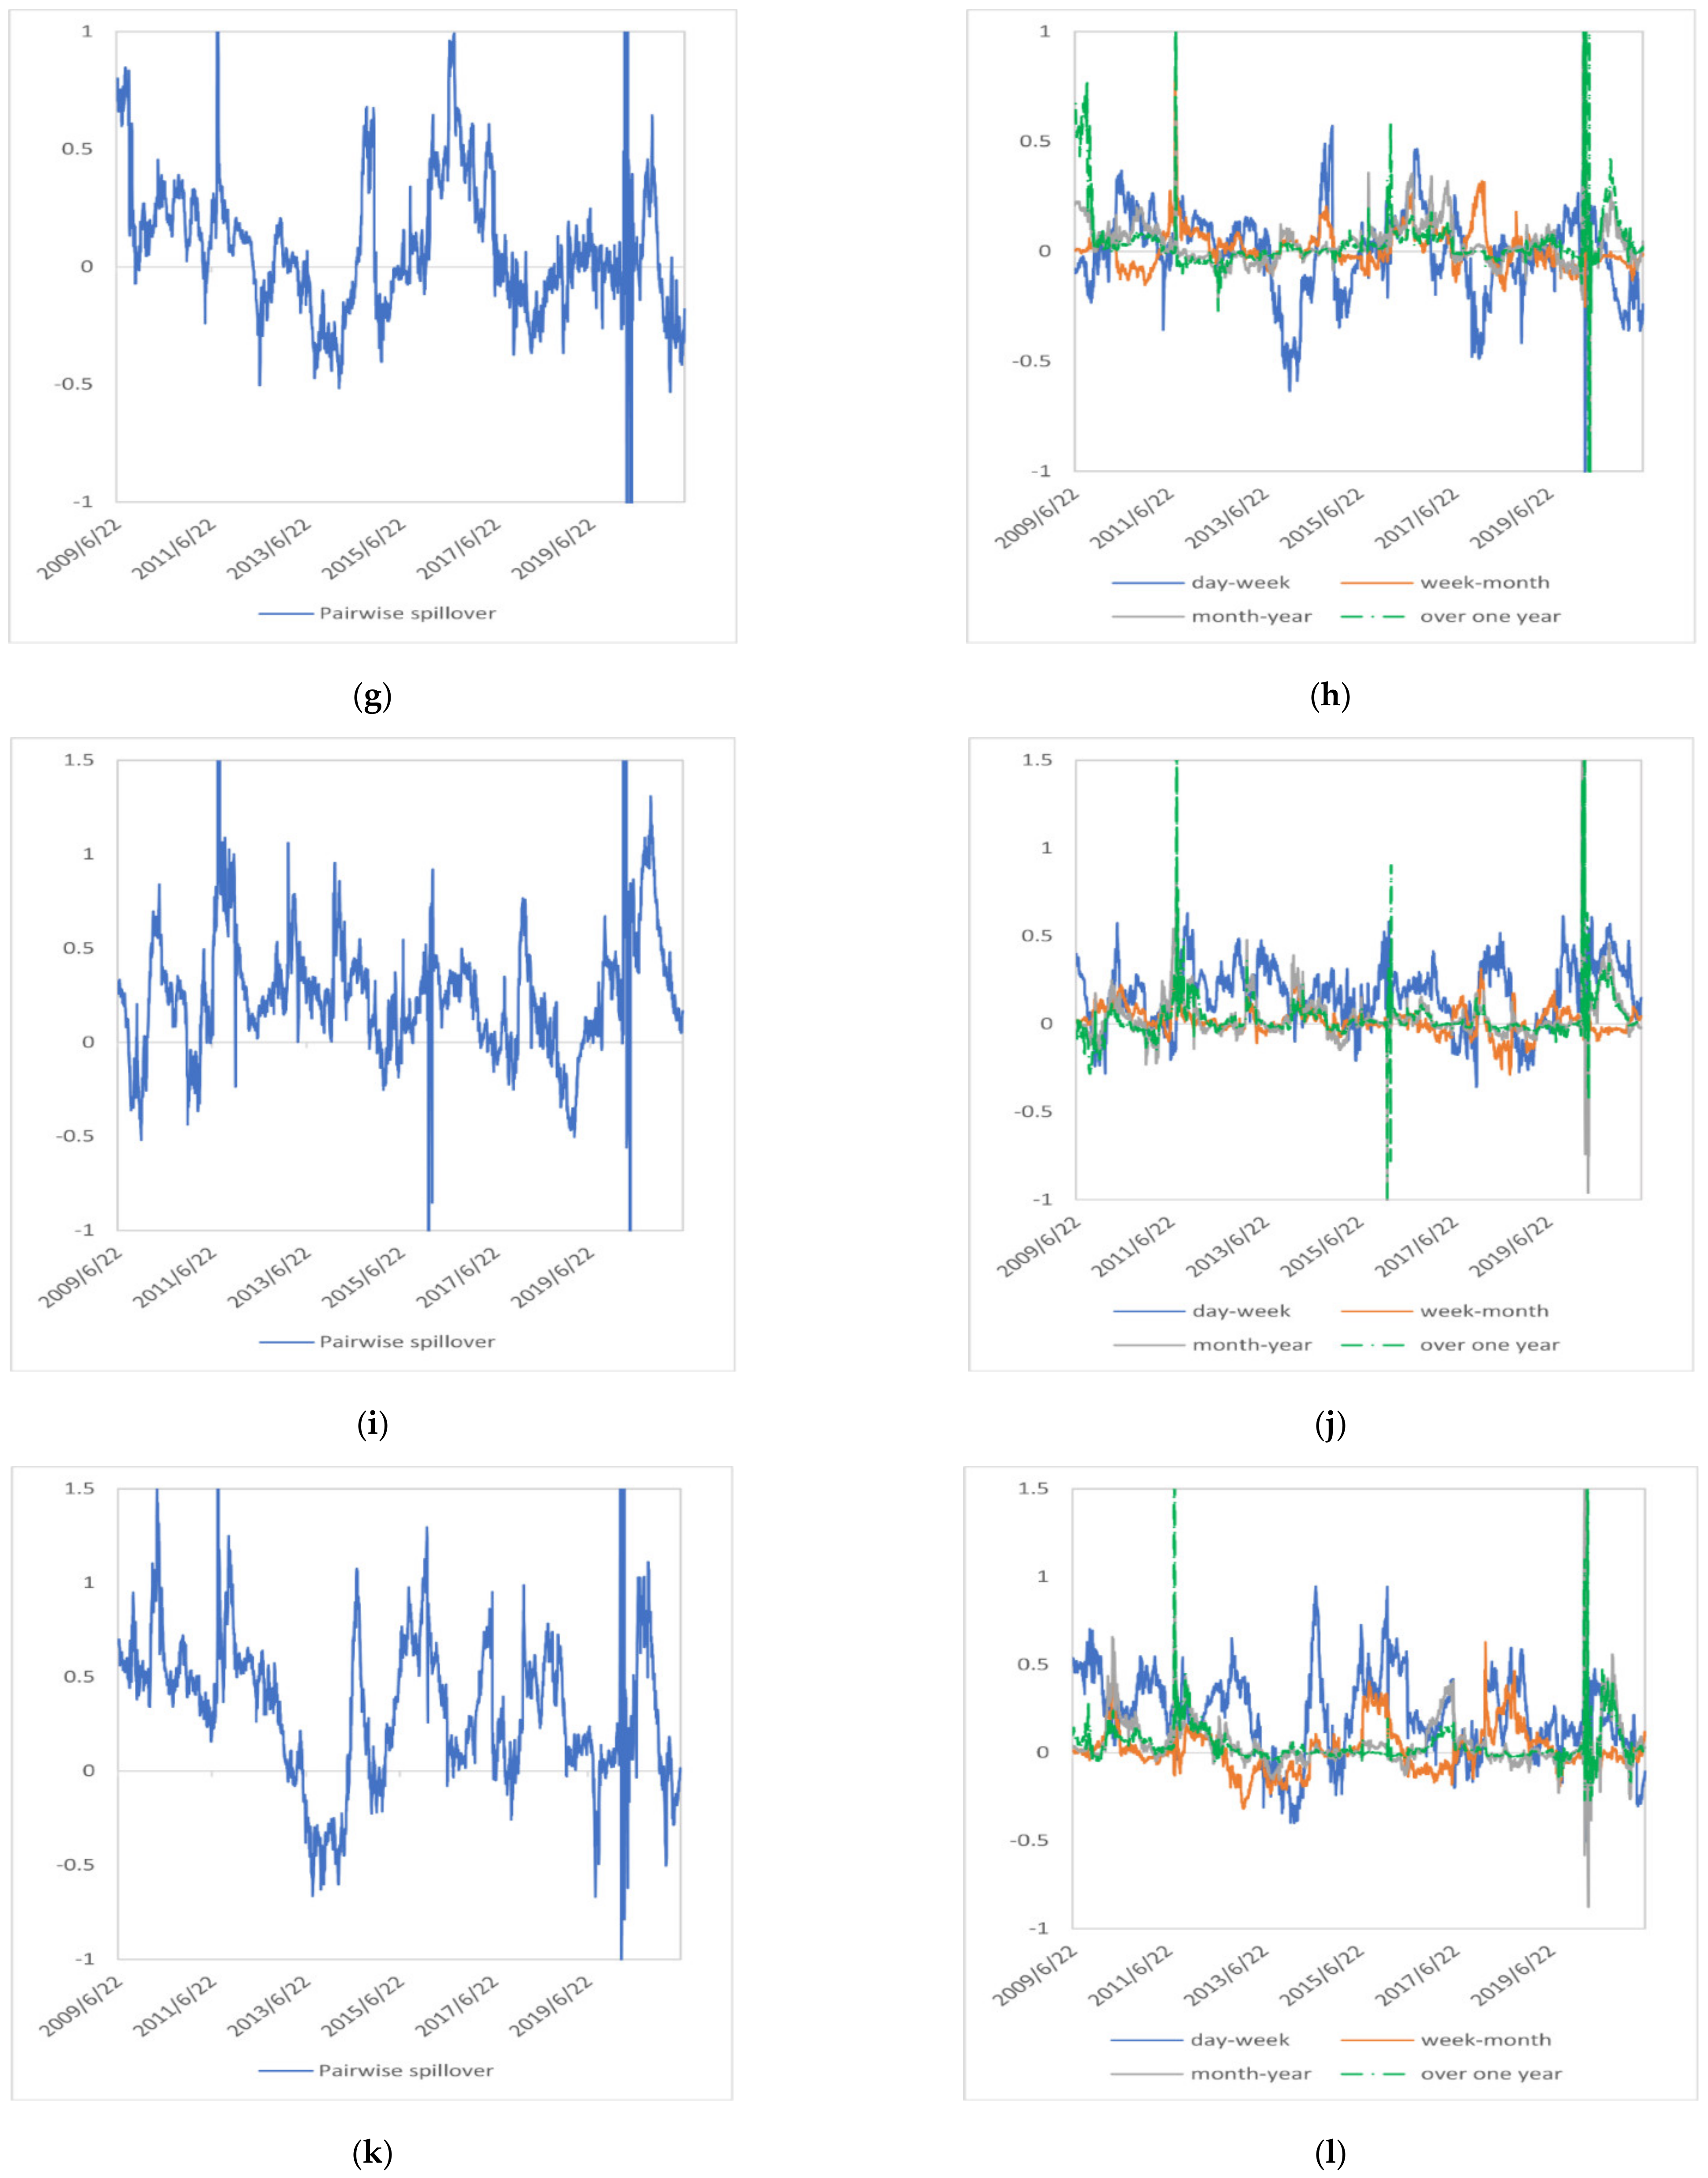
4.2.3. Pairwise Return and Volatility Connectedness
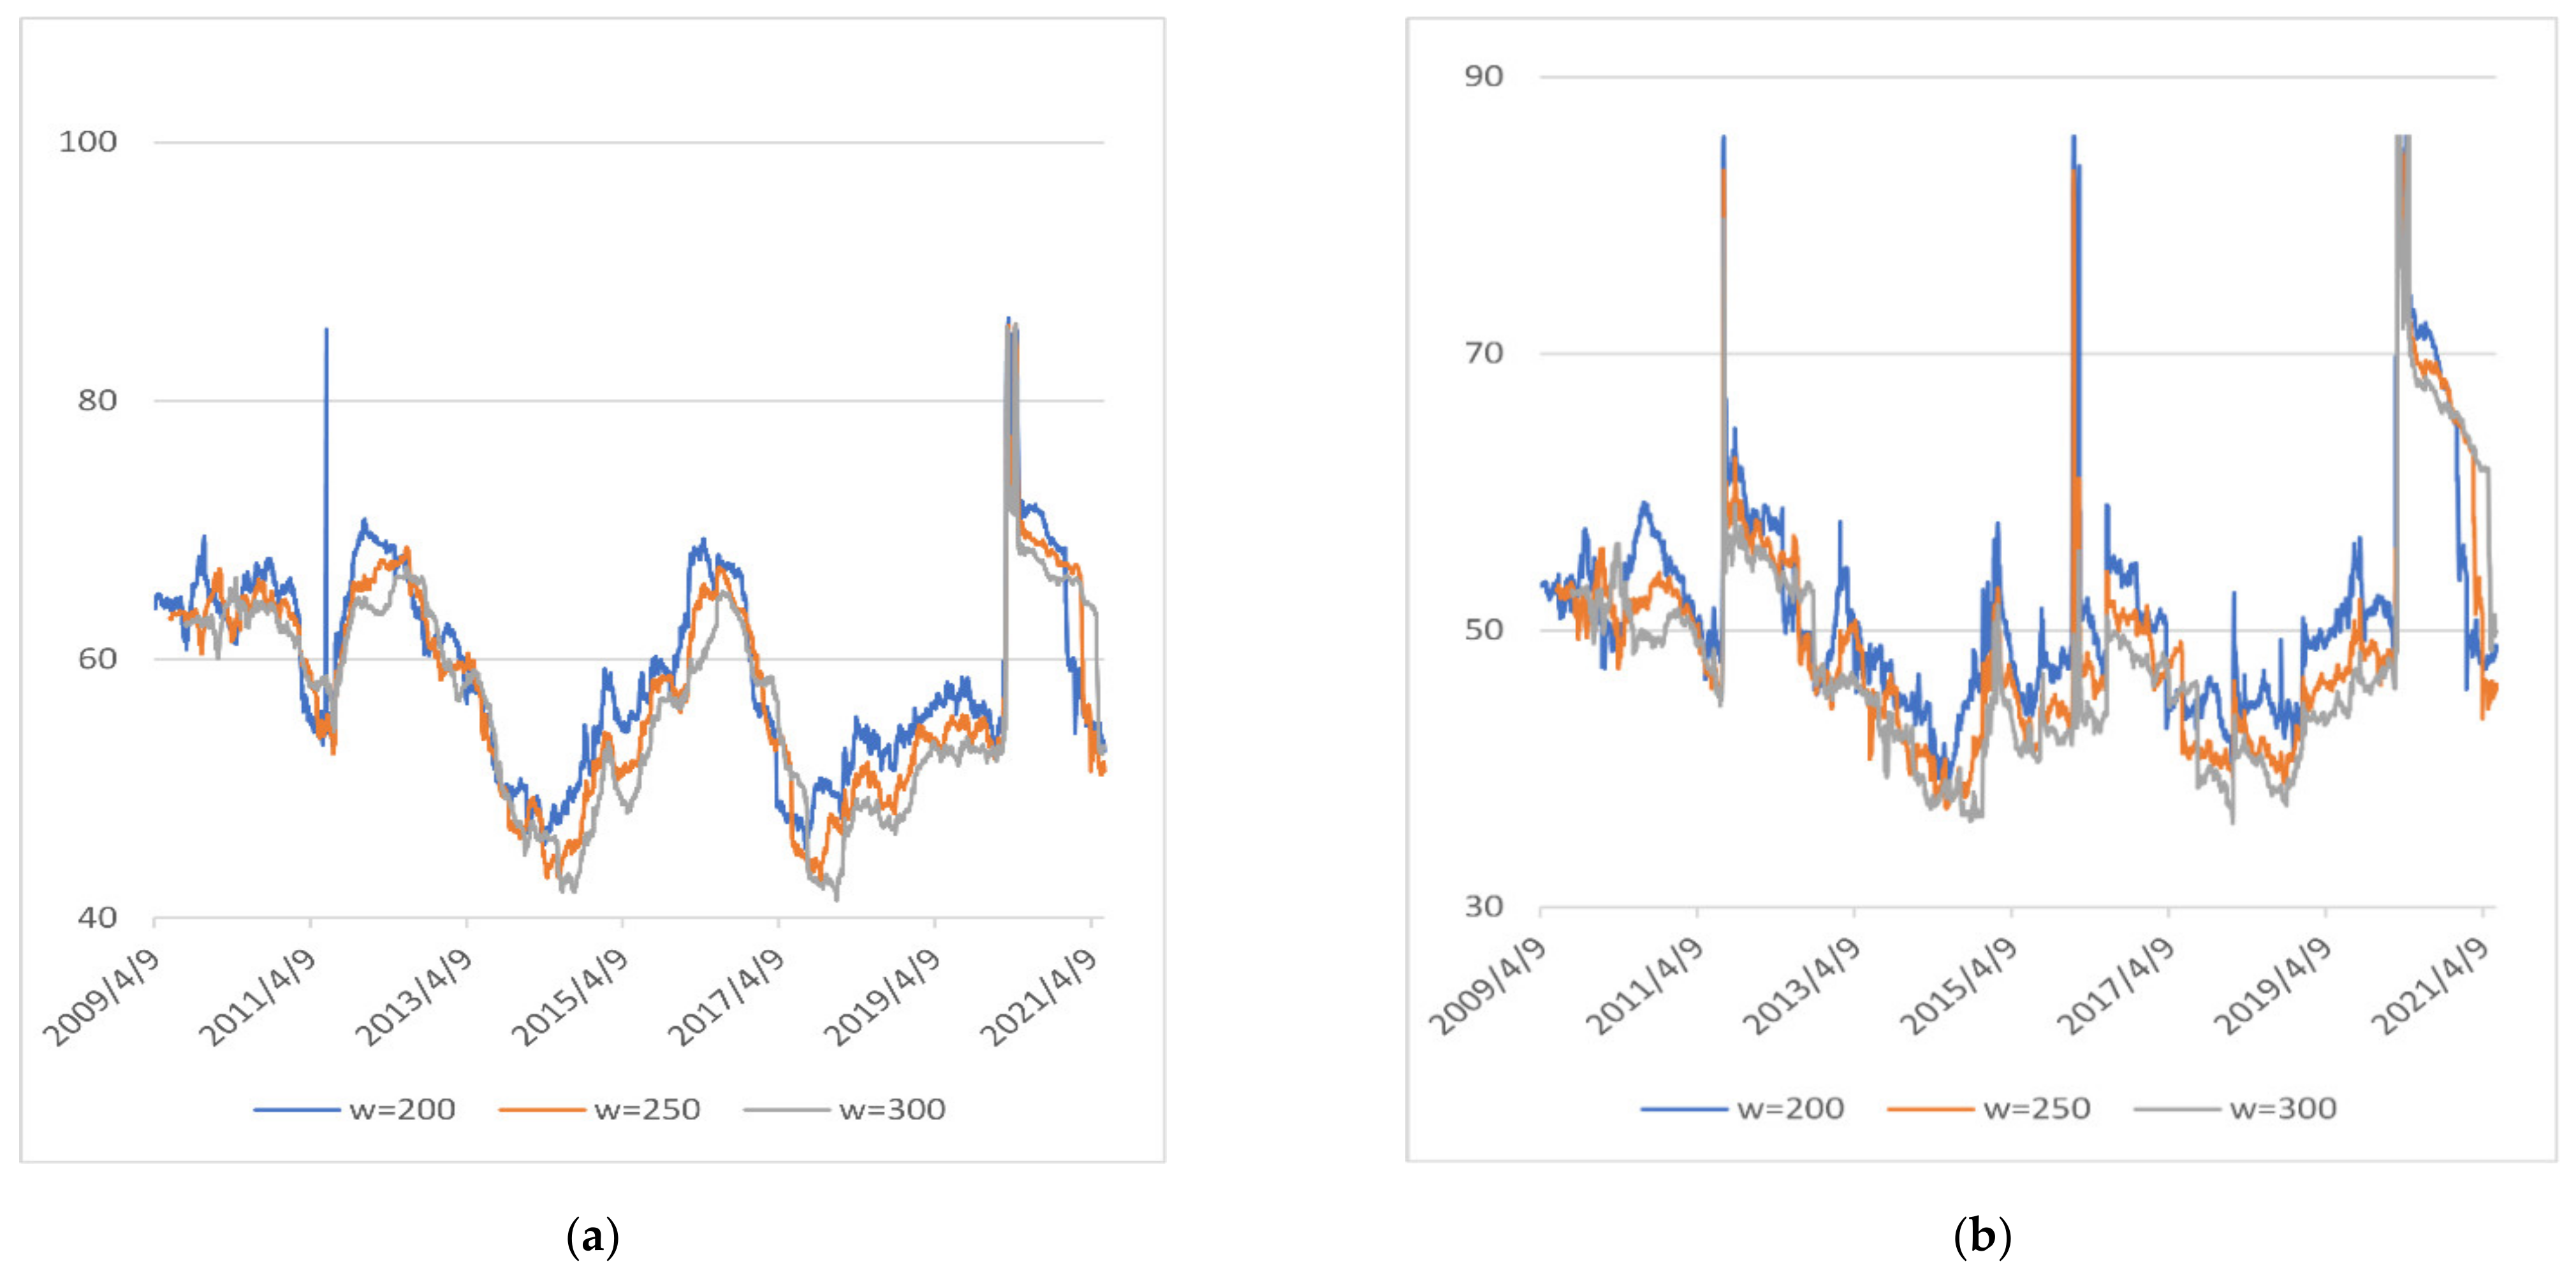
4.3. Robustness Check
5. Conclusions and Discussion
- i.
- In the price return system, only in the short term, renewable energy has a significant spillover effect on the price of crude oil. In longer time scales, the impact of crude oil on renewable energy stocks is enhanced. In the price volatility system, crude oil has certain influence on the risk of renewable energy stock market in all frequency bands, which means that renewable energy stock investors need to pay attention to the volatility of crude oil prices and adjust the asset allocation in their portfolios in a timely manner. In addition, policy makers should improve the price mechanism of the crude oil market to prevent the violent fluctuation of crude oil prices from having a huge impact on the renewable energy financial market.
- ii.
- In the price return system, renewable energy stocks have a significant spillover effect on technology stocks in the short term, while technology stocks have a significant spillover effect on the renewable energy over a time scale of more than a week. This may mean that the long-term return of renewable energy is more strongly influenced by the return of the technology industry, and it’s an effective way to achieve sustainable development of the renewable energy industry by promoting the progress of science and technology. In the price volatility system, only in the short term, technology stocks have a significant impact on renewable energy stocks. In longer time scales, the dominant role of technology stocks diminishes. For short-term investors, including technology stocks and renewable energy stocks in the same portfolio may increase investment risk.
Author Contributions
Funding
Institutional Review Board Statement
Informed Consent Statement
Data Availability Statement
Conflicts of Interest
Appendix A

| Mean | Std. Dev. | Proportion | ||||||||||
|---|---|---|---|---|---|---|---|---|---|---|---|---|
| Panel A: price return system | ||||||||||||
| day-week | week-month | month-year | over one year | day-week | week-month | month-year | over one year | day-week | week-month | month-year | over one year | |
| NEX | 1.00 | −0.44 | −0.13 | −0.03 | 1.01 | 0.49 | 0.19 | 0.07 | 81.71% | 17.96% | 21.85% | 25.46% |
| MSCI | 2.18 | 0.15 | 0.10 | 0.03 | 1.09 | 0.31 | 0.20 | 0.09 | 99.80% | 65.80% | 72.08% | 73.41% |
| PSE | 0.52 | 0.46 | 0.16 | 0.04 | 0.94 | 0.44 | 0.18 | 0.07 | 73.44% | 86.75% | 90.90% | 86.85% |
| WTI | −0.31 | 0.09 | 0.02 | 0.01 | 1.52 | 0.38 | 0.50 | 0.23 | 40.07% | 63.31% | 57.24% | 58.80% |
| Brent | −0.09 | 0.00 | −0.05 | −0.01 | 0.92 | 0.29 | 0.18 | 0.08 | 56.74% | 48.54% | 42.86% | 42.20% |
| EUA | −1.66 | −0.19 | −0.08 | −0.02 | 1.04 | 0.31 | 0.24 | 0.08 | 1.23% | 24.07% | 34.59% | 37.72% |
| 10 YTN | −1.63 | −0.07 | −0.03 | −0.01 | 1.18 | 0.41 | 0.25 | 0.08 | 2.16% | 40.54% | 41.24% | 44.09% |
| Panel B: price volatility system | ||||||||||||
| day-week | week-month | month-year | over one year | day-week | week-month | month-year | over one year | day-week | week-month | month-year | over one year | |
| NEX | −0.23 | −0.07 | 0.21 | 0.20 | 0.63 | 0.43 | 0.69 | 0.77 | 38.71% | 41.27% | 65.77% | 67.30% |
| MSCI | 1.20 | 0.26 | 0.32 | 0.21 | 0.70 | 0.33 | 0.64 | 0.59 | 93.86% | 82.64% | 77.62% | 77.46% |
| PSE | 0.50 | −0.05 | −0.08 | −0.03 | 0.64 | 0.31 | 0.54 | 0.55 | 78.15% | 39.31% | 45.92% | 49.20% |
| WTI | 0.08 | 0.09 | 0.00 | 0.00 | 0.80 | 0.50 | 0.93 | 1.15 | 55.38% | 64.24% | 44.65% | 46.68% |
| Brent | 0.07 | −0.07 | −0.11 | −0.10 | 0.67 | 0.33 | 0.47 | 0.68 | 57.40% | 43.29% | 48.57% | 45.32% |
| EUA | −0.70 | −0.08 | −0.16 | −0.09 | 0.93 | 0.32 | 0.63 | 0.96 | 18.43% | 37.78% | 36.19% | 37.98% |
| 10 YTN | −0.92 | −0.09 | −0.20 | −0.19 | 0.66 | 0.34 | 0.63 | 0.56 | 10.33% | 42.70% | 39.74% | 34.03% |
References
- The Renewables 2019 Global Status Report. Available online: https://www.ren21.net/gsr-2019/chapters/chapter_01/chapter_01/ (accessed on 6 October 2021).
- The 2020 Edition of Energy Outlook. Available online: https://www.bp.com/content/dam/bp/business-sites/en/global/corporate/pdfs/energy-economics/energy-outlook/bp-energy-outlook-2020.pdf (accessed on 6 October 2021).
- The 2019 Edition of World Energy Outlook. Available online: https://iea.blob.core.windows.net/assets/98909c1b-aabc-4797-9926-35307b418cdb/WEO2019-free.pdf (accessed on 7 October 2021).
- Henriques, I.; Sadorsky, P. Oil Prices and the Stock Prices of Alternative Energy Companies. Energy Econ. 2008, 30, 998–1010. [Google Scholar] [CrossRef]
- Kumar, S.; Managi, S.; Matsuda, A. Stock Prices of Clean Energy Firms, Oil and Carbon Markets: A Vector Autoregressive Analysis. Energy Econ. 2012, 34, 215–226. [Google Scholar] [CrossRef]
- Ahmad, W.; Sadorsky, P.; Sharma, A. Optimal Hedge Ratios for Clean Energy Equities. Econ. Model. 2018, 72, 278–295. [Google Scholar] [CrossRef]
- Reboredo, J.C.; Ugolini, A. The Impact of Energy Prices on Clean Energy Stock Prices. A Multivariate Quantile Dependence Approach. Energy Econ. 2018, 76, 136–152. [Google Scholar] [CrossRef]
- Song, Y.; Ji, Q.; Du, Y.J.; Geng, J.B. The Dynamic Dependence of Fossil Energy, Investor Sentiment and Renewable Energy Stock Markets. Energy Econ. 2019, 84, 104564. [Google Scholar] [CrossRef]
- Managi, S.; Okimoto, T. Does the Price of Oil Interact with Clean Energy Prices in the Stock Market? Japan World Econ. 2013, 27, 1–9. [Google Scholar] [CrossRef] [Green Version]
- Paiva, A.S.S.; Rivera-Castro, M.A.; Andrade, R.F.S. DCCA Analysis of Renewable and Conventional Energy Prices. Phys. A Stat. Mech. Its Appl. 2018, 490, 1408–1414. [Google Scholar] [CrossRef]
- Reboredo, J.C.; Rivera-Castro, M.A.; Ugolini, A. Wavelet-Based Test of Co-Movement and Causality between Oil and Renewable Energy Stock Prices. Energy Econ. 2017, 61, 241–252. [Google Scholar] [CrossRef]
- Sadorsky, P. Correlations and Volatility Spillovers between Oil Prices and the Stock Prices of Clean Energy and Technology Companies. Energy Econ. 2012, 34, 248–255. [Google Scholar] [CrossRef]
- Ahmad, W. On the Dynamic Dependence and Investment Performance of Crude Oil and Clean Energy Stocks. Res. Int. Bus. Financ. 2017, 42, 376–389. [Google Scholar] [CrossRef]
- Inchauspe, J.; Ripple, R.D.; Trück, S. The Dynamics of Returns on Renewable Energy Companies: A State-Space Approach. Energy Econ. 2015, 48, 325–335. [Google Scholar] [CrossRef]
- Zhang, G.; Du, Z. Co-Movements among the Stock Prices of New Energy, High-Technology and Fossil Fuel Companies in China. Energy 2017, 135, 249–256. [Google Scholar] [CrossRef]
- Tiwari, A.K.; Nasreen, S.; Hammoudeh, S.; Selmi, R. Dynamic Dependence of Oil, Clean Energy and the Role of Technology Companies: New Evidence from Copulas with Regime Switching. Energy 2021, 220, 119590. [Google Scholar] [CrossRef]
- Ferrer, R.; Shahzad, S.J.H.; López, R.; Jareño, F. Time and Frequency Dynamics of Connectedness between Renewable Energy Stocks and Crude Oil Prices. Energy Econ. 2018, 76, 1–20. [Google Scholar] [CrossRef]
- Bondia, R.; Ghosh, S.; Kanjilal, K. International Crude Oil Prices and the Stock Prices of Clean Energy and Technology Companies: Evidence from Non-Linear Cointegration Tests with Unknown Structural Breaks. Energy 2016, 101, 558–565. [Google Scholar] [CrossRef]
- Kocaarslan, B.; Soytas, U. Asymmetric Pass-through between Oil Prices and the Stock Prices of Clean Energy Firms: New Evidence from a Nonlinear Analysis. Energy Rep. 2019, 5, 117–125. [Google Scholar] [CrossRef]
- Dutta, A.; Bouri, E.; Noor, H. Return and Volatility Linkages between CO 2 Emission and Clean Energy Stock Prices. Energy 2020, 164, 803–810. [Google Scholar] [CrossRef]
- Xia, T.; Ji, Q.; Zhang, D.; Han, J. Asymmetric and Extreme Influence of Energy Price Changes on Renewable Energy Stock Performance. J. Clean. Prod. 2019, 241, 118338. [Google Scholar] [CrossRef]
- Lin, B.; Chen, Y. Dynamic Linkages and Spillover Effects between CET Market, Coal Market and Stock Market of New Energy Companies: A Case of Beijing CET Market in China. Energy 2019, 172, 1198–1210. [Google Scholar] [CrossRef]
- Jiang, C.; Wu, Y.; Li, X.; Li, X. Time-Frequency Connectedness between Coal Market Prices, New Energy Stock Prices and CO2 Emissions Trading Prices in China. Sustainability 2020, 12, 2823. [Google Scholar] [CrossRef] [Green Version]
- Wang, X.; Wang, Y. Volatility Spillovers between Crude Oil and Chinese Sectoral Equity Markets: Evidence from a Frequency Dynamics Perspective. Energy Econ. 2019, 80, 995–1009. [Google Scholar] [CrossRef]
- Diebold, F.X.; Yilmaz, K. On the Network Topology of Variance Decompositions: Measuring the Connectedness of Financial Firms. J. Econom. 2014, 182, 119–134. [Google Scholar] [CrossRef] [Green Version]
- Baruník, J.; Křehlík, T. Measuring the Frequency Dynamics of Financial Connectedness and Systemic Risk. J. Financ. Econom. 2018, 16, 271–296. [Google Scholar] [CrossRef]
- Kodres, L.E.; Pritsker, M. A Rational Expectations Model of Financial Contagion. J. Financ. 2002, 57, 769–799. [Google Scholar] [CrossRef] [Green Version]
- Acharya, V.V.; Pedersen, L.H. Asset Pricing with Liquidity Risk. J. Financ. Econ. 2005, 77, 375–410. [Google Scholar] [CrossRef] [Green Version]
- Tan, X.; Sirichand, K.; Vivian, A.; Wang, X. How Connected Is the Carbon Market to Energy and Financial Markets? A Systematic Analysis of Spillovers and Dynamics. Energy Econ. 2020, 90, 104870. [Google Scholar] [CrossRef]
- Zhang, D. Oil Shocks and Stock Markets Revisited: Measuring Connectedness from a Global Perspective. Energy Econ. 2017, 62, 323–333. [Google Scholar] [CrossRef]
- Aromi, D.; Clements, A. Spillovers between the Oil Sector and the S&P500: The Impact of Information Flow about Crude Oil. Energy Econ. 2019, 81, 187–196. [Google Scholar] [CrossRef]
- Maghyereh, A.I.; Awartani, B.; Bouri, E. The Directional Volatility Connectedness between Crude Oil and Equity Markets: New Evidence from Implied Volatility Indexes. Energy Econ. 2016, 57, 78–93. [Google Scholar] [CrossRef] [Green Version]
- Ma, Y.R.; Zhang, D.; Ji, Q.; Pan, J. Spillovers between Oil and Stock Returns in the US Energy Sector: Does Idiosyncratic Information Matter? Energy Econ. 2019, 81, 536–544. [Google Scholar] [CrossRef]
- Apergis, N.; Baruník, J.; Lau, M.C.K. Good Volatility, Bad Volatility: What Drives the Asymmetric Connectedness of Australian Electricity Markets? Energy Econ. 2017, 66, 108–115. [Google Scholar] [CrossRef]
- Zhang, D.; Ji, Q.; Kutan, A.M. Dynamic Transmission Mechanisms in Global Crude Oil Prices: Estimation and Implications. Energy 2019, 175, 1181–1193. [Google Scholar] [CrossRef]
- Restrepo, N.; Uribe, J.M.; Manotas, D. Financial Risk Network Architecture of Energy Firms. Appl. Energy 2018, 215, 630–642. [Google Scholar] [CrossRef]
- Koop, G.; Pesaran, M.H.; Potter, S.M. Impulse Response Analysis in Nonlinear Multivariate Models. J. Econom. 1996, 74, 119–147. [Google Scholar] [CrossRef]
- Pesaran, H.H.; Shin, Y. Capital Taxation and Production Efficiency in an Open Economy. Econ. Lett. 1999, 62, 85–90. [Google Scholar] [CrossRef]
- The Index Report of the WilderHill New Energy Global Innovation Index (NEX). Available online: https://cleanenergyindex.com/pdf/NEX%20for%20website%20for%20Start%20of%20Q2%202021.pdf (accessed on 22 October 2021).
- The Website of Intercontinental Exchange (ICE). Available online: https://www.theice.com/publicdocs/data/NYSE_Arca_Tech_100_Index_Methodology.pdf (accessed on 22 October 2021).
- The Website of the MSCI World Index. Available online: https://www.msci.com/documents/10199/149ed7bc-316e-4b4c-8ea4-43fcb5bd6523 (accessed on 29 October 2021).
- The Website of the MSCI World Index. Available online: https://www.msci.com/developed-markets (accessed on 22 October 2021).
- Ciner, C.; Gurdgiev, C.; Lucey, B.M. Hedges and Safe Havens: An Examination of Stocks, Bonds, Gold, Oil and Exchange Rates. Int. Rev. Financ. Anal. 2013, 29, 202–211. [Google Scholar] [CrossRef]
- Antonakakis, N.; Cunado, J.; Filis, G.; Gabauer, D.; Perez, F.; Gracia, D. Oil Volatility, Oil and Gas Firms and Portfolio Diversification. Energy Econ. 2018, 70, 499–515. [Google Scholar] [CrossRef] [Green Version]
- Wang, G.; Xie, C.; Jiang, Z.; Stanley, H.E. Who Are the Net Senders and Recipients of Volatility Spillovers in China ’ s Financial Markets ? Financ. Res. Lett. 2016, 18, 255–262. [Google Scholar] [CrossRef]
- Antonakakis, N.; Kizys, R. International Review of Financial Analysis Dynamic Spillovers between Commodity and Currency Markets. Int. Rev. Financ. Anal. 2015, 41, 303–319. [Google Scholar] [CrossRef] [Green Version]
- Berta, N.; Gautherat, E.; Gun, O. Transactions in the European Carbon Market: A Bubble of Compliance in a Whirlpool of Speculation. Cambridge J. Econ. 2017, 41, 575–593. [Google Scholar] [CrossRef] [Green Version]
- Li, L.; Yin, L.; Zhou, Y. Exogenous Shocks and the Spillover Effects between Uncertainty and Oil Price. Energy Econ. 2016, 54, 224–234. [Google Scholar] [CrossRef]
- Krehlik, T.; Barunik, J. Cyclical Properties of Supply-Side and Demand-Side Shocks in Oil-Based Commodity Markets. Energy Econ. 2017, 65, 208–218. [Google Scholar] [CrossRef] [Green Version]
- Salisu, A.A.; Oloko, T.F. Modeling Oil Price-US Stock Nexus: A VARMA-BEKK-AGARCH Approach. Energy Econ. 2015, 50, 1–12. [Google Scholar] [CrossRef]
- Du, L.; He, Y. Extreme Risk Spillovers between Crude Oil and Stock Markets. Energy Econ. 2015, 51, 455–465. [Google Scholar] [CrossRef]
- Cui, J.; Goh, M.; Li, B.; Zou, H. Dynamic Dependence and Risk Connectedness among Oil and Stock Markets: New Evidence from Time-Frequency Domain Perspectives. Energy 2021, 216, 119302. [Google Scholar] [CrossRef]
- Umar, M.; Farid, S.; Naeem, M.A. Time-Frequency Connectedness among Clean-Energy Stocks and Fossil Fuel Markets: Comparison between Financial, Oil and Pandemic Crisis. Energy 2022, 240, 122702. [Google Scholar] [CrossRef]


| NEX | MSCI | PSE | WTI | Brent | EUA | 10 YTN | |
|---|---|---|---|---|---|---|---|
| Panel A: Descriptive statistics of price returns | |||||||
| Mean | 0.003143 | 0.022832 | 0.054781 | −0.01991 | −0.0189 | 0.020422 | −0.03222 |
| Median | 0.084921 | 0.076576 | 0.107949 | 0.06152 | 0.060356 | 0 | −0.0912 |
| Max. | 12.07055 | 9.096657 | 10.0988 | 31.96337 | 19.0774 | 23.92297 | 40.59273 |
| Min. | −12.5407 | −10.4412 | −12.7364 | −60.1676 | −37.3399 | −43.2421 | −34.1459 |
| Std. Dev. | 1.555478 | 1.136851 | 1.379505 | 3.022231 | 2.485705 | 3.171374 | 3.037656 |
| Skewness | −0.59983 | −0.81959 | −0.4746 | −2.22029 | −1.3013 | −0.8433 | 0.157663 |
| Kurtosis | 11.82942 | 15.47495 | 11.83082 | 66.39399 | 27.25795 | 18.09607 | 34.4649 |
| Jarque-Bera | 10,788.19 | 21,510.56 | 10,718.41 | 548,733.5 | 80,875.71 | 31,351.25 | 134,535.2 |
| Panel B: Descriptive statistics of price volatilities | |||||||
| Mean | 1.026961 | 0.720181 | 0.921661 | 1.815187 | 1.615483 | 2.181937 | 1.987256 |
| Median | 0.691197 | 0.464433 | 0.623592 | 1.205132 | 1.037256 | 1.583906 | 1.449854 |
| Max. | 12.54068 | 10.44119 | 12.73636 | 60.16758 | 37.33993 | 43.24209 | 40.59273 |
| Min. | 0 | 0.000229 | 0 | 0 | 0 | 0 | 0 |
| Std. Dev. | 1.168139 | 0.879848 | 1.027773 | 2.41627 | 1.889048 | 2.301244 | 2.297389 |
| Skewness | 3.29492 | 3.788933 | 3.218894 | 7.933581 | 4.88873 | 3.998018 | 6.243861 |
| Kurtosis | 20.35099 | 26.07892 | 21.16342 | 135.0959 | 60.18791 | 43.82444 | 78.66341 |
| Jarque-Bera | 46,806.62 | 80,174.46 | 50457.83 | 2405138 | 457362.8 | 235141.4 | 799,066.6 |
| NEX | MSCI | PSE | WTI | Brent | EUA | 10 YTN | From | |
|---|---|---|---|---|---|---|---|---|
| Panel A: price return system | ||||||||
| NEX | 36.01 | 25.88 | 20.94 | 5.20 | 6.30 | 1.77 | 3.90 | 63.99 |
| MSCI | 22.93 | 31.87 | 25.23 | 5.57 | 6.73 | 1.42 | 6.25 | 68.13 |
| PSE | 19.94 | 28.33 | 35.58 | 3.90 | 4.88 | 1.10 | 6.28 | 64.42 |
| WTI | 6.05 | 7.59 | 4.73 | 43.05 | 32.78 | 1.87 | 3.92 | 56.95 |
| Brent | 6.90 | 8.55 | 5.44 | 31.86 | 41.48 | 1.90 | 3.86 | 58.52 |
| EUA | 4.22 | 3.96 | 2.72 | 3.79 | 4.26 | 79.97 | 1.08 | 20.03 |
| 10 YTN | 7.06 | 12.57 | 10.52 | 4.81 | 5.56 | 0.67 | 58.82 | 41.18 |
| To | 67.1 | 86.88 | 69.58 | 55.13 | 60.51 | 8.73 | 25.29 | TSI = 53.32% |
| Net | 3.11 | 18.75 | 5.16 | −1.82 | 1.99 | −11.3 | −15.89 | |
| Panel B: price volatility system | ||||||||
| NEX | 46.12 | 27.82 | 15.56 | 2.41 | 3.19 | 0.45 | 4.43 | 53.88 |
| MSCI | 24.07 | 38.46 | 23.47 | 3.06 | 4.13 | 0.46 | 6.34 | 61.54 |
| PSE | 17.13 | 28.67 | 40.33 | 2.80 | 3.51 | 0.43 | 7.13 | 59.67 |
| WTI | 5.04 | 8.02 | 5.59 | 44.92 | 30.04 | 0.39 | 6.00 | 55.08 |
| Brent | 5.79 | 8.69 | 5.46 | 31.11 | 44.30 | 0.26 | 4.39 | 55.7 |
| EUA | 1.08 | 1.86 | 1.37 | 0.64 | 0.52 | 92.72 | 1.82 | 7.28 |
| 10 YTN | 5.06 | 9.96 | 8.64 | 4.19 | 5.30 | 0.42 | 66.42 | 33.58 |
| To | 58.17 | 85.02 | 60.09 | 44.21 | 46.69 | 2.41 | 30.11 | TSI = 46.68% |
| Net | 4.29 | 23.48 | 0.42 | −10.87 | −9.01 | −4.87 | −3.47 | |
| From | To | Net | Proportion | ||||
|---|---|---|---|---|---|---|---|
| Panel A: price return system | |||||||
| Mean | Std. Dev. | Mean | Std. Dev. | Mean | Std. Dev. | ||
| NEX | 9.34 | 0.97 | 9.75 | 1.74 | 0.40 | 0.99 | 67.20% |
| MSCI | 9.81 | 0.73 | 12.27 | 1.55 | 2.46 | 1.13 | 99.90% |
| PSE | 9.37 | 0.74 | 10.54 | 1.28 | 1.17 | 1.07 | 92.10% |
| WTI | 8.76 | 1.11 | 8.57 | 2.01 | −0.19 | 1.83 | 44.12% |
| Brent | 8.72 | 1.10 | 8.56 | 1.32 | −0.15 | 0.84 | 45.39% |
| EUA | 4.84 | 2.04 | 2.89 | 1.15 | −1.95 | 1.26 | 1.16% |
| 10 YTN | 6.72 | 1.89 | 4.97 | 2.07 | −1.74 | 1.25 | 2.99% |
| Panel B: price volatility system | |||||||
| Mean | Std. Dev. | Mean | Std. Dev. | Mean | Std. Dev. | ||
| NEX | 7.61 | 1.37 | 7.73 | 2.37 | 0.12 | 1.62 | 50.07% |
| MSCI | 8.68 | 1.01 | 10.68 | 2.02 | 1.99 | 1.56 | 96.08% |
| PSE | 8.20 | 1.18 | 8.55 | 1.56 | 0.35 | 1.27 | 63.18% |
| WTI | 7.62 | 1.10 | 7.80 | 2.46 | 0.17 | 2.45 | 49.34% |
| Brent | 7.64 | 1.05 | 7.43 | 1.42 | −0.21 | 1.29 | 40.31% |
| EUA | 3.84 | 1.66 | 2.81 | 1.61 | −1.03 | 1.93 | 18.56% |
| 10 YTN | 5.49 | 1.91 | 4.10 | 2.00 | −1.40 | 1.30 | 6.21% |
| NEX-MSCI | NEX-PSE | NEX-WTI | NEX-Brent | NEX-EUA | NEX-10YTN | |
|---|---|---|---|---|---|---|
| Panel A: price return system | ||||||
| Mean | −0.43 | −0.24 | 0.19 | 0.17 | 0.38 | 0.33 |
| Std. Dev. | 0.24 | 0.33 | 0.34 | 0.20 | 0.28 | 0.30 |
| Proportion | 0.23% | 23.44% | 83.37% | 85.03% | 91.93% | 94.02% |
| Panel B: price volatility system | ||||||
| Mean | −0.48 | −0.12 | 0.06 | 0.09 | 0.25 | 0.33 |
| Std. Dev. | 0.34 | 0.35 | 0.51 | 0.36 | 0.38 | 0.40 |
| Proportion | 2.06% | 32.20% | 56.91% | 58.47% | 81.57% | 82.14% |
| NEX-MSCI | NEX-PSE | NEX-WTI | NEX-Brent | NEX-EUA | NEX-10YTN | ||
|---|---|---|---|---|---|---|---|
| Panel A: price return system | |||||||
| Proportion | day-week | 5.44% | 62.32% | 83.80% | 82.01% | 95.39% | 95.15% |
| week-month | 8.93% | 16.43% | 40.04% | 42.80% | 46.38% | 41.27% | |
| month-year | 13.75% | 12.02% | 50.73% | 56.91% | 45.25% | 49.04% | |
| over one year | 15.47% | 14.84% | 51.73% | 57.93% | 46.61% | 48.37% | |
| Panel B: price volatility system | |||||||
| Proportion | day-week | 8.03% | 18.19% | 52.89% | 52.66% | 82.64% | 83.20% |
| week-month | 31.37% | 46.02% | 45.78% | 50.27% | 56.51% | 50.07% | |
| month-year | 53.62% | 59.16% | 59.56% | 62.95% | 55.21% | 61.85% | |
| over one year | 55.35% | 60.82% | 59.66% | 61.89% | 52.09% | 64.84% | |
Publisher’s Note: MDPI stays neutral with regard to jurisdictional claims in published maps and institutional affiliations. |
© 2022 by the authors. Licensee MDPI, Basel, Switzerland. This article is an open access article distributed under the terms and conditions of the Creative Commons Attribution (CC BY) license (https://creativecommons.org/licenses/by/4.0/).
Share and Cite
Nie, D.; Li, Y.; Li, X.; Zhou, X.; Zhang, F. The Dynamic Spillover between Renewable Energy, Crude Oil and Carbon Market: New Evidence from Time and Frequency Domains. Energies 2022, 15, 3927. https://doi.org/10.3390/en15113927
Nie D, Li Y, Li X, Zhou X, Zhang F. The Dynamic Spillover between Renewable Energy, Crude Oil and Carbon Market: New Evidence from Time and Frequency Domains. Energies. 2022; 15(11):3927. https://doi.org/10.3390/en15113927
Chicago/Turabian StyleNie, Dan, Yanbin Li, Xiyu Li, Xuejiao Zhou, and Feng Zhang. 2022. "The Dynamic Spillover between Renewable Energy, Crude Oil and Carbon Market: New Evidence from Time and Frequency Domains" Energies 15, no. 11: 3927. https://doi.org/10.3390/en15113927
APA StyleNie, D., Li, Y., Li, X., Zhou, X., & Zhang, F. (2022). The Dynamic Spillover between Renewable Energy, Crude Oil and Carbon Market: New Evidence from Time and Frequency Domains. Energies, 15(11), 3927. https://doi.org/10.3390/en15113927