1. Introduction
Renewable energy is a leading and promising pathway used to fight against global warming. The reduction in GHG emissions and the replacement of fossil fuels with renewable energy sources are the most important challenges in the development of the economies of all the countries in the world [
1,
2]. The literature on the subject uses the term “green economy” [
2,
3,
4,
5,
6,
7]. This concept is related to the global phenomenon of the transition from the current energy system in which fossil fuels are used as an energy source to an energy system based primarily on renewable energy sources such as wind energy, hydropower, photovoltaic energy and biofuels [
2,
3,
4,
5]. The European Union is among the world leaders in the field of energy transformation related to the reduction in GHG emissions with regard to increasing the share of renewable energy sources. For the EU member states, energy transformation is one of the most important strategic goals of counteracting climate change, as well as increasing energy security and the attractiveness of European Union countries [
2,
3,
4,
5,
6,
7,
8]. In the EU, energy transition is perceived as a long-term process which, in consequence, will also strengthen economic competitiveness by creating jobs and improving the quality of life. In the literature on the subject, three components of energy transformation have been distinguished: economic, industrial and social [
4,
5,
6,
7,
8,
9,
10,
11]. The economic component is related to the export of low-carbon technologies as well as new investments and jobs. The industrial component is connected with the modernization of economy and the reduction in pollution by changing the technology to a less-energy-consuming one. The social component includes activities related to climate protection and improvement of public health. All EU activities related to energy transformation have been included in the EU climate policy, and all member states have been obliged to take actions aimed at using renewable energy sources as a prospective technology in the fight against the effects of global warming and the ensuing consequences [
2,
3,
4,
5,
6,
12,
13,
14,
15,
16]. The article presents an analysis of the development of photovoltaic energy in the EU countries as one of the alternatives to fossil fuels. The first part of the study presents a literature review on renewable energy sources in the energy policy of the European Union. Then, a statistical analysis of data on the development of the solar photovoltaic market in the European Union countries has been conducted. Discussions and the results of the analysis are presented at the end of the article.
According to statistical data the photovoltaic power capacity in EU countries is growing year by year (
Table 1 and
Table 2). However, the careful analysis of annual installations led to the conclusion that between 2011 and 2017 the EU countries’ share was not only declining compared to the growing worldwide market; we could also observe a decrease in the annual installation figures. After a rise in the occurrence of installation in 2011 when the total photovoltaic capacities in EU counties reached 70% of the worldwide installation we observed a decreasing trend, and now the EU market consists of only 50% of the worldwide market [
17,
18,
19,
20].
The growth of the share of energy leading from photovoltaic cells in the energy mix in many EU countries gives them many benefits [
28]. The widespread usage of photovoltaic energy gives the countries many opportunities connected with the benefits of using the solar energy [
29,
30]. In the usage of solar energy, contrarily to using wind energy, no noise is generated in the energy production process. Additionally, photovoltaic energy installation is fast to and can be easily adapted to the local conditions and needs [
31,
32]. The best way of using solar energy is its consumption by the user of the installation. However, for small-scale also spatially distributed energy producers can use micro photovoltaics [
33]. The problem is in the case of large-scale photovoltaic power plants because their technical infrastructure needs to occupy a large amount of land. The problem is that land for potential big power plant investments is rather scare and also expensive. In many situations this means that agriculture land should be taken out of production [
34,
35].
The transition from fossil fuel towards renewable energy sources including photovoltaic energy in EU countries is possible due to a high level of environmental investment. “Greening” the national budget is an important part of the current pro ecological transition. Additionally, according to European Commission documents assessing the overall greenness of a budget can help the country to promote consistency of its environmental objectives [
36]. In the years 2014–2020 the expenditures of the EU on climate change finance were (in EUR): 2014—16,174 million, 2015—28,398 million, 2016—33,018 million, 2017—31,555 million, 2018—32,437 million, 2019—33,809 million and 2020—34,452 million. The expenditure on climate was about 20% of all the EU budget in the mentioned years [
37].
Additionally, the analysis of the data on environmental investment in photovoltaic energy allows us to observe some relations between the availability of solar radiation and the usage of photovoltaic energy. Due to the fact that photovoltaic cells are installed in the open and also are exposed to extreme weather conditions, they are highly affected by solar radiation. Many researchers have tried to find if the effect of solar radiation on photovoltaic cells is positive or negative [
38,
39]. This effect varies depending on wavelengths resulting from clouds. Accumulation of dust on the cell also reduces its level of productivity. This dust can reduce the permeability of radiation to the cell. Additionally, pollutants emitted from vehicles can cause significant air pollution, and they are deposited on solar cell surfaces [
40,
41]. Additionally, solar radiation has a direct effect on the temperature of the cells because this temperature can increase as the solar radiation increases. This rise of solar radiation has an impact on that the resulting voltages, which are not significantly affected by the rise of the current, and this effect is greater than the rise in the cell temperature [
42]. In the paper we also tried to analyse the nature of relations between national average temperature and photovoltaic power in EU countries.
2. Renewable Energy Sources and the Energy Policy of the European Union
The energy policy of the European Union is characterized by an integrated approach to energy security, environmental and climate protection and by a fulfilment of social needs. Provisions for renewable energy sources have been included in EU directives since 1990 2018. The main goal of the EU sustainable energy policy is to reduce the use of fossil fuels in favour of energy from renewable sources [
16,
43]. As already mentioned, in the 1990s, the EU began to consider increasing energy security, limiting the import of fossil fuels and reducing greenhouse gas emissions [
44]. The first information on renewable energy sources and their role in the economies of EU countries was given in Regulation (EEC) No. 1302/78 of 1978 on providing financial support for research projects concerning the use of alternative energy sources. In 1980, the European Commission, for the first time, included renewable energy sources in the EU energy policy in a document on energy policy objectives. In 1995, the so-called White Paper formulating the need for financial regulations regarding the development of renewable energy sources came into existence. In the Green Paper published in 1996, the European Commission assumed that by 2010 the share of renewable energy sources would increase to 12%. In 1997, the document “Energy for the Future: renewable energy sources” was adopted by the EU [
45]. Another legal act was developed by the European Parliament in 2001 in the form of Directive 2001/77/EC and concerned the support for the production of electricity produced from renewable sources on the internal market up to 2010 [
46]. In 2003, Directive 2003/30/EC was developed to support the use of biofuels or other renewable fuels in transport. The European Commission has imposed on the member states the obligation to reach a 5.75% share of renewable energy sources in transport by 2020 [
47]. In 2007, the Renewable Energy Road was published: “Renewable energies in the 21st century: building a more diverse future”. This document contains a long-term strategy for renewable energy in the EU, with the following priorities: energy security and reduction in greenhouse gas emissions [
48,
49]. In 2008, the European Commission presented a package on the EU’s energy and climate policy, a part of which was the adoption of the 2009 Directive of the European Parliament and of the Council. This directive related to the promotion of the use of energy from renewable sources, amending and repealing the 2003 directive. The main goal was to establish a common framework for the promotion of energy from renewable sources by setting mandatory targets for EU countries [
50]. In the 2010 communication “Energy 2020 A strategy for a competitive, sustainable and safe energy sector”, the European Commission noted that without the modernization of power grids and the use of ecological solutions, it would be difficult to achieve the goals of the strategy. The European Commission also considered that the time limit to achieve the stated goals should be extended to 2050 [
51]. In 2011, an action plan leading to the transition to a competitive low-carbon economy by 2050 was developed. In this plan, the European Commission set the ambitious target of reducing greenhouse gas emissions by 80–95% in relation to 1990 levels. The share of renewable energy sources should be 55% in 2050 compared to 2011 [
52]. In the communication “Renewable energy: an important player on the European energy market” published in 2012, the European Commission presented information on the inclusion of renewable energy sources in the EU energy market and maintaining the pace of growth of the share of renewable energy sources in energy production up to 2030 [
53]. In 2013, the European Commission published the policy framework for climate and energy for the period from 2020 to 2030, which includes specific information on climate protection in the EU up to 2030. The European Commission proposed a reduction in greenhouse gas emissions up to 2030 by 40% compared to 1990. Moreover, the document also includes the following provisions: the share of energy from renewable sources in the energy consumed in the EU is to be at least 27%. To this end, EU countries should establish common goals and implement them ambitiously [
43,
54,
55,
56,
57,
58,
59,
60].
In the European Union countries, the technical potential of renewable energy amounts to approximately 40,000 PJ/year, which is 60% of the current primary energy consumption. The economic potential of renewable energy is estimated as 5780 TW/year. It is worth noting, however, that renewable energy potential in the EU countries is uneven due to the climatic, hydrological and geological conditions in individual EU countries. In the EU, the share of renewable energy sources is growing steadily. In 2000, it reached 10.3%, and in 2013 this increased to 24.3%. The largest increase in energy production from renewable energy sources took place in 2000–2013—from 163 million to 190 million tons [
43].
In the EU countries, the largest share of electricity in 2020 was generated from wind; the leaders are Germany (96 TWh), France (40 TEh) and Sweden (28 TWh). Poland was in fourth place (14 TWh). Solar energy (photovoltaic) is the second fastest-growing renewable energy source in the EU. In 2020, 134 TWh of solar energy was produced in the EU countries, mostly in Germany (49 TWh), Italy (26 TWh), Spain (15 TWh) and France (13 TWh). In Poland, 2 TWh came from solar energy. In the case of biofuels in the EU countries, the most energy from this source in 2019 was generated by Germany (45 TWh), followed by Great Britain (32 TWh) and Italy (18 TWh). In Poland, biofuels accounted for 7.5 TWh of energy [
61,
62].
Summing up, it can be said that all renewable energy sources are promising and should play a leading role in the fight against global warming. Striving for sustainable energy development should be the basis of energy transition all over the world. The development of renewable energy must be included in the strategic goals of each country. All countries in the world should also limit the use of fossil fuels in favour of renewable energy sources, and energy transformation should be treated as a civilization challenge.
The use of photovoltaic energy is a way to achieve a better renewable energy share. Up till the 21st century fossil fuels were used to satisfy the energy needs in spheres of human life which were energy intense. However, next, growth in the case of environmental pollution was a matter of seeking alternatives to non-renewable resources such as fossil fuel [
63].
Photovoltaic energy is one of the types of renewable energy. The nowadays observed shift towards the use of renewable energy resources such as photovoltaic energy is mainly due to environmental reasons. The existing emphasis on decarbonization and quick energy transformation from the usage of fossil fuels towards renewable energy resources is because authorities want to mitigate risk, which is posed by anthropogenic influence on the earth’s climatic system.
The level of accessibility of renewable energy sources is determined by many factors. Among them one of most important is connected with accessibility and the abundance of particular sources in a given region along with local topography [
64]. Photovoltaic electricity is produced using photovoltaic cells. These cells are the smallest elements of solar panels. The more cells are in the panel, the greater its capacity. Nowadays, photovoltaic cells are used to illuminate houses and streets. In this way we can obtain electricity in the situation where access to a grid is not possible [
65]. The main advantages of solar energy are connected with: the broad availability of the energy source; zero cost of consumption of power after the end of the period return of investment, the environmental friendliness of this energy source; and zero impact on the earth’s energy balance. The main problems connected with this energy source are: problems with storing solar energy, the relatively high cost of the installation, the high dependence of power on seasonality and the energy panels, which need a very large area to be installed [
66,
67].
To deal with some of the drawbacks of photovoltaic energy we can integrate a photovoltaic fuel cell system with the usage of hydrogen. The purpose of this type of integration is to achieve integrated qualities that can be seen when we use hydrogen power or photovoltaic power individually [
68]. The main objective of using a mix of hydrogen and photovoltaic energy is the possible increase in energy efficiencies, improvement of the reliability of the energy system, reduction in overall costs and reduction in the level of emission of greenhouse gases [
69]. There are many potential solutions involving mixing photovoltaic and hydrogen energy, including a parabolic dish–eRankine- organic cycle–fuel cell system [
70], cell–microturbine system [
71,
72] integrated PV–wind turbine–battery–diesel system [
73], hybrid solid oxide fuel cell (SOFC)–thermovoltaic system 7 [
74] and PV–fuel cell–diesel system [
75].
3. Materials and Methods
The analysis was prepared based on data on the photovoltaic energy market in European Union countries, which is annually published in Photovoltaic Barometr. Photvoltaic Barometr is an annual report on the renewable energy market [
21,
22,
23,
24,
25,
76]. Reports have measured the renewable energy market and progress made by renewable energy sector since 1998. The data in reports consist of all sectors of renewable energy in all European Union states. In this paper we concentrated only on data connected with photovoltaic energy.
The publication also set out to explore the relationships between the data collected and other country-specific indicators. In particular, data on GDP per capita calculated at purchasing power parity for 2019 and data on cultural characteristics of individual countries were used. Data on GDP per capita were taken from the International Monetary Fund and World Economic Outlook databases [
26].
In order to analyse the impact of cultural indicators, indicators of a country’s culture were used—in particular the indicator of a country’s long-term orientation. The indicators developed by Hofstede Insight—an international organisation providing data on measuring the culture factor for many countries in the world [
76]—were used for the analysis. In particular, the long-term orientation indicator was used. Long-term orientation refers to persistence, adaptability and thinking about long-term effects of a particular economic decision. For the calculation of per capita indicators, data on population in European Union countries were used [
77]. To analyse the relationship between photovoltaic capacity and average country temperature, data on average annual temperatures of individual countries in the European Union were used [
78].
For the analysis of the relationship between electricity production and production per capita and other parameters the analysis was done for countries where the level of energy production from solar photoviltaic was greater than 200 MW in 2019. The analysis was carried out for the following countries: Germany, Italy, United Kingdom, France, Spain, Belgium, Greece, the Netherlands, the Czech Republic, Romania, Austria, Bulgaria, Portugal, Denmark, Hungary, Slovakia, Sweden, Poland, Slovenia and Finland.
The aim of the research conducted was to answer the following research questions:
How has the level of photovoltaic energy use changed in the European Union countries between 2014 and 2019?
Which European Union countries are most advanced in the use of photovoltaic energy?
Does cultural long-term orientation affect the use of photovoltaic energy in European Union countries?
Does the level of GDP per capita affect the use of photovoltaic energy in EU countries?
Does climate influence the use of photovoltaic energy in EU countries?
We formulated three hypotheses in the study:
Hypothesis 1 (H1). There is a statistically significant correlation between a country’s long-term orientation and its use of photovoltaic energy in European Union countries.
Hypothesis 2 (H2). There is a statistically significant correlation between GDP per capita and photovoltaic energy use in European Union countries.
Hypothesis 3 (H3). There is a relationship between climate and photovoltaic energy use in European Union countries.
4. Data and Analysis
Table 1 collects data on the development of the amount of energy produced by photovoltaic sources between 2014 and 2019. The phenomena are illustrated in
Figure 1 and
Figure 2. We present the statistical data for the years 2008–2013 in
Table 2. When comparing the data in
Table 1 and
Table 2 we can observe that the tendency to add new photovoltaic capacity is not growing. In most of the leading countries the increase in amount of photovoltaic capacity growth between 2003 and 2008 was greater than in the years 2014–2019.
An analysis of the data collected in
Table 1 shows that in 2019, the top countries were Germany—19,016 MW; Italy—20,864 MW, United Kingdom—13,616 MW, France—10,575 MW and Spain—9232 MW. The photovoltaic capacity value for all European Union countries in 2019 was 133,663 MW.
The European lead did not change throughout the study period from 2014; however, there were slight shifts between countries.
Table 3 shows the top five places over the period 2014–2019, with the only change occurring between 2014 and 2015 when the order changed between the United Kingdom and France.
The dynamics of photovoltaic capacity addictions varied across the countries analysed.
Table 4 presents data on photovoltaic capacity addictions in the studied countries in 2015–2019. The phenomenon is illustrated in
Figure 3.
The analysis of changes in individual years shows different strategies used by individual countries to increase photovoltaic capacity. Some countries increased their photovoltaic capacity relatively similarly over the entire period under study—an example of such a country is France, where photovoltaic capacity increased by approximately 1000 MW each year (with the exception of 2017, where the increase amounted to 1446 MW). In other countries such as Germany there is a clear upward trend—during the period under review there was an increase in installed photovoltaic capacity in consecutive years from a level of 1563 MW in 2015 to a level of 3834 MW in 2019. In other countries a sharp increase occurred in 2019—such examples include: Spain, with an increase of 3993 MW in 2019 and Belgium with an increase of 3544 MW.
Due to the significant differences between the individual years, contrary to the total photovoltaic capacity in this case, there are significant shifts in the first places in terms of installed photovoltaic capacity for the following years. The top five positions in this respect are summarised in
Table 5.
The differences between
Table 3 and
Table 5 is that in
Table 3 we analysed the data on the sum of photovoltaic capacity in the EU countries, but in
Table 5 we analysed the amount of photovoltaic capacity installed only in a particular year.
Figure 3 shows the change in photovoltaic capacity in the surveyed countries over the period 2014–2019. The largest number of photovoltaic cells was installed in Germany during this period, at 10715 MW. The United Kingdom is next with 8386 MW followed by the Netherlands with 5824 MW. The next three countries that increased their photovoltaic capacity by 4000–5000 MW during the period under study are, respectively: France—4975 MW, Spain—4445 MW and Belgium—4425 MW.
The analyses presented so far have taken into account the population level of a given country, which has meant that countries with higher populations tended to take top positions. In the next stage of the study, we decided to check the level of photovoltaic capacity per capita in the studied countries. The result was given in W/inhabitants. The collected data are summarised in
Table 5.
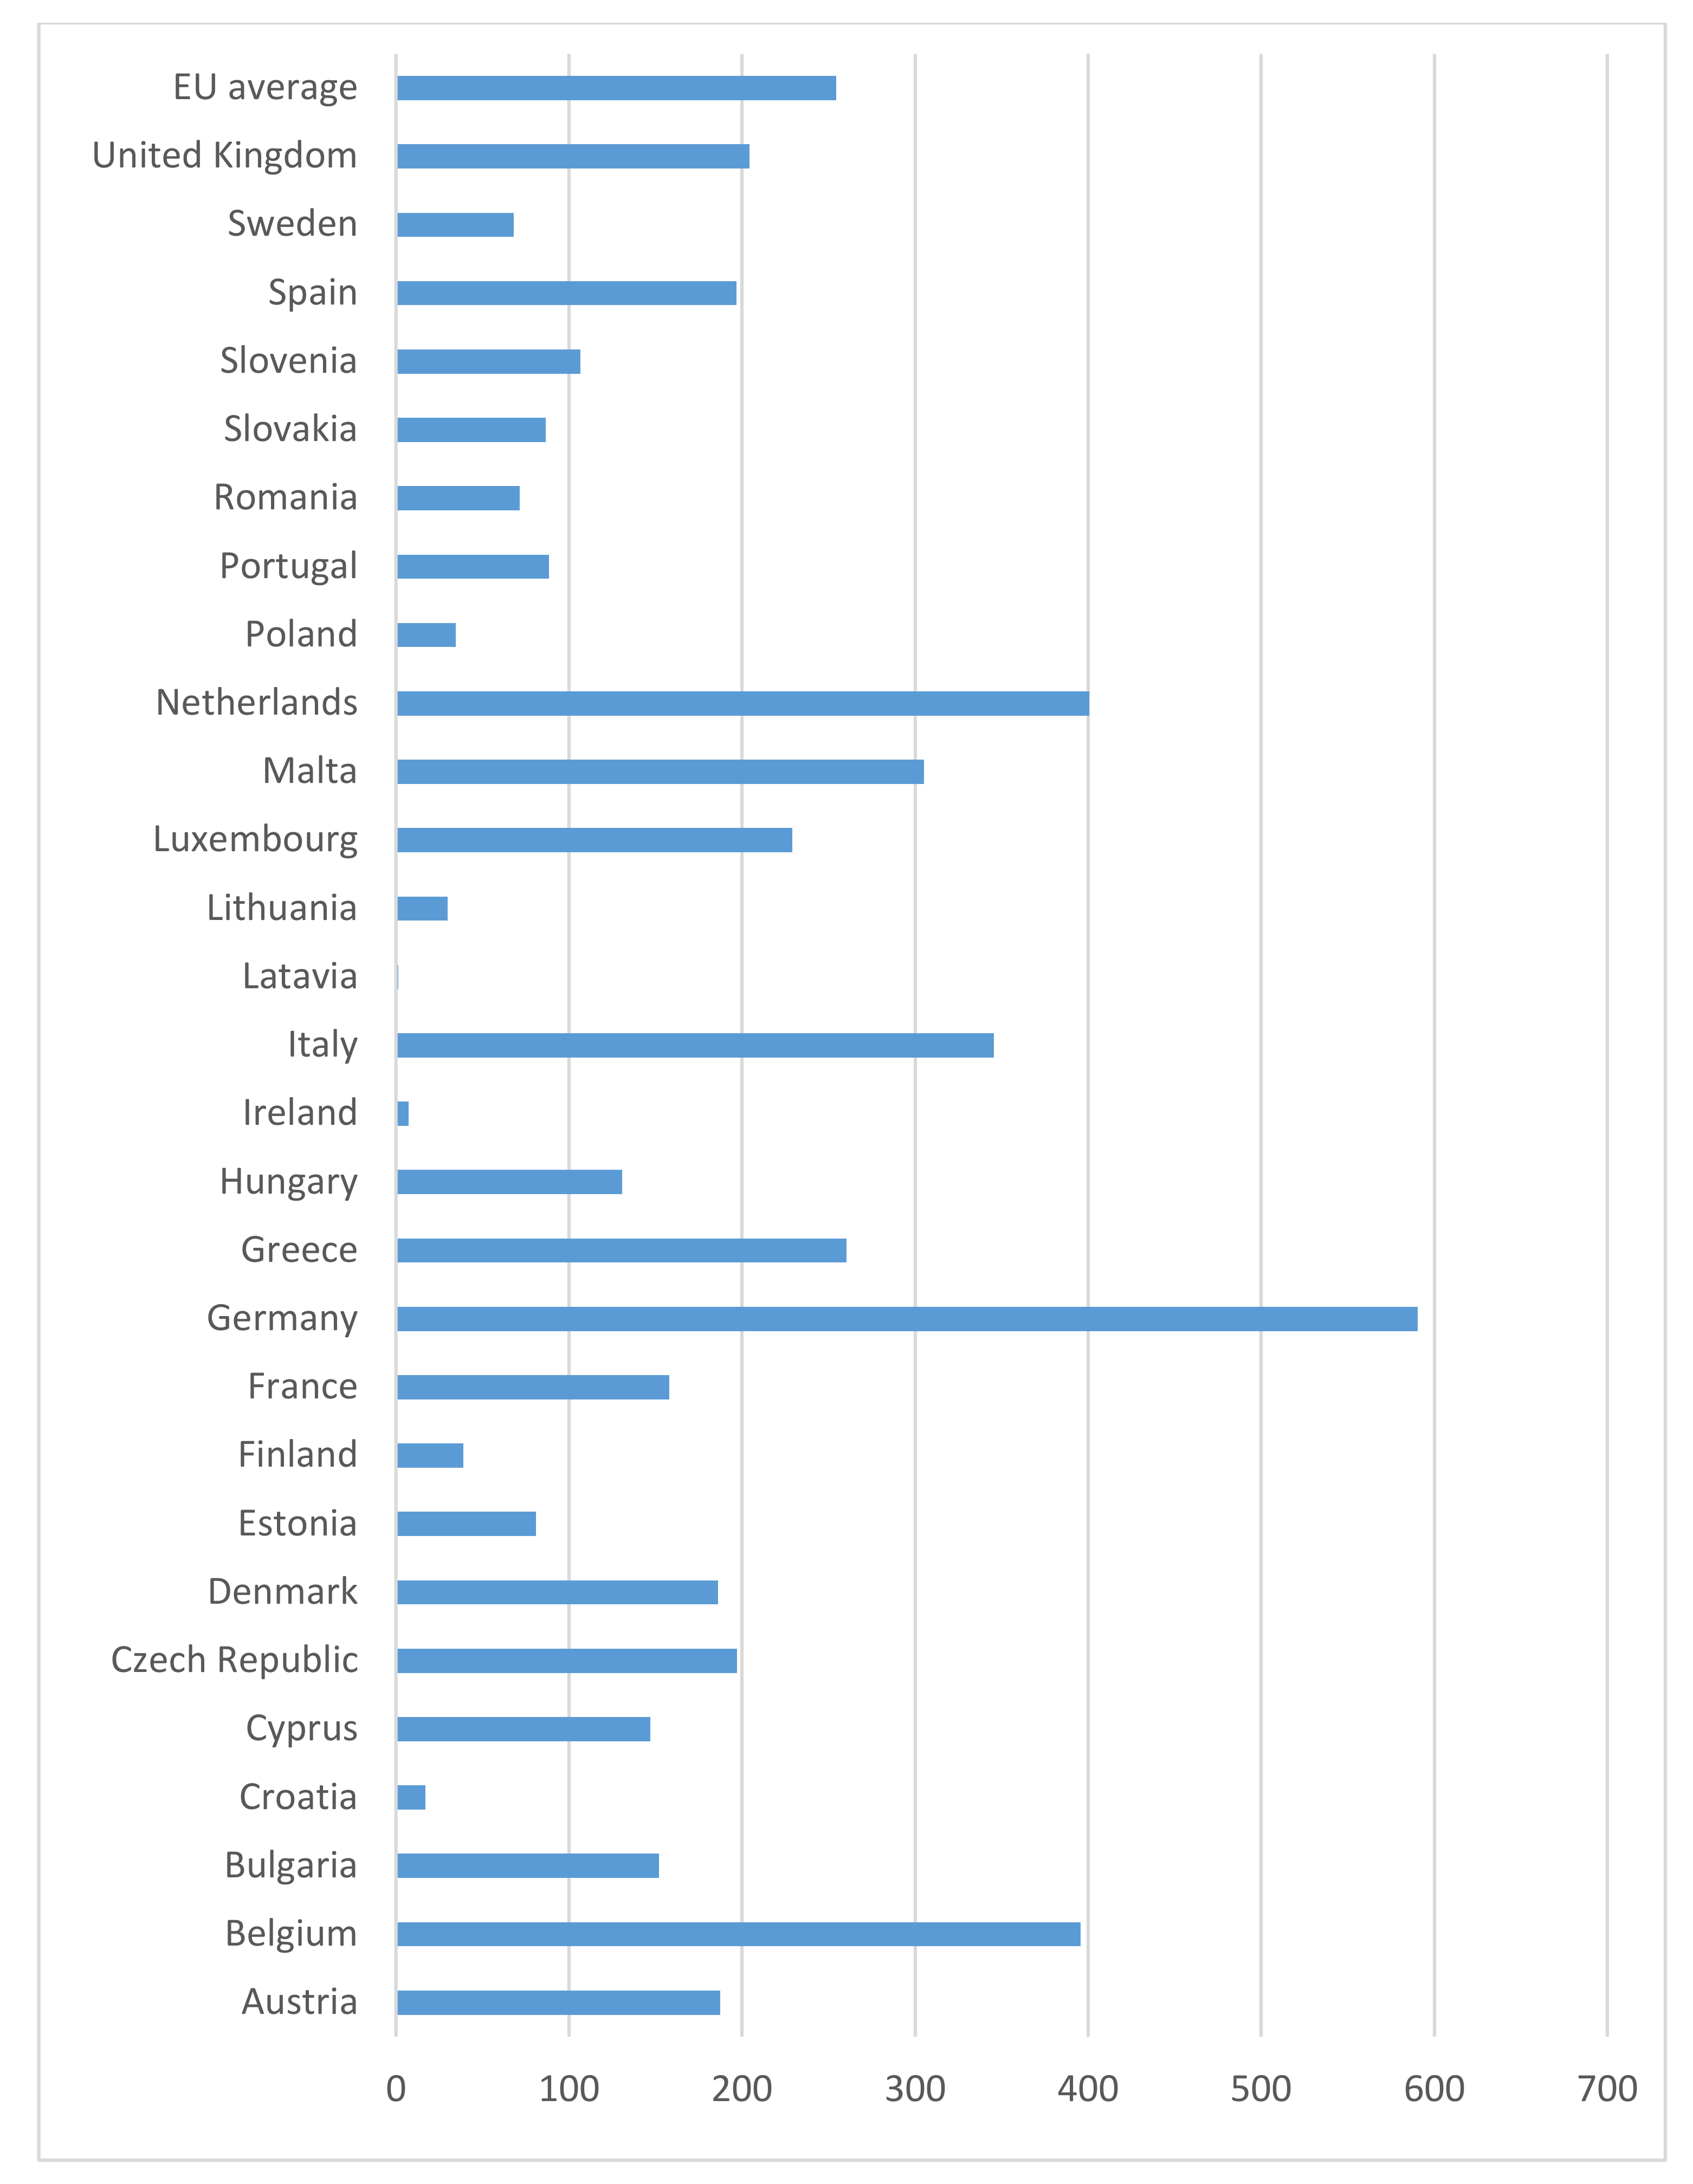
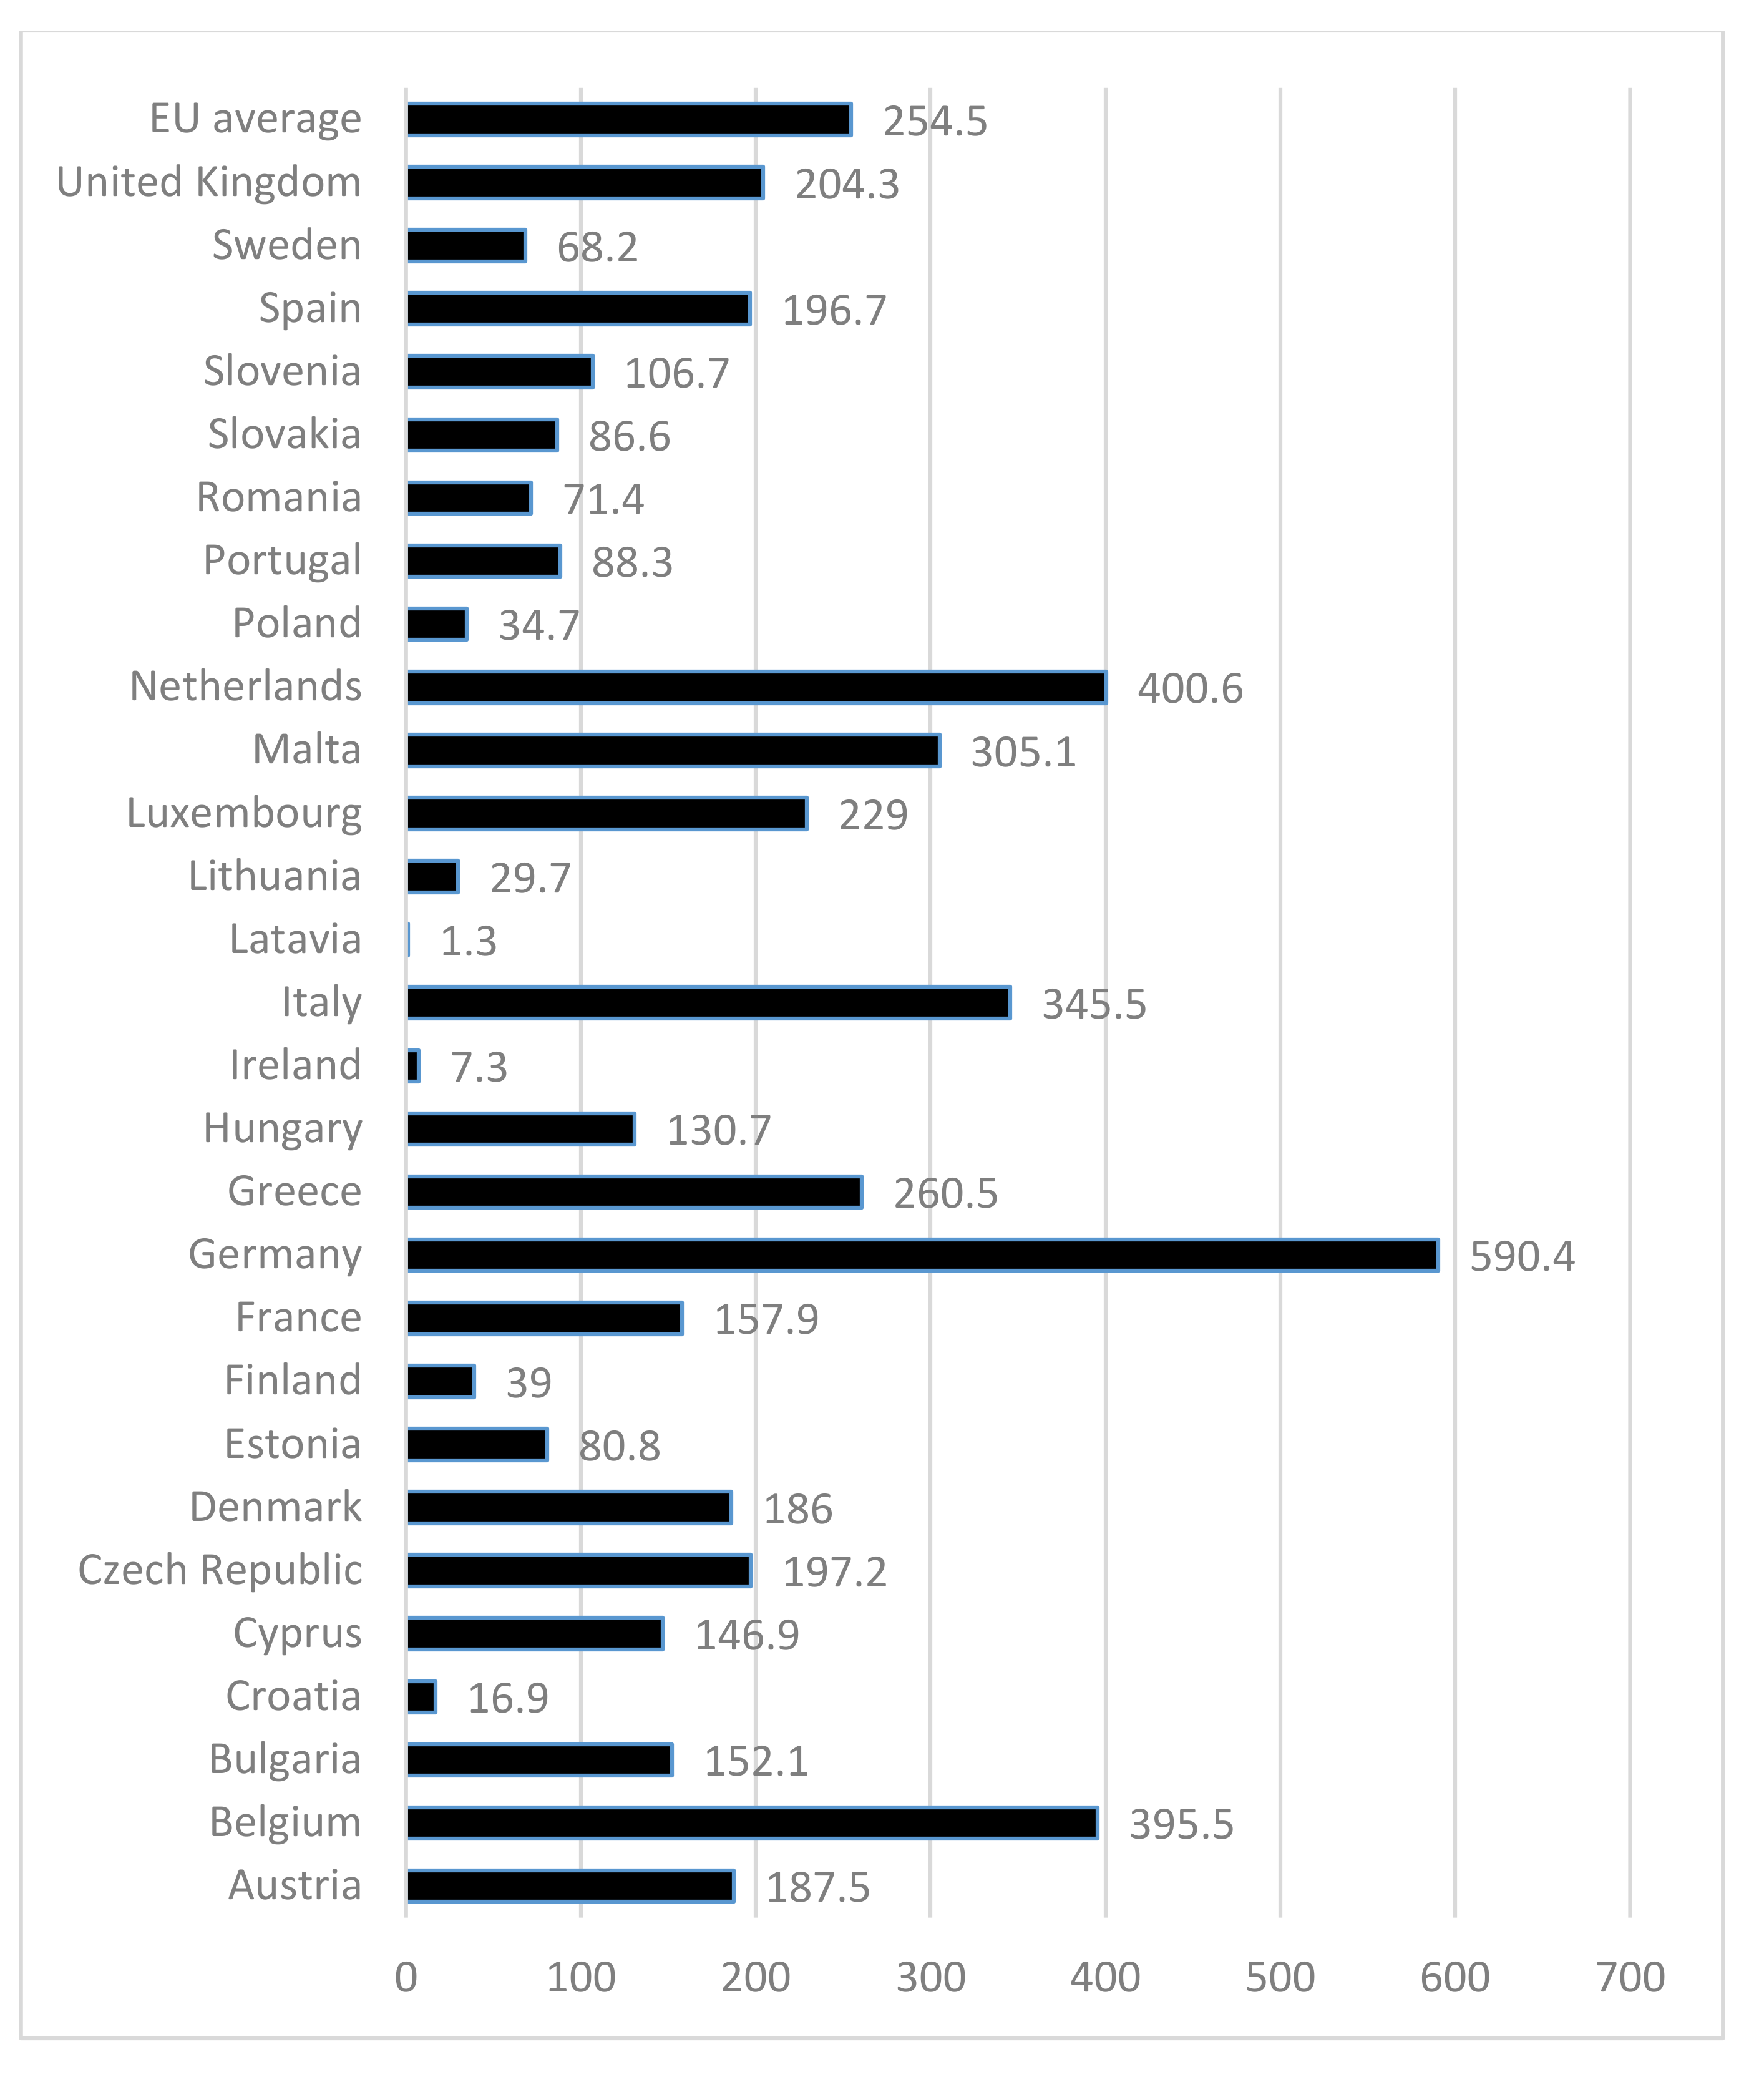
Figure 4 shows the result for the years 2014–2019.
In the case of photovoltaic capacity per capita in 2019, Germany had the highest level with 590.4 (W/inhabitant), followed by the Netherlands with 400.6 (W/inhabitant) and Belgium with 395.5(W/inhabitant). In fourth place was Italy 345.5 (W/inhabitant) and Malta with 305.1 (W/inhabitant). For the whole European Union the average was 254.5 (W/inhabitant) per capita.
Figure 5 presents a summary of photovoltaic capacity per inhabitant for 2019.
Table 6 lists the top five countries in terms of photovoltaic capacity for the period 2014–2019. Compared to the results of photovoltaic capacity calculated in absolute numbers (
Table 1 and
Table 2) in both cases Germany is in first place; it is by far the most advanced country in the European Union in the case of implementation of solar energy as an energy source. Italy is also very high in both classifications. The analysis of photovoltaic capacity per capita shows a high level of photovoltaic implementation in the Benelux countries—Belgium, the Netherlands and Luxembourg—which, due to their small size, are not at the top in terms of absolute numbers but have a very high level of photovoltaic saturation. Malta, Greece and the Czech Republic also have high levels of photovoltaic use per capita. In contrast, France and Spain have a high photovoltaic capacity due to their large size but are below the EU average on a per capita basis.
In
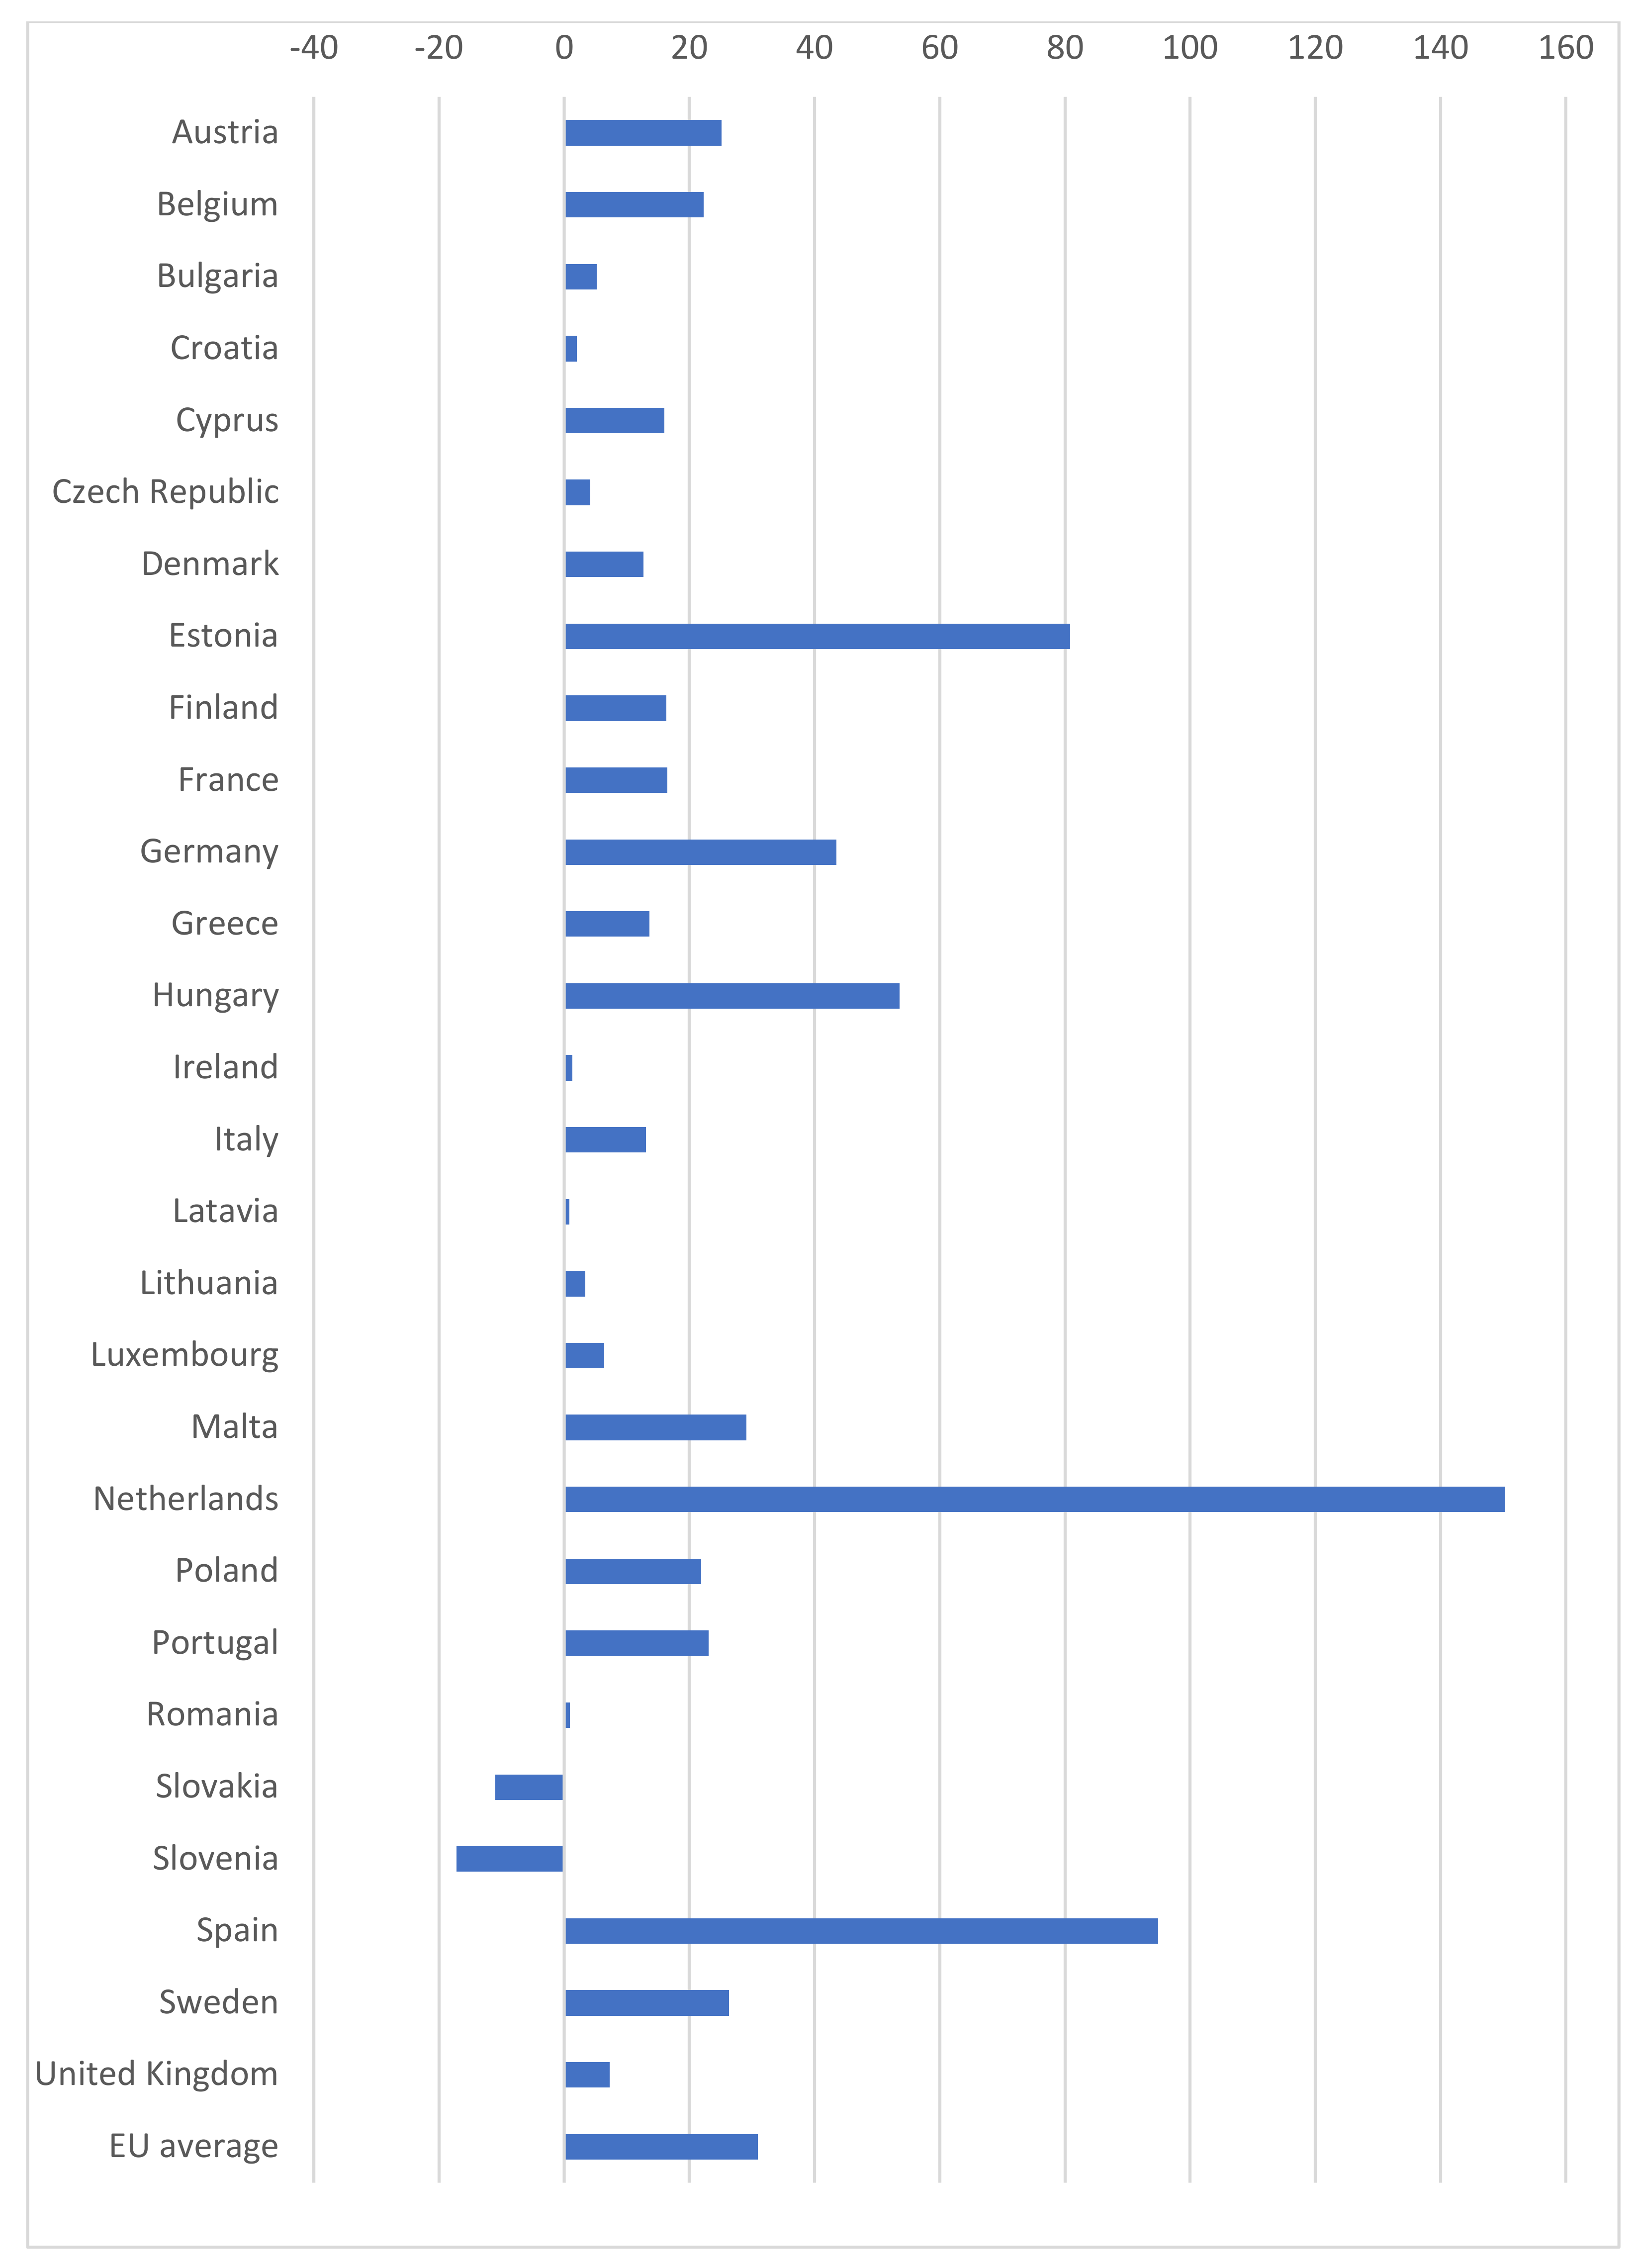
Table 7 we present the data on the yearly capacity additions in European Union countries in the years 2015–2019. In
Table 8 we give a juxtaposition of the five best countries in the case of increases in photovoltaic capacity in particular years. In 2019, the largest increase in photovoltaic capacity per person occurred for the Netherlands with 150.3 (W/inhabitant). In second place was Spain with 94.9 (W/inhabitant). In third place was Estonia with 80.8 (W/inhabitant(, fourth was Hungry with 53.6 (W/inhabitant) and fifth was Germany with 43.5 (W/inhabitants). The average for European Union countries was 30.9 (W/inhabitants). In recent years, a particularly fast increase in photovoltaic capacity per habitants can be observed in the Netherlands, Belgium and Hungry
Table 9. It is worth noting that in 2019 the investment in photovoltaic capacity significantly accelerated compared to the previous year. Between 2015 and 2018, the annual average increase in photovoltaic capacity in EU countries varied between 10 and 15 (W/inhabitant). In 2019, it increased by 100% and amounted to 30.9(W/inhabitant).
The use of photovoltaic energy requires investment before it is economically viable.
Figure 6 shows the relationship between photovoltaic energy production per person in EU countries in W/inhabitant (for countries where this level exceeds 200 TWh) and the level of GDP per capita calculated as purchasing power parity. The analysis of the graph shows that there is a statistically significant correlation between the data (at the level of statistical significance α = 0.05) with a value of 0.45. According to the Guilford classification [
79], the magnitude of the correlation can be considered as average. The data support H2 regarding the existence of a statistically significant correlation between GDP per capita and photovoltaic energy use in the European Union countries.
The relationship between the studied variables can be expressed by the following equation:
The analysis shows that the involvement of countries in the development of photovoltaic energy is correlated with their wealth. The higher the per capita income of a country, the more modern are the energy solutions used in that country, such as the use of energy from renewable sources. Two groups of countries are worth noting in the figure:
Countries that have a significantly lower level of photovoltaic energy use compared to their wealth—these include Sweden, Finland and Poland. These countries, especially Finland and Sweden, are located in a cold climate where the use of photovoltaic panels can be difficult. For this reason, they do not install as many photovoltaic panels despite their relatively high wealth.
Countries where the level of photovoltaic use is higher than their wealth would suggest. This includes in particular three countries—Greece, Italy, Belgium and Germany. In the case of Greece and Italy in particular, the widespread use of photovoltaic panels is most likely due to their warm climate, which favours the use of solar energy to a large extent.
The next stage of the study analysed the relationship between the average temperature in a country and the photovoltaic capacity per inhabitant. In this case, no statistically significant correlation was found between the variables (at the statistical significance level α = 0.05). The data collected do not support H3 as follows: there is a relationship between climate and photovoltaic energy use in European Union countries. Although there is no statistically significant correlation between the variables, the analysis of the scatter plot (
Figure 7) identified a group of countries with very high values of photovoltaic capacity per capita at average temperatures, such as Germany, Belgium and the Netherlands. This lack of a direct correlation between national average temperature and the photovoltaic power in particular countries can be due to the mixed effect of high temperature on solar cells, especially in the situation of high radiation. Sometimes high radiation can have positive effect but sometimes also a negative effect on cell power [
38,
39,
42].
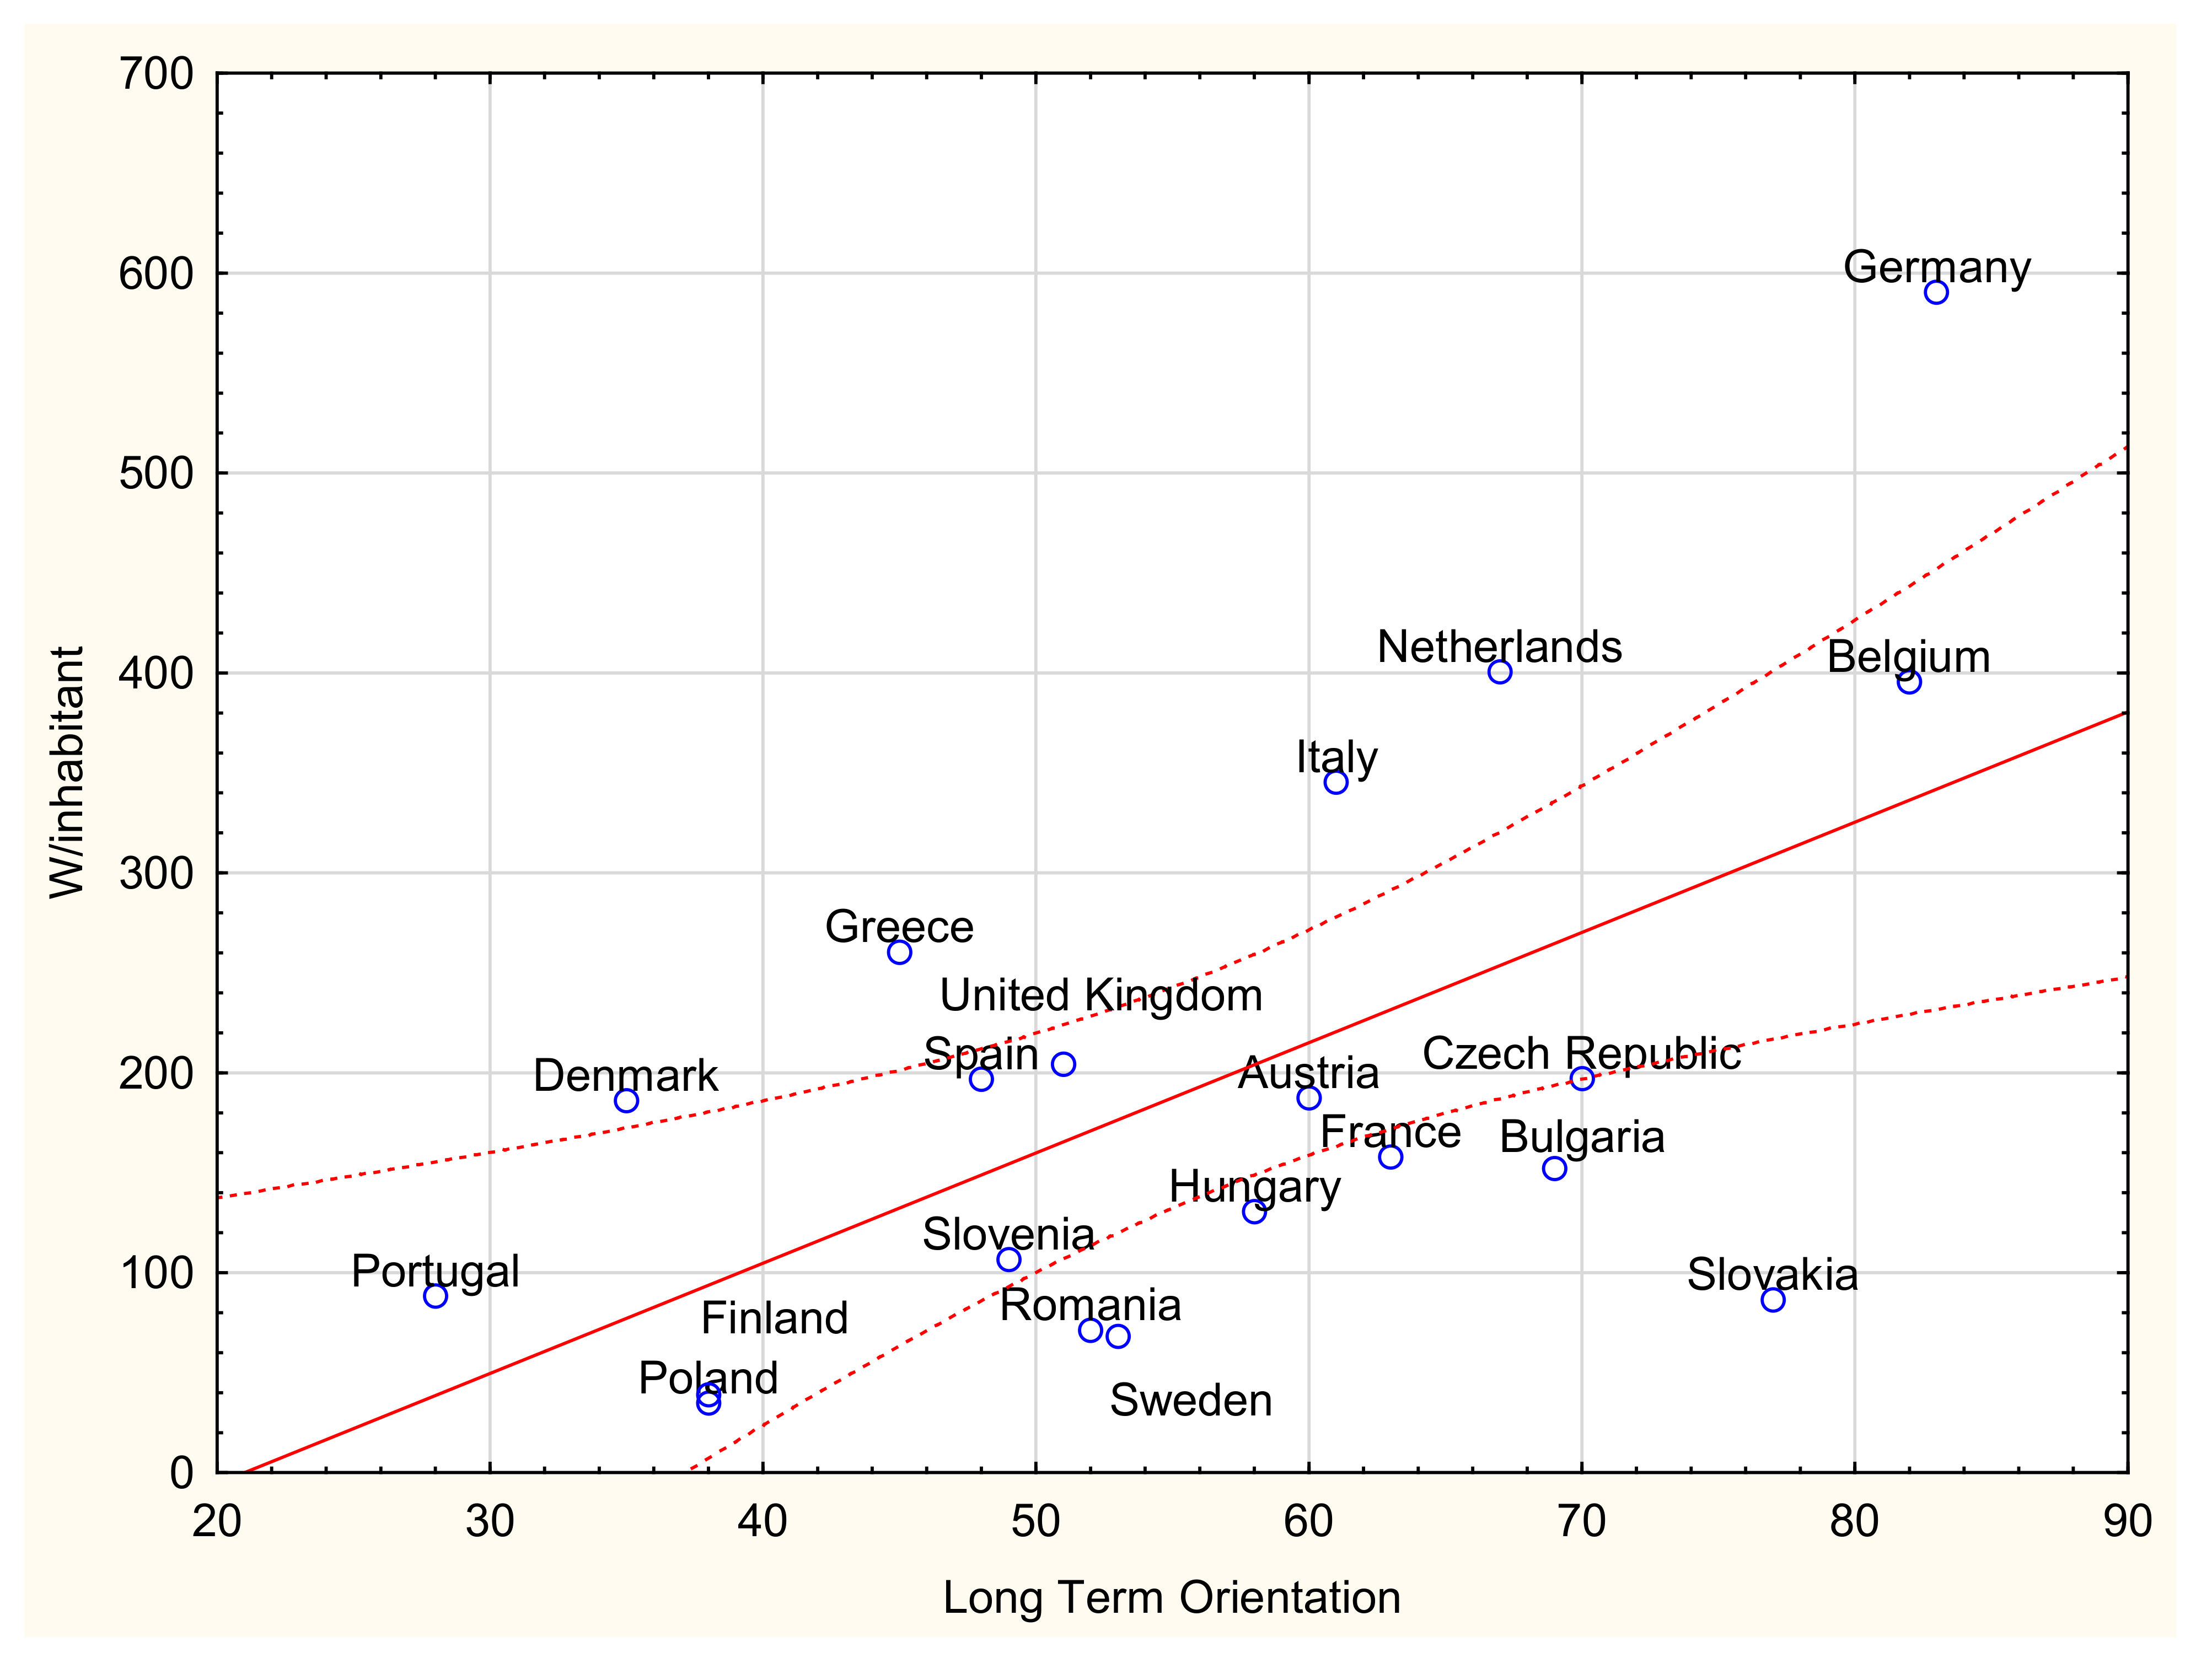
The data analysis also showed the existence of a statistically significant relationship (at the level of statistical significance α = 0.05) at the level of 0.6 between the photovoltaic capacity per inhabitant and the value of the long-term orientation of a given country (it is one of the indicators characterising the culture of a country according to the concept of G. Hofstede). This correlation can be considered, according to the Guilford classification [
79], as high. The data support the hypothesis H1 regarding the existence of a statistically significant correlation between the long-term orientation of a country and the use of photovoltaic energy in the European Union countries. In particular, this can be seen in the case of Belgium and Germany—two countries characterised by the highest long-term orientation index among the countries analysed and at the same time very high values of photovoltaic capacity per capita. Conversely, for countries such as Portugal, Poland and Finland, the low long-term orientation (i.e., short-term orientation) results in these countries not investing in modern clean energy technologies, such as photovoltaic technologies.
The relationship between the studied variables can be expressed by the following equation:
Figure 8 shows a graph of the relationship between production of the analysed variables.
In the case of countries such as Slovakia, Sweden, Romania, Hungary, France and Bulgaria, their level of photovoltaic capacity saturation is lower than would be indicated by the long-term orientation indicator for their country.
The opposite is true for Germany, the Netherlands, Italy, Greece and Denmark—in these countries the level of solar energy use and their photovoltaic capacity per capita performance is higher than indicated by their long-term orientation indicator.
5. Discussion
All EU Member States, aiming to counteract climate change, have taken strategic actions, the effect of which is energy system transformation. The goal of the undergoing transformation is to improve energy security and the attractiveness of the economy. In the literature on the subject, energy transformation is understood as striving for economic sustainable development, in which energy efficiency, low-emission energy sources and electromobility are aimed at environmental protection [
2,
80,
81,
82,
83,
84,
85]. According to researchers, when considering the development and use of renewable energy sources in individual countries, one must look at energy transformation as a complex process consisting of economic, social and industrial factors. Energy transformation in an economic context is related to the technological modernization of energy production processes. This favours the development of new branches, the so-called “Green economy”, improves competitiveness and may have an impact on the growth of GDP in individual EU countries [
2,
82,
84,
85,
86].
The development of renewable energy sources in the EU countries depends on their prosperity. The European leader in the use of renewable energy sources is Germany. The development of renewable energy sources is also conducive to the growth of employment. The so-called eco-jobs are created, which allows combining economic goals with environmental policy. The European Union has also developed a new industrial policy, in which modernising and innovating the technologies of renewable energy production through creating intelligent energy transmission networks—the so-called Smart Grid, popularization of electric vehicles as well as investments related to the concept of electromobility are vitally important [
2,
82,
84]. The EU countries focus on energy efficiency, which is related to one of the goals of the EU sustainable energy policy. The social aspect is also of great importance in the process of energy transformation. The use of renewable energy sources reduces air pollution, which lowers public health expenditure and, consequently, reduces the negative impact of the energy sector on human health. The energy transformation brings positive social effects, such as better air quality, new jobs, and increased purchasing power. However, attention should also be paid to the disadvantageous aspect of reducing the number of jobs in other sectors of the economy related to the extraction of combustible minerals. Therefore, the EU countries must take these problems into account when creating strategies for the development of renewable energy sources [
2,
83,
84,
85].
Since the introduction of the first European directive on renewable energy sources in April 2009, the installed solar capacity in the European Union and Great Britain has increased more than 10 times, from 11.3 GW in 2008 to more than 134 GW in 2019 [
80,
83,
84].
Approximately 60% of it includes residential and commercial rooftop installations. At the end of 2019, the total power from photovoltaic energy in the European Union and the United Kingdom was 635 GW, which accounted for 21% of all the power in the world. The contribution of photovoltaic energy in reducing greenhouse gases is expected to reach 55% by 2030. The long-term EU strategy (LTS) by 2050 assumes that there must be a rapid increase in renewable energy sources in the service sector as well as in transport, so that in 2050 energy from renewable sources in the EU countries will be close to 100% [
80,
81,
82,
86]. The European Union has the best defined and established goals in the world regarding the policy of renewable energy sources. However, it must be emphasized that in individual EU countries the use of photovoltaic energy is very diverse and dependent on many factors [
80]. The development of renewable energy sources is different across the EU countries due to the different structure of the energy balance as well as political and cultural environment in which these countries are embedded. The climatic conditions and the economic level of the member states are also important. Regardless of the starting point, Member States will all pursue three goals: social expectations with regard to environmental protection, industrial development and economic growth [
87,
88,
89,
90,
91,
92]. The presented results of the analysis on the development of photovoltaic energy in the EU countries in relation to GDP per capita calculated according to the purchasing power parity and the cultural characteristics of the EU Member States enhance the knowledge of the factors influencing the energy transformation process in individual EU countries [
93].
The increase of photovoltaic power usage in annualized EU countries can be in the future connected with the widespread of usage of mix hydrogen energy and photovoltaic energy. This system seems like environmentally sustainable and because of that can be used for grid-connected and also for non-grid application [
68]. This mix can lead to creation of clean fuel transportation using hydrogen powered by solar energy. For example, hydrogen can be generated by solar photovoltaic and in the next stage stored and used [
94]


