1. Introduction
Under the requirement of the strategic objectives of “carbon peaking” and “carbon neutralization”, the new energy represented by wind power and the photovoltaic energy has gradually replaced the conventional power generation unit and has begun to access a large number of microgrids [
1,
2,
3]. Microgrids support efficient and stable network operation for multiple power sources and loads. They can operate in parallel with the conventional main power network or independently. Currently, the economic efficiency and reliability of microgrids are being studied [
4,
5].
Zhu et al. [
6] built a combined power generation system model of wind–photovoltaic storage. In this work, the optimal comprehensive economy of a microgrid in daily operation was set as the objective function and the system network loss and the flexible load coordination cost of abandoning wind power and abandoning photovoltaic energy were set as optimization variables. Wang et al. [
7] established an optimal dispatching microgrid model with the goal of minimizing the cost of environmental protection. According to the characteristics of power consumption in Indonesian islands, Fauzan et al. [
8] proposed an optimal BES dispatching control strategy to optimize the size of power generation modules for hybrid power generation systems composed of a diesel generator, photovoltaic technology, and battery energy storage. By using the distributed modeling method, Yang et al. [
9] established an economic optimal dispatching CCHP microgrid model with IDR. For battery degradation and reliability problems, Alireza et al. [
10] proposed an economic optimization model for independent multi-carrier microgrids in which the total annual cost was considered. Javid et al. [
11] analyzed the load characteristics of the industrial microgrid in Pakistan’s Faisalabad and proposed an economic optimization model for the industrial microgrid on the basis of HOMER software. Ghaithan et al. [
12] proposed a optimization model of the solar wind power grid connection system based on the load demand of industrial facilities in Saudi Arabia. Wang et al. [
13] studied the role of interconnection switches in optimizing distribution systems operation. Wang et al. [
14] proposed a distributed energy management system for microgrids in grid-connected and islanded modes. Zhang et al. [
15] proposed an economic optimization model for microgrids based on peak shaving and CO
2 reduction effect. Ding et al. [
16] proposed a hybrid robust/stochastic economic optimization model by considering cogeneration (CHP) units, boiler units, electric energy storage (EES), thermal energy storage (TES), electric to gas (P2G) storage, and wind turbines. Gibran et al. [
17] proposed a hierarchical control scheme that can achieve primary descent control and centralized extended optimal power flow control. Alshehri et al. [
18] proposed a new economic evaluation and analysis framework for investing in microgrid. Wang et al. [
19] proposed an economic optimization model for the microgrid based on the chaotic sparrow search algorithm.
Zhao et al. [
20] proposed a distribution network reliability evaluation method that converts the outage time, outage range, and system power shortage into the power supply reliability cost. Liu et al. [
21] proposed the reliability evaluation method for a microgrid based on consumer perception. According to the requirements for high reliability and lean planning for an urban middle-voltage distribution network, Sun et al. [
22] put forward the concept of modularization, reliability analysis, and a comprehensive evaluation method. Adefarati and Bansal [
23] conducted lifecycle analysis on a microgrid system composed of photovoltaics, wind turbine, power storage system, and diesel generator. In view of the complex structural problems, Mohammada and Gerald [
24] simplified the topological structure, obtained the minimum path and the minimum cut set, and evaluated microgrid reliability. Based on the multi-scenario analysis method, Vinicius and Carmen [
25] evaluated the reliability and economy of a distribution network with distributed generation. The impact of the automatic operation of the power grid and load response were also considered. Based on model order reduction and the Monte Carlo simulation method, Ndawula et al. [
26] evaluated the reliability of flexible power networks with distributed energy resources. Based on machine learning, Li et al. [
27] proposed a reliability evaluation framework for power distribution networks.
In terms of the economy and the reliability of microgrids, many research results have been achieved. However, it is necessary to comprehensively consider a variety of factors and conduct a comprehensive evaluation in combination with the actual scenario [
28,
29].
Based on the above analysis, a microgrid with wind–photovoltaic-load storage is taken as the research object and the lowest operation cost in one period (daily period) is taken as the optimization objective in our study. A joint optimization model for a multi-scenario microgrid with wind–photovoltaic-load storage is proposed. This model considers not only the system generation cost, discharge cost, power purchase cost, electricity sales revenue, etc., but also the battery charging and discharging power constraints and the charging and discharging time constraints. Additionally, the algorithm for solving the optimization model is given. In addition, taking the Wangjiazhai project in Baiyangdian region as the application scenario, the effectiveness of the proposed model and algorithm is verified. Meanwhile, the economic dispatching model of a microgrid under various scenarios is investigated and discussed fully, and the optimal economic power dispatching under corresponding scenarios is also provided.
2. The Coordination Operation Model of Microgrid in Multi-Scenario
Unlike the traditional distribution network, a microgrid is usually connected to a wind turbine (WT), the photovoltaics (PV), and a battery, as shown in
Figure 1. The wind turbine power generation converts the wind energy into AC electrical energy, and the photovoltaic power generation converts the solar energy into DC electrical energy. The wind turbine power generation and the photovoltaic power generation are vulnerable to the impact of the natural environment. A battery is applied to play the role of peak shaving and valley filling in the microgrid. The operation revenue and expenditure of microgrids can be divided into the following parts:
2.1. Operation Cost Analysis
2.1.1. Power Generation Cost
The power generation cost of the microgrid includes: the cost of wind turbine power generation and the cost of photovoltaic power generation.
In Formula (1), C1 represents the cost of renewable energy power generation generated by the microgrid operation in one period. Pw,t is the power generation of the wind turbine at t time. Pg,t is the power generation of the photovoltaic equipment. λw and λg represent the average power generation cost per kilowatt hour of the wind turbine and the photovoltaics, respectively.
2.1.2. Power Purchase Cost
During the operation of the microgrid, when the power is insufficient it needs to purchase electrical energy from the main power network to meet the load demand.
In Formula (2), C2 represents the purchase cost of electrical energy generated by the microgrid in one period. Pl,t represents the load power at t time. σ1,t represents the purchase price of electrical energy at t time. a represents the power purchase sign, that is a = {0, 1}. When the internal supply of the microgrid is greater than the load demand, a = 0. The microgrid can be self-sufficient. On the other hand, when a = 1, the microgrid purchases electrical energy from the main power network to ensure the power supply of the load.
2.1.3. Discharge Cost of the Battery
The total battery discharge cost is computed by the following formula:
In Formula (3), λbat,t is the battery discharge cost (CNY/kW·h).
2.1.4. Revenue from Electricity Sales
In Formula (4), C4 represents the electrical energy sales revenue generated by the microgrid in one period. σ2,t represents the price of the microgrid selling the electrical energy to the main power network at t time. b is the power selling decision variable of the microgrid. When the renewable energy generation power of the microgrid at t time is greater than the load power, the microgrid has abundant power production. At this time, b = 1 and the microgrid can sell the electrical energy to the main power network. When the renewable energy power generation of the microgrid at t time is less than the load power, the microgrid has no surplus electrical energy to sell and b = 0.
2.1.5. Objective Function
Minimize the operating cost of the microgrid in one period is the optimization objective based on the scheduling strategy. It should be noted that line losses in the microgrid are neglected in our study. The objective function can be defined as:
2.1.6. Constraints
(1) To protect the power supply of the wind turbine and the photovoltaics and prolong their service life, the microgrid’s output power should meet:
In Formula (6), w,t and g,t represent the output powers of the wind turbine and the photovoltaics, respectively. and represent the upper and lower limits of the output power of the wind turbine, respectively. and represent the upper and lower limits of the output power of the photovoltaics, respectively.
(2) To prevent line damage and equipment damage, the exchange power between the microgrid and the main power network should meet:
In Formula (7), and are the lower limit and upper limit of the exchange power between the microgrid and the main power network, respectively.
In Formula (8),
SOCt is the state-of-charge (SOC) of the battery at
t time.
SOCmax and
SOCmin are the upper and lower limits of the SOC, respectively. Generally,
SOCmin = 0.1~0.2 and
SOCmax = 0.8~0.9. In this paper,
SOCmin is set to 0.2 and
SOCmax is set to 0.9. The SOC value of the battery changes evenly at
t time, and the SOC can be expressed as:
In Formula (9), SOC0 represents the SOC value of the battery at the beginning of one period. Pcha,t and Pdis,t are the allowable power values of the maximum charging and discharging for the battery at t time, respectively. In this paper, the power values for the charging and discharging of the battery are less than 20% of the maximum capacity at t time. Mt and Nt are the state signs of charging and discharging, respectively. Mt = {0, 1} and Nt = {0, 1}. The battery cannot be charged and discharged at the same time. In other words, should be met. In addition, the end state and start state of the SOC values for the battery should meet SOC0 = SOCT. Thus, the scheduling scheme for the next day will not be affected by the end state of the SOC on the current day.
The number of battery state changes can affect its service life [
30]. The limits of battery charging number and discharging number in one period cannot exceed N
1 and N
2, respectively. In our study, both N
1 and N
2 are taken as 12.
(4) At any
t time, the inflow power and the outflow power in the microgrid should be balanced and meet:
In Formula (10), Pw,t is the power generated by the wind turbine at t time. Pg,t is the power generated by the photovoltaics. PMG, t is the exchange power between the microgrid and the main power network. When PMG,t > 0 it means the microgrid has insufficient power to meet the load and needs to purchase the electrical energy from the main power network. When PMG,t < 0 it means the microgrid has sufficient power to meet the load and has the ability to sell the surplus electrical energy to the main power network. When Pbat,t > 0 it means that the battery is discharged. When Pbat,t < 0 it means that the battery is charged.
2.2. Solution Algorithm of the Coordinated Operation Model of a Multi-Scene Microgrid
The coordinated operation model of a multi-scenario microgrid with wind–photovoltaic-load storage joint optimization belongs to the optimization model of nonlinear programming. Intelligent optimization algorithms, such as war strategy optimization and the artificial bee colony algorithm, can be used to solve the model. Since it has the advantages of fast convergence, good portability, and strong global search ability, particle swarm optimization (PSO) was selected for our study; comparisons between different intelligent optimization algorithms were not within the scope of our study.
In the coordinated operation model of a multi-scene microgrid, the load size and the generating capacity of the wind turbine and photovoltaics in each period have been determined. It is necessary to optimize scheduling for the load, the wind turbine, the photovoltaics, and the battery to ensure the microgrid operates economically optimally. The specific process for solving the coordinated operation model of a multi-scene microgrid are as follows, and the flow chart for the solving the algorithm based on PSO is given in
Figure 2.
(1) Initialize particle swarm parameters, including the algorithm parameters (the population size NP, the iteration number G, and the learning factors c1 and c2) and the problem dimension D. In our study, NP is set to 1000, G is set to 300, c1 and c2 are set to 1.49445. From the analysis, it can be seen that the dimension D solved the problem of the states of charging and discharging and the powers of charging and discharging for the battery in one period. Namely, D is set to 24.
(2) Generate first generation particles. A matrix with dimensions [NP, D] is randomly generated, and each element in the matrix is between 0 and 1. Each row of the matrix is a particle, and the value of the element in the i-th row and the j-th column represents the SOC value of the battery at j time for the i-th particle. To restrict the charging depth and discharging depth of the battery, it is necessary to restrict the value of each element in the matrix to within the range [0.3, 0.9]. To restrict the charging power and discharging power so as to not be higher than 20% of the rated capacity for the battery, it is necessary to determine whether the absolute value of the difference between the elements in the i-th row and the j-th column of the matrix and their adjacent elements is less than 0.2. To ensure the same SOC value at the start and end of one period, the value of the last element in matrix is equal to the initial value of SOC. Judge whether each particle meets the constraint conditions in turn. If the constraint conditions are met, the particle is a feasible solution. Otherwise, the particle needs to be regenerated to meet the above constraint conditions.
(3) Calculate the fitness value of particles. The fitness value in our study is the electrical energy consumption cost of the microgrid corresponding to each particle. The load power, wind turbine power, and photovoltaic power in each period are known. The charging state and discharging state and the charging power and discharging power of the battery are represented by particle swarm. Consequently, the total electrical energy consumption cost of the microgrid can be calculated as the fitness value.
(4) Update the individual optimum value and the global optimum value.
(5) According to the formulas for the speed and the position of PSO [
31], its speed and position will be updated. Subsequently, it is necessary to judge whether the particle meets the constraint conditions.
(6) Recalculate the particle fitness value and reupdate the individual optimum value and the global optimum value. The method is the same as Step 3 and Step 4.
(7) If the termination condition is reached, end and output the optimal solution. Otherwise, return to Step 5. The optimal solution is the optimal economic power dispatching arrangement of a microgrid with wind–photovoltaic-load storage.
3. Case Study
Wangjiazhai project contains multiple elements of the source–network-load storage system in the Baiyangdian region, is a typical scenario for the application of new energy, and has strong representativeness [
32]. This paper takes the Wangjiazhai project as the practical application background. To better reflect the dynamic dispatching occurring in the microgrid, four scenarios are discussed and investigated fully. The calculation period is set to 1 day (d) in each scenario, which is divided into 24 time-intervals. The economic evaluation index is electrical energy cost generated by the microgrid, and the related parameters are shown in
Table 1,
Table 2 and
Table 3 [
33,
34,
35].
(1) Scenario 1: The electrical energy generated by the wind turbine and the photovoltaics is fully utilized and the battery does not work.
In Scenario 1, the renewable energy power generation of the microgrid is fully utilized and the battery does not participate in dispatching. The electrical energy generated by the wind turbine and the photovoltaics shall first meet the load demand of the microgrid. If the electrical energy generated by the wind turbine and the photovoltaic is greater than the load demand, the surplus electrical energy is uploaded to the main power network. Otherwise, it needs to purchase electrical energy from the main power network to meet the load demand. The microgrid model in Scenario 1 evolves, as shown in
Figure 3. The power curves for the load, WT, PV, and the renewable energy (WT and PV) in one period are shown in
Figure 4.
As indicated in
Figure 4, during the period 0:00–9:00 the wind turbine has high power generation, there is low photovoltaic power generation, and the load shows a fluctuating upward trend. The power generation of the renewable energy is greater than the load demand and the active power distribution network sells the electricity to the main power network. During the period 9:00–10:00, the power generated by renewable energy is less than the load and the microgrid will purchase electricity from the main power network. During the period 10:00–12:00, the power generation of the renewable energy is greater than the load and the active power distribution network sells the electricity to the main power network. During the period 13:00–24:00, the photovoltaic power gradually decreases to zero and the power of wind turbine shows a fluctuating decreasing trend. The power generated by the renewable energy is less than the load and the microgrid will purchase electricity from the main power network.
(2) Scenario 2: The electrical energy generated by the wind turbine and the photovoltaics is fully utilized and the battery participates in scheduling.
In Scenario 2, the renewable energy power generation of the microgrid is fully utilized and the battery participates in scheduling. The power exchange between the microgrid and the main power network does not set the upper limit. At this time, the renewable energy power generation can not only supply power for the load demand but can also be used to charge the battery in the microgrid. In addition, it can also sell the electrical energy to the main power network. The battery can be charged using either the electricity generated from the renewable energy or the electricity purchased from the main power network. The microgrid model in Scenario 2 evolves, as shown in
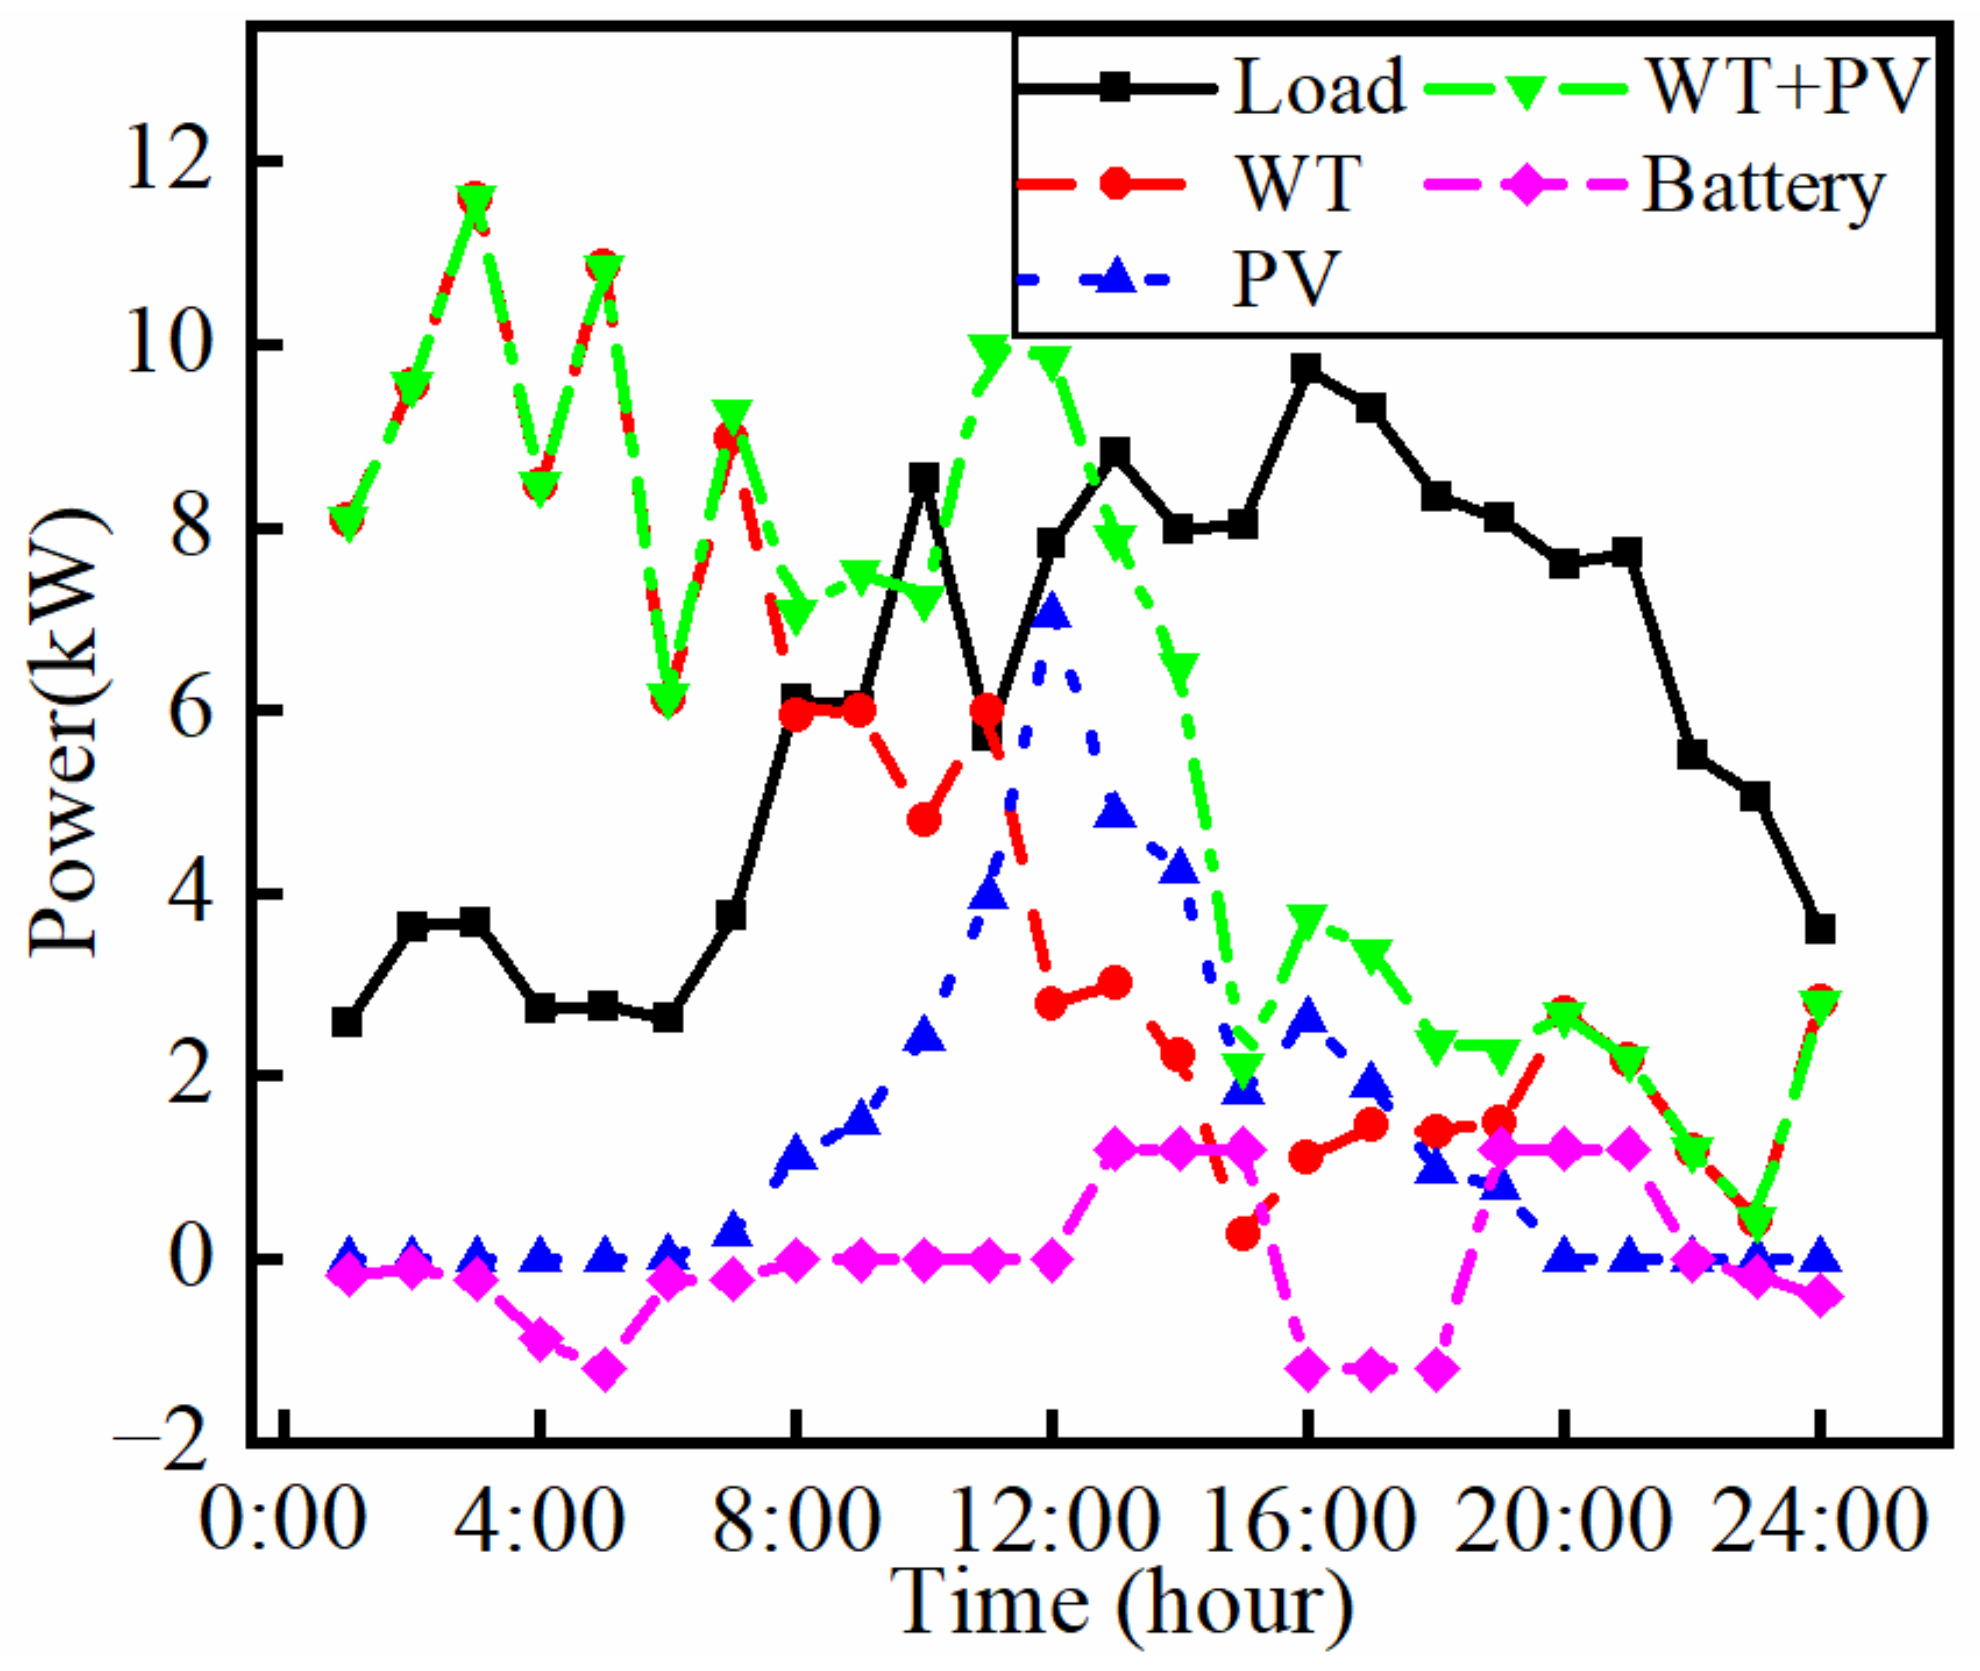
Figure 5. The power curves for the load, WT, PV, and the renewable energy (WT and PV) in one period are shown in
Figure 6, and the curve for the SOC value of the battery in Scenario 2 is shown in
Figure 7.
Figure 6 and
Figure 7 show that the power generated by the wind turbine is higher than the load power. The microgrid has surplus electrical energy, part of which fills the battery and part of which is sold to the main power network during 0:00–7:00. During 12:00–15:00, the load power is higher than the sum of wind turbine power generation and photovoltaic power generation; therefore, the renewable energy power supply is insufficient and electricity needs to be supplied from the main power network or the battery. At this time, the electricity price is high, so the battery is discharged. During 15:00–18:00, the load power is higher than the sum of wind turbine power generation and photovoltaic power generation and the power purchase price is relatively low. Therefore, the microgrid purchases electricity from the main power network. The battery is discharged for use during 18:00–21:00 in Scenario 2.
(3) Scenario 3: The microgrid is allowed to abandon the wind turbine and the photovoltaics and the battery participates in dispatching.
In Scenario 3, abandoning the wind turbine and photovoltaics is allowed, the battery participates in dispatching, and the power exchange between the microgrid and main power network does not set the upper limit. Compared with Scenario 2, Scenario 3 makes a choice on the use of the wind turbine and photovoltaics, rather than blindly using all the electricity generated by the wind turbine and the photovoltaic.
During operation of the microgrid, photovoltaic power generation and wind turbine power generation can be abandoned; this is determined by comparing their power generation costs with the power purchase price. When the price of photovoltaic power generation is higher than the purchase price, it is obviously more economical to abandon the photovoltaic power generation. When the power generation price of the wind turbine is higher than the power purchase price, the power consumption cost will be lower if the wind turbine is abandoned. The microgrid model in Scenario 3 evolves, as shown in
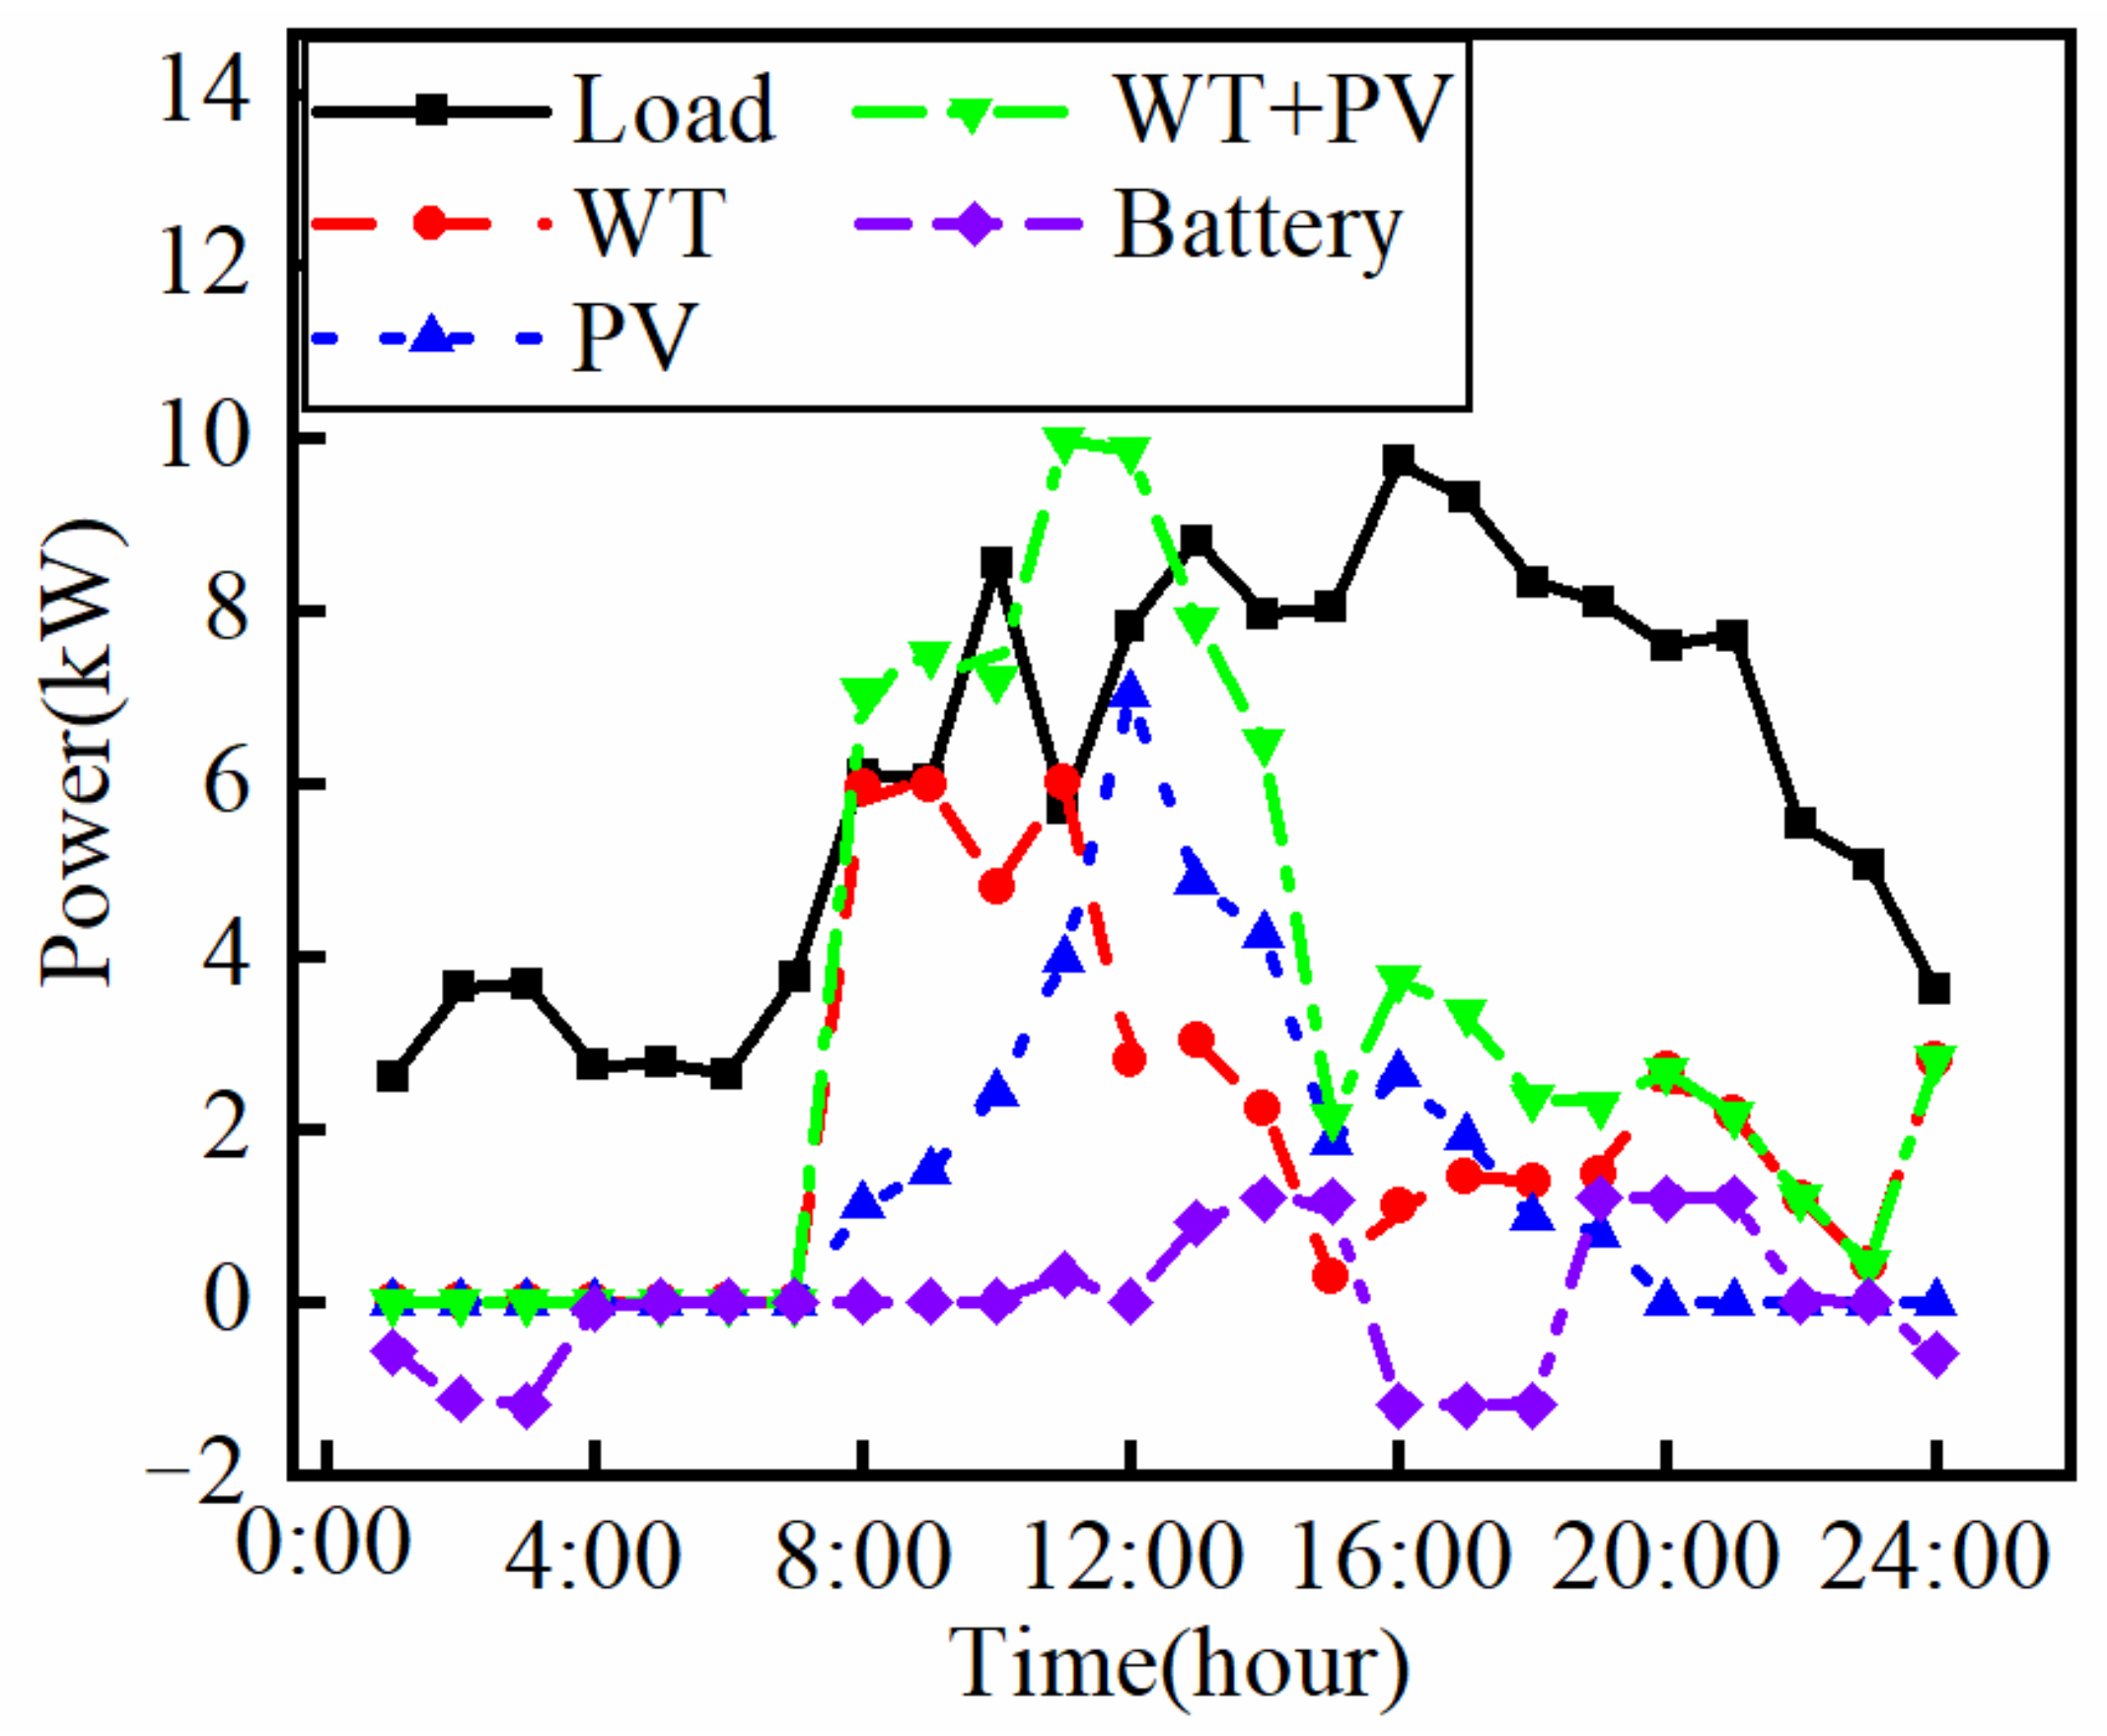
Figure 8. The power curves for the load, WT, PV, and the renewable energy (WT and PV) in one period are shown in
Figure 9, and the curve for the SOC value of the battery in Scenario 3 is shown in
Figure 10.
As indicated in
Figure 9 and
Figure 10, the wind turbine and the photovoltaics are abandoned during 0:00–7:00, that is because the cost of the renewable energy power generation is higher than the power purchase price. During 7:00–10:00, the renewable energy power generation is fully connected to the microgrid, since the cost of wind turbine power generation and photovoltaic power generation is less than the cost of purchasing power from the network. Since the purchase price of electricity during 0:00–7:00 is the lowest all day, the battery will be charged fully in this period. During 10:00–15:00, since renewable energy is not enough to meet the load demand and the power purchase price is extremely high, the battery will discharge to reduce the power consumption cost and meet the load demand. Since the electricity purchase price is the highest during 18:00–21:00 and the renewable energy power generation cannot meet the load demand, the battery will be fully charged during 15:00–18:00 to meet the load demand during 18:00–21:00.
(4) Scenario 4: The microgrid is allowed to abandon the wind turbine and the photovoltaics, the battery participates in dispatching, and there is an upper limit for the energy exchange between the microgrid and the main power network.
To improve operation safety, Scenario 4 considers that there is an upper limit for the exchange power between the microgrid and the main power network based on Scenario 3.
In Scenario 4, the upper limit of the power exchange between the microgrid and the main power network is set to 8 MW. Through analysis, the access volume of the wind turbine and photovoltaics should consider not only the power generation cost and power purchase price but also the upper limit of exchange power between the microgrid and the main power network. When the electrical energy purchased from the main power network exceeds the upper limit of power exchange, the photovoltaics or wind turbine need to supply the power for the microgrid. The microgrid model in Scenario 3 evolves, as shown in
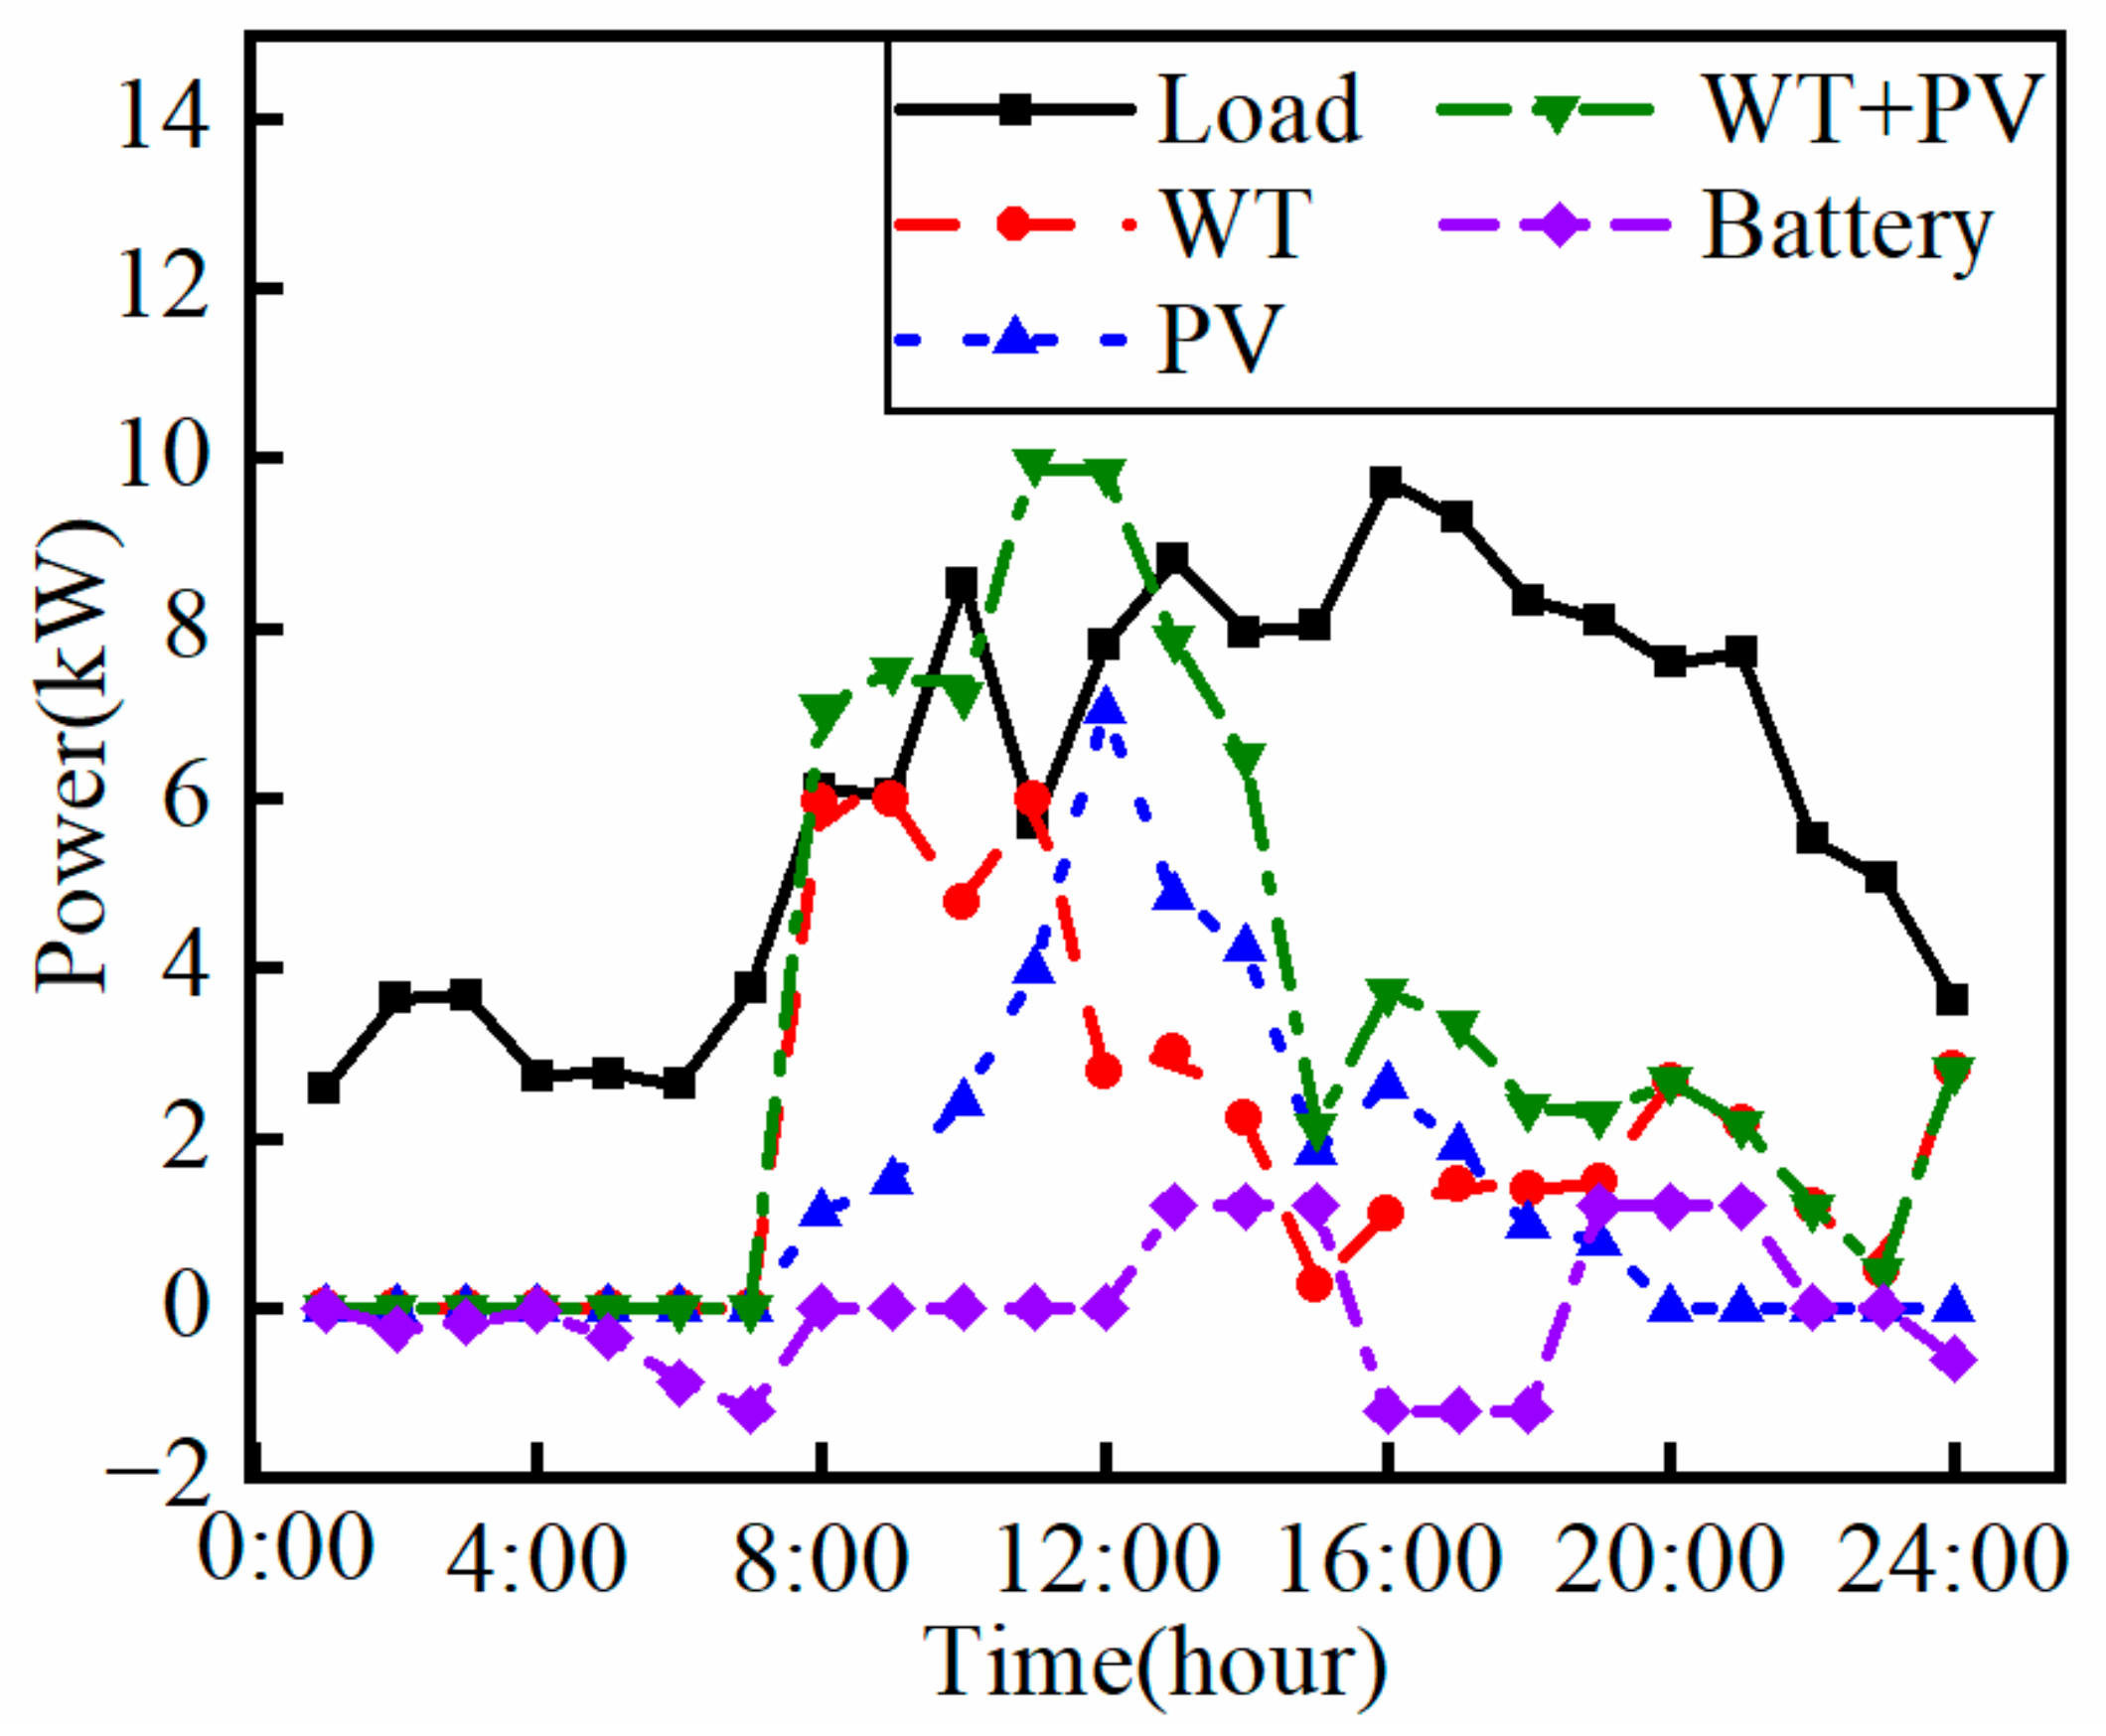
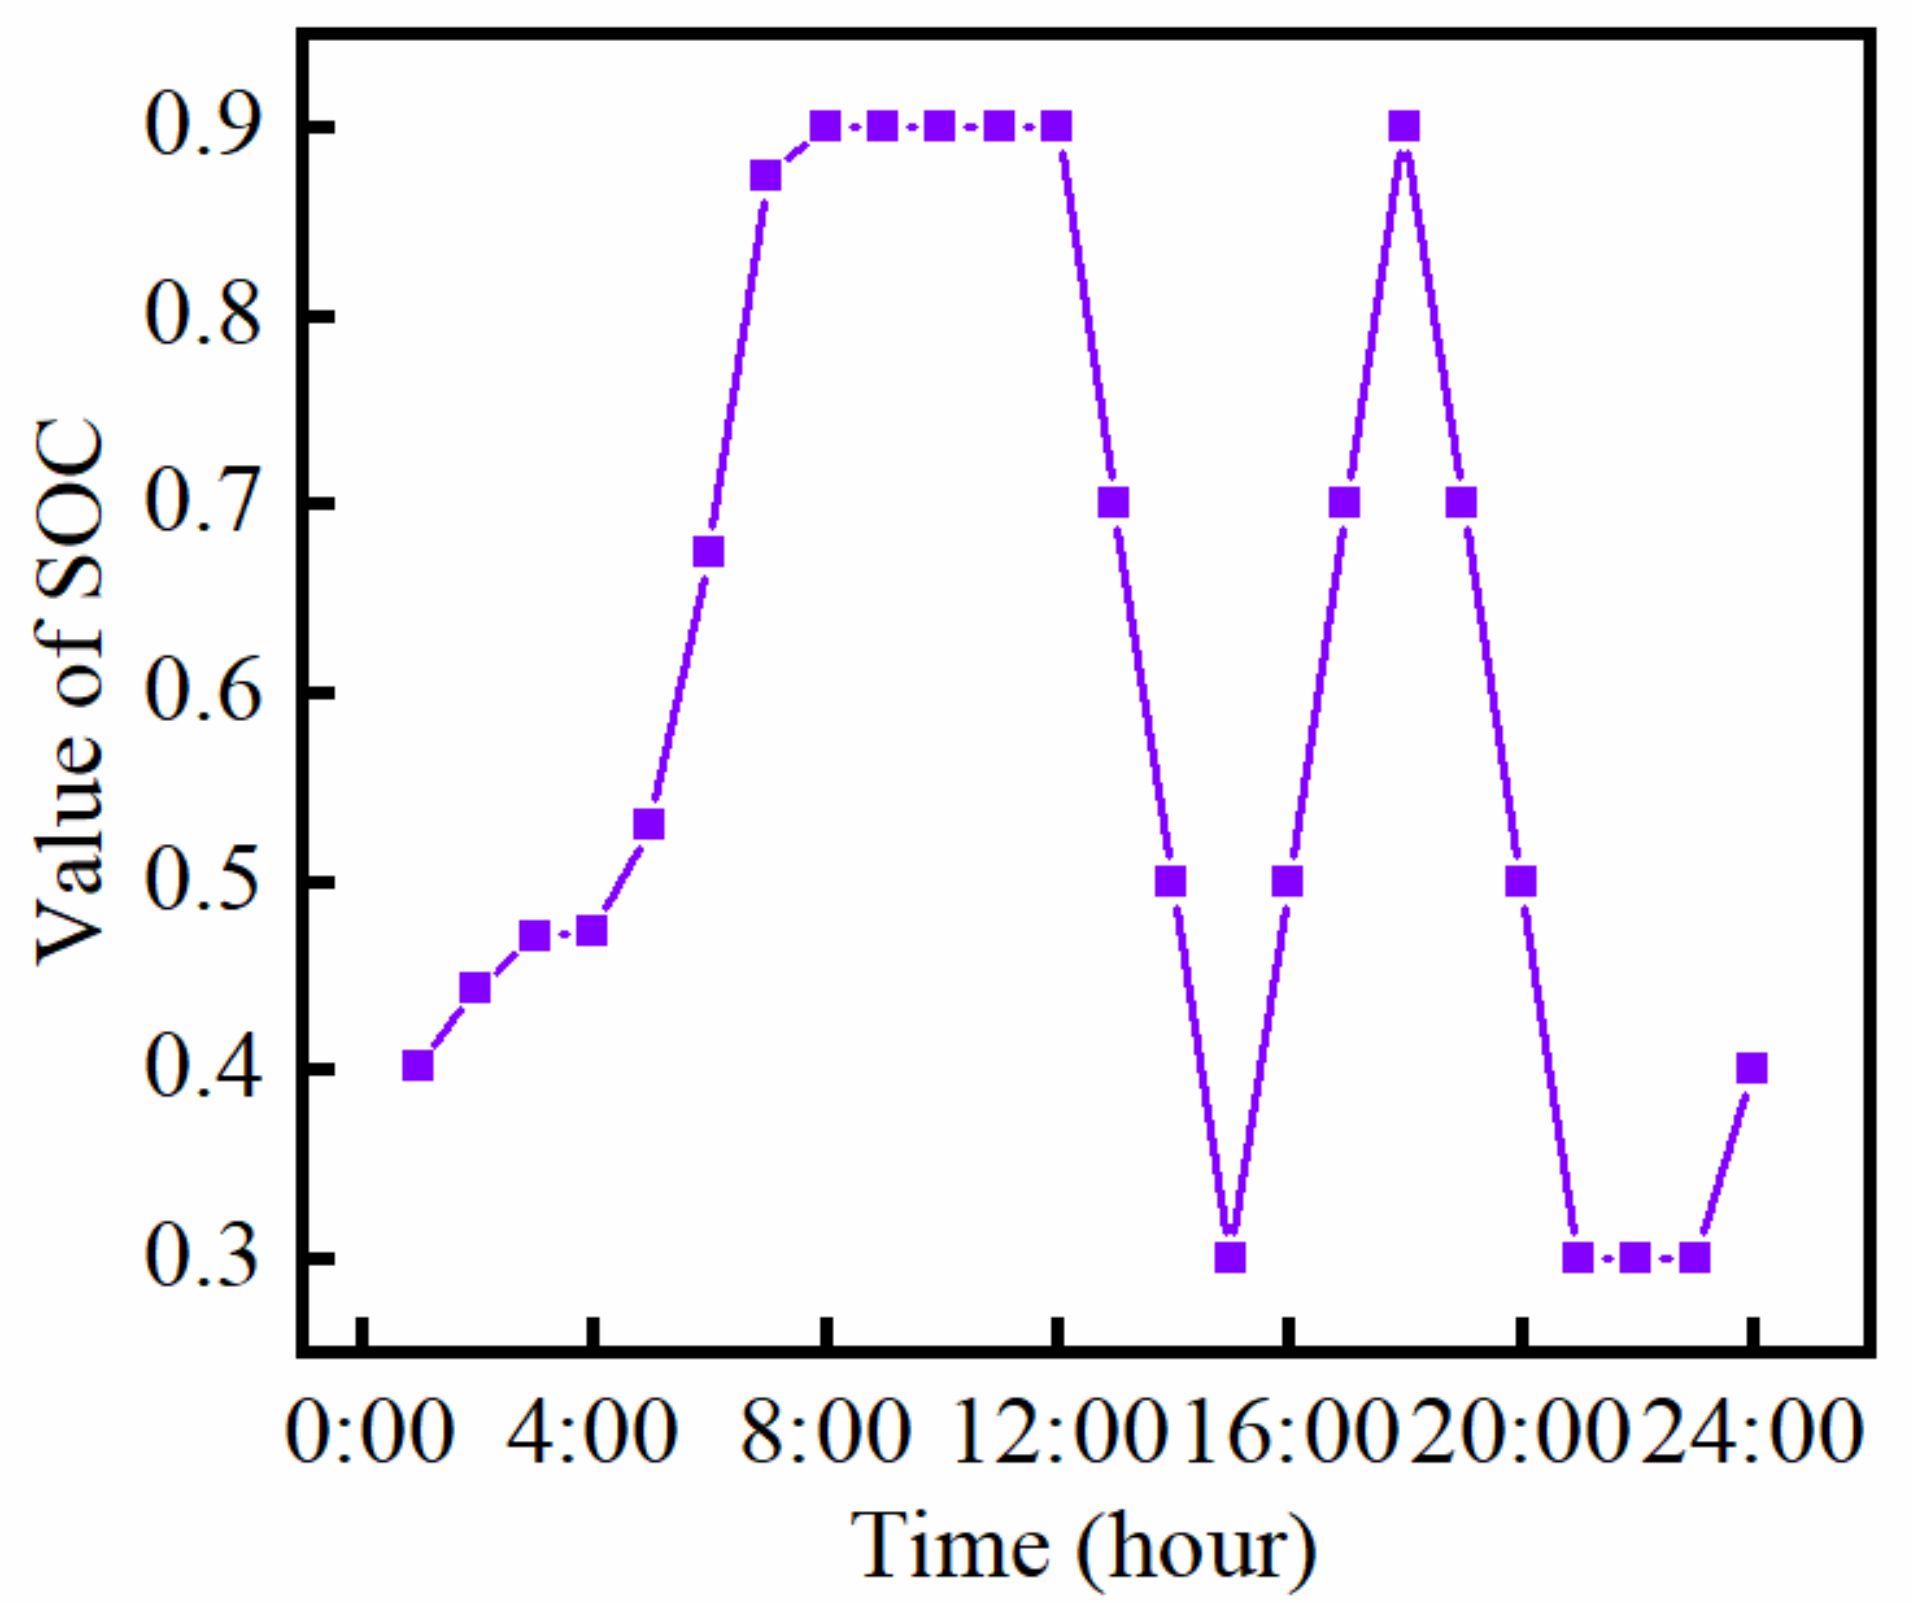
Figure 11. The power curves for the load, WT, PV, and the renewable energy (WT and PV) in one period are shown in
Figure 12, and the curve for the SOC value of the battery in Scenario 4 is shown in
Figure 13.
As shown in
Figure 12 and
Figure 13, the wind turbine and the photovoltaics are abandoned during 0:00–7:00 and load demand is met by purchasing electrical energy. That is because the cost of renewable energy power generation is higher than the power purchase price. During 7:00–10:00, as the microgrid and the main power network limit the exchange power, the wind turbine needs to output power to meet the load demand. During 10:00–15:00 and 18:00–21:00, the renewable energy power generation is fully connected to the microgrid; this is because the cost of the wind turbine power generation and the photovoltaic power generation is less than the cost of purchasing power from the network. During 10:00–15:00, the battery will discharge to reduce the power consumption cost and meet the load demand; this is because the renewable energy is not enough to meet the load demand and the power purchase price is extremely high. During 15:00–18:00, due to the limitation of the power exchange between the microgrid and the main power network, the wind turbine and the photovoltaic system need to be fully connected so that their output power can meet the load demand on the microgrid. Since the electricity purchase price is the highest during 18:00–21:00 and the renewable energy power generation cannot meet the load demand, the battery needs to be charged fully during 15:00–18:00 so as to meet the load demand during 18:00–21:00.
(5) Economic comparison under various scenarios.
By computing the total cost of electricity consumption and the average load power supply unit price (total cost of electricity for the day/total load for the day) under various scenarios, the electricity consumption cost of the microgrid under each scenario is obtained, as shown in
Table 4.
According to
Table 4, the following conclusions can be drawn:
(1) Comparing Scenario 2 with Scenario 1, it can be seen that the overall power consumption cost of the microgrid with the battery participating in scheduling decreases and the average load power supply unit price decreases. This is because the battery can play a role in peak shaving and valley filling. When the load is large or the electricity price is high, the battery is discharged to meet the load demand and the economic requirement. When the load is small or the electricity price is low, the battery stores electrical energy to meet the electrical energy application when the load is large or the electricity price is high.
(2) Comparing Scenario 3 with Scenario 2, it can be seen that when the power purchase price is lower than the cost of renewable energy power generation, the wind turbine and the photovoltaics are allowed to be discarded and microgrid can produce higher economic benefits.
(3) Comparing Scenario 4 with Scenario 3, it can be seen that restricting the exchange power between the microgrid and the main power network will result in the purchased electrical energy being insufficient to meet the load demand. In addition, it also will lead to the inability to sell all the remaining electrical energy to the main power network. This will have an impact on the economy of the microgrid operation.
4. Conclusions
In this paper, a coordinated operation model for a multi-scenario microgrid for wind–photovoltaic storage combined optimization is established, in which the lowest operation cost in one period is taken as the optimization objective. The model considers not only the power generation cost, the discharge cost, the power purchase cost, and the sales revenue but also charge/discharge constraints and charge/discharge frequency constraints. Meanwhile, the corresponding model solving algorithm based on PSO is also presented.
In addition, taking the Wangjiazhai project in Baiyangdian region as the application scenario, the effectiveness of the proposed model and algorithm is verified. Based on the Wangjiazhai project, a coordinated operation model for a multi-scenario microgrid is investigated and discussed fully and the optimal economic power dispatching schemes in multiple scenarios are also provided. Our research shows that: (1) the battery can play a role in peak shaving and valley filling, which can make the microgrid more economical; (2) when the power purchase price is lower than the cost of renewable energy power generation, if the wind turbine and the photovoltaics are allowed to be discarded the microgrid will produce higher economic benefits; (3) restricting the exchange power between the microgrid and the main power network will lead to a negative impact on the economy of the microgrid.
In engineering practice, the battery service life may affect the optimal scheduling between source, grid, load, and storage in a microgrid. Factors, such as discharge depth, temperature, charge number, and discharge number, can affect the battery service life. Based on the research in our paper, the impact of these factors on battery life and optimal scheduling in microgrids can be investigated in future work.


