1. Introduction
For the majority of European countries, the estimation of energy performance is an essential step during the design phase of new buildings, not only for assuring compliance with regulations and standards, but also for coming close to an optimal design as regards the life cycle of the building [
1,
2].
There are several methods for assessing the building energy performance [
3]; the most detailed ones simulate the dynamic heat transfer process with short time steps (typically one hour). Simpler methods use quasi-steady-state models and are used for calculating the heat transfer over a long period of time (
i.e., a month or a season). To the latter belongs the degree-day or degree-hour approach. It is appropriate for a quick estimation of the heating or cooling energy consumption of a building, especially in the case when its utilization and the efficiency of the heating equipment can be assumed constant [
1,
4,
5].
Apart from the methodology applied in energy building regulations across the world, it is common that the geographical area of each country is divided in zones with common climatic characteristics [
6,
7]. The definition of borders between climatic zones is often based on the use of degree-day or degree-hour approaches, since this aim is depicted by the actual definition of these parameters. Nevertheless, the severity of the climate has often an impact on the required thermal properties of building components and energy performance for new and existing buildings [
7,
8], as defined in the energy regulations of each country.
Although climatic zones have been defined in most European countries [
9,
10,
11,
12,
13,
14], there is a lack of information regarding the classification of climate characteristics for the whole continent, beyond the individual borders of each country. Such information is valuable, especially when energy issues on a European basis are arising. More specifically, with Directive 2009/125/EC a framework for setting of eco-design requirements for energy- and building-related products is established. For avoiding the creation of barriers and the distortion of competition in the internal market, it is essential to develop a common basis, upon which the products will be designed, evaluated and rated. The implementation of such an attempt on a European level, especially when it involves the product’s energy performance, will be significantly supported by the establishment of different criteria with regard to the specific climatic conditions prevailing in established climatic zones.
Towards this direction stands the current paper; it attempts to propose climatic zones in Europe used for building energy analysis on the basis of the degree-based approach of different locations. Furthermore, since for the purpose of the current paper the climate zones classification is building orientated, it was regarded necessary to evaluate the proposed approach by associating its application with the energy needs of a reference building unit located in characteristic locations in the proposed European zones.
2. Methodology for Establishing Climatic Zones
The term heating (or cooling) degree days (HDD or CDD) is defined as the positive deviation of the mean monthly temperature
Tm from a base temperature
Tb, below (or above) which heating (or cooling) is needed to sustain the indoor temperature to a comfortable level [
1,
15]:
It gives the value of quantity and duration when the air temperature becomes lower or higher than a determined threshold value, which is known as base temperature [
16]. The base temperature depends on the constructional specifications of the building stock. For heating, the traditional base temperature for the degree-day or degree-hour procedure is considered equal to around 18 °C [
4]; the value resulted from a combination of theory and empirical observations and assumes that, on a long-term average, solar and internal gains will offset heat loss when the mean daily outdoor temperature is 18 °C and that energy consumption will be proportional to the difference between the mean daily temperature and the base temperature [
17,
18,
19].
The base temperature of 23 °C appears to be more representative for calculating the cooling degree days (CDD) for the constructions found in the Southern European regions, which are more exposed to climatic conditions due to the lack of thermal insulation or air permeability conditions. On the contrary, it would be more appropriate to use a lower value of CDD for northern climates, where the thermal protection and the air tightness of the building envelope are generally increased, allowing for less heat flows between the interior and the ambient environment. Consequently, with the aim of covering all geographical area of Europe and taking into account ASHRAE recommendations, the base temperature for both cooling and heating was considered equal to 18 °C [
17,
20,
21].
In order to establish a reliable model for defining climatic zones in a wide area, such as the European region, the statistical sample of the sites must be wide enough, so as to cover the geographical area of Europe, include urban centers, where the majority of buildings are located, as well as contain necessary climatic information for the selected sites. Under this context, it is worth mentioning that an even geographical distribution was preferred to altitudinal differences between the selected sites, since it was assumed that the impact of the altitude on the formation of the temperature profiles of the sites is encompassed in both the values of heating and cooling degree days, as well as in the full climatic data used in the dynamic simulations of heating and cooling needs presented in
Section 3 of the paper.
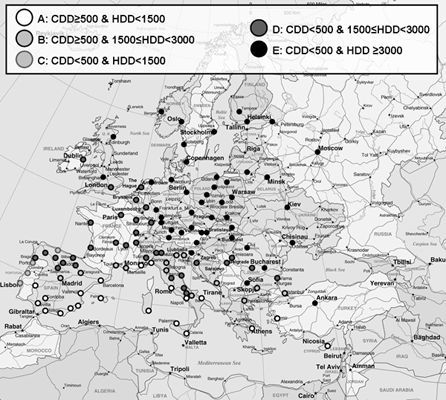
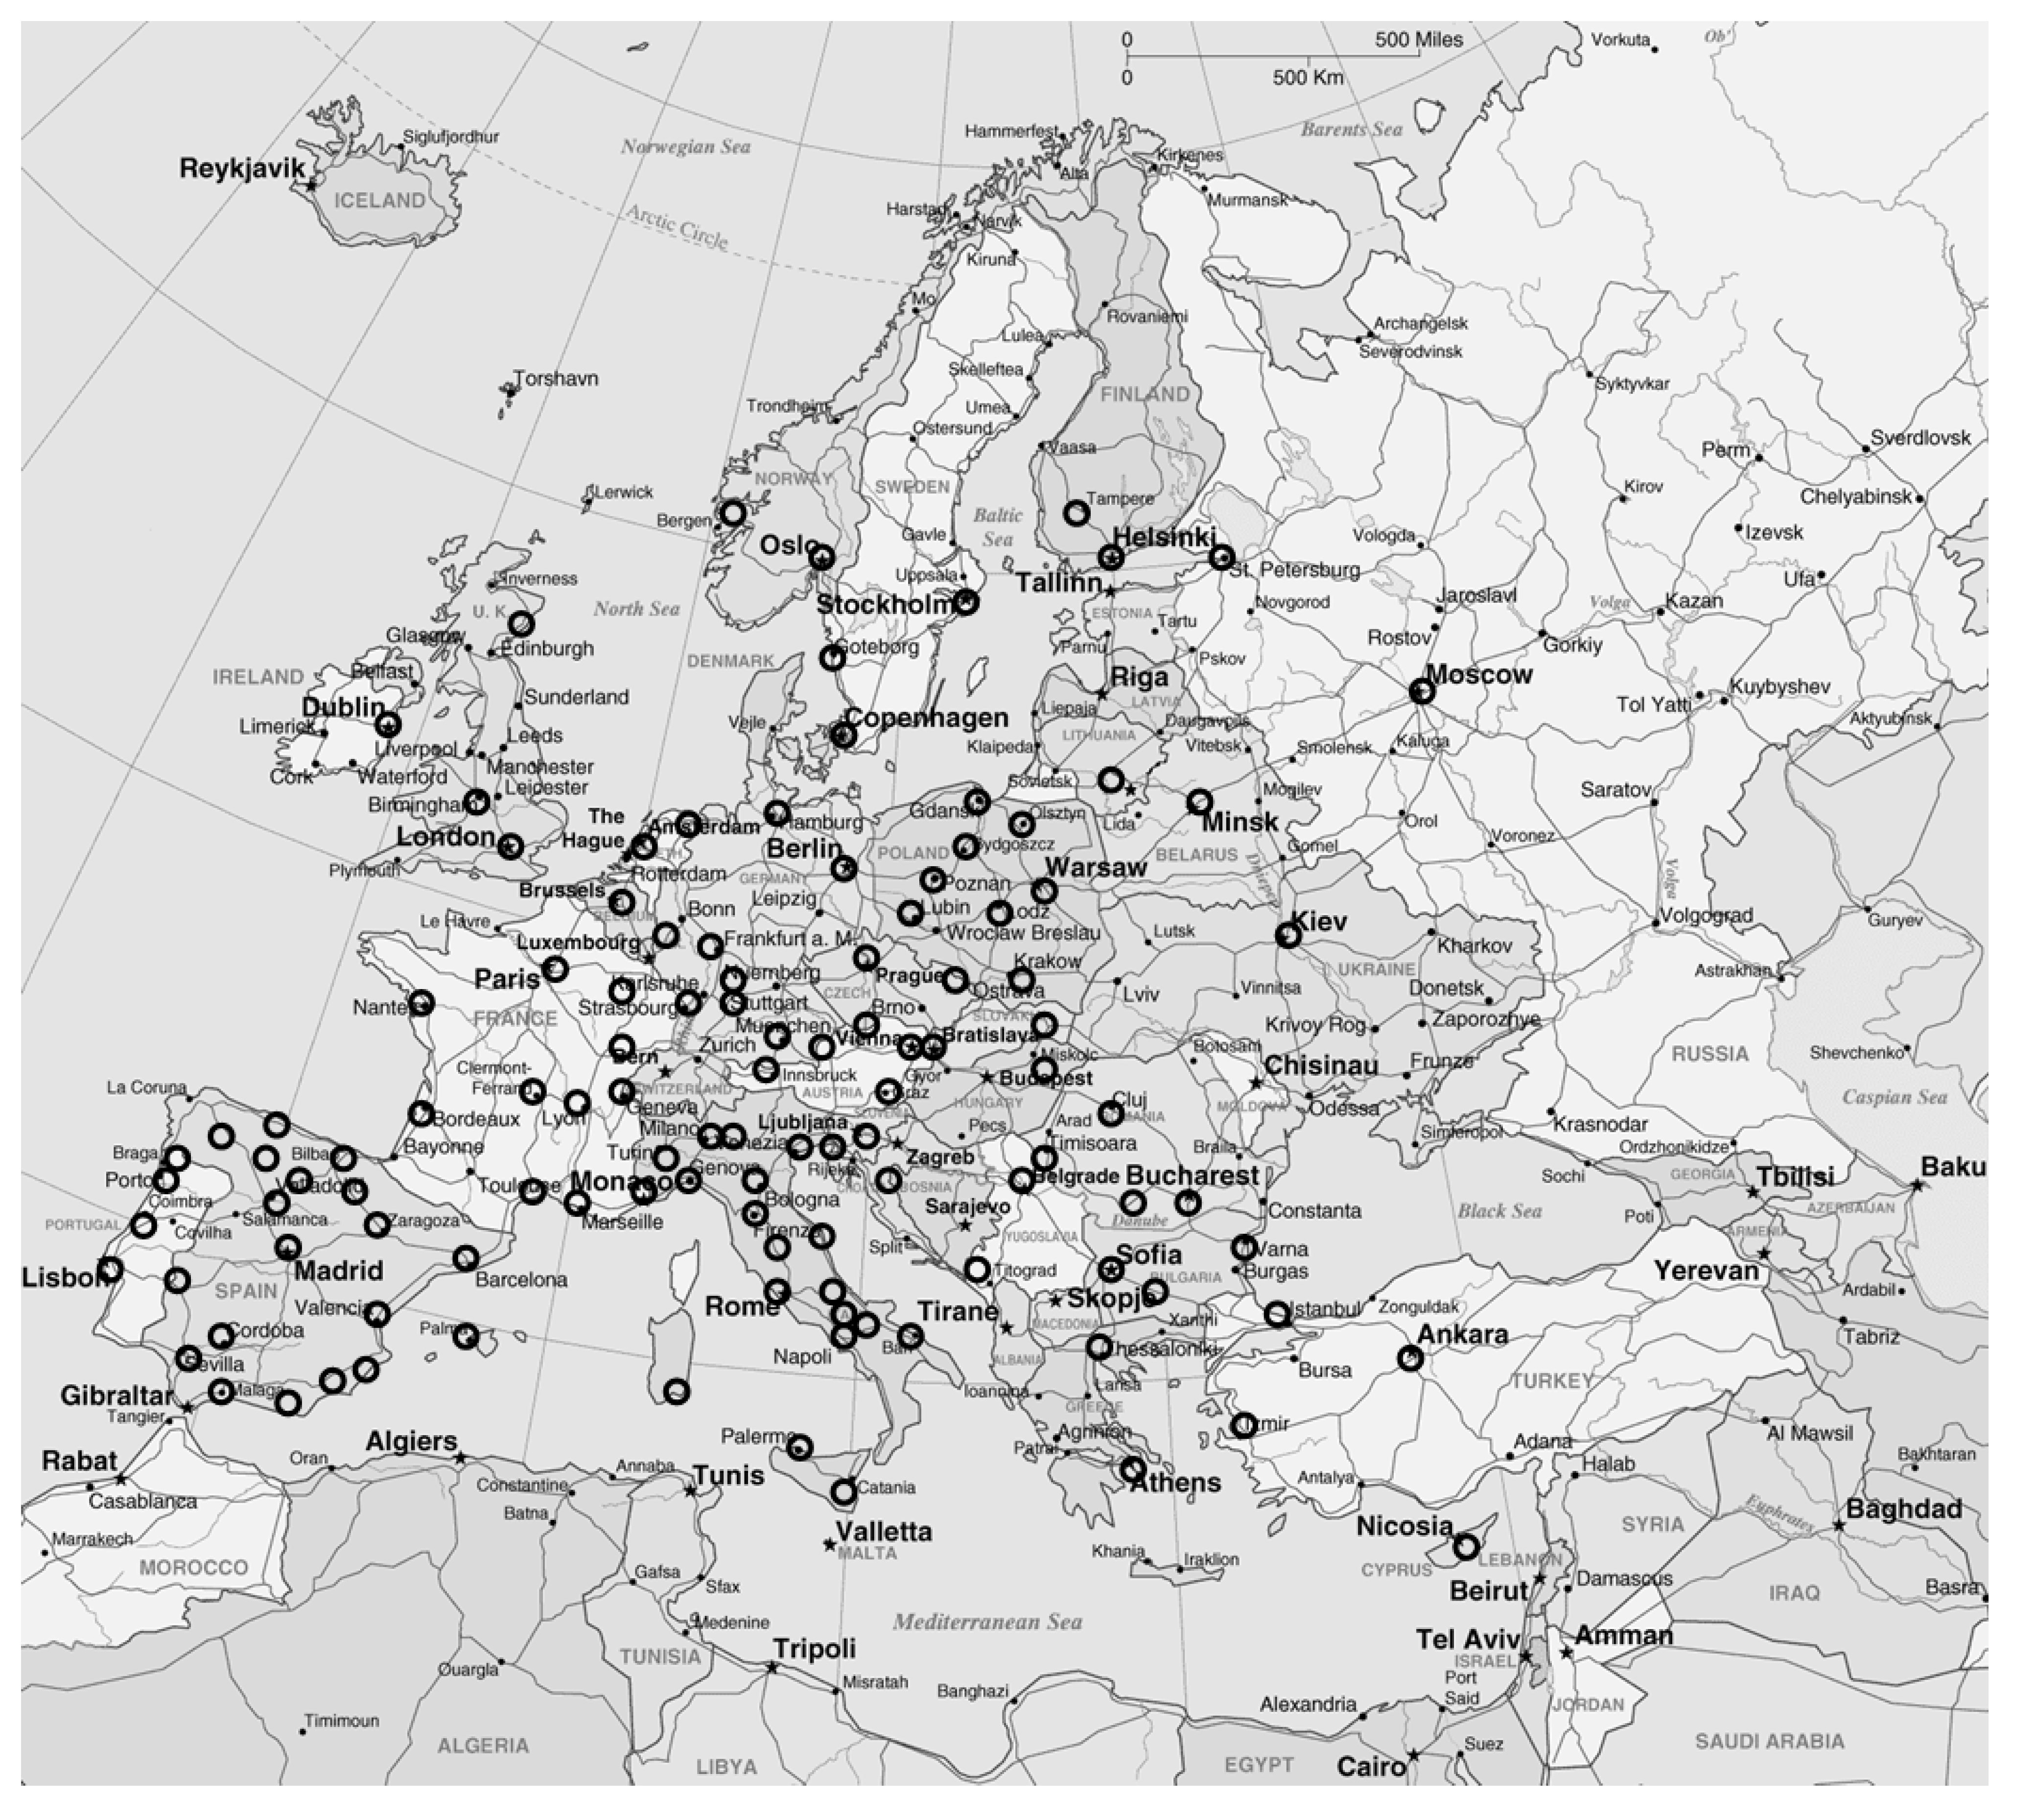
For selecting the sites that will form the sample for the definition of climatic zones, demographic data produced by Eurostat [
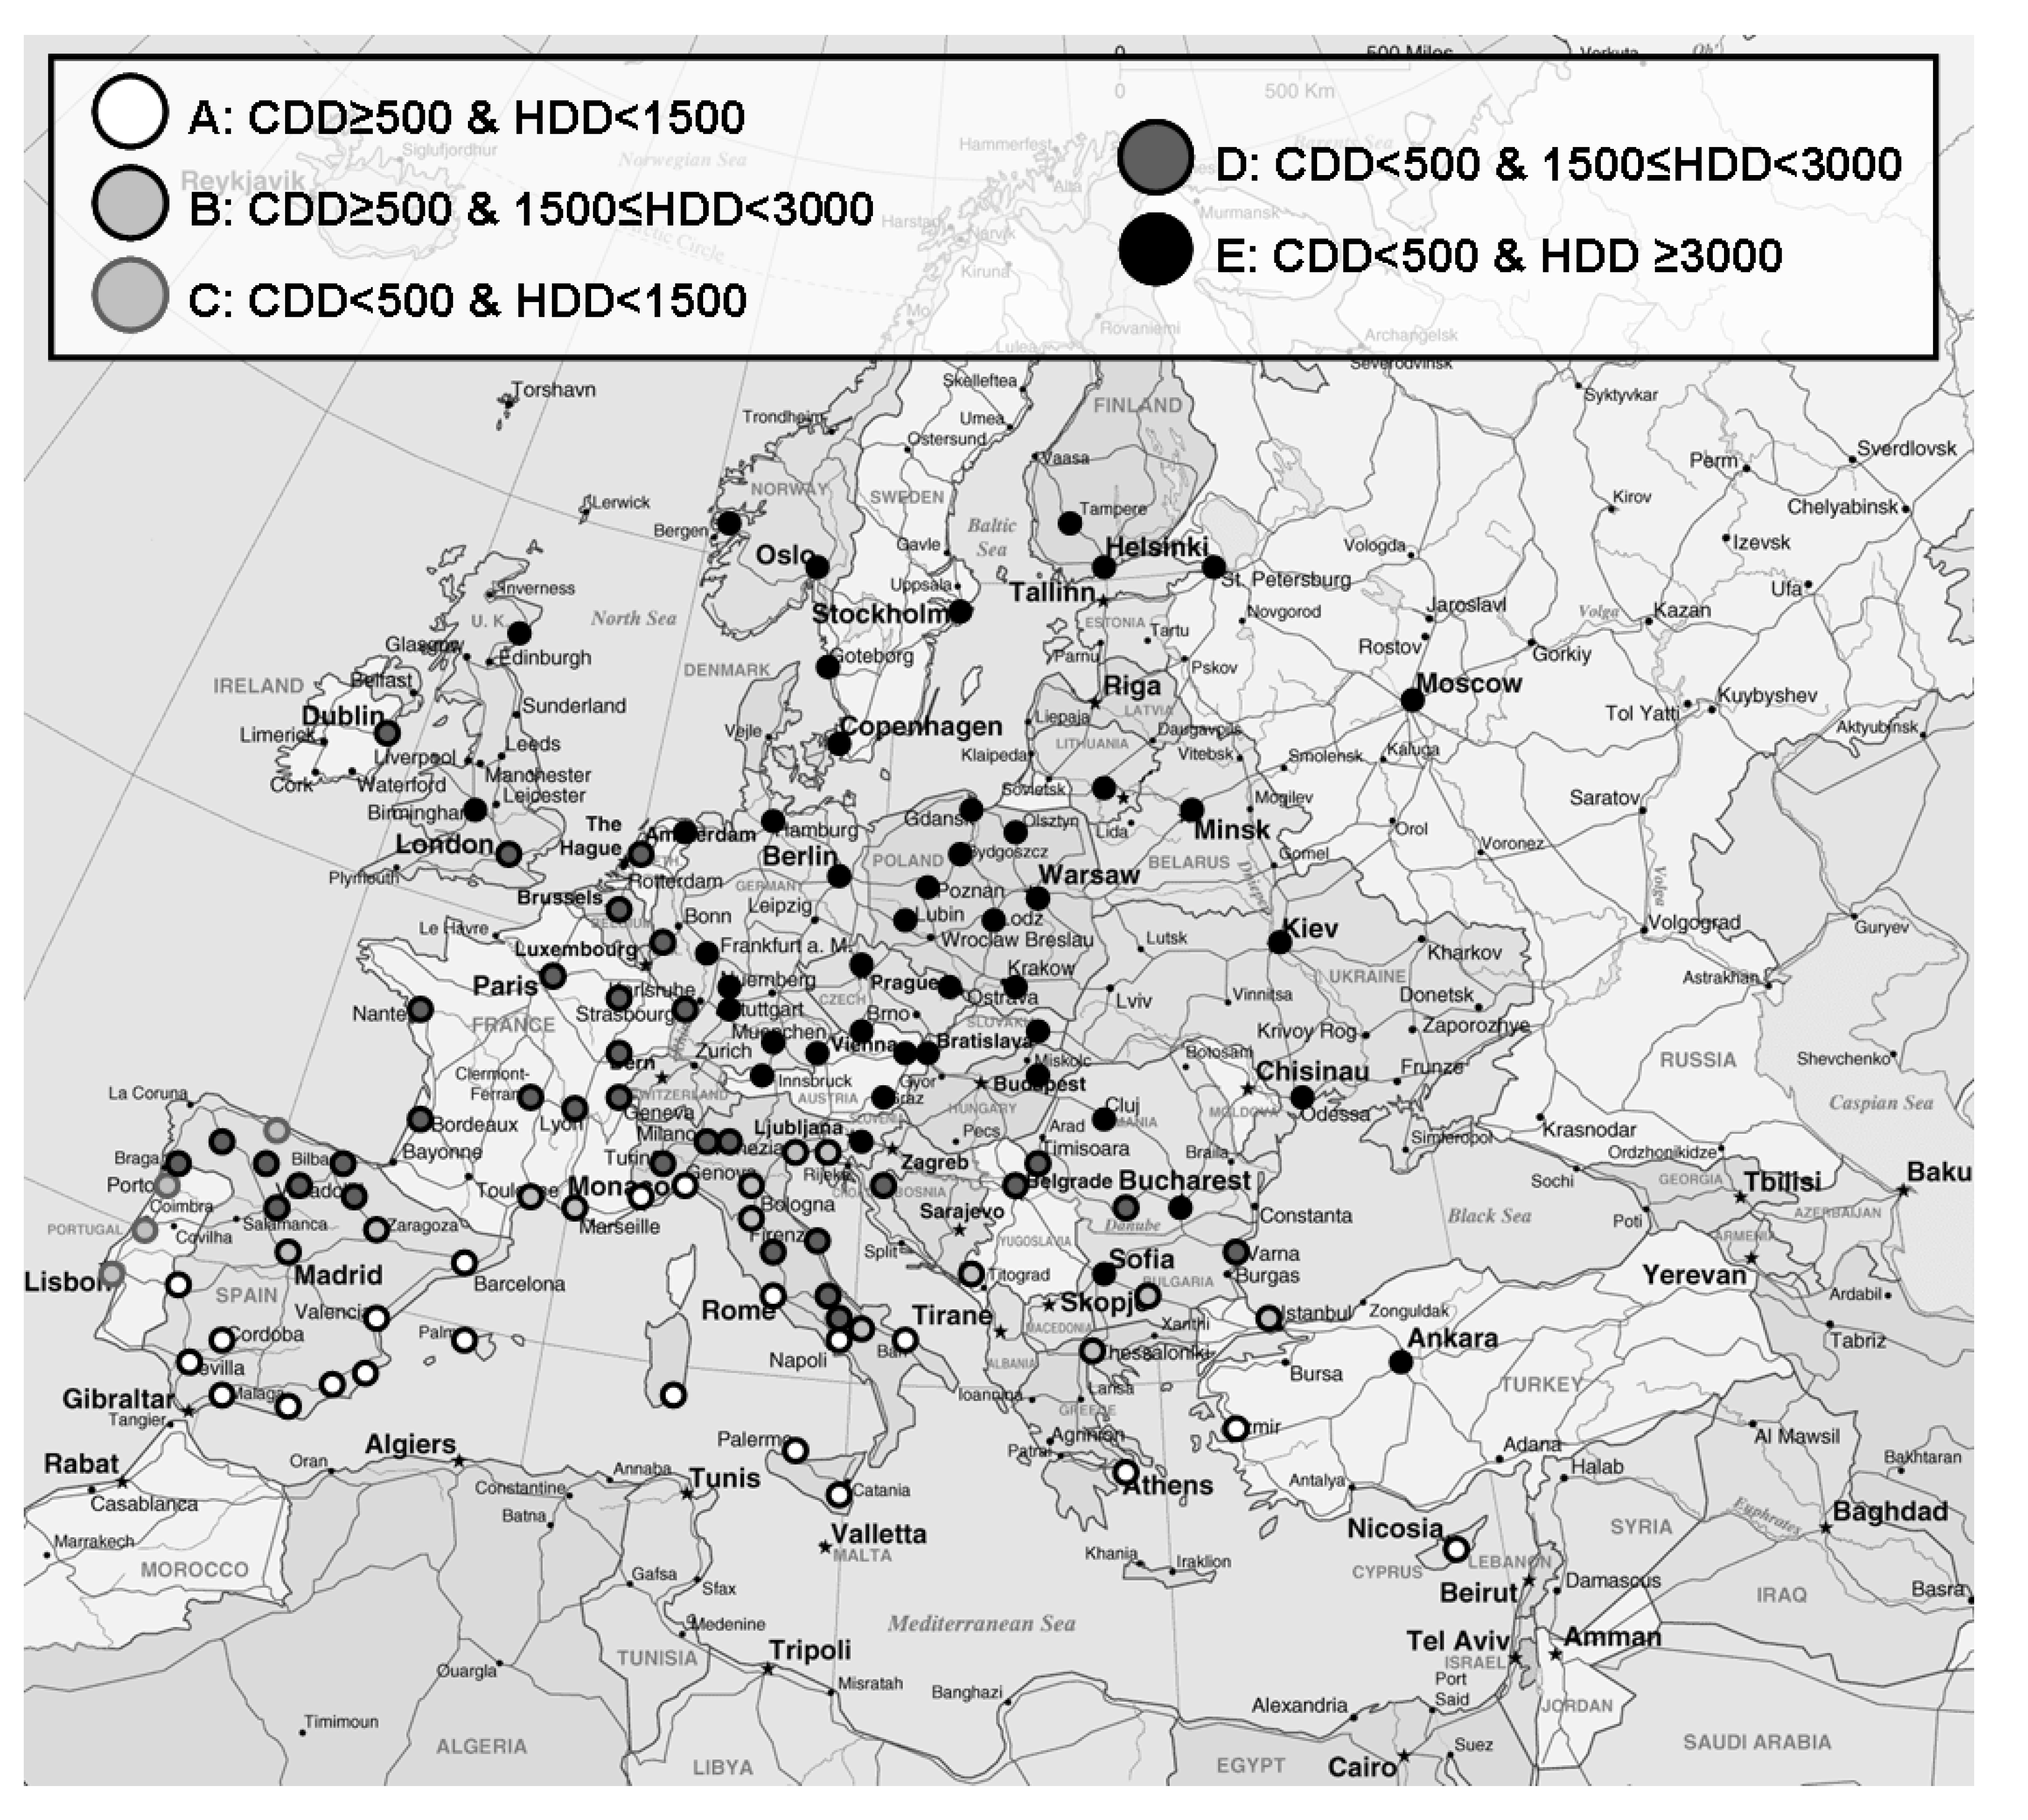
22] were used. After successive checks, it was found that the above mentioned criteria were fulfilled, when cities with population over 100,000 were taken into account in the analysis. The application of the above mentioned analysis concluded in a sample of 121 European cities, the location of which is presented in
Figure 1.
From the available climatic data of the selected sites, the amount of heating degree days and cooling degree days were taken into account for establishing the climatic zones in the European region. Traditionally, the severity of a climate is depicted on the heating energy demands of the buildings, but nowadays cooling loads account for a significant amount of consumed energy, especially in office buildings and the Mediterranean countries [
15,
23,
24]. Under this framework, it seemed more rational to distinguish between areas with increased cooling or heating needs, but also indicate areas with climatic characteristics which lead to equivalent heating and cooling requirements. Nevertheless, two approaches were adopted for proposing climatic zones, which are later evaluated through the calculated energy performance of buildings:
- -
on the basis of heating degree days of each location solely (conventional procedure) and
- -
on the basis of both heating and cooling degree days of each location.
Figure 1.
The geographical distribution of selected cities for establishing climatic zones in the European region. Map: European Commission (
http://ec.europa.eu/avservices/), © European Union, 2011.
Figure 1.
The geographical distribution of selected cities for establishing climatic zones in the European region. Map: European Commission (
http://ec.europa.eu/avservices/), © European Union, 2011.
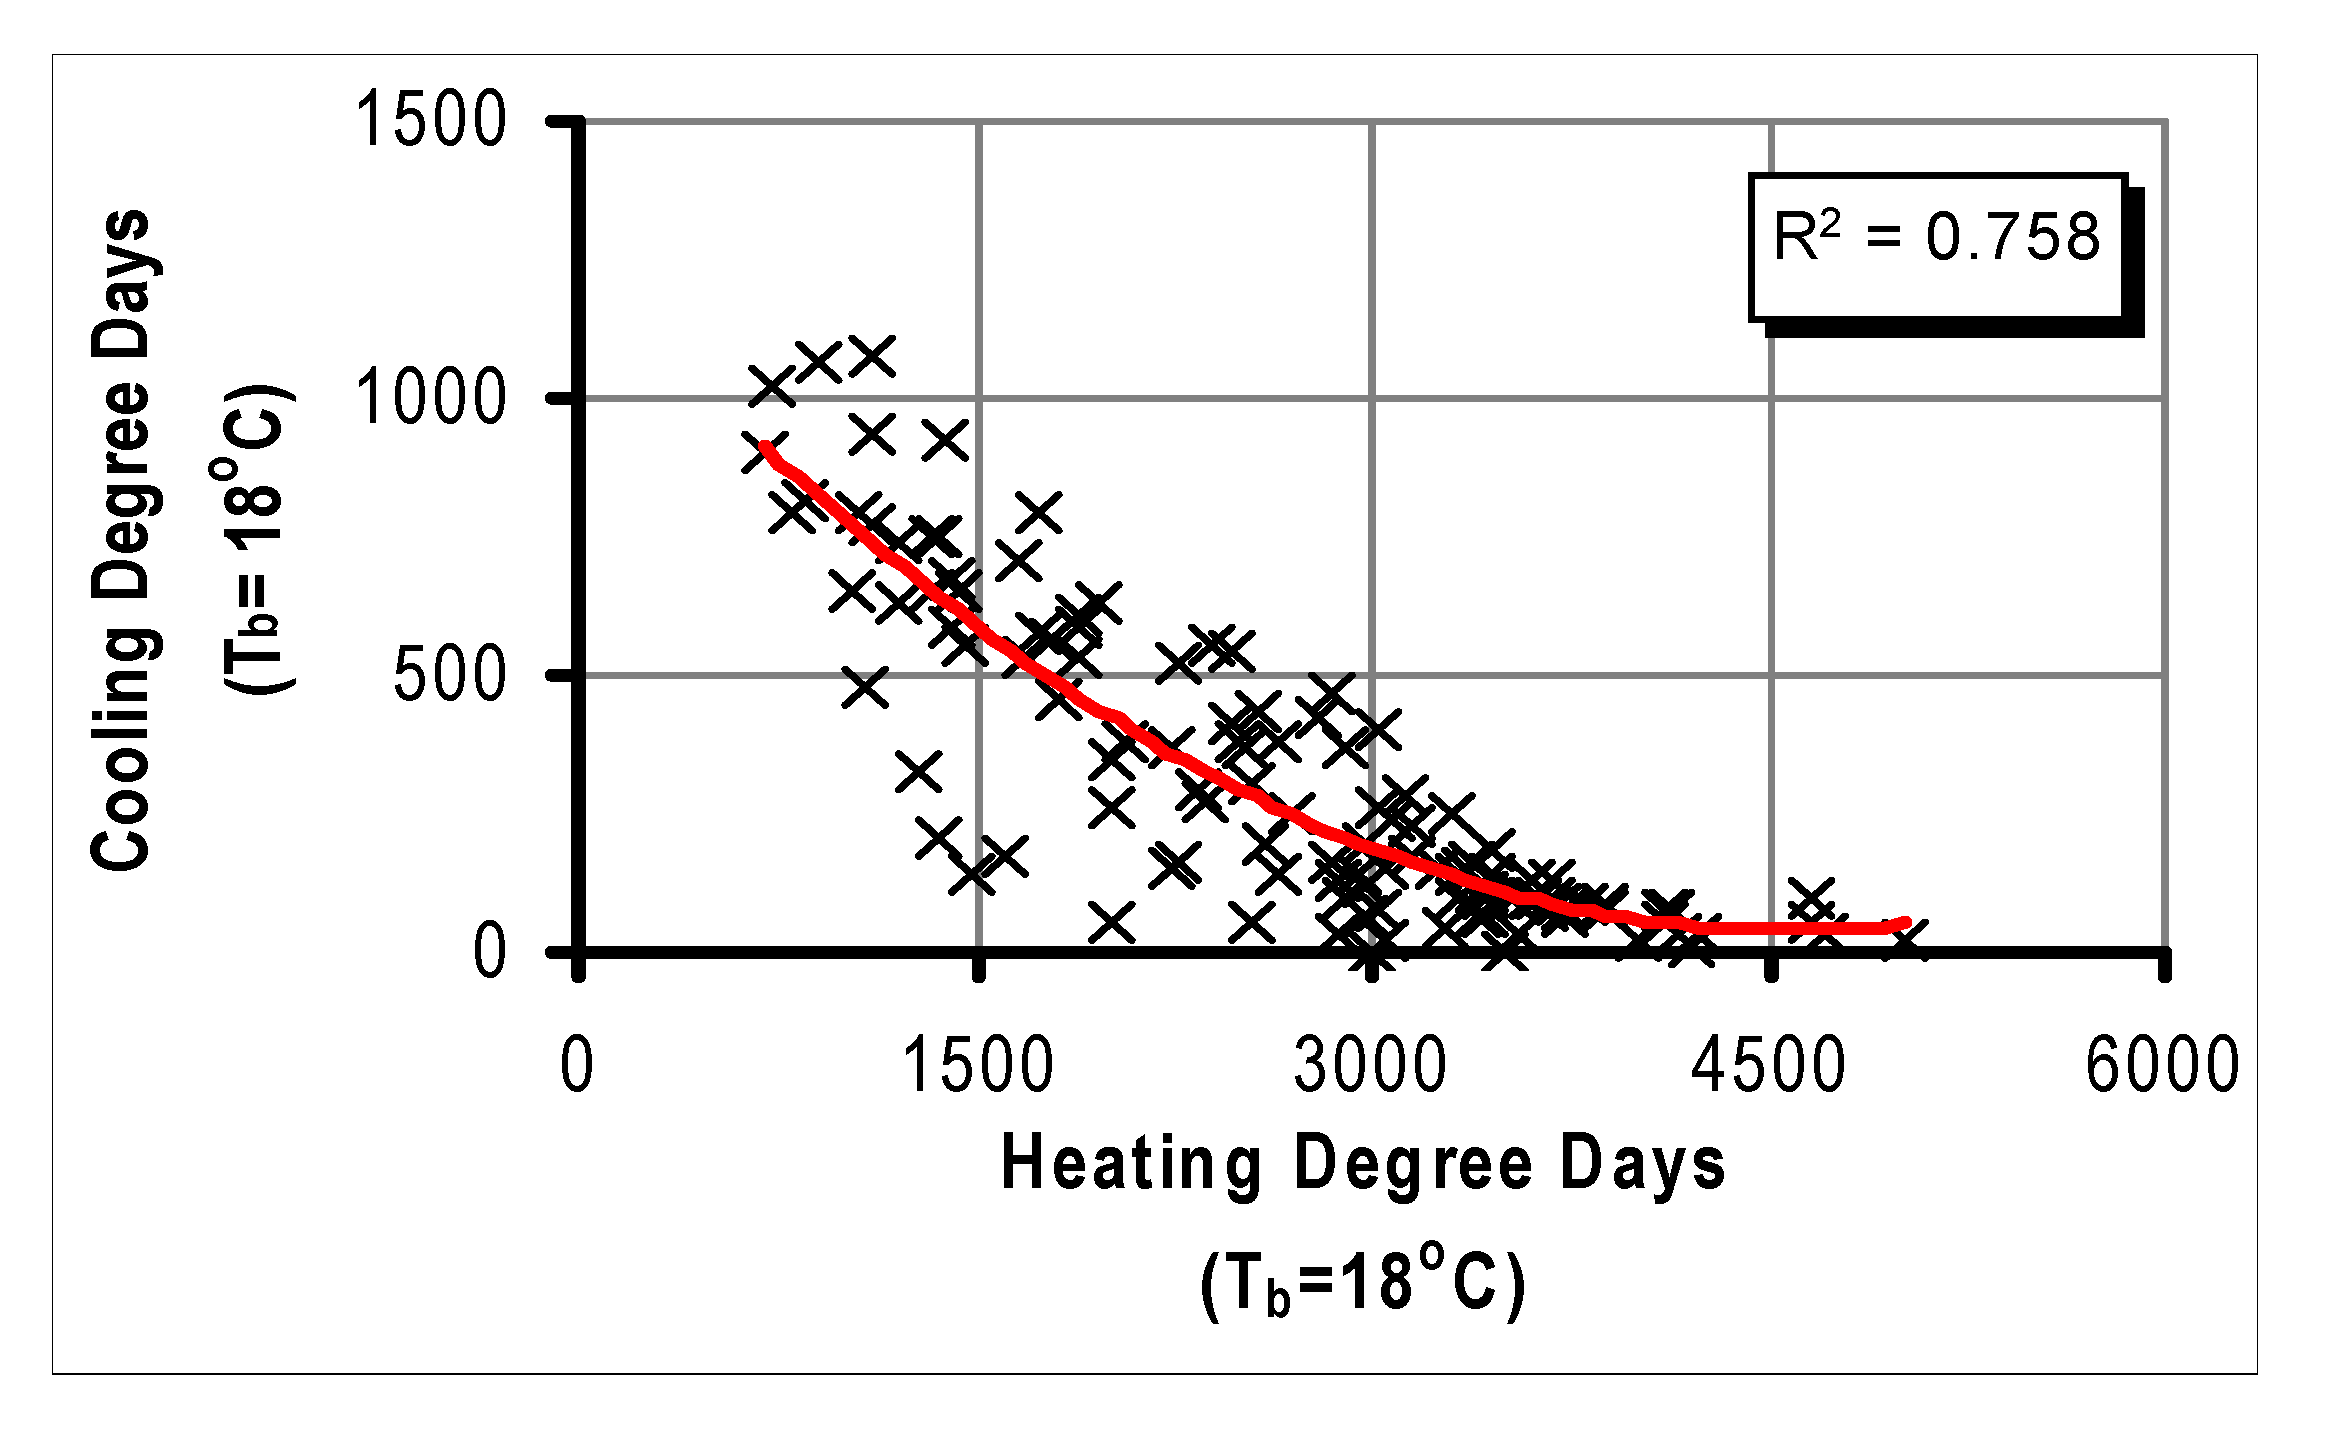
In
Figure 2, the number of Cooling Degree Days at a base temperature of 18 °C (CDD18) is plotted against the Heating Degree Days at a base temperature equal to 18 °C (HDD18). It is worth mentioning that the correlation of the two parameters provides a strong relationship between CDD18 and HDD18, which is actually decreasing, according to the value of Pearson correlation coefficient (
r = −0.839). This indicates that a predictive model can be developed for calculating CDD on the basis of HDD values, which are in general widely available. For showing this interrelationship more vividly, the fit of a second degree polynomial is graphically presented in
Figure 2 with the red curve; the coefficient of determination derived for this model (
R2 = 0.758) indicates that there is an adequate agreement between the measured and predicted values of CDD, since more than 75% of calculated values can be explained through the polynomial model.
Figure 2.
The distribution of Cooling Degree Days at a base temperature 18 °C (CDD18) plotted against Heating Degree Days at a base temperature of 18 °C (HDD18).
Figure 2.
The distribution of Cooling Degree Days at a base temperature 18 °C (CDD18) plotted against Heating Degree Days at a base temperature of 18 °C (HDD18).
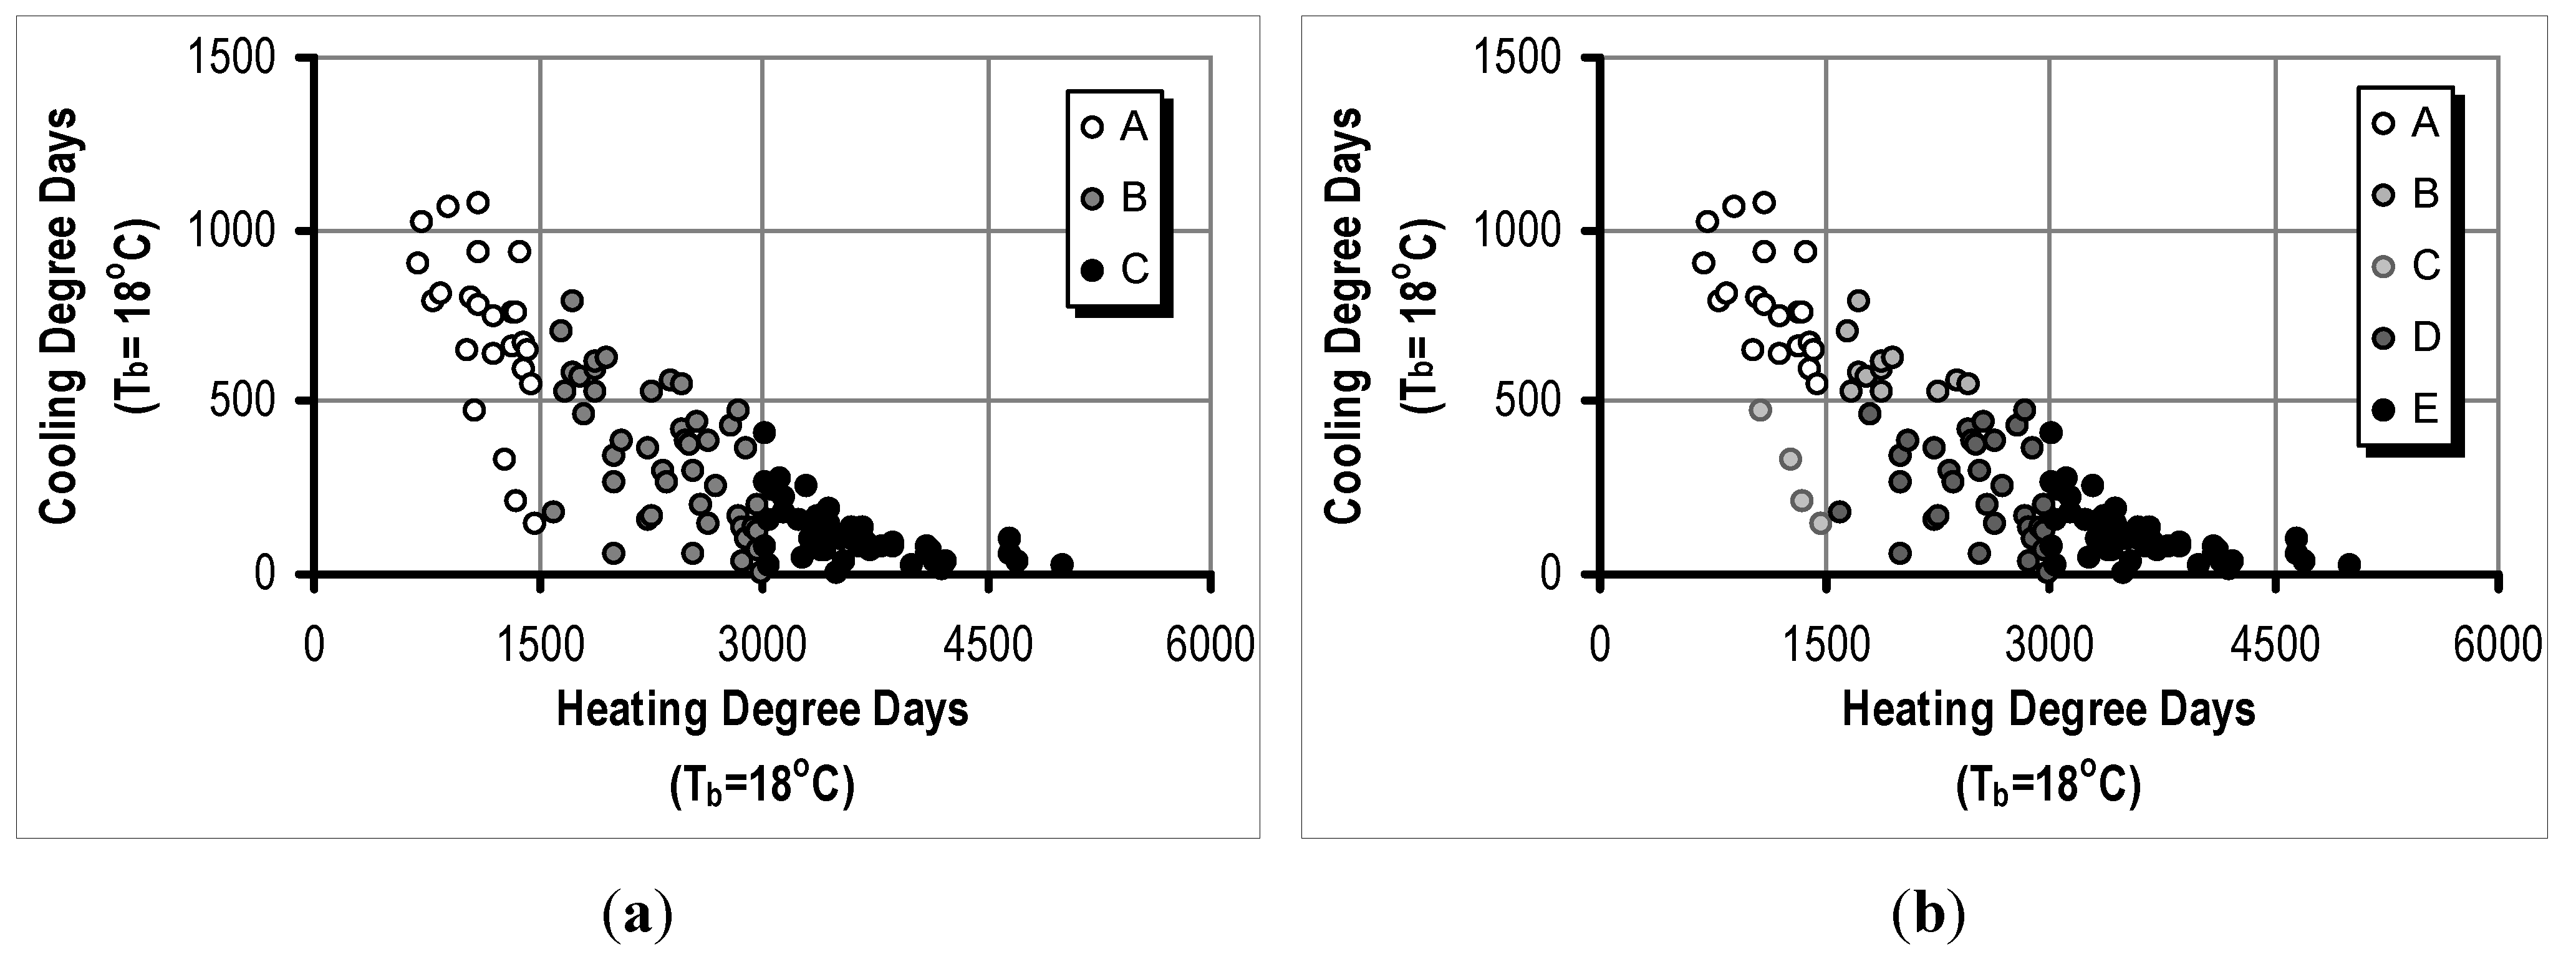
Following the traditional procedure of establishing climatic zones,
i.e., on the basis of the amount of heating degree days, and taking into account the distribution of heating degree days presented in
Figure 2, three zones can be defined (
Figure 3a):
- –
one representing areas with low heating needs, which accounts for locations with HDD lower than 1500 (black color, zone A)
- –
one representing medium heating needs, which accounts for locations with HDD higher than 1500 and lower than 3000 (grey color, zone B) and
- –
one representing areas with high heating needs, which accounts for locations with HDD higher than 3000 (white color, zone C).
Figure 3.
The areas representing high, medium and low heating and cooling needs according to the first approach (
a) and the second approach (
b), also presented in
Table 1.
Figure 3.
The areas representing high, medium and low heating and cooling needs according to the first approach (
a) and the second approach (
b), also presented in
Table 1.
However, by looking carefully into
Figure 2, it can be discerned that if the amount of heating and cooling degree days serve as an indicator of the energy performance of the buildings, then it might be too general to classify all locations with medium HDD in the same zone, since some locations have low cooling needs (CDD below 500) and others much higher. On the contrary, for the cases with HDD higher than 3000, the amount of CDD ranges in low levels (below 500), while for the majority of cases with low HDD, CDD is accordingly high. The former area can represent regions with heating dominating climate (black color), while the latter represents regions with cooling dominating climate (white color). The intermediate areas of the diagram encompasses either low values of CDD and HDD (circles with grey line and filling), or medium values of HDD and low values of CDD (circles with black line and dark grey filling), or medium values of HDD and high values of CDD (circles with black line and grey filling).
Based on this observation, the examined sites can be categorized according to the heating and cooling needs, which are depicted by the number of Cooling Degree Days and Heating Degree Days (
Figure 3b). The value of 500 CDD is regarded as the threshold, above which the climate can be characterized as cooling dominated. In parallel, the value of 3000 HDD can be regarded as the border for heating dominating climates. Lower values of HDD and CDD indicate lower energy needs for heating and cooling respectively.
Based on this approach, the climatic zones can be defined by characterizing the heating and cooling needs as low, medium and high. The proposed scheme is presented in
Table 1. The classification of the selected sites in the proposed zones is presented in
Figure 4. It is worth mentioning that from the selected cities, 27% belongs to zones with high cooling needs (Zone A), while 43% is part of Zone E (regions with high heating needs). Zone C mainly refers to Portugal, where particular climatic conditions prevail.
Table 1.
Presentation of the proposed scheme for establishing climatic zones in the European region (2nd approach).
Table 1.
Presentation of the proposed scheme for establishing climatic zones in the European region (2nd approach).
| Zone | Description | Requirements |
|---|
| A | CDD ≥ 500 and HDD < 1500 | High cooling needs, low heating needs |
| B | CDD ≥ 500 and 1500 ≤ HDD < 3000 | High cooling needs, medium heating needs |
| C | CDD < 500 and HDD < 1500 | Low cooling needs, low heating needs |
| D | CDD < 500 and 1500 ≤ HDD < 3000 | Low cooling needs, medium heating needs |
| E | CDD < 500 and HDD ≥ 3000 | Low cooling needs, high heating needs |
Figure 4.
The geographical distribution of selected cities and their classification into climatic zones on the basis of CDD and HDD approach. Map: European Commission (
http://ec.europa.eu/avservices/), © European Union, 2011.
Figure 4.
The geographical distribution of selected cities and their classification into climatic zones on the basis of CDD and HDD approach. Map: European Commission (
http://ec.europa.eu/avservices/), © European Union, 2011.
3. Proposed Climatic Zones vs. Energy Behavior of Buildings
Energy behavior of buildings was studied with regard to the heating and cooling energy needs; energy needs are preferred to energy consumption, since there are various HVAC systems, which actually differ enormously from country to country. The energy needs for cooling and heating were calculated with the aid of EnergyPlus, a simulation program, which enabled the detailed dynamic analysis [
25].
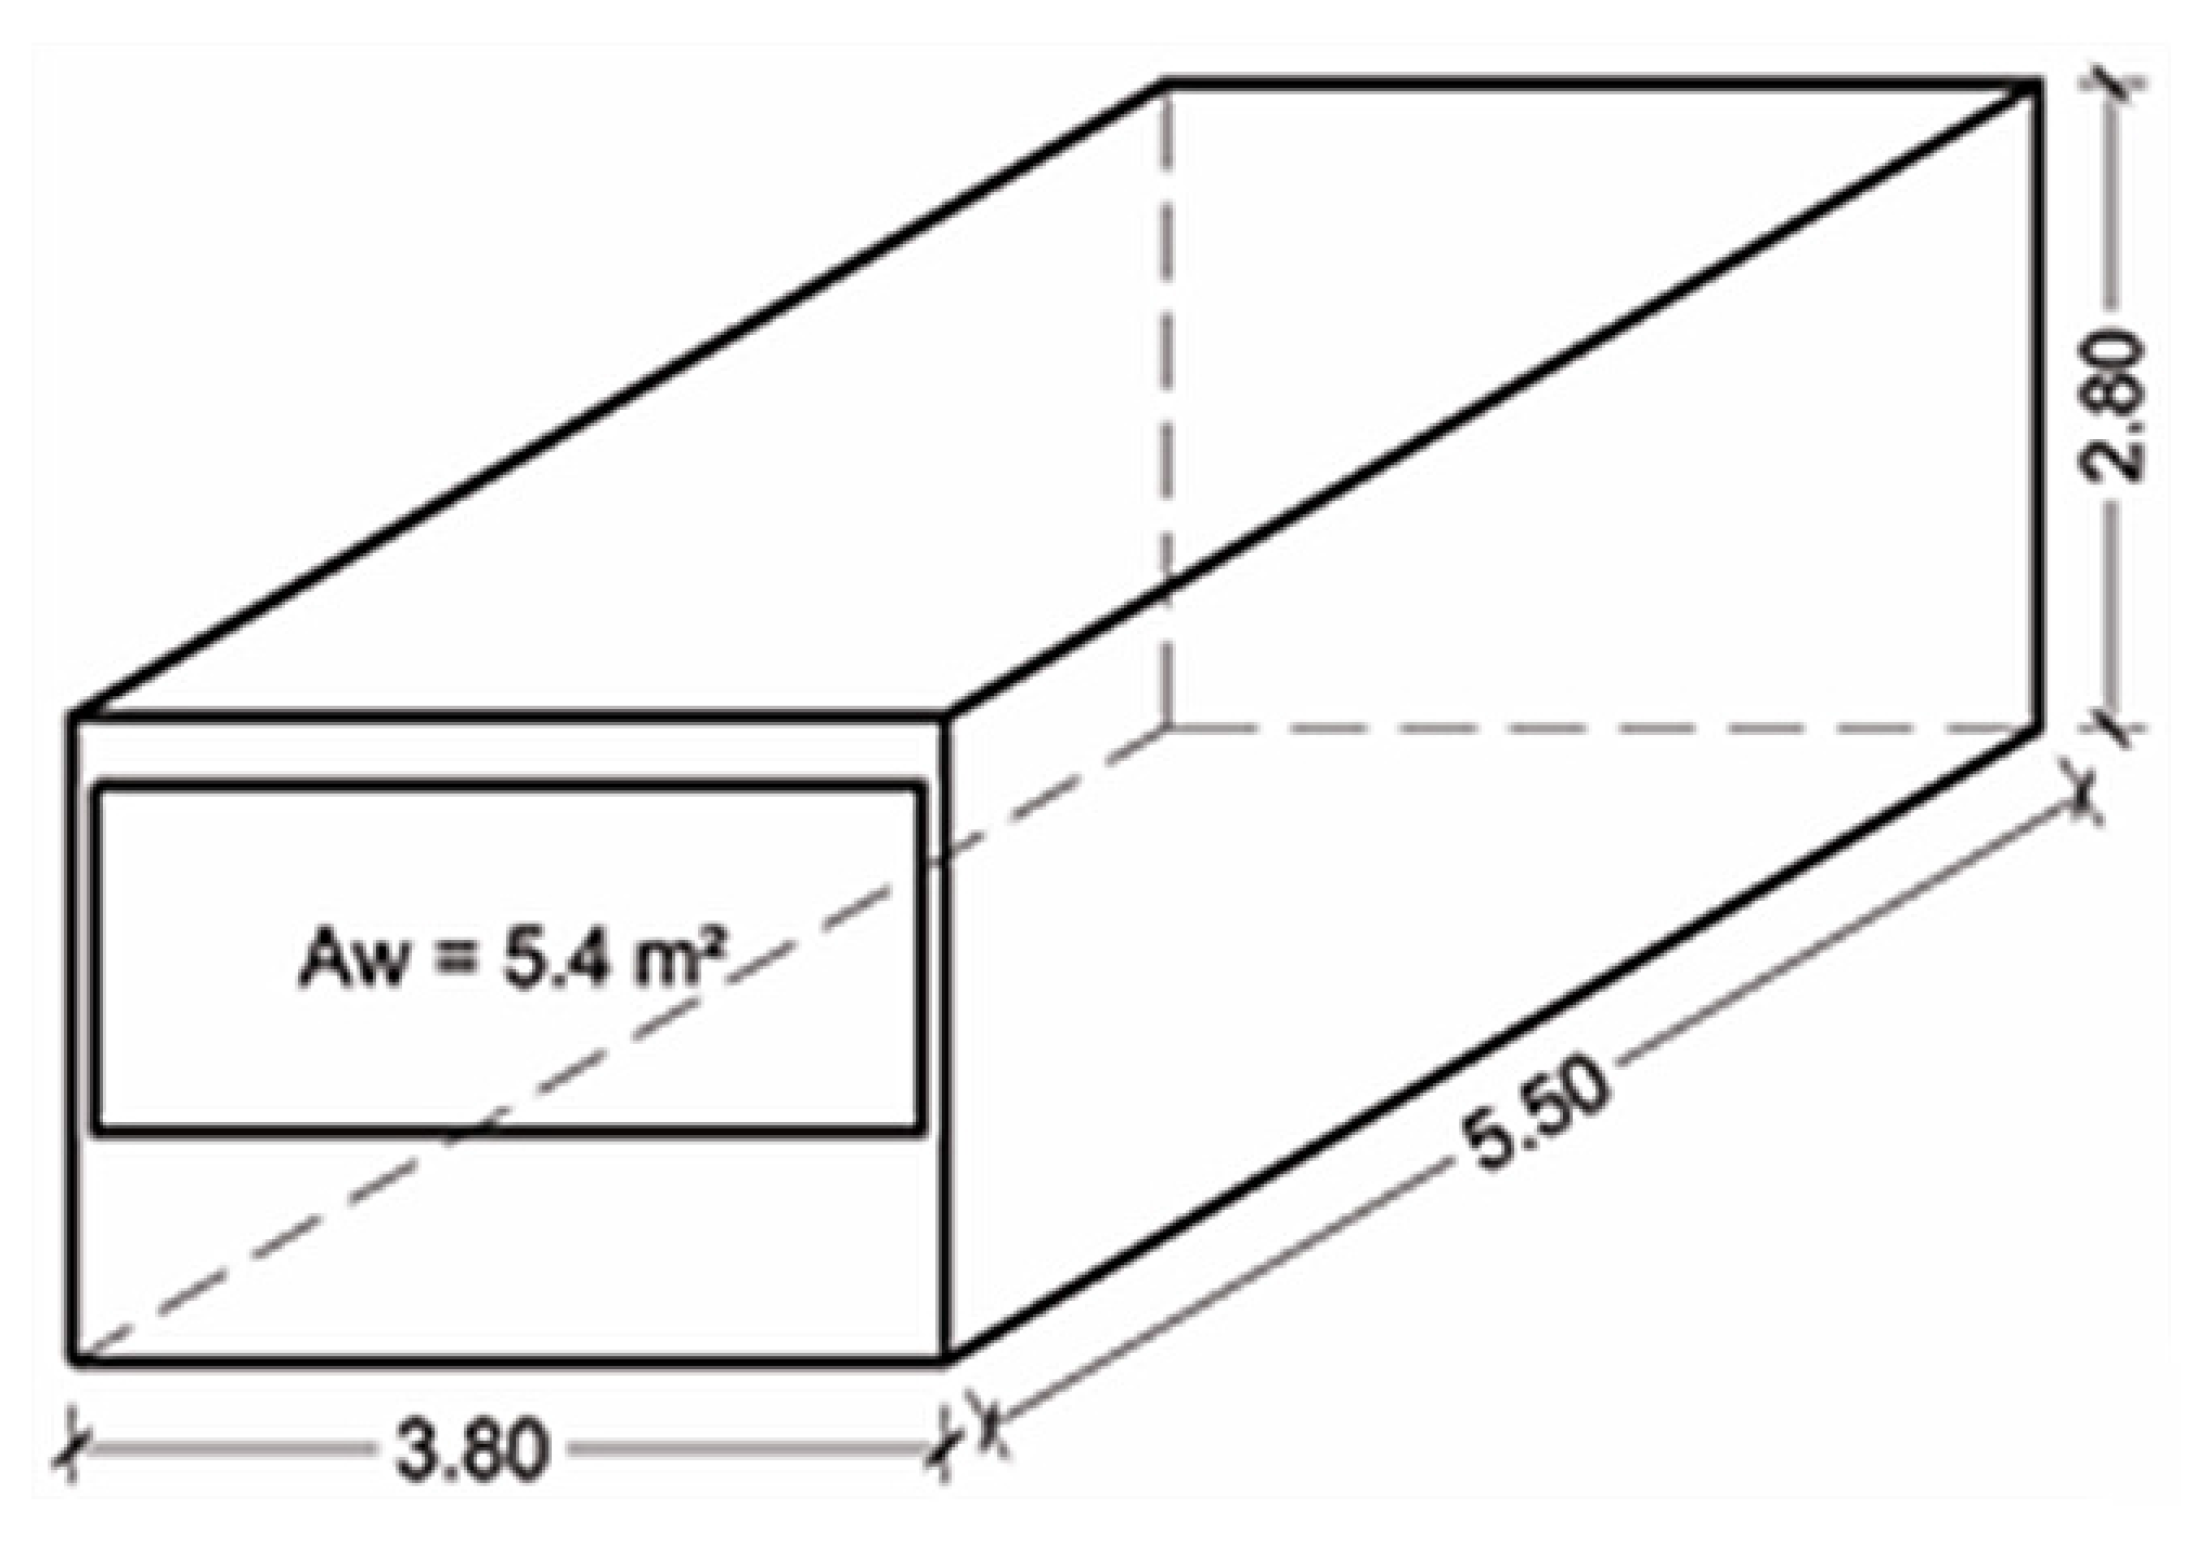
The energy requirements were calculated for a reference building unit, the geometry of which is defined in EN 15265 [
26] and ISO 13790 [
3] and is presented in
Figure 5. It is 3.6 m wide and 5.5 m long with a storey height of 2.8 m. The window covers 50% of the front wall area. This particular geometry of the reference cell was selected, since it is a representative unit of a typical office building.
Figure 5.
Axonometric plan of the reference room [
3].
Figure 5.
Axonometric plan of the reference room [
3].
For the analysis, all opaque building components of the reference cell, with the exception of the front wall, were regarded as adiabatic with a U-value equal to 0.50 W/(m
2 K). The optical properties of the surfaces are presented in
Table 2.
Table 2.
The optical characteristics of the opaque building elements of the reference cell.
Table 2.
The optical characteristics of the opaque building elements of the reference cell.
| Building element | Solar absorptance | Solar reflectance | Emissivity |
|---|
| Walls | 0.40 | 0.60 | 0.90 |
| Roof | 0.70 | 0.30 | 0.90 |
Assuming that the reference cell represents an office, it was regarded that it is occupied during the working days of the week (Monday to Friday) from 07:00 till 17:00 all around the year. Only during this operating time the heating, cooling and the mechanical ventilation are in operation. The heating and cooling set-point were considered equal to 22 °C and 24.5 °C respectively in accordance with EN 15,251 [
27]. Internal loads were regarded equal to 132 Wh per day, which account for 13.76 W/m
2 during operating period and 2 W/m
2 for the rest of the time. Infiltration was considered equal to 0.50 air changes per hour (ACH) for the Mediterranean regions and 0.2 ACH for the rest of Europe, in order to take into account the different air permeability status of the conventional structures found in southern countries. During the operating period ventilation was assumed equal to 0.8 ACH.
In order to reach more realistic results, the influence of the urban fabric on the availability of solar radiation on the vertical surfaces, a shading factor of 25% was taken into account in the analysis. Furthermore, the orientation of the front façade was regarded as an additional variable in the analysis.
In order to define the relationship between Cooling Degree Days and Heating Degree Days with the energy performance of the reference building cell, 15 cities were selected from the 121 of the first analysis, on the basis of covering the geographical area of Europe and at the same time, representing the different climatic conditions defined by the climatic zones established through the first and the second approach described in the previous section. The amount of Heating and Cooling Degree Days calculated for the selected 15 cities is presented in the secondary axis of
Figure 6 and
Figure 7 respectively.
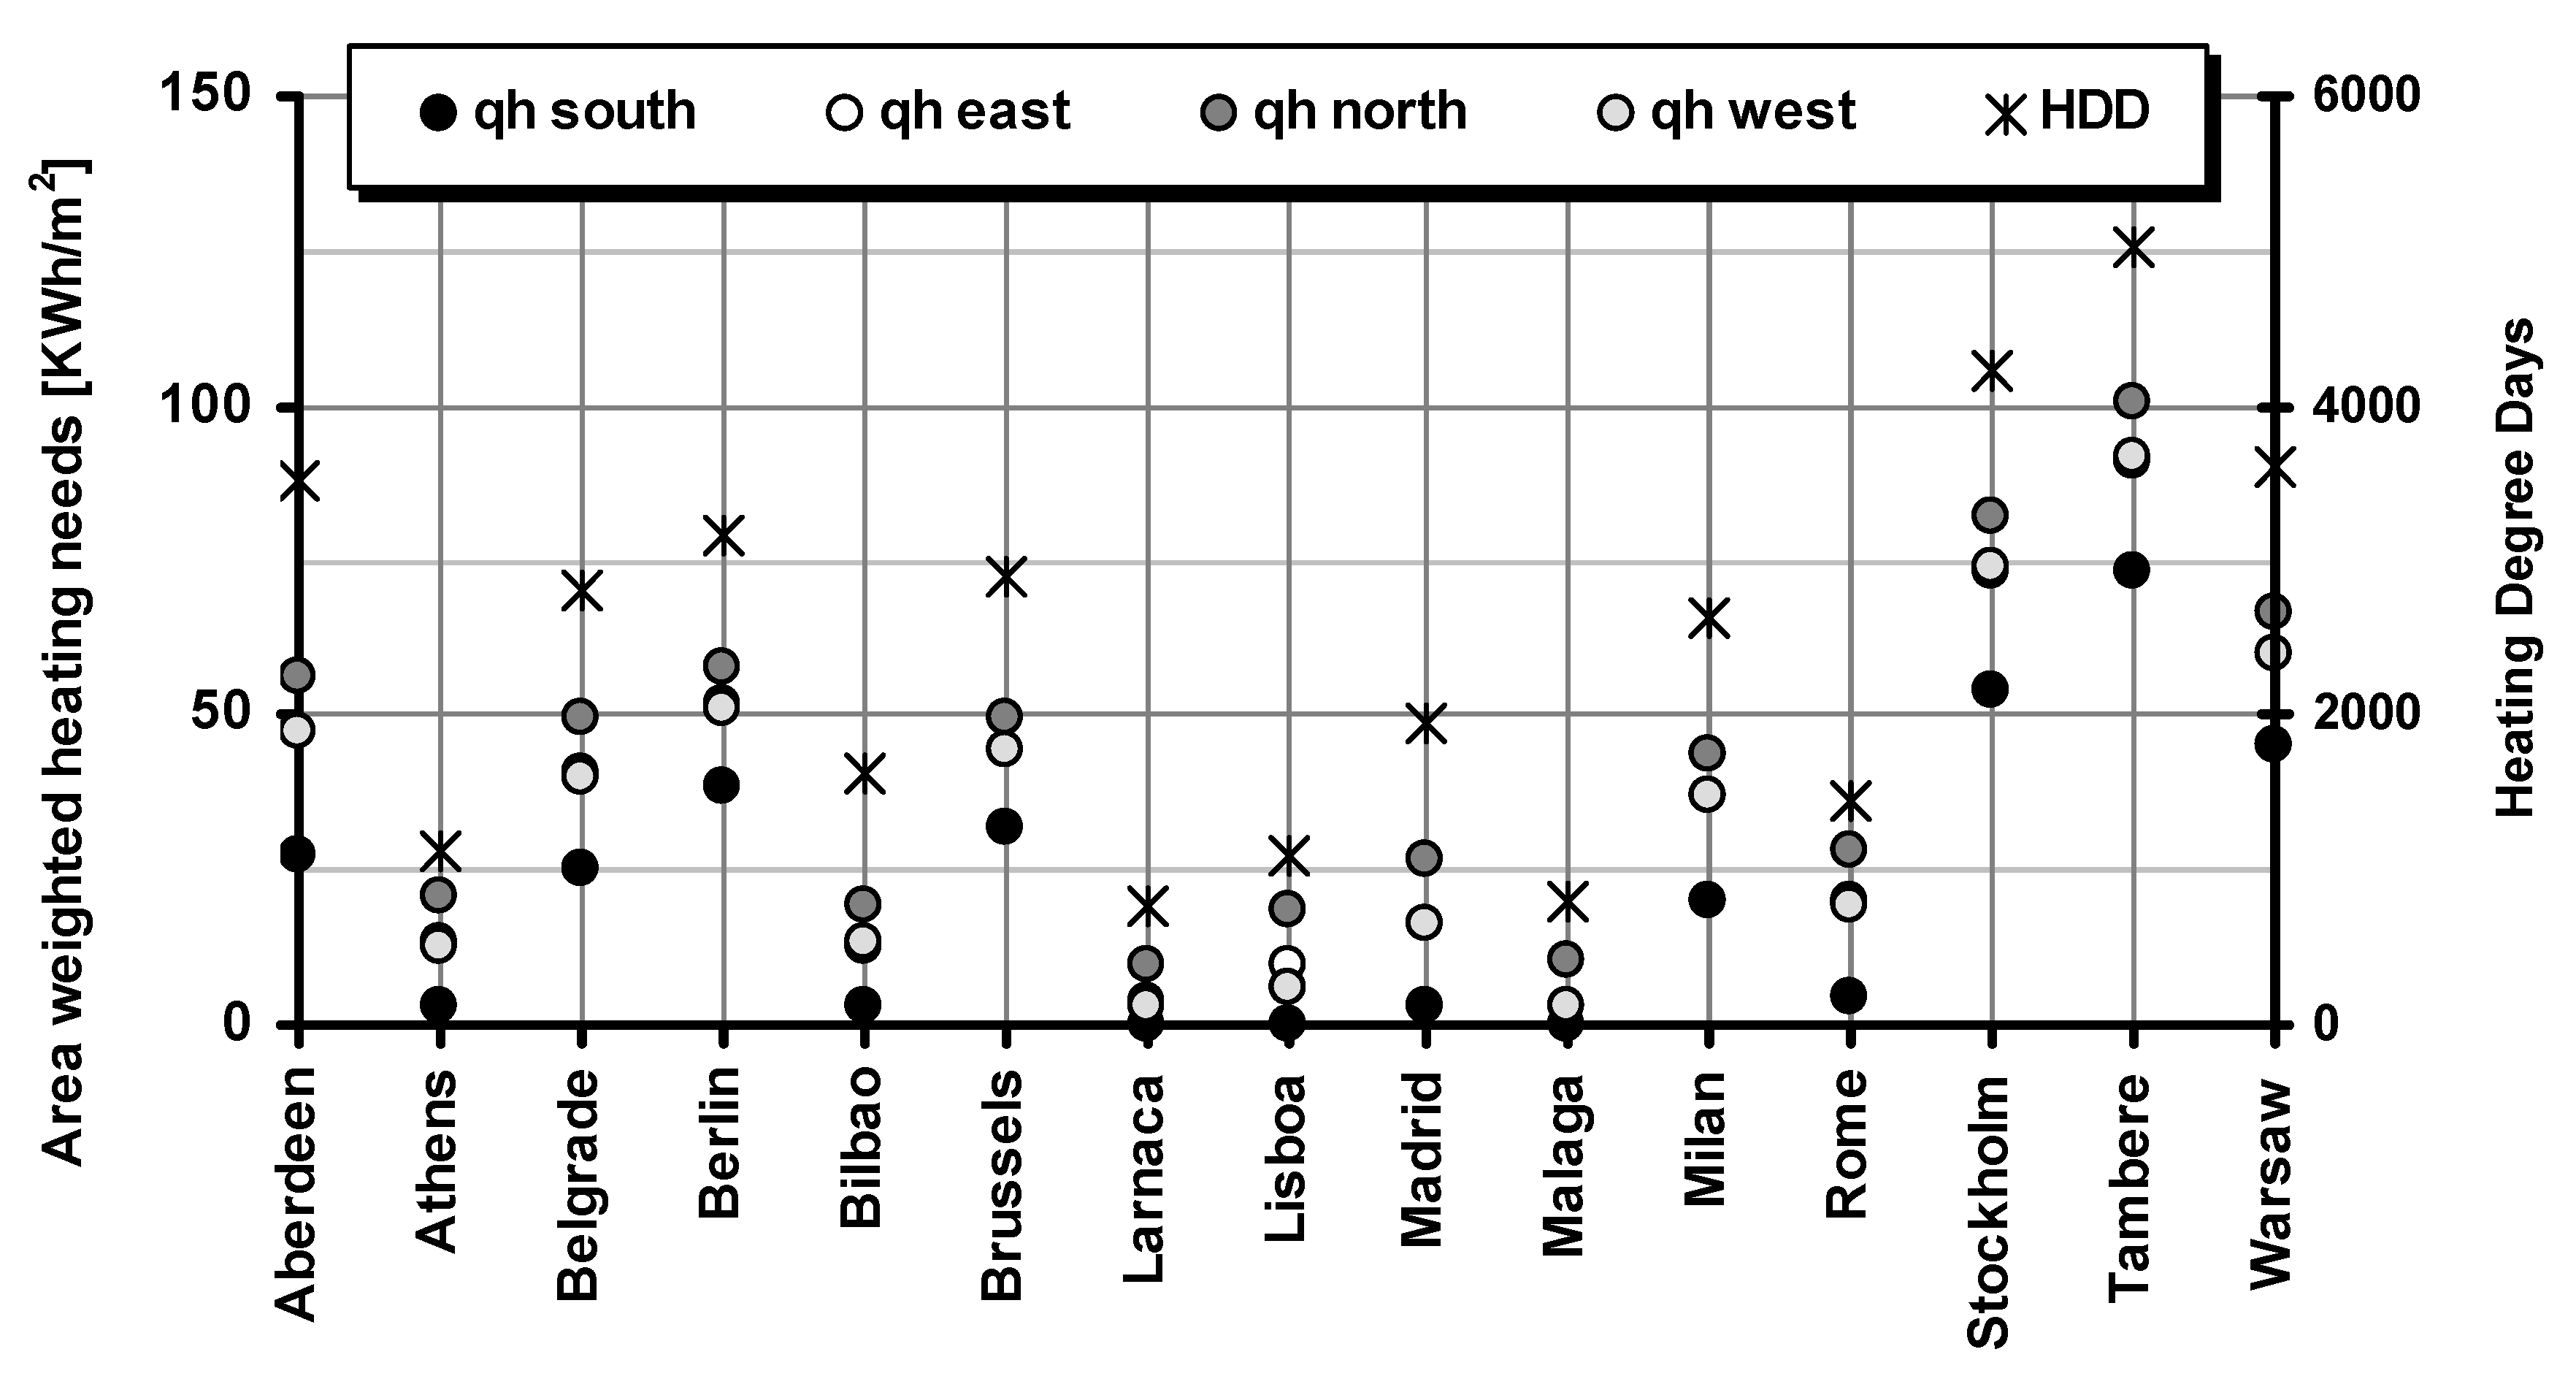
Figure 6.
The area weighted heating needs of the building unit located in the 15 selected cities, with regard to their amount of Heating Degree Days.
Figure 6.
The area weighted heating needs of the building unit located in the 15 selected cities, with regard to their amount of Heating Degree Days.
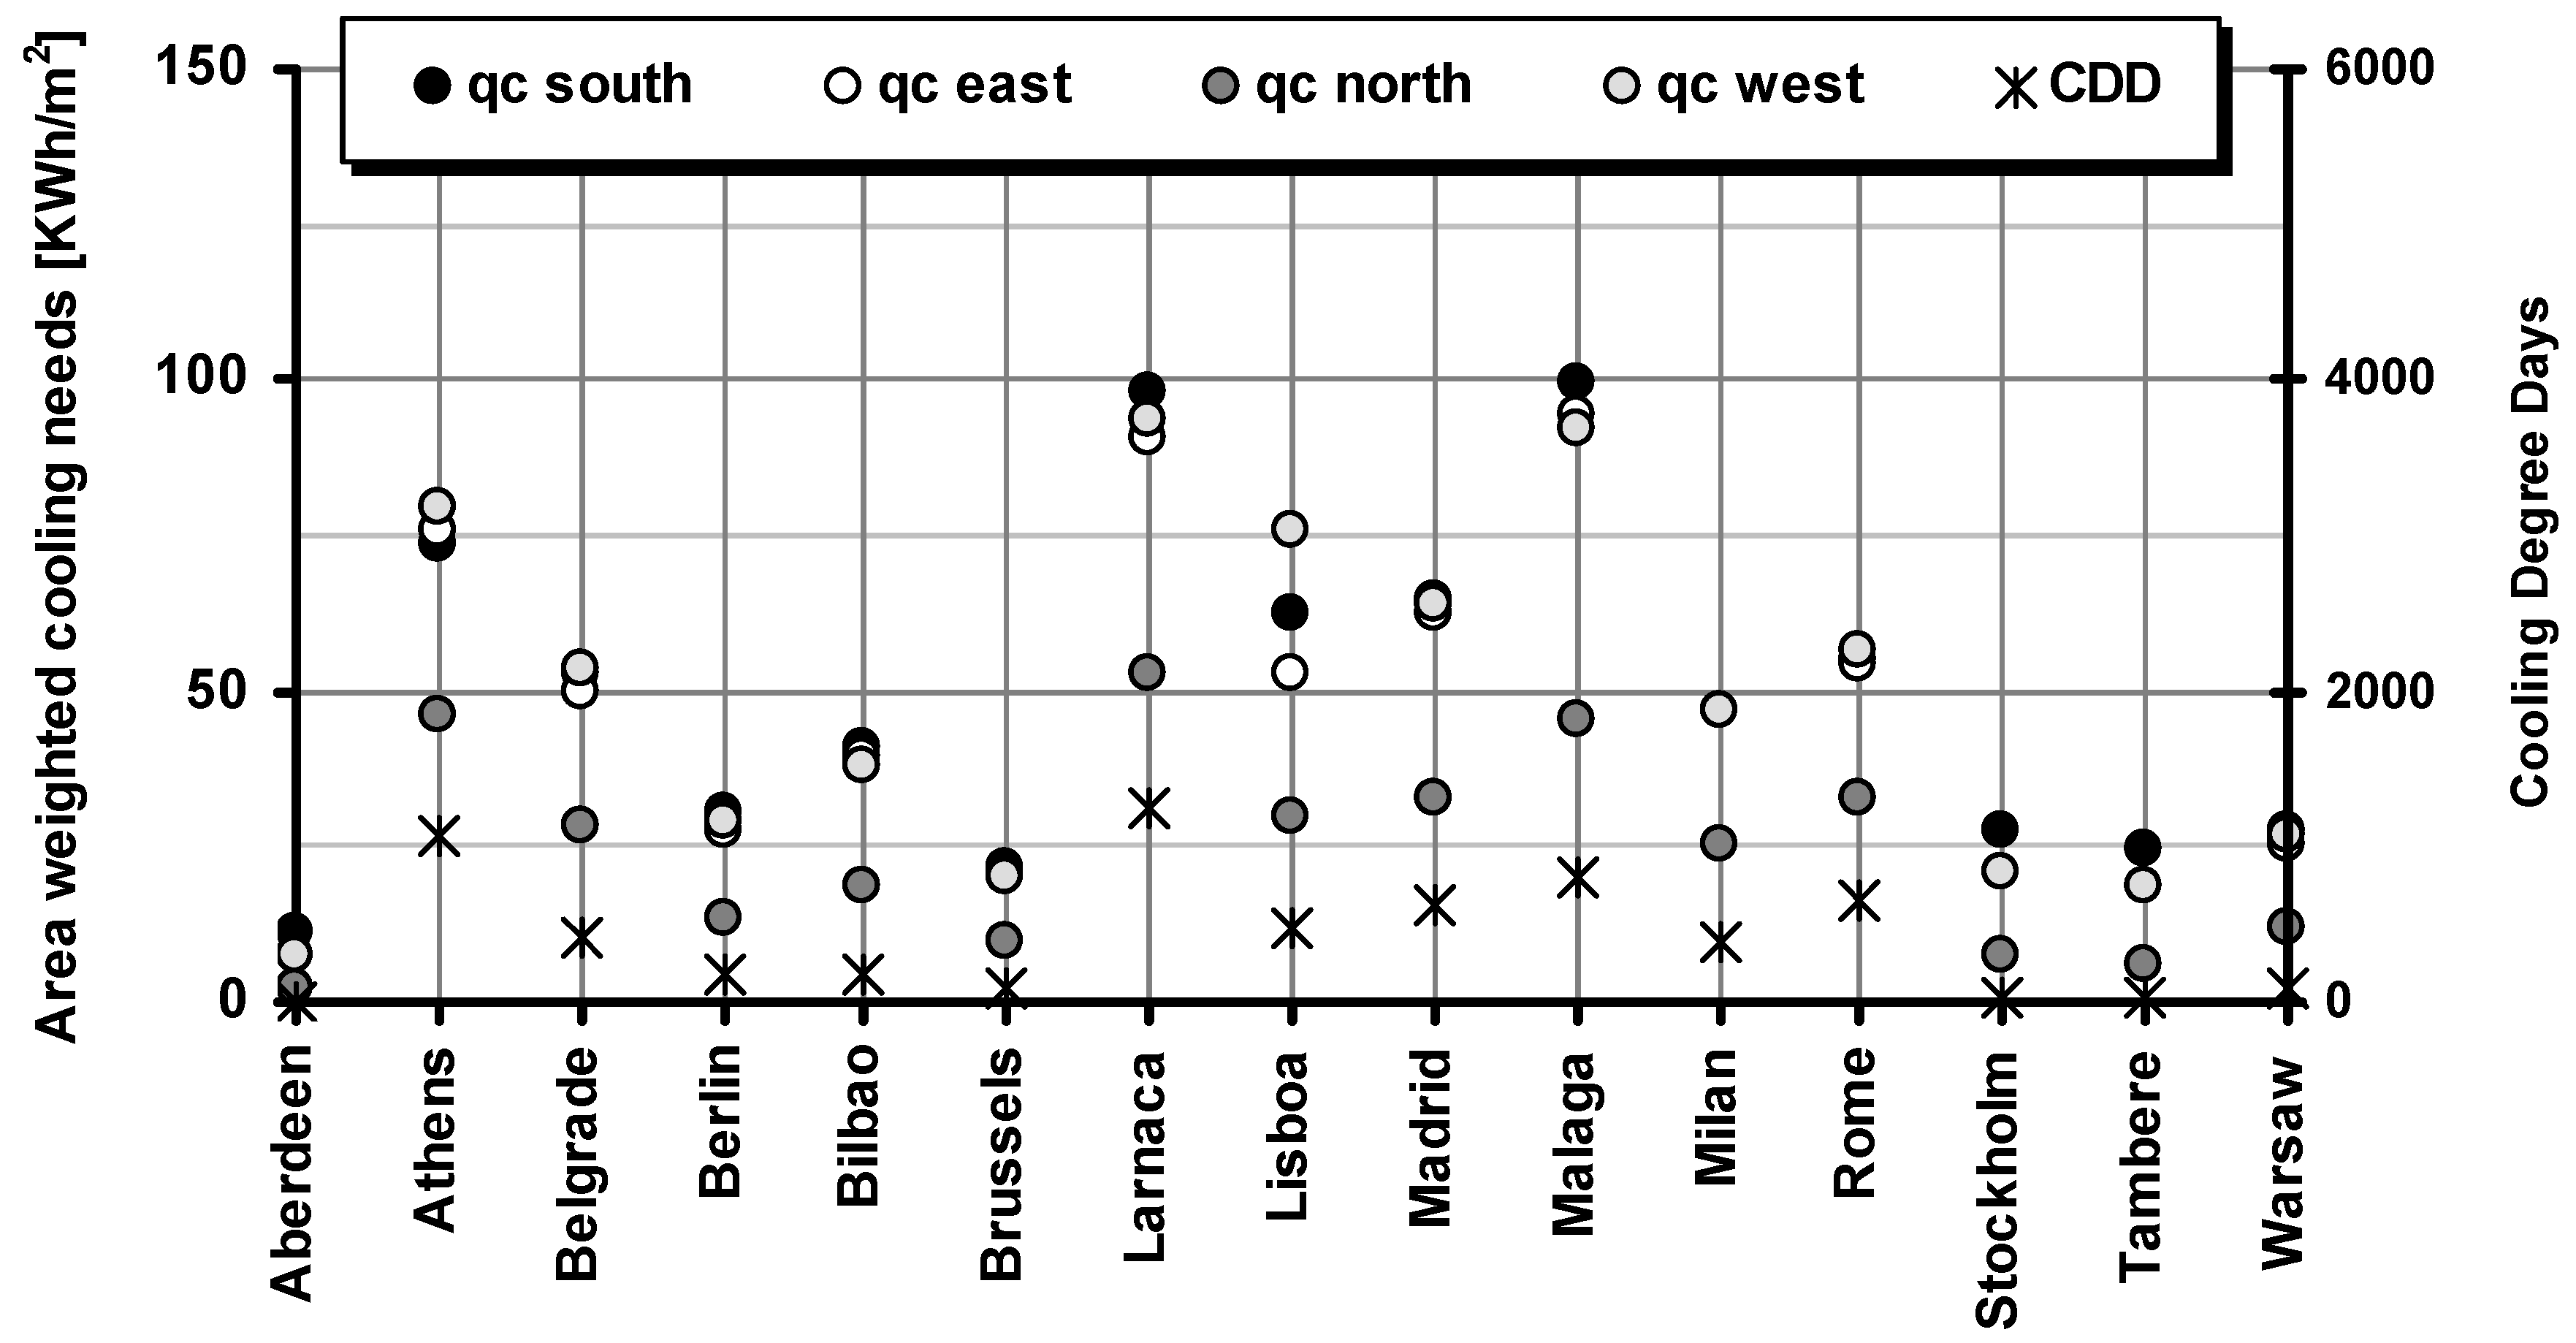
Figure 7.
The area weighted cooling needs of the building unit located in the 15 selected cities, with regard to their amount of Cooling Degree Days.
Figure 7.
The area weighted cooling needs of the building unit located in the 15 selected cities, with regard to their amount of Cooling Degree Days.
Figure 6 and
Figure 7 show the area weighted heating (
qh) and cooling (
qc) energy needs of the reference cell respectively, calculated for the 15 selected cities, ranging from 0 to 150 kW∙h/m
2 at a step of 50 kW∙h/m
2. On the secondary y-axis of the diagrams, Heating (and Cooling Degree respectively) Days are indicated for each city, ranging from 0 to 6000 at a step of 2000.
In general, it is depicted that both the heating and cooling energy needs follow the distribution of heating and cooling degree days. As regard heating, it is obvious that for the cities with high HDD (Stockholm, Tampere, Warsaw) the heating needs are increased; in other cities of Northern Europe (Aberdeen, Belgrade, Berlin, Brussels, Milan) the heating needs range in relatively lower levels. The climate prevailing in cities located in the Mediterranean regions is much milder, which is clearly depicted in the significantly lower values of heating requirements.
Moreover, the bullets representing the heating needs for south-orientated reference cell represents the cases with lower requirements for all cities; north orientated models apparently have higher energy requirements. Eastern and western orientations follow the same distribution.
Cooling needs show a slightly different pattern among the 15 cities; building units located in the Mediterranean zone appear to have increased cooling requirements, which are even higher than the heating needs in the central European regions. For most cities of Northern Europe the cooling energy needs range in very low levels. As regards orientation, it is obvious that the requirements for north orientated models are significantly lower for north orientated ones in all cases. In most cases, the cooling requirements for all other orientations almost coincide.
A more detailed analysis of
Figure 6 and
Figure 7 shows that a clear distinction between cities on the basis of cooling and heating needs can be made; for example, there are areas with:
- –
high heating needs and low cooling needs (i.e., Stockholm, Tampere, Warsaw)
- –
high heating needs and medium cooling needs (i.e., Belgrade, Berlin),
- –
medium heating needs and low cooling needs (i.e., Aberdeen, Brussels),
- –
medium heating needs and medium cooling needs (Bilbao, Rome, Milan),
- –
low heating needs and high cooling needs (Athens, Larnaca, Lisbon, Madrid, Malaga).
4. Comparative Analysis and Conclusions
In order to evaluate the two approaches of establishing climatic zones, the locations that were selected in the analysis were classified in zones according to the two approaches (amount of HDD solely and combination of HDD and CDD). Apart from the classification of the sites into the climatic zones, the area weighted heating and cooling energy needs calculated through the dynamic simulation for each city are also presented in
Table 3.
Table 3.
The heating and cooling degree days, the area weighted needs calculated for heating and cooling, as well as the zone classification according to the two approaches for each location.
Table 3.
The heating and cooling degree days, the area weighted needs calculated for heating and cooling, as well as the zone classification according to the two approaches for each location.
| CITY | Degree days | Area weighted needs q | Climatic zone |
|---|
| HDD | CDD | Heating | Cooling | In total | 1st appr. | 2nd appr. |
|---|
| Aberdeen | 3503 | 2 | 27 | 11 | 38 | C | E |
| Athens | 1112 | 1075 | 3 | 73 | 76 | A | A |
| Belgrade | 2798 | 423 | 25 | 53 | 78 | B | D |
| Berlin | 3155 | 170 | 38 | 31 | 69 | C | E |
| Bilbao | 1612 | 171 | 3 | 41 | 44 | B | D |
| Brussels | 2911 | 95 | 32 | 21 | 53 | B | D |
| Larnaca | 759 | 1260 | 0 | 98 | 98 | A | A |
| Lisboa | 1087 | 474 | 0 | 63 | 63 | A | C |
| Madrid | 1965 | 628 | 3 | 65 | 68 | B | B |
| Malaga | 796 | 791 | 0 | 99 | 99 | A | A |
| Milan | 2639 | 380 | 20 | 47 | 67 | B | D |
| Rome | 1443 | 648 | 4 | 55 | 59 | A | A |
| Stockholm | 4239 | 36 | 54 | 27 | 82 | C | E |
| Tambere | 5020 | 23 | 73 | 25 | 97 | C | E |
| Warsaw | 3614 | 103 | 45 | 27 | 72 | C | E |
As was expected, the energy behavior of the building unit follows in general terms the trend indicated by the amount of HDD and CDD [
28]. Moreover, the cases with high HDD and CDD are classified through both approaches in the same category, the coldest or the warmest one respectively (
i.e., Aberdeen, Berlin, Stockholm, Tampere, Warsaw, Athens, Larnaca, Malaga, Rome).
On the contrary, there are areas with medium heating needs, which have either high or low cooling needs. These locations belong in zone B according to the 1st approach of climatic zone establishment, but appear to be part of zone D in the case of colder winter conditions (Belgrade, Bilbao, Brussels, Milan) or B, in the case of milder winters (Madrid) with regard to the second approach.
Moreover, it is worth mentioning that the proposed climate zones approximate adequately the Koeppen climate classification, which is the first and still the most widely used objective scheme towards this direction [
29]. It is based on the concept that native vegetation is the best expression of climate and takes into account different latitudinal zones (based on extreme temperatures) as well as seasonality in both temperature and precipitation [
29,
30,
31]. Although the proposed approach is based solely on the amount of heating and cooling degree days and is mainly building orientated, its application in the examined cities (
i.e.,
Figure 4) leads to a classification with significant similarities with the maps produced on the basis of Koeppen climate classification found in relevant literature [
29,
30,
31]. For example, most cities situated in southern Europe along the Mediterranean coast belong in zone A according to the proposed approach, as well as in “Warm Mediterranean Climate” zone (type Csa) of Koeppen classification. Cities located in the coastline of southeast France, Northern Italy, Adriatic Sea and Northern Greece form zone B in the proposed approach and “Warm temperate climate” (type Cfa) in the Koeppen classification. Along the western coastline of the Iberian Peninsula “Temperate Mediterranean Climate” prevails according to Koeppen (type Csb); zone C in the proposed approach covers the same geographical area. The rest of Europe is divided in two zones (types) in both schemes: “temperate maritime climate” (type Cfd) and “temperate continental climate” (type Dfb), which are associated to zone D and zone E respectively in the proposed approach. It must be mentioned that the exact borders of the two schemes do not always coincide; however, the proposed approach follow the general trend of the robust Koeppen classification.
From the above analysis, it can be depicted that the classification of locations into climatic zones on the basis of both heating and cooling degree days leads to more realistic results, especially when it is applied for the assessment of buildings’ energy performance. Nowadays, cooling loads form an important part of the total energy consumption in office buildings, not only in the Mediterranean, but also in the whole Europe, due to the increased internal loads and the controlled ventilation techniques [
32].


