4.1. Intrinsic Permeability without Hydrates
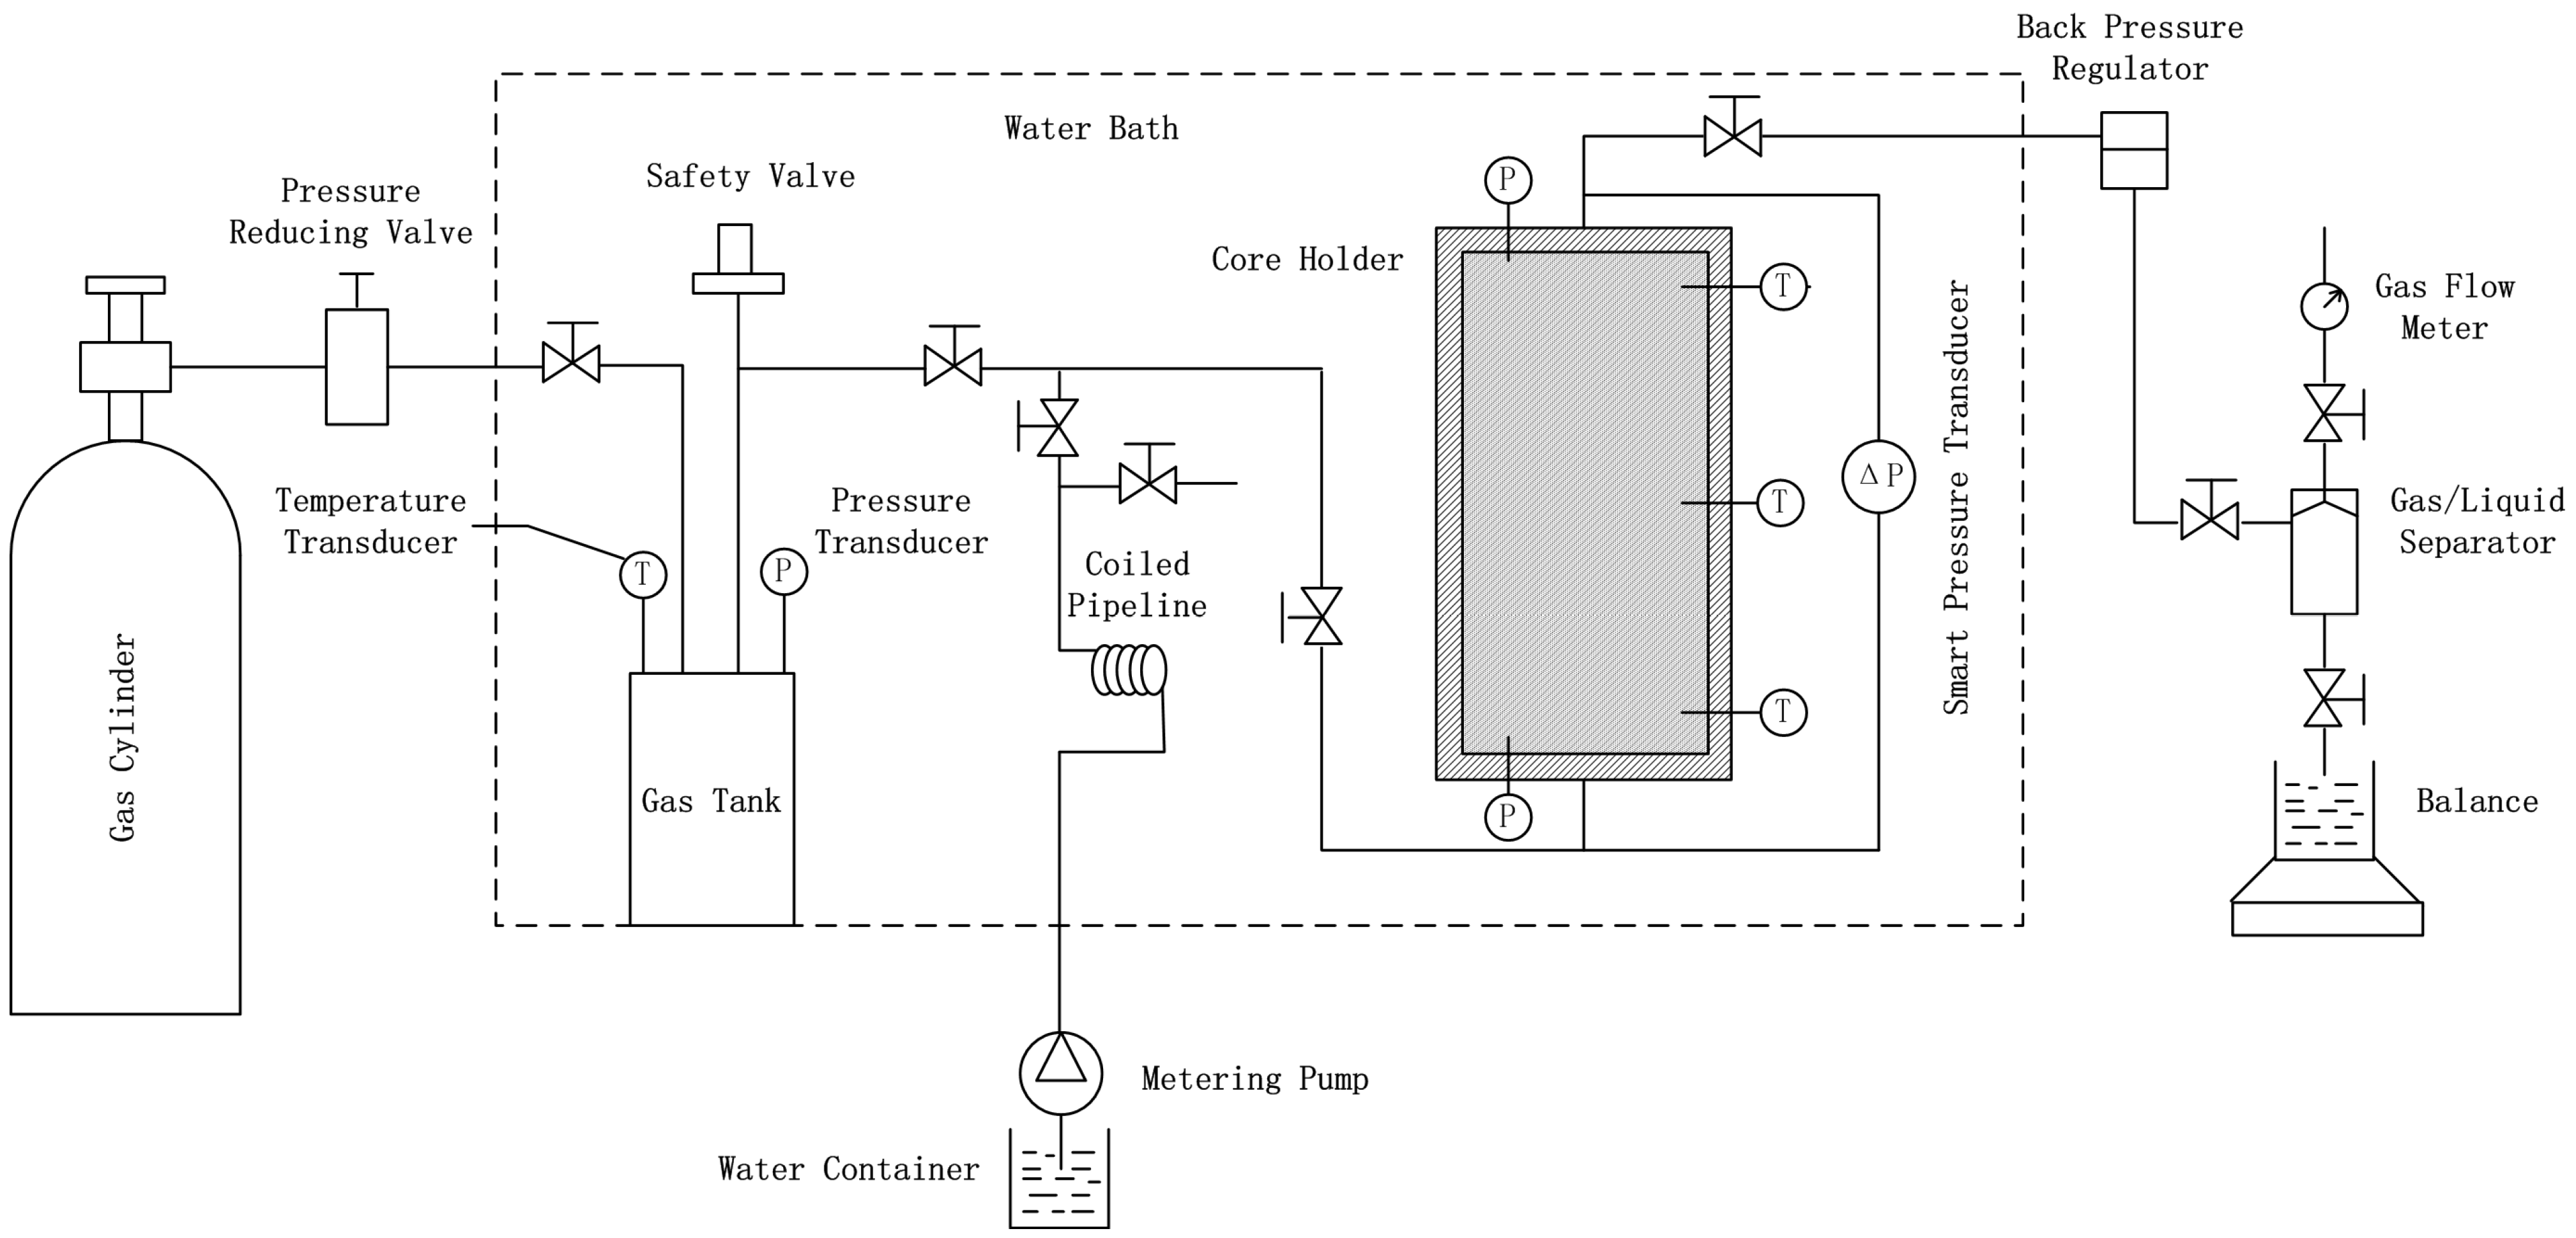
Figure 2a,b shows the dependences of the differential pressure Δ
P and the intrinsic permeability
k of the core sample on the water injection rate
Q and the system pressure
P, respectively. Three cases are performed with
P = 0, 6.5 and 15.5 MPa, respectively. The water injection rate increases from 10 to 50 mL/min in each case. Generally, each case shows fine linear relationship between
Q and Δ
P, and the differential pressure nearly keeps the same under different system pressures at the same injection rate, as shown in
Figure 2a. This indicates that the fluid flow in the core holder follows Darcy’s flow regime, and the system pressure has little effect on the water flow state in the porous media (especially under low
Q conditions). The difference of Δ
P at high injection rates (about
Q > 30 mL/min) under different system pressures may be caused by the compression effect of the residual gas in the pores. When the system is pressurized from 0 to 6.5 MPa and further to 15.5 MPa, the residual gas is compressed and the gas viscosity increases, resulting in larger viscous effect on the water flow. However, this deviation is not obvious when the injection rate is controlled within a proper level (e.g., 30 mL/min in this study).
Based on the Δ
P data, the intrinsic permeability
k0 of the porous media is calculated according to Equation (3). The characteristics of
k0 under different injection rates and system pressures are shown in
Figure 2b. As expected, the three curves are very close with each other, and they are nearly parallel with the
x-axis. The slight decrease of
k0 under high pressures is also caused by the compression effect of the residual gas when its viscous effect becomes more obvious, as discussed above. The average
k0 of the three cases is 49.2 Darcies, and it is determined to be the intrinsic permeability of the porous media without hydrate formation in this study.
Figure 2.
Characteristics of (a) the differential pressure; and (b) the intrinsic permeability under different injection rates and system pressures.
Figure 2.
Characteristics of (a) the differential pressure; and (b) the intrinsic permeability under different injection rates and system pressures.
4.2. Hydrate Formation
The hydrate formation experiment is carried out after the intrinsic permeability measurements. Methane gas is injected into the core sample from the gas tank after some water is removed from the core holder through gas displacement. The amount of the injected methane gas Δ
n1 (mol) is calculated by Equation (4):
where
Vtank is the volume of the gas tank (mL);
Vg1 and
Vg2 are, respectively, the mole volume of gas in the tank before and after the injection (mL/mol). After the gas injection stage, the system pressure
P rises from 0.68 to 6.15 MPa. Then the gas tank is closed, and
P is raised from 6.15 to 17.61 MPa through additional water injection. The total volume of the additionally injected water is Δ
Vw = 13.95 mL. Assuming the incompressibility of water under high pressures, the following equations can be established:
where Δ
n2 is the mole number of the injected methane gas from the gas tank (mol, theoretically equal to Δ
n1);
Vpore1 and
Vpore2 are the effective pore volumes for gas accumulation before and after the water injection, respectively (mL).
Vm1 and
Vm2 are the mole volumes of gas in the holder before and after the gas injection, respectively, while
Vm3 is the mole volume of gas after the water injection (mL/mol). All the mole volumes of gas are determined using the Peng-Robinson equation through
P and
T measurements shown in
Table 1. According to these data, all the important unknown parameters in Equations (4)–(7) are solved to be: Δ
n1 = 0.0539 mol, Δ
n2 = 0.0565 mol,
Vpore1 = 20.20 mL and
Vpore2 = 6.25 mL. The deviation of Δ
n2 from Δ
n1 is less than 5%, indicating the reliability of this method for controlling and precisely computing the amount of the injected hydrate-forming gas. The final determination of the total gas in the holder is
n0 = (Δ
n1 + Δ
n2)/2 +
Vpore1/
Vm1 = 0.0612 mol (1.371 L in standard state).
Table 1.
Temperature and pressure data for calculating the mole number of the injected gas and the effective gas volume.
Table 1.
Temperature and pressure data for calculating the mole number of the injected gas and the effective gas volume.
| Stage | Device | P (MPa) | T (K) | Vgas (mL/mol) |
|---|
| Before gas injection | Gas tank | 6.61 | 281.20 | 297.77 |
| Core holder | 0.68 | 281.22 | 337.59 |
| After gas injection | Gas tank | 6.24 | 281.13 | 318.06 |
| Core holder | 6.15 | 281.16 | 323.46 |
| After water injection | Core holder | 17.61 | 281.31 | 100.12 |
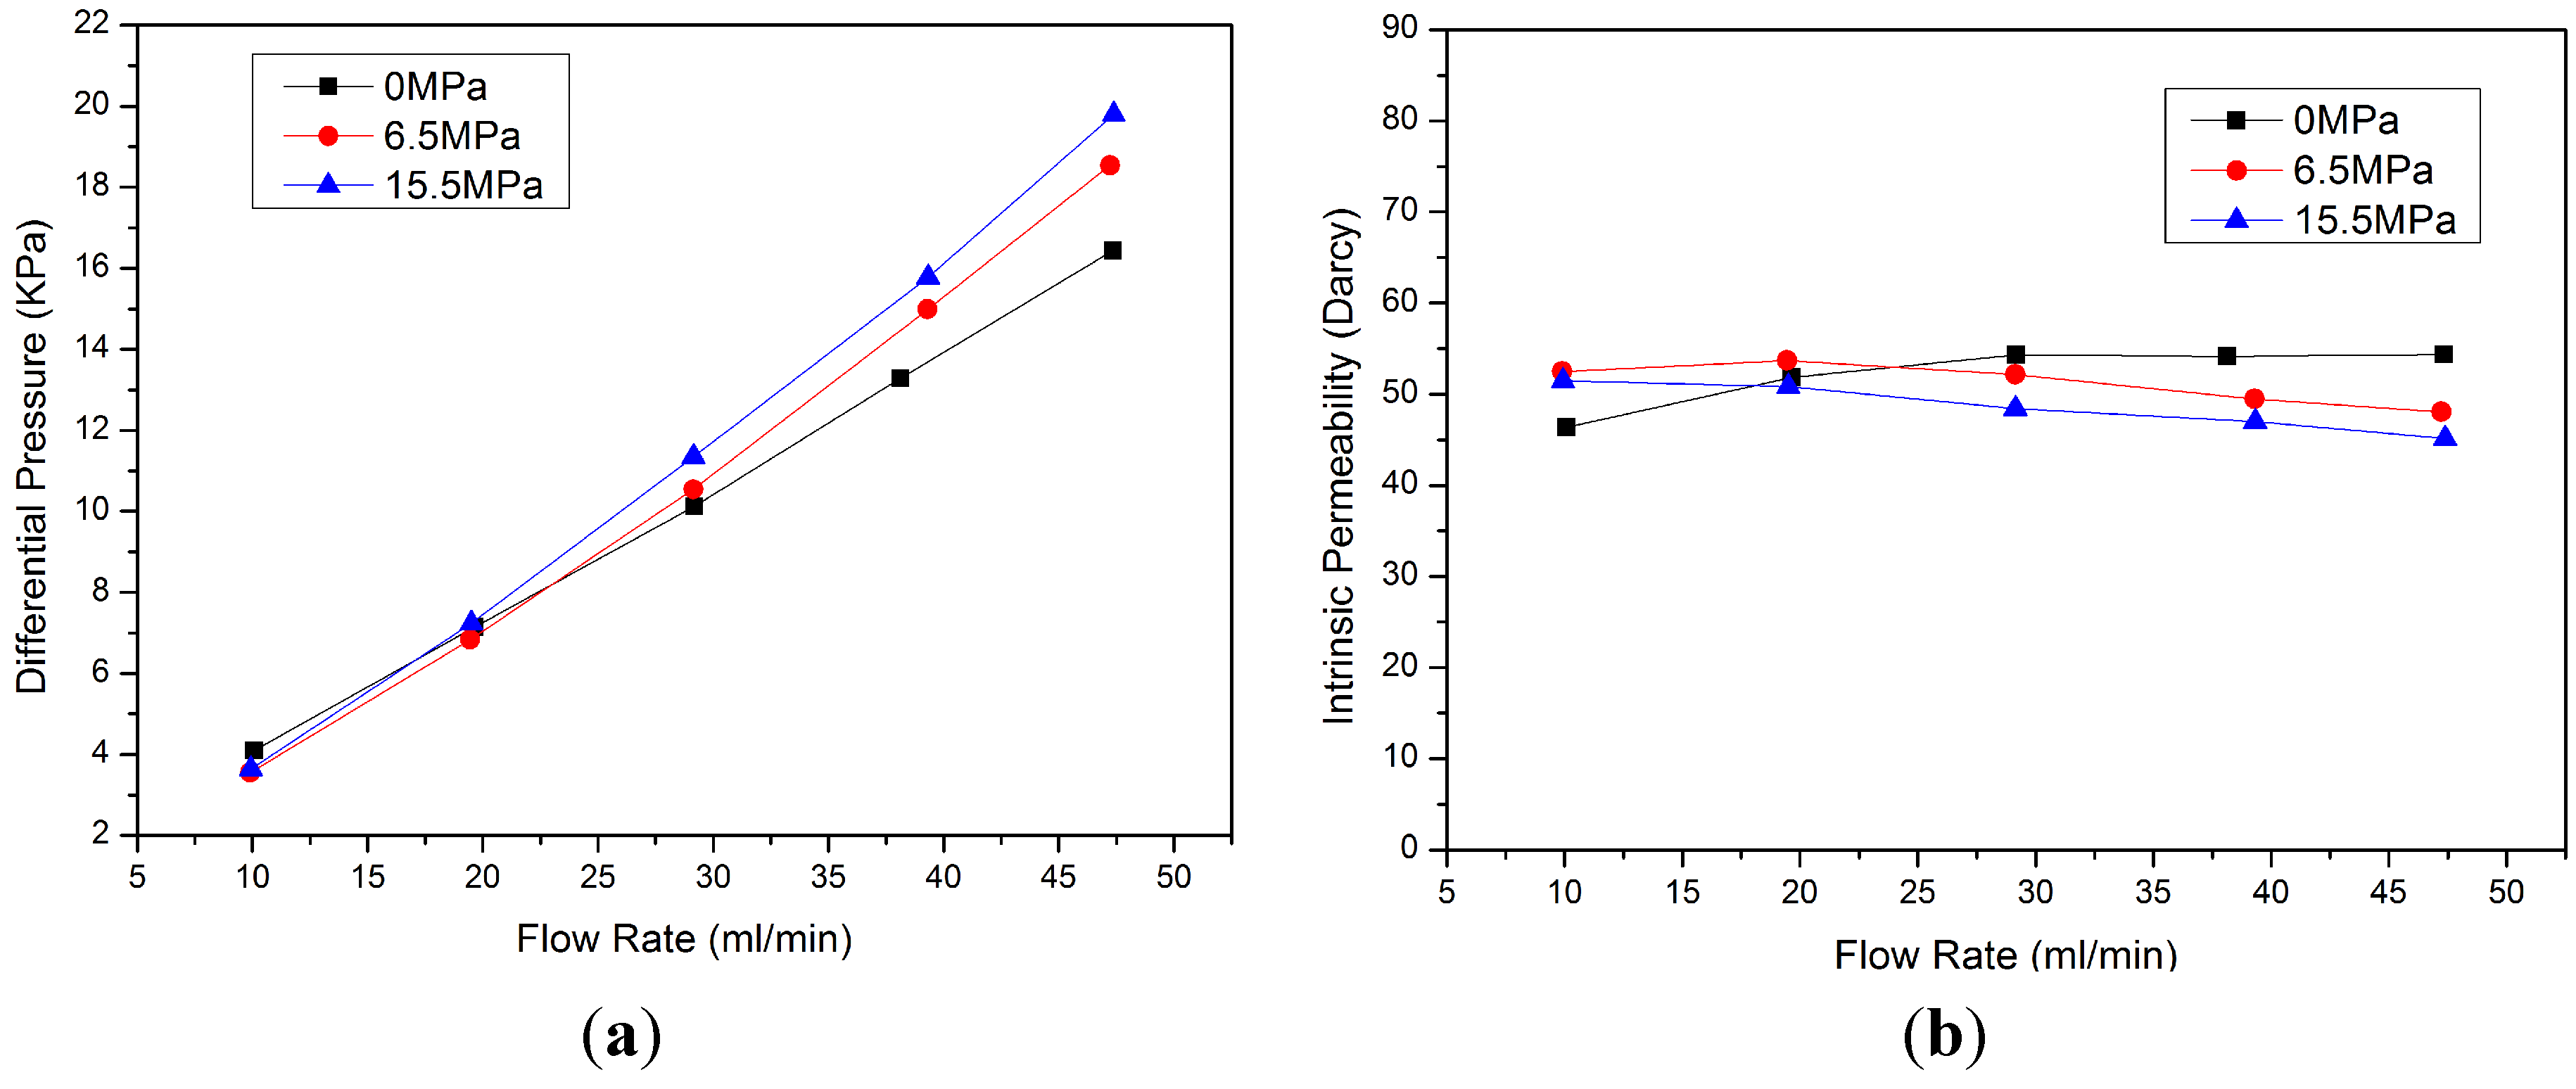
Figure 3 shows the evolutions of the inlet and outlet pressure during the hydrate formation process. It can be seen that the pressure decreases sharply in the early stage (
t < 1000 min), indicating a relatively high gas consumption rate. Then the decent speed slows down, and another 2.15 mL water is injected into the core holder to raise the pressure to about
P = 20.90 MPa at
t = 4320 min. It is aimed to keep the pressure driving force at a high level and to reduce the effective gas volume. However, the rate of pressure decent in
Figure 3 seems not to increase obviously after the second water injection, which may be caused by the decreased gas-water contact area. When the pressure nearly stops decreasing, the hydrate formation is ended, and the phase saturations are calculated using the following method.
Figure 3.
Evolutions of the inlet and outlet pressure during the hydrate formation.
Figure 3.
Evolutions of the inlet and outlet pressure during the hydrate formation.
Assuming the incompressibility of the sand grains, the total pore volume
Vpore of the core holder remains constant (35.0 mL) at any time point during the hydrate formation.
Vpore can be expressed as:
where
VH,
VG, and
VW are the volumes of the hydrate, gas, and water present in the core holder, respectively. At time
t, they are calculated in the following equations:
where
Vgas is the mole volume of methane gas (mL/mol);
n0 is the initial amount of gas at the beginning of hydrate formation (mol);
n is the remaining gas during hydrate formation (mol);
VW0 is the initial volume of water (mL); Δ
Vw is the additionally injected water during hydrate formation (0 and 2.15 mL before and after
t = 4320 min, respectively);
NH is the hydration number (5.75);
MW and
MH are the mole mass of water and hydrate, respectively (g/mol);
ρW and
ρH are the density of water and hydrate, respectively (g/mL).
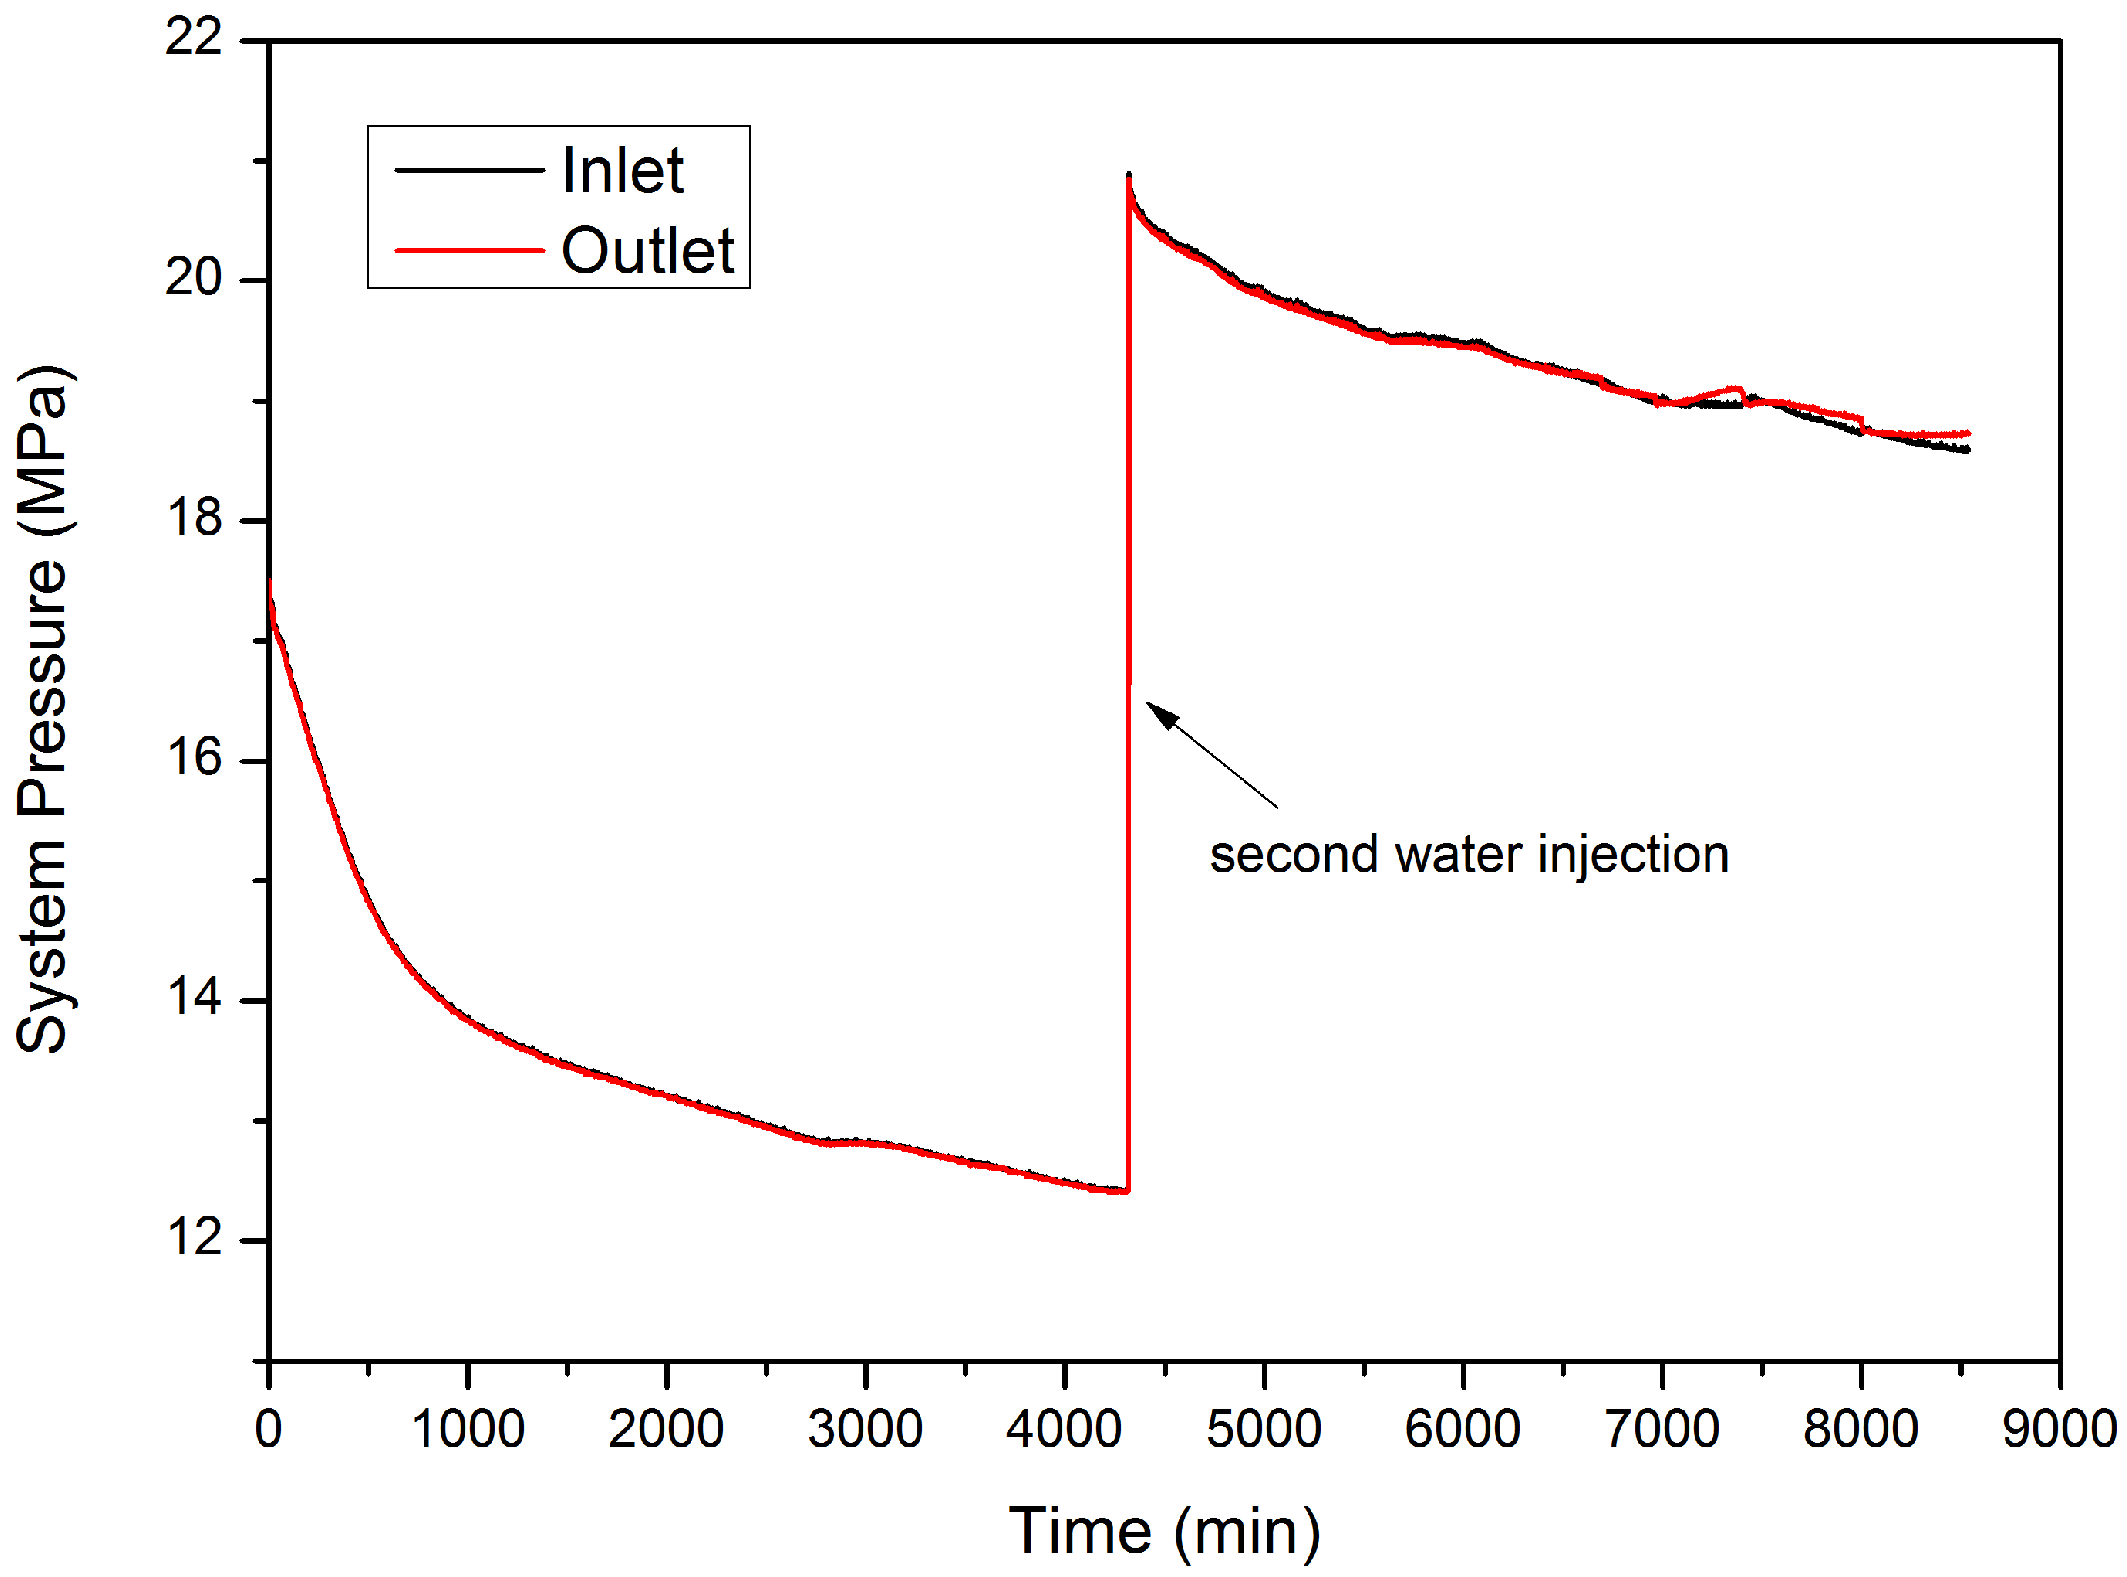
Based on the Peng-Robinson equation of state, the evolutions of hydrate and gas saturations (
SH and
SG) during the formation stage are calculated by solving Equations (8)–(11) simultaneously, and they are plotted in
Figure 4. It is shown that the hydrate formation rate is very fast in the early 1000 min, corresponding to the time when the system pressure decreases sharply in
Figure 3. Then it declines to a relatively stable level in the following period. After the second water injection is finished at
t = 4320 min, small amount of hydrate is dissociated because of the disturbance brought by the injected water, and a small decline is observed in the
SH curve. Then it keeps on increasing and finally reaches 9.3% at the end of the formation process. Though the second water injection seems to have little effect on
SH,
SG is greatly reduced due to the compression effect caused by the injected water. When the formation stage is terminated,
SG declines to the minimum of about 9.7%. That is to say, in order to reduce the obstructive effect of the gaseous phase on the water flow, this method could be employed to control the gas saturation below a desired low level.
Figure 4.
Evolutions of the calculated hydrate and gas saturations during the hydrate formation stage.
Figure 4.
Evolutions of the calculated hydrate and gas saturations during the hydrate formation stage.
4.3. Effective Water Permeability Measurements
After the hydrate formation stage is ended, the flow experiment is then carried out to measure the effective water permeability of the hydrate-bearing sediments. System pressure is firstly decreased from 18.6 MPa to 15.5 MPa by the back-pressure regulator. Mass release from the core holder during this process is not observed at the outlet balance, which may be because of the limited gas remaining in the system. Then cold deionized water is injected into the core holder at constant rates of 5, 7 and 10 mL/min, respectively, in three stages.
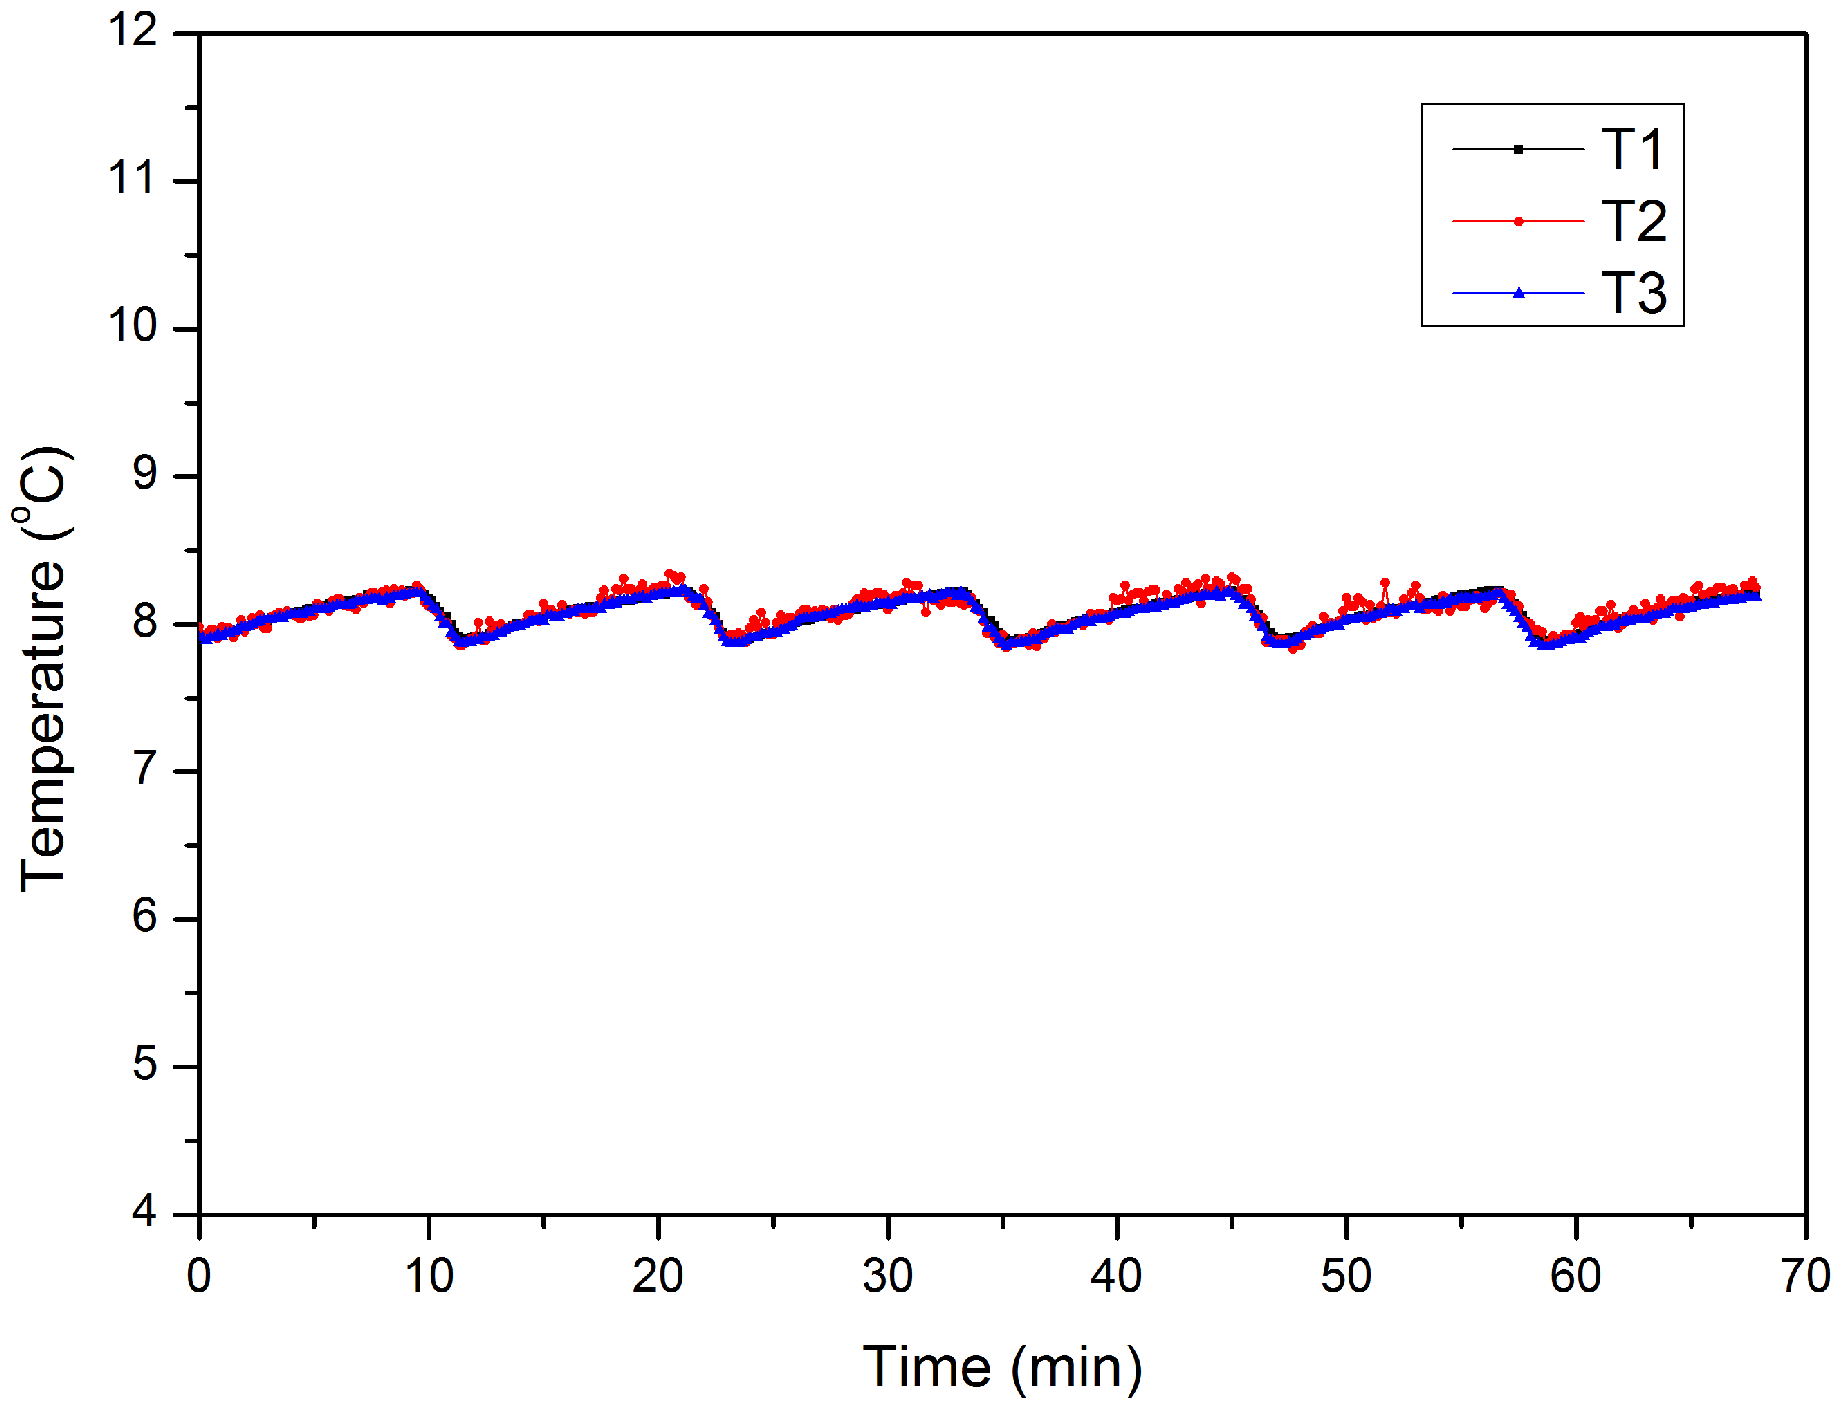
Figure 5 shows the temperature profiles of the core holder during the flow process. It is shown that the temperatures at different measuring points fluctuate regularly (around 8.0 °C, mainly caused by the heat transfer from the surroundings), and they are all lower than the equilibrium temperature (about 16.6 °C) at the working pressure of 15.5 MPa.
Figure 5.
Temperature profiles of the core holder during the flow process.
Figure 5.
Temperature profiles of the core holder during the flow process.
Figure 6 shows the evolution of the differential pressure under different water injection rates in the flow process. In Stage I (0–26 min), the
Q is set to be 5 mL/min, and it remains relatively stable in this period. The deionized water is initially cooled to about 2 °C. When the concentration of methane gas is lower than the solubility limit in the surrounding water, the hydrate crystal tends to break down and release methane by dissolution (even if the pressure and temperature conditions are still favorable for hydrate stability) [
25].
Figure 6.
Evolution of the differential pressure under different water injection rates in the flow process.
Figure 6.
Evolution of the differential pressure under different water injection rates in the flow process.
When the deionized water is injected, the balance between the hydrate and the dissolved methane in the initial system is broken down, and gas is released from hydrate dissolution. In other words, the amount of solid hydrate will gradually decrease under successive water injection conditions, and the flow will become easier with the hydrate dissolution into the water phase. That is why a slight decline of ΔP is observed during Stage I. On the other hand, the speed of decrease of ΔP is very slow in this period because of the small Q and the low initial temperature of the injected water. Stage I can be approximately thought to be a steady state flow process.
As soon as the
Q is raised to 7 mL/min in Stage II, Δ
P is rapidly increased to a higher level, which indicates a strong dependence of Δ
P on
Q. However, after a short stabilization period, it declines sharply to an extremely low level of about Δ
P = 10 KPa in less than 10 min, indicating larger hydrate dissociation rate under higher
Q. This is because: (i) the temperature of the water container (
Figure 1) has risen approximately to the room temperature because of the heat transfer during Stage I, and the injected water may take more additional heat into the system to promote the hydrate dissociation; (ii) higher
Q will drive away the dissolved and the free gas more quickly, resulting in faster hydrate dissolution rate in the water phase. After this sharp decrease process, the rate of decrease of Δ
P slows down, indicating complete hydrate dissociation and a gas displacement process by water in the remaining time of Stage II.
When the Q is raised from 7 to 10 mL/min in Stage III, a very slight increase of ΔP is obtained, which further confirms that the hydrate has been totally decomposed under the effect of water injection during Stages I and II. The effective pores of the core holder are only occupied by the water and gas phases. Consequently, the flow experiment is terminated after Stage III lasts for about 10 min. Generally, in order to obtain a steady flow process in the hydrate-bearing sediments, it is necessary to control the water injection rate at a proper level to reduce the hydrate dissolution and dissociation rate.
Based on the
Q and Δ
P data, the effective water permeability
keff of the hydrate-bearing porous media is calculated according to Equation (3).
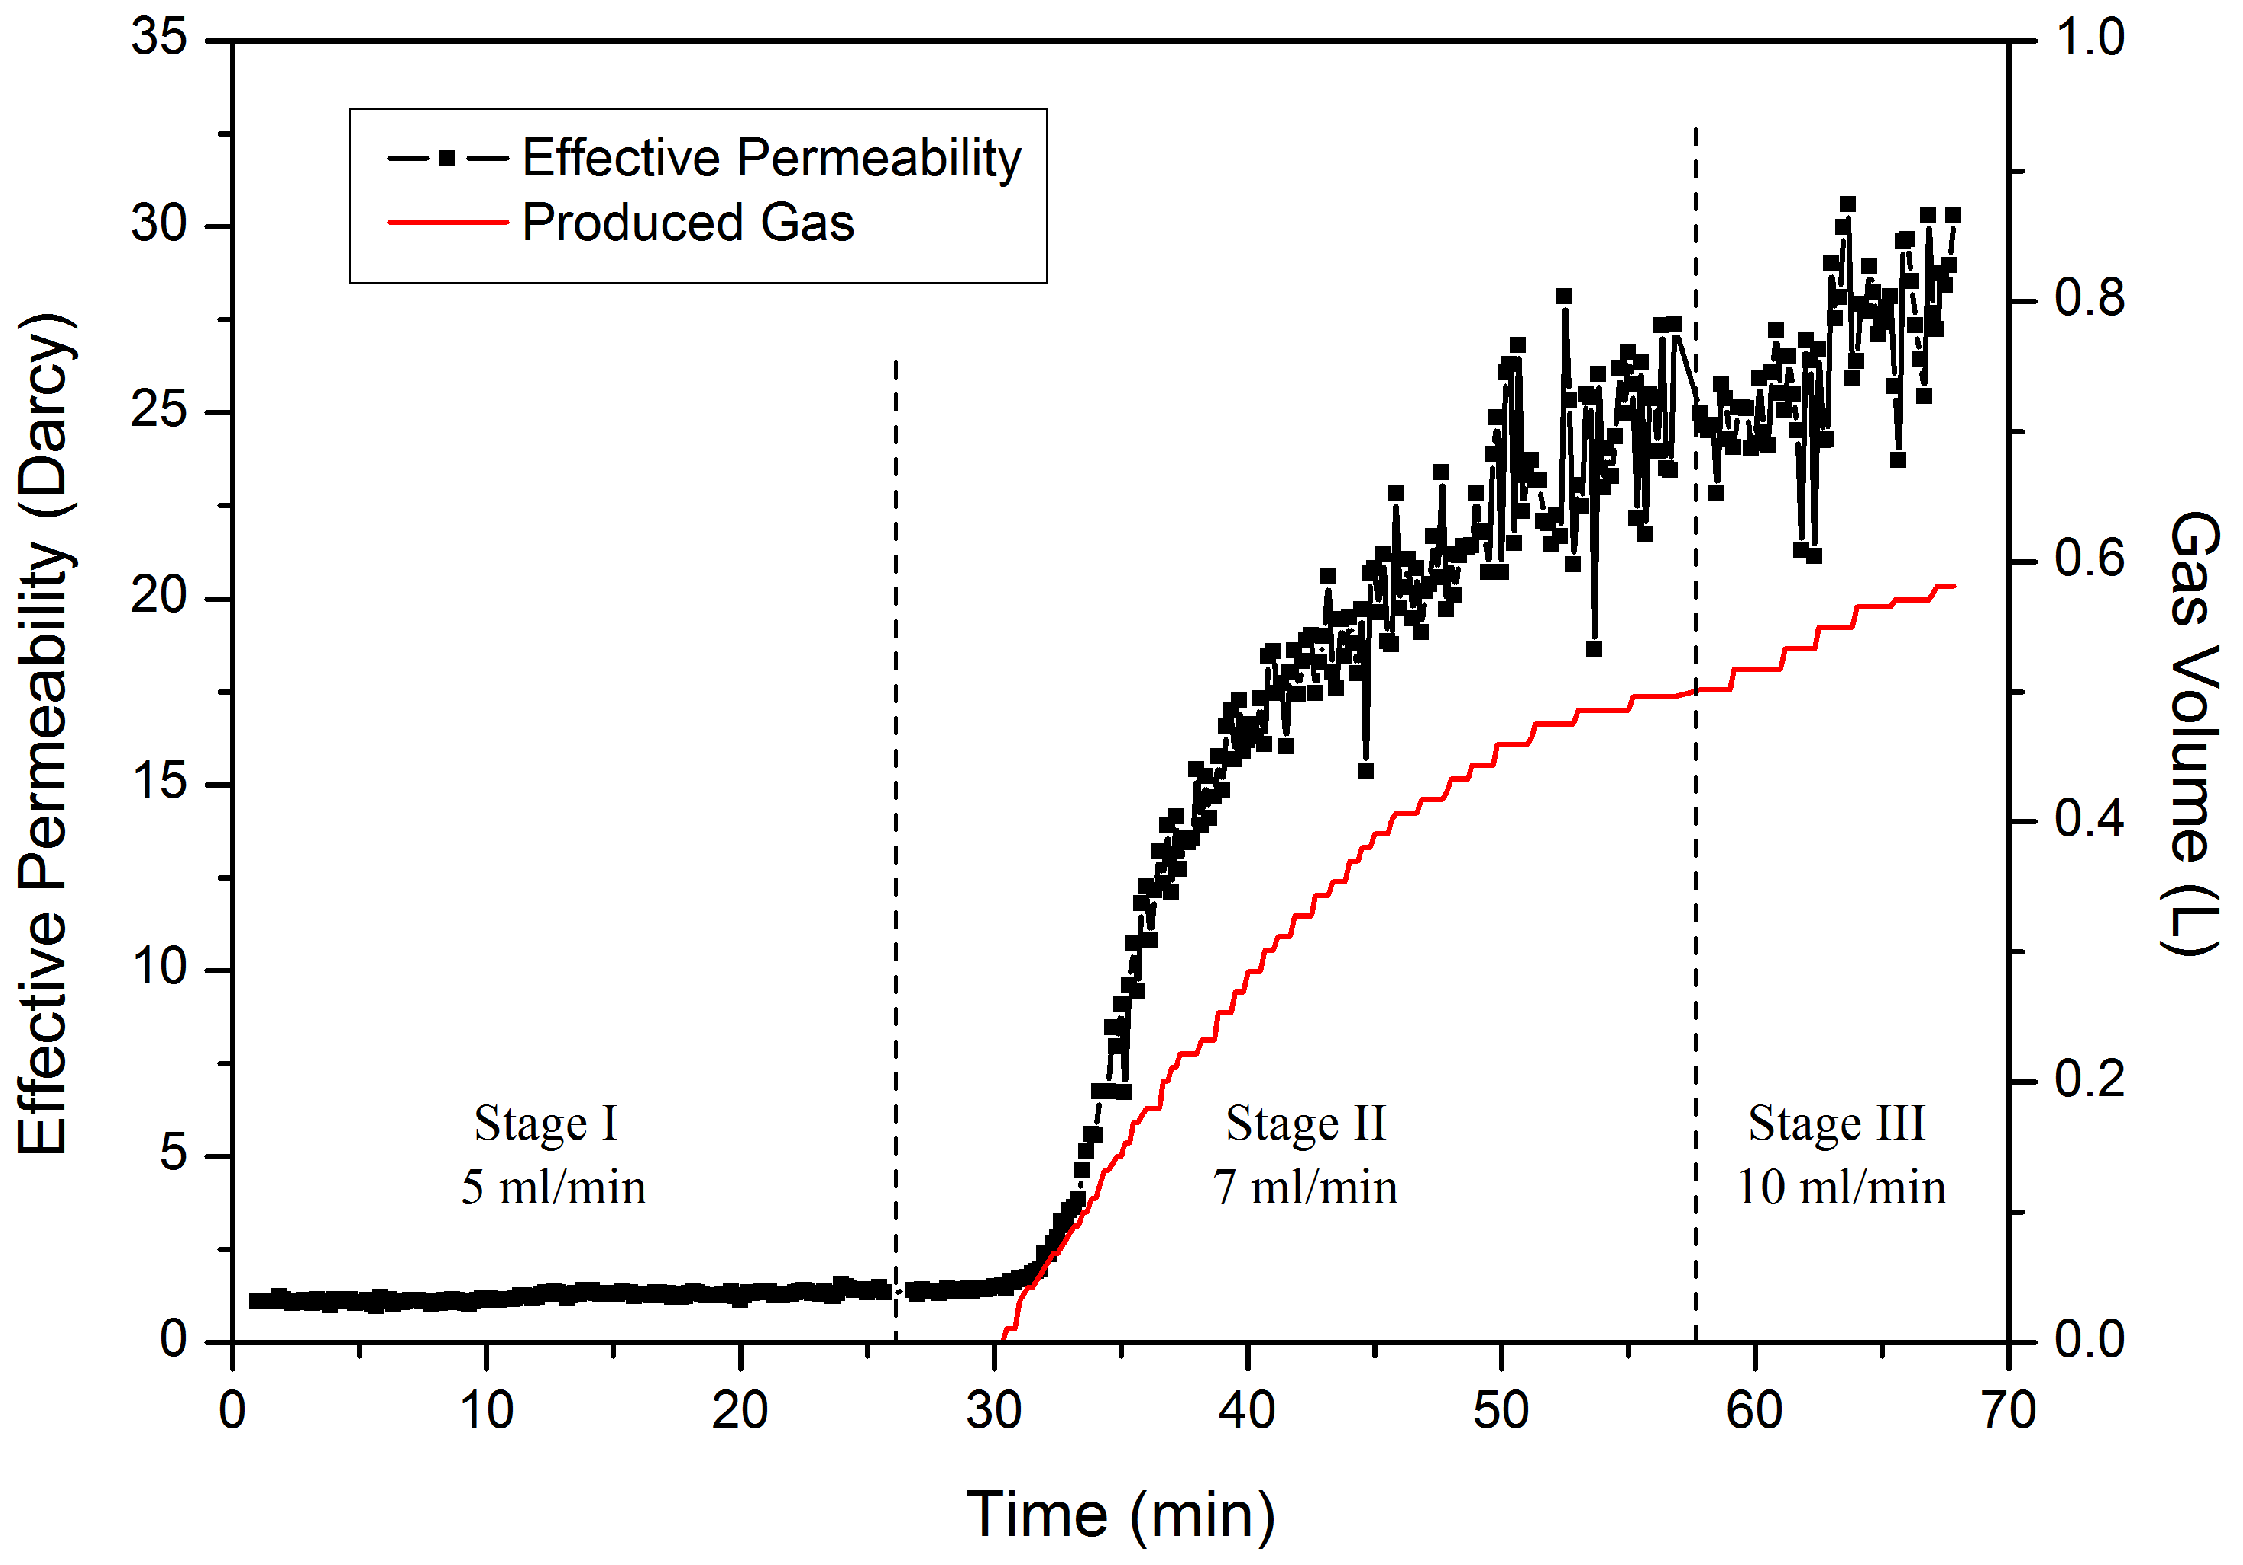
Figure 7 shows the change characteristics of the water
keff and the cumulative volume of the produced gas
VP during the flow process. When the injection rate is set to be 5 mL/min in Stage I, the flow process is approximately in a steady state, as discussed above, so the
keff nearly remains stable in this period. As the gas saturation is very low (9.7%) and there is nearly no gas flow in this stage, the
keff of water can be approximately considered as the absolute permeability with the hydrate saturation
SH = 9.3%. Comparing with the intrinsic permeability shown in
Figure 2b, the absolute permeability
k of the porous sample has decreased from 49.2 to 1.2 Darcies. Such a steep decrease of permeability at low hydrate saturation is caused by the decrease of the effective porosity in the porous media, as shown in Equation (1), and it also indicates that the hydrate particles tend to be firstly deposited in the throats of the pores. After the
Q is raised to 7 mL/min, the
keff changes little in the first several minutes, and the gas production still remains at 0, indicating little hydrate dissociation. However, as soon as the released gas is produced from the core holder, the hydrate dissociation gradually becomes notable, and the effective permeability of water increases continuously with time, as shown in
Figure 7. This indicates that the flow channel previously blocked by the hydrate has been completely opened during water flooding. The decreasing trend of the gas production rate indicates that hydrate in the pores has been completely dissociated at the end of Stage II, and the produced gas is from the free gas displaced by water flow. When the
Q is further increased to 10 mL/min in Stage III, the
keff shows the same increasing trend as that in Stage II, and the gas displacement rate changes little. At the end of the flow experiment, the effective permeability has risen to about 30 Darcies, which is very close to the intrinsic permeability of the porous media without hydrate. The difference between them is also caused by the interference of the compressed residual gas in the sample. It can be predicted that after a long enough displacement process, more free gas will be driven out of the core holder and the effective permeability will finally increase to the intrinsic permeability shown in
Figure 2b.
Figure 7.
Change characteristics of the water keff and the cumulative volume of the produced gas VP during the flow process.
Figure 7.
Change characteristics of the water keff and the cumulative volume of the produced gas VP during the flow process.
According to Equation (1), the reduction factor in this work is estimated to be about 38.0, which is in the same order of magnitude as the numerical estimations of Sakamoto
et al. [
21] Besides, previous experimental results of Minagawa
et al. [
19] show that the water permeability is strongly dependent on the grain size distribution, and the reduction factor increases with the increase of
k0. In their study,
n rises from 2.5 to 9.8 when
k0 increases from 0.08 to 10.0 Darcies. The obtained
n in the present study is in accordance with this increasing tendency. This phenomenon may indicate that the hydrate particles tend to block the pore channels more obviously in coarse sand sediments under low hydrate saturations. According to Equation (3), the relative error of
k can be simply expressed as:
so the relative deviation of the measured permeability is calculated to be about 5%.
Generally, the method employed in this work has the following advantages: (i) the traditional displacement of gas by water in the initial flowing stage is no longer needed when the gas saturation is already small, and it can eliminate the possibility of hydrate dissociation caused by the displacement; (ii) the absolute permeability could be obtained immediately when the flow process is started, and a relatively long period of steady state of water flow could be realized; (iii) the mass of the three phases (gas, water, and hydrate) in the porous media could be precisely predetermined and controlled. However, it will take much more time for hydrate formation because of the limited gas-water contact area under the condition of extremely low SG.


