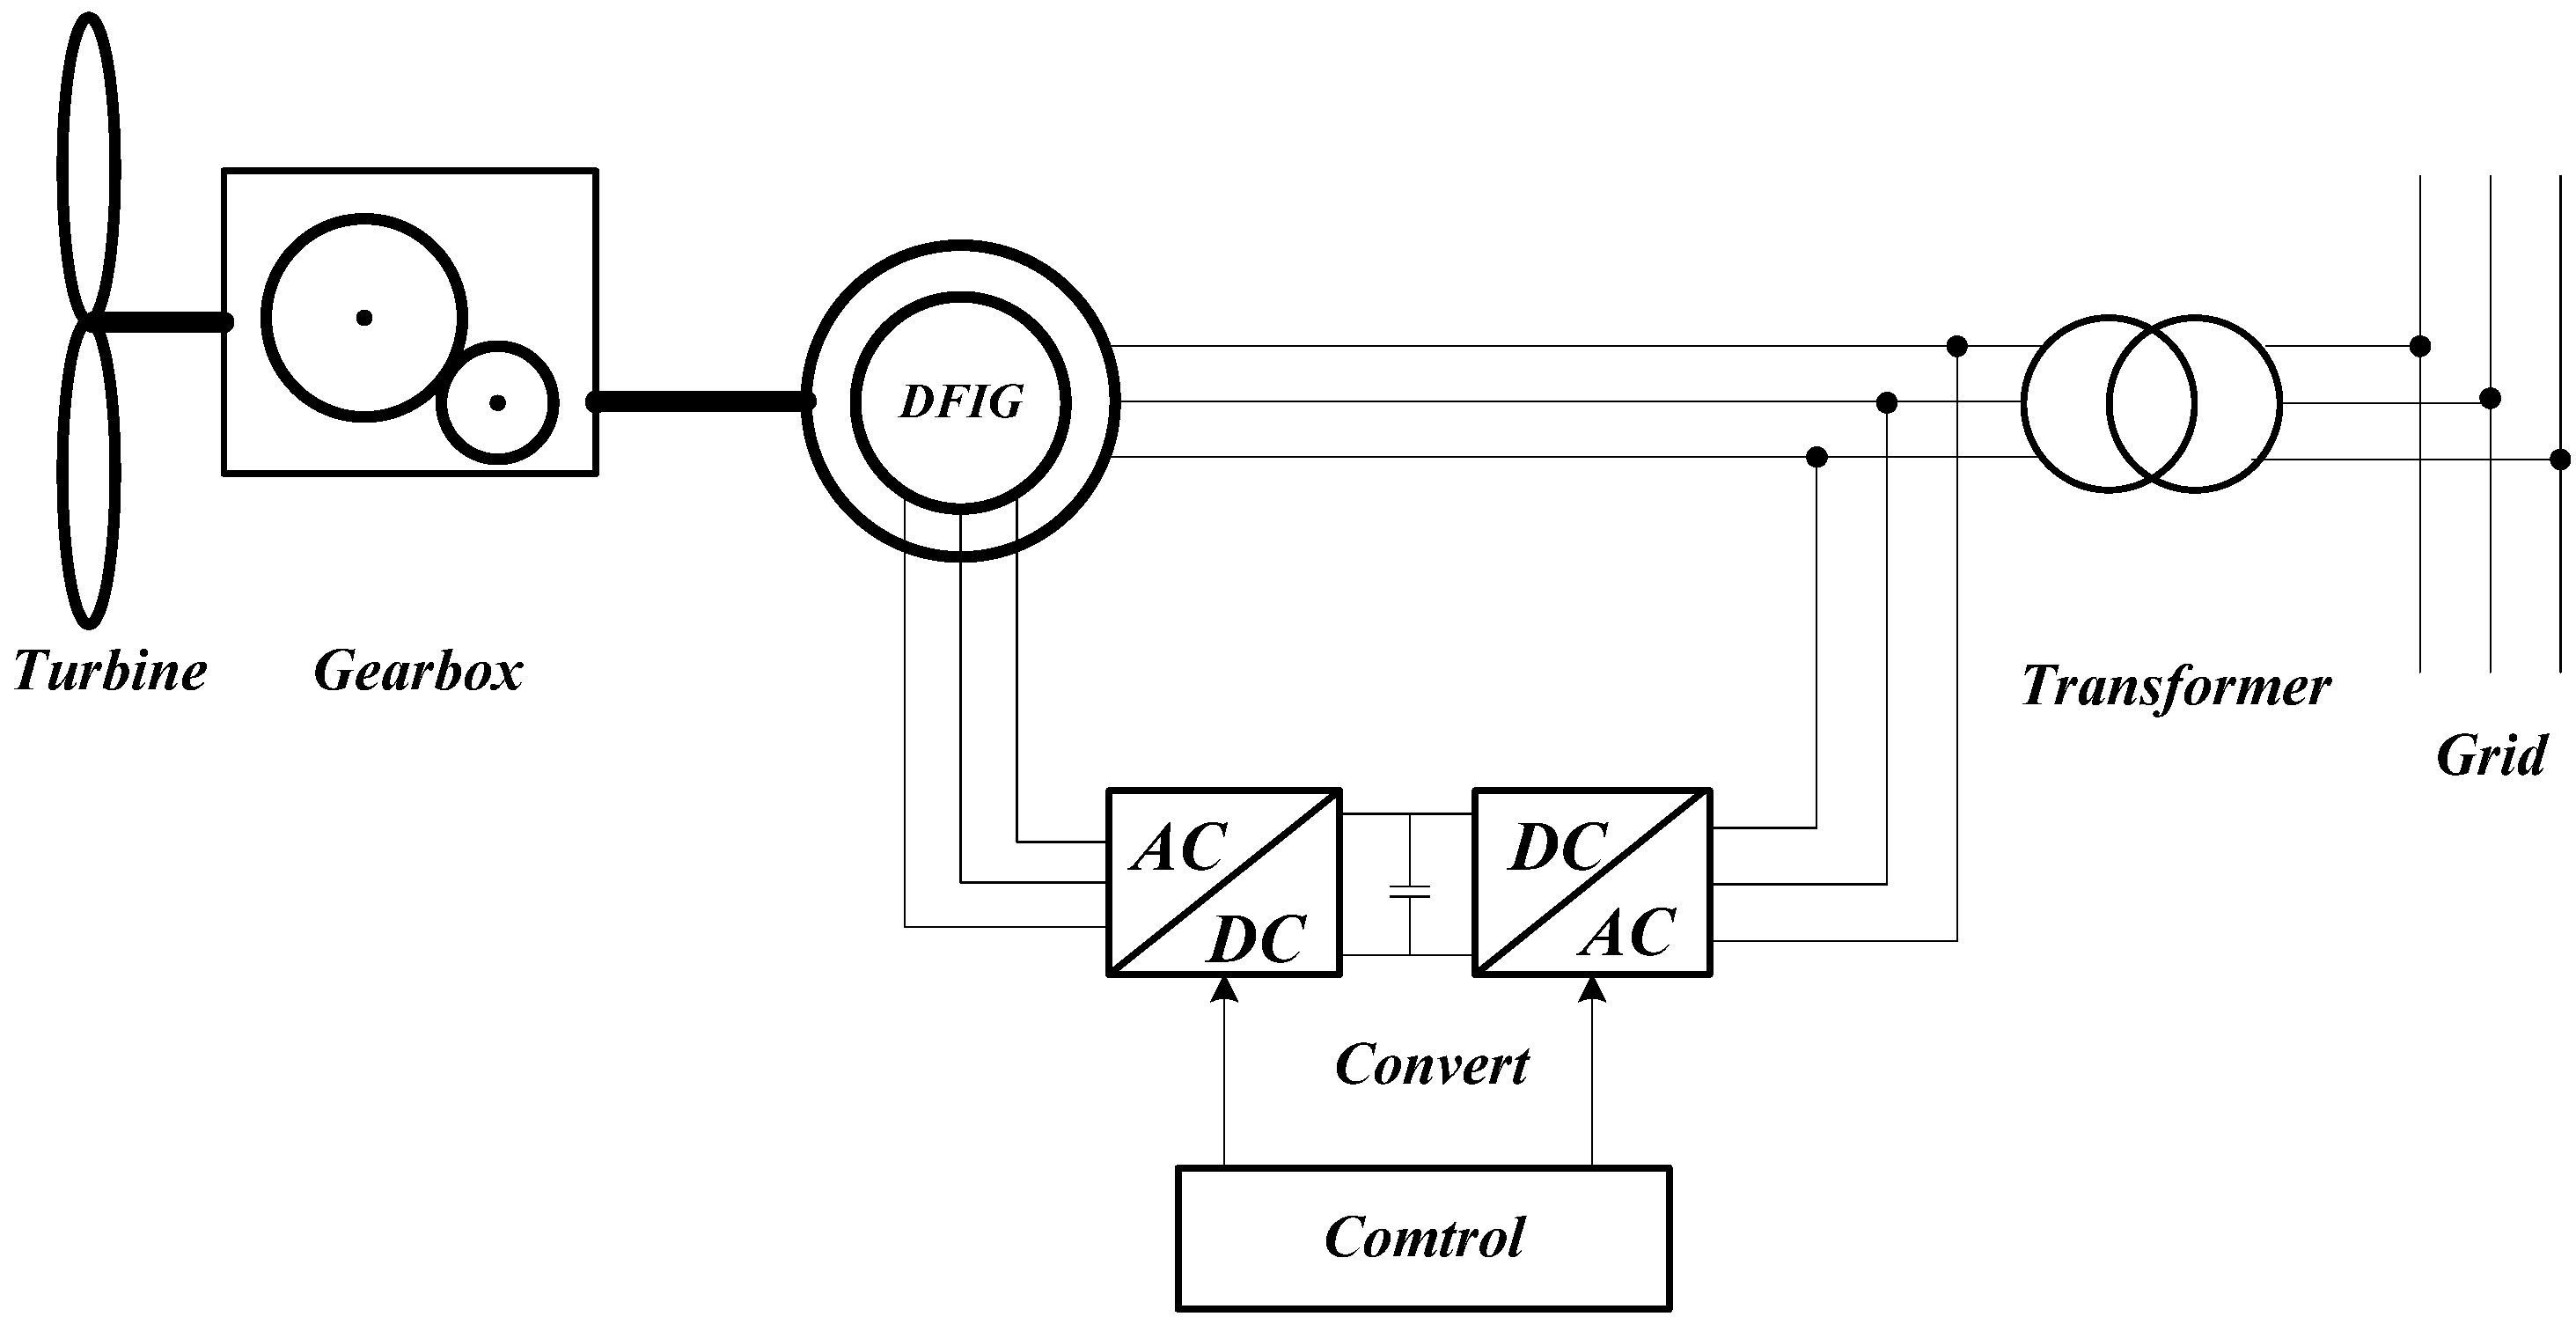
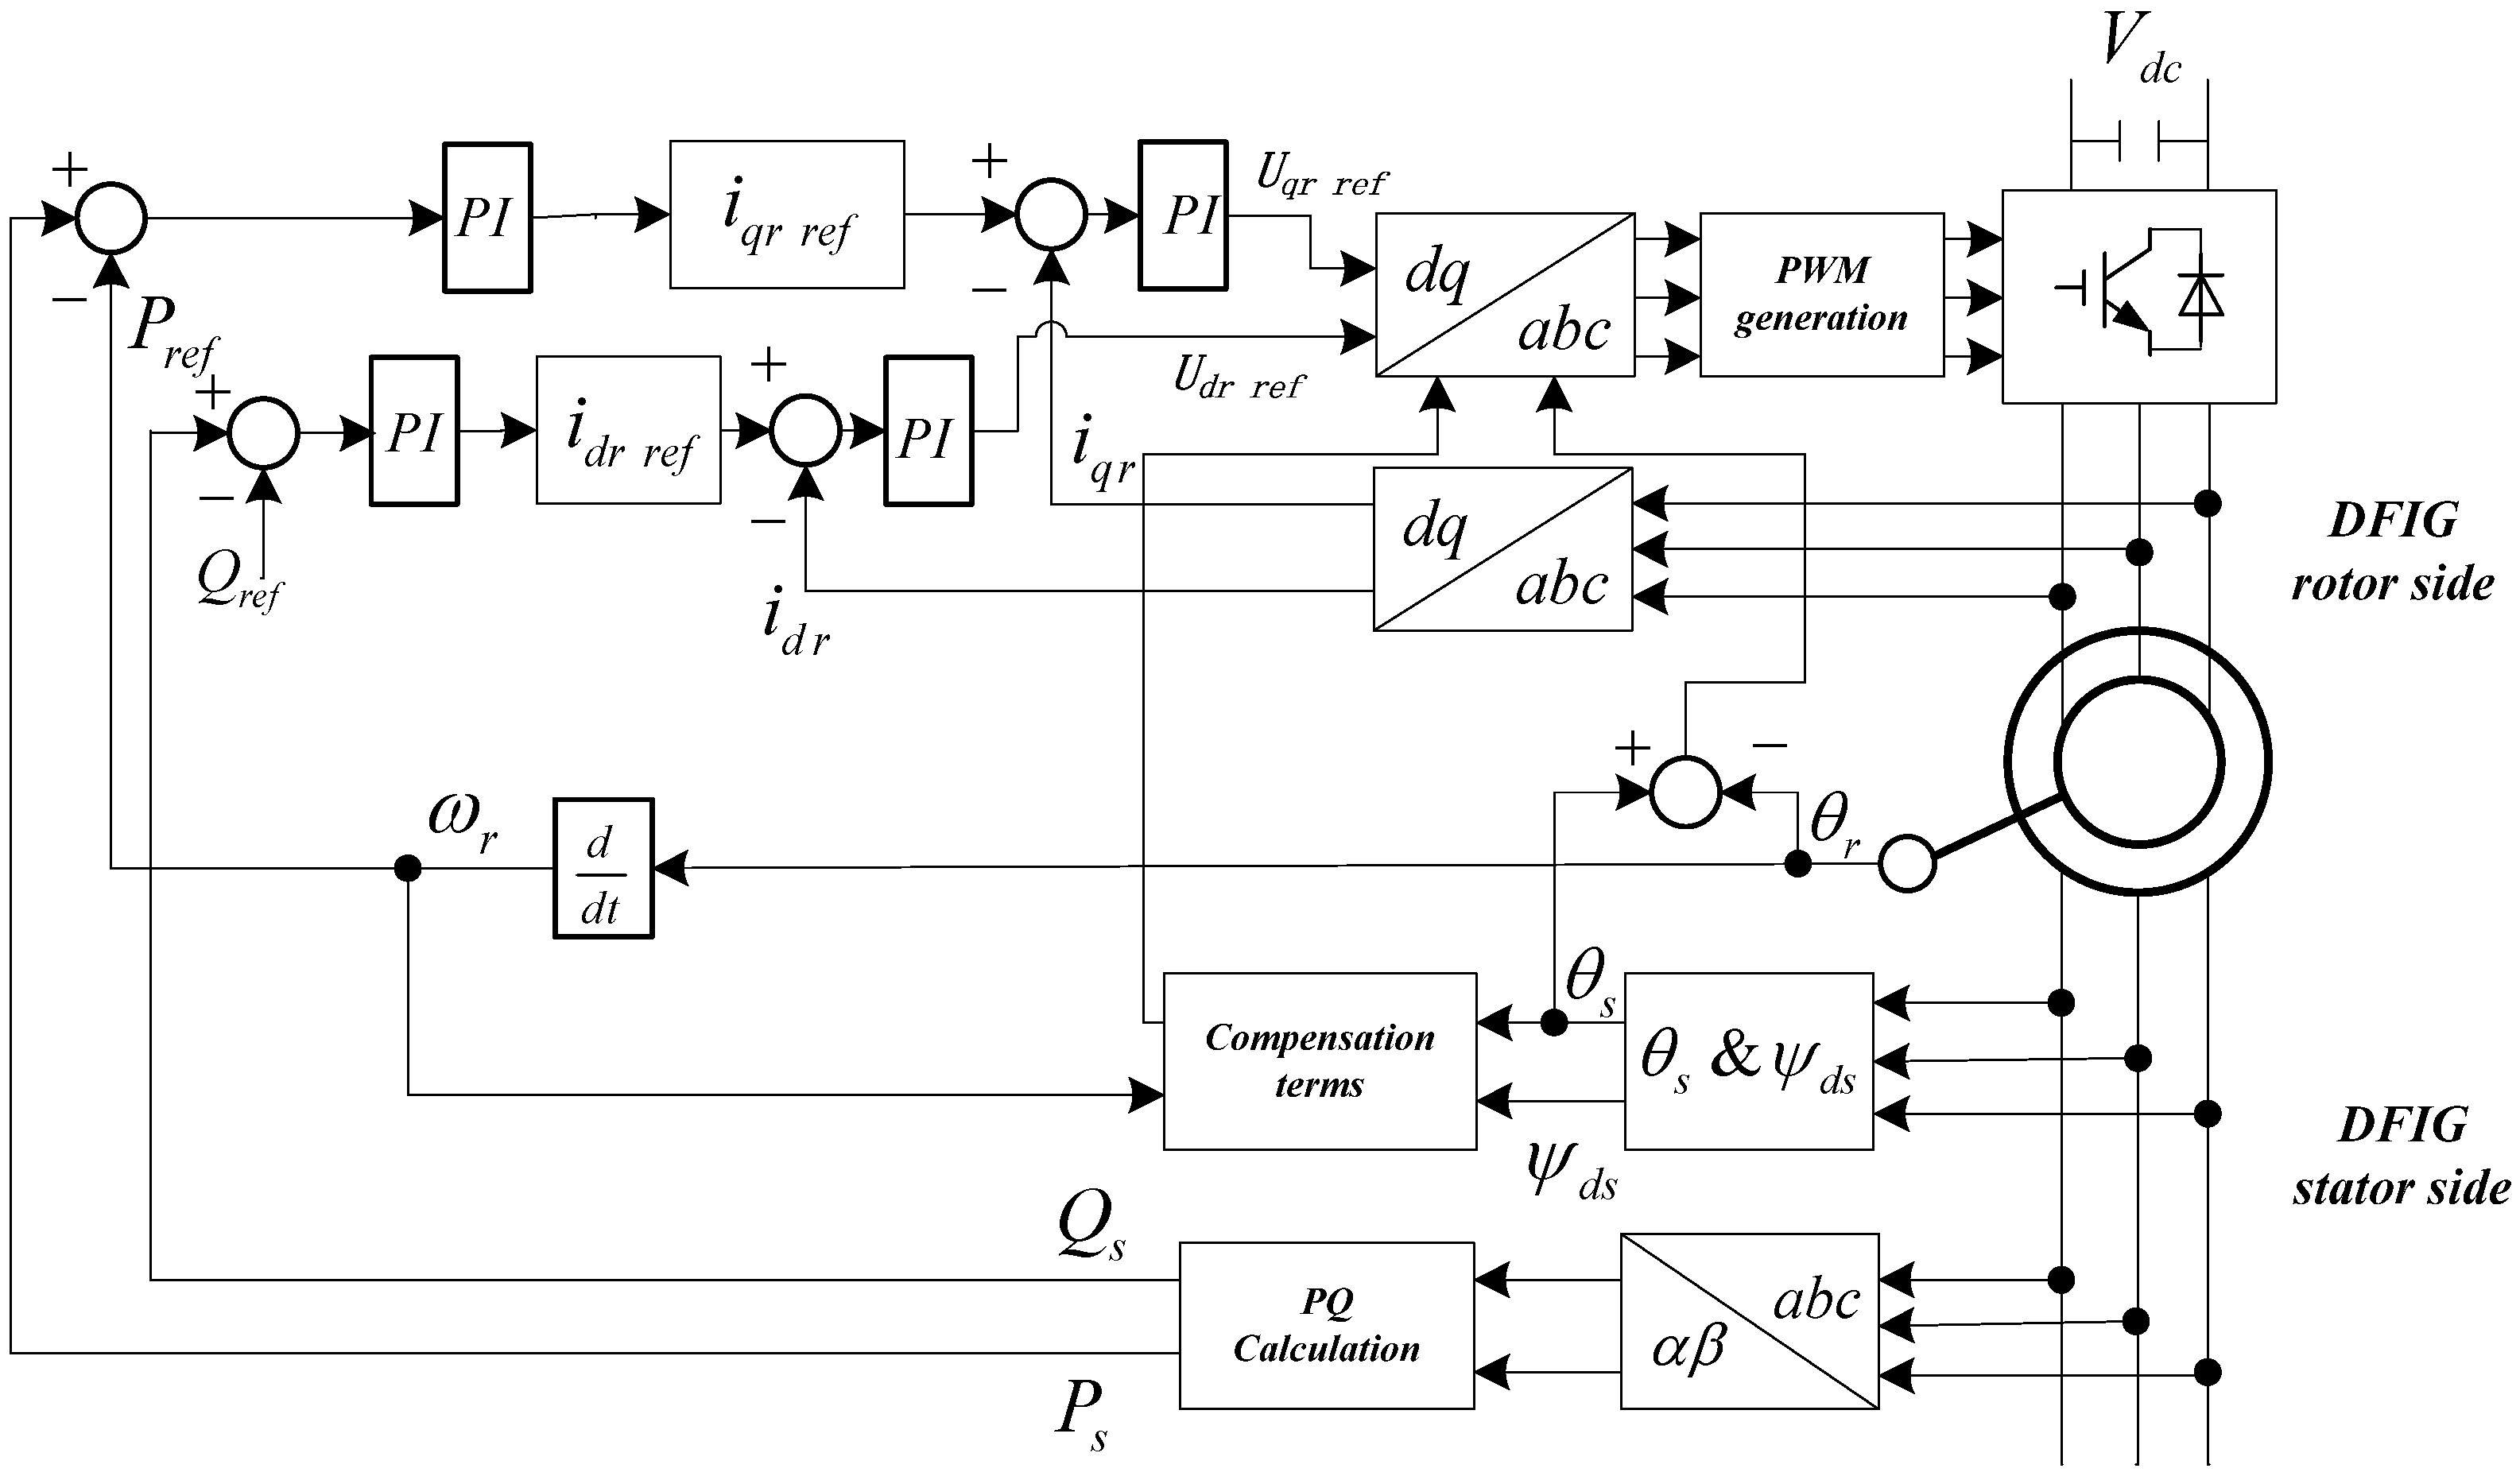
3.1. Thermodynamics of DFIGs in Wind Turbines
The simulation performed in this paper is based on an onshore WT equipped with a DFIG. The DFIG has two poles pairs and is air cooled. The parameters used in the simulation are listed in
Table 1.
Table 1.
Wind turbine parameters.
Table 1.
Wind turbine parameters.
| Wind Turbine | Parameter | Generator | Parameter |
|---|
| Rated power | 850 kW | Rated voltage | 690 V |
| Rotor radius | 25 m | Frequency | 50 Hz |
| Rated wind speed | 12 m/s | Stator resistance | 0.016 Ω |
| Cpmax | 0.436 | Stator inductance | 6.854 mH |
| Lamdaopt | 8 | Moment of inertia | 30 Kg·m2 |
| Air density | 1.225 kg/m3 | Pole pairs | 2 |
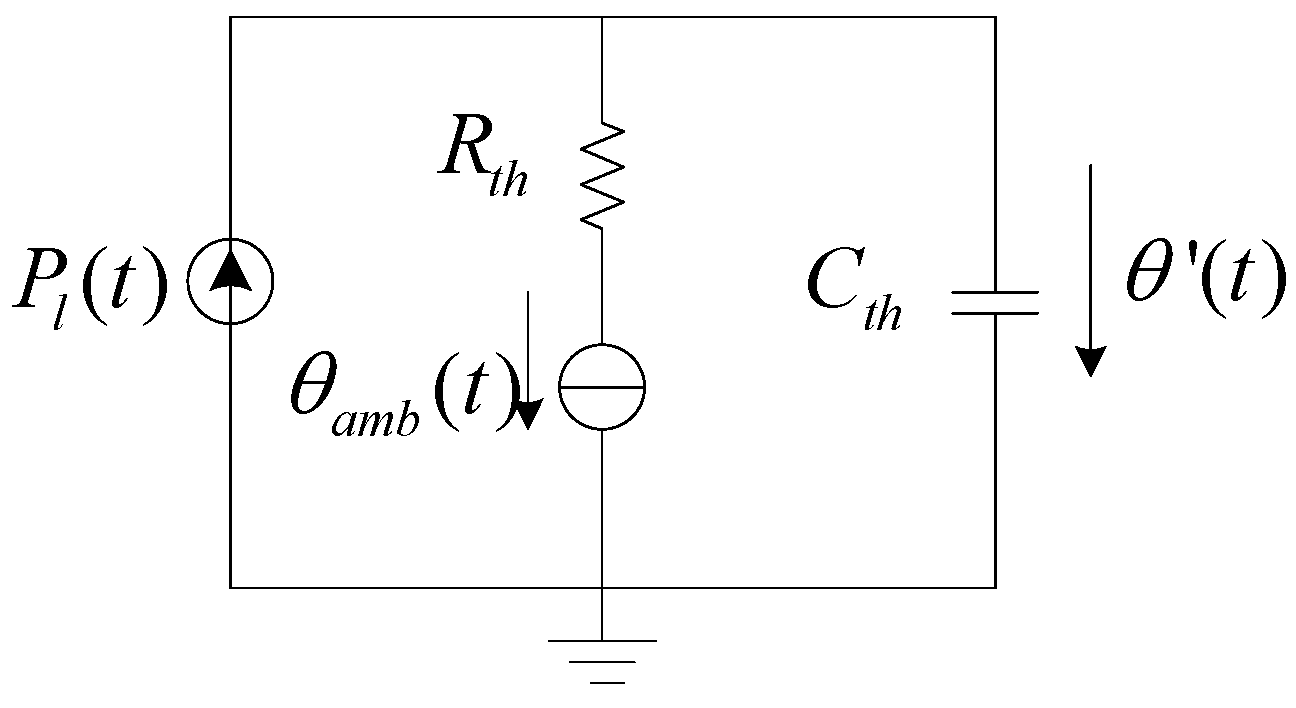
To obtain the generator temperature variation curve,
Rth = 1/25K/W,
Cth = 4,000 Ws/K, ambient temperature
θamb(
t) = 20 °C are assumed in the model [
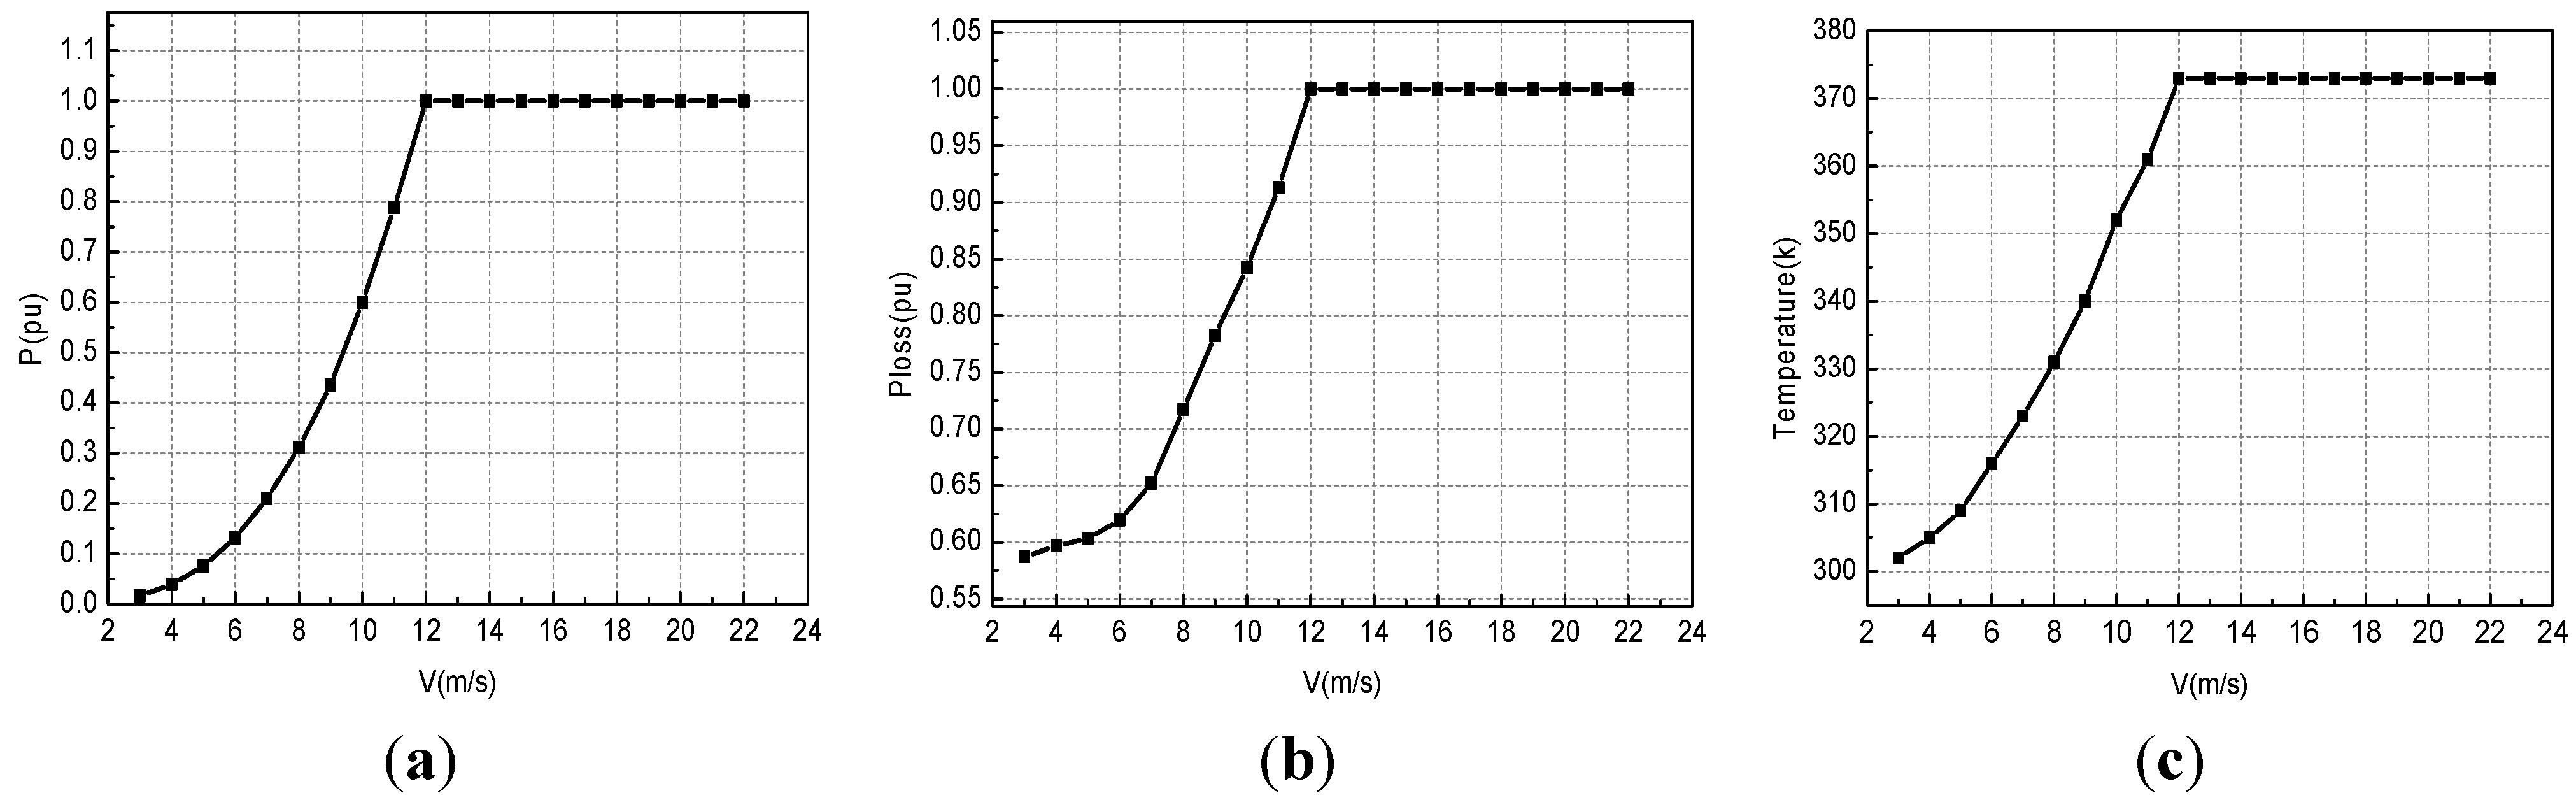
14]. The initial winding temperature is set as 0 °C and the simulation period is for 1,400 s. With the parameters above, the normalized power curve of the model WT is shown in
Figure 7a. The normalized power loss and absolute stator winding temperature are obtained, and plotted against wind speed (
Figure 7b,c). Power losses of the generator and the temperature of stator winding increase with wind speed.
Figure 7.
Power curve (a); Power loss against wind speed (b); Absolute stator winding temperature vs. wind speed (c).
Figure 7.
Power curve (a); Power loss against wind speed (b); Absolute stator winding temperature vs. wind speed (c).
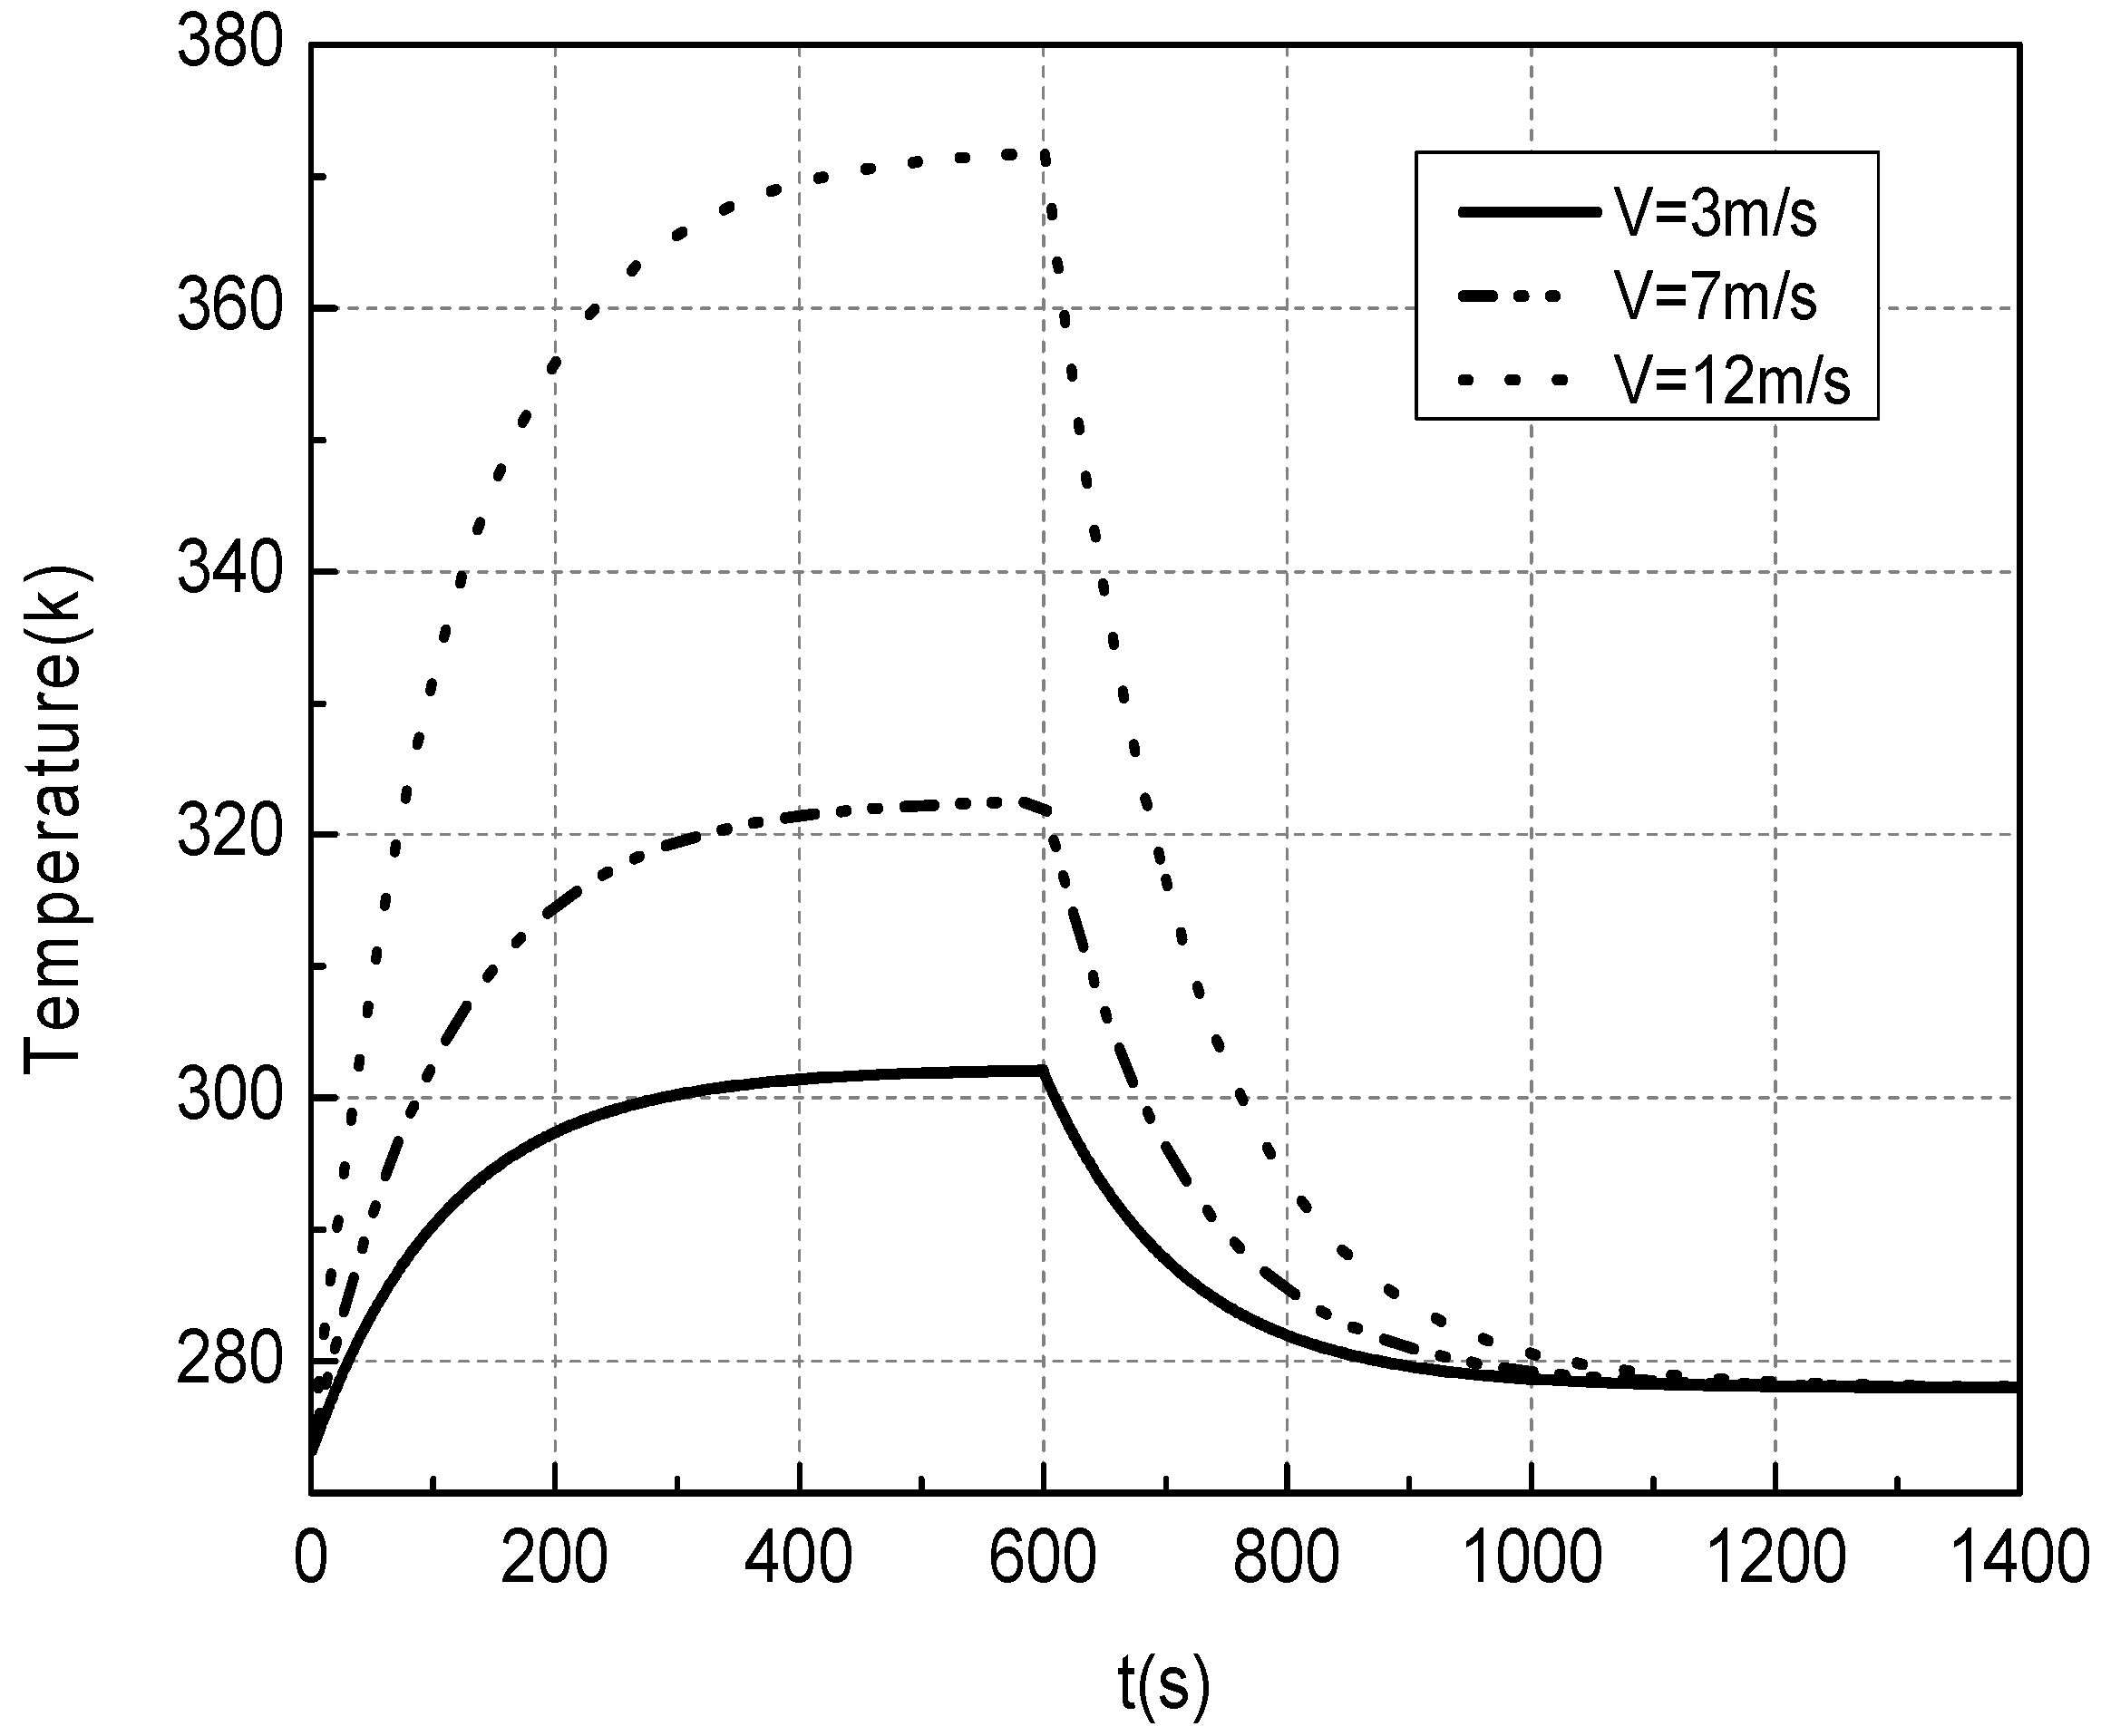
The thermal behavior of the DFIG stator windings under constant wind speeds of 3, 7 and 12 m/s are obtained for a time period of 1,400 s, and shown in
Figure 8. In the whole process, the generator ventilation system keeps operating continuously. From the moment that generator starts up, the stator winding experiences the first process of the machine approaching a stable operating condition and the winding reaching a constant temperature, then a second cooling down process after the machine stops at 600 s. At the higher wind speed, e.g., 12 m/s, the stable temperature reaches a higher value around 370 K due to the increase of output power. Although the thermal parameters
Rth &
Cth determine the time when the stator winding reaches a stable temperature, the wind speed will determine the reachable maximal temperature.
Figure 8.
Thermal behaviour of the DFIG stator winding.
Figure 8.
Thermal behaviour of the DFIG stator winding.
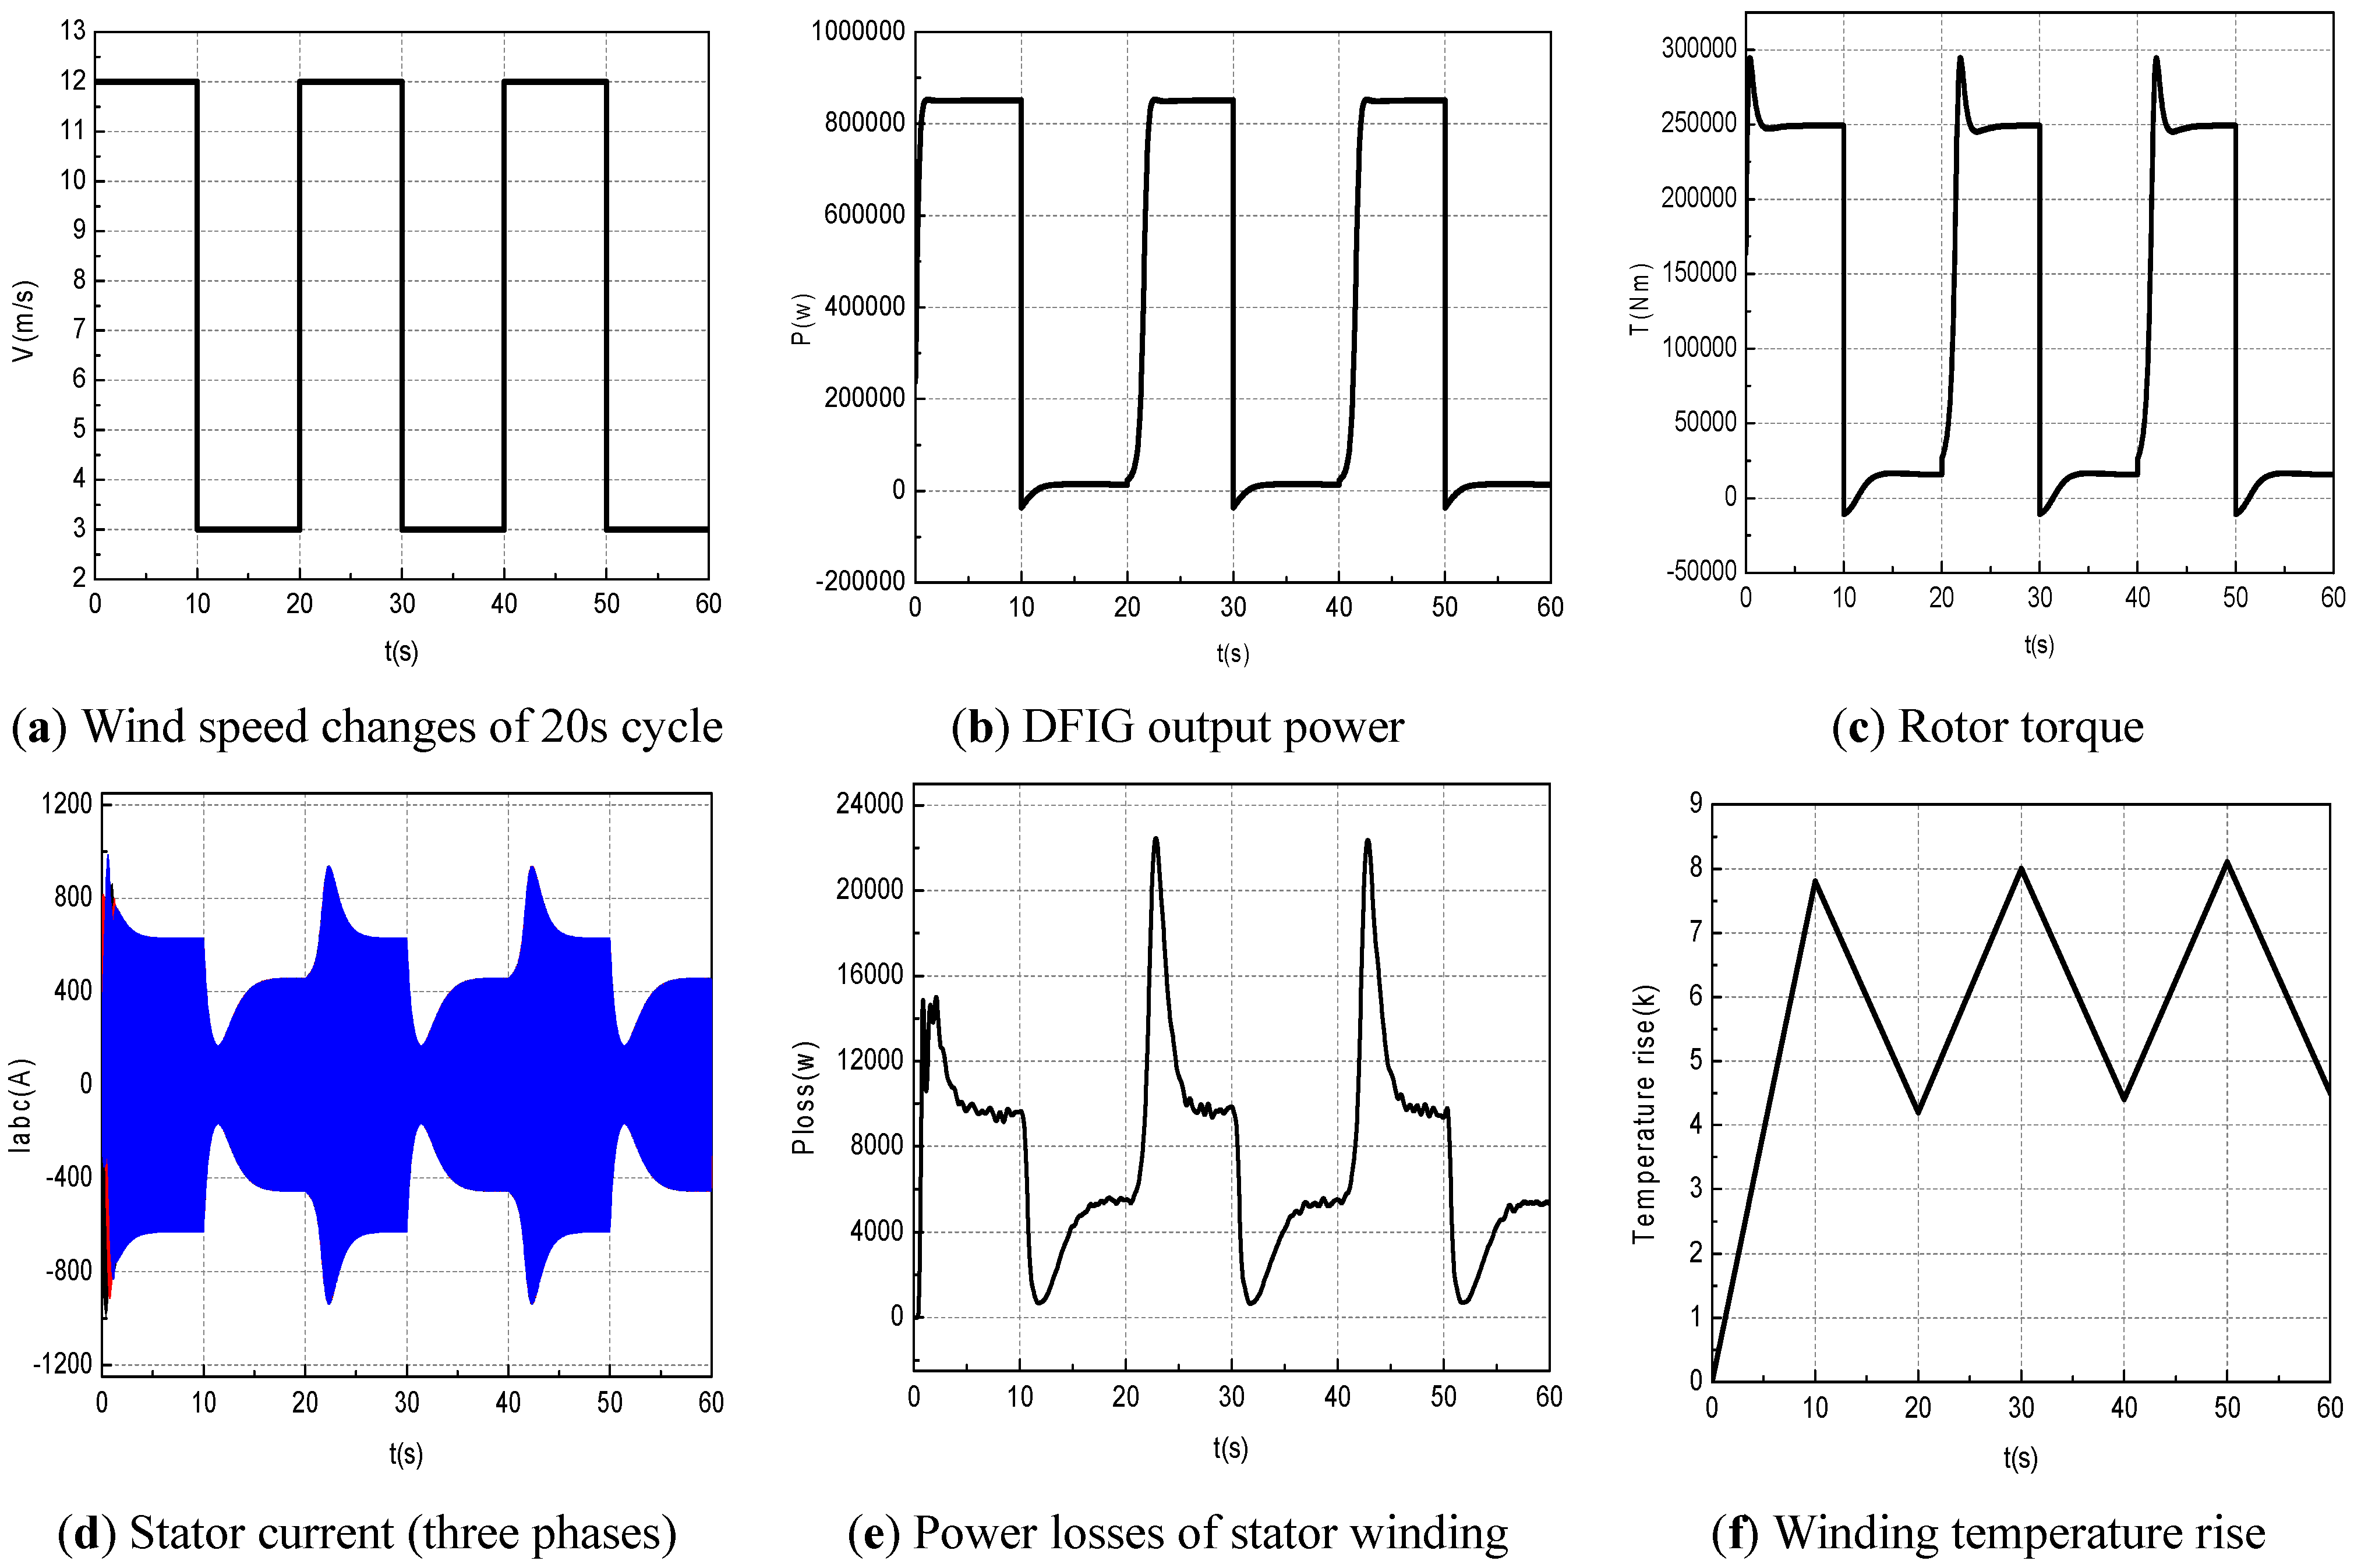
The mechanical, electrical and thermal responses of the DFIG under cyclic wind speed patterns are shown in
Figure 9. A sudden rise of wind speed causes sharp increase of power losses, due to the transient current response in the stator winding, as shown in
Figure 9d,e. However, the thermal response is not as fast as the electrical response as shown in
Figure 9f. This is different from
Figure 8, which shows that the stator winding temperature rise is subject to thermal inertia
i.e., the temperature of the stator winding takes around 600 s or 10 min to reach its maximum. This is because when the wind speed changes in a step cycle between 3 m/s (
i.e., start-up) and 12 m/s (
i.e., full power) in just 20 s, as shown in
Figure 9a, before the temperature of the stator winding reaches its stabilized value, the wind speed changes cause the temperature to vary, therefore, the temperature rise in the stator winding is between 4 K to 8 K (or °C) above the ambient temperature (
i.e., 20 °C or 293 K) as shown in
Figure 9f.
Figure 9.
Mechanical, electrical and thermodynamics of the WT and DFIG stator winding under step-cycle wind speed conditions.
Figure 9.
Mechanical, electrical and thermodynamics of the WT and DFIG stator winding under step-cycle wind speed conditions.
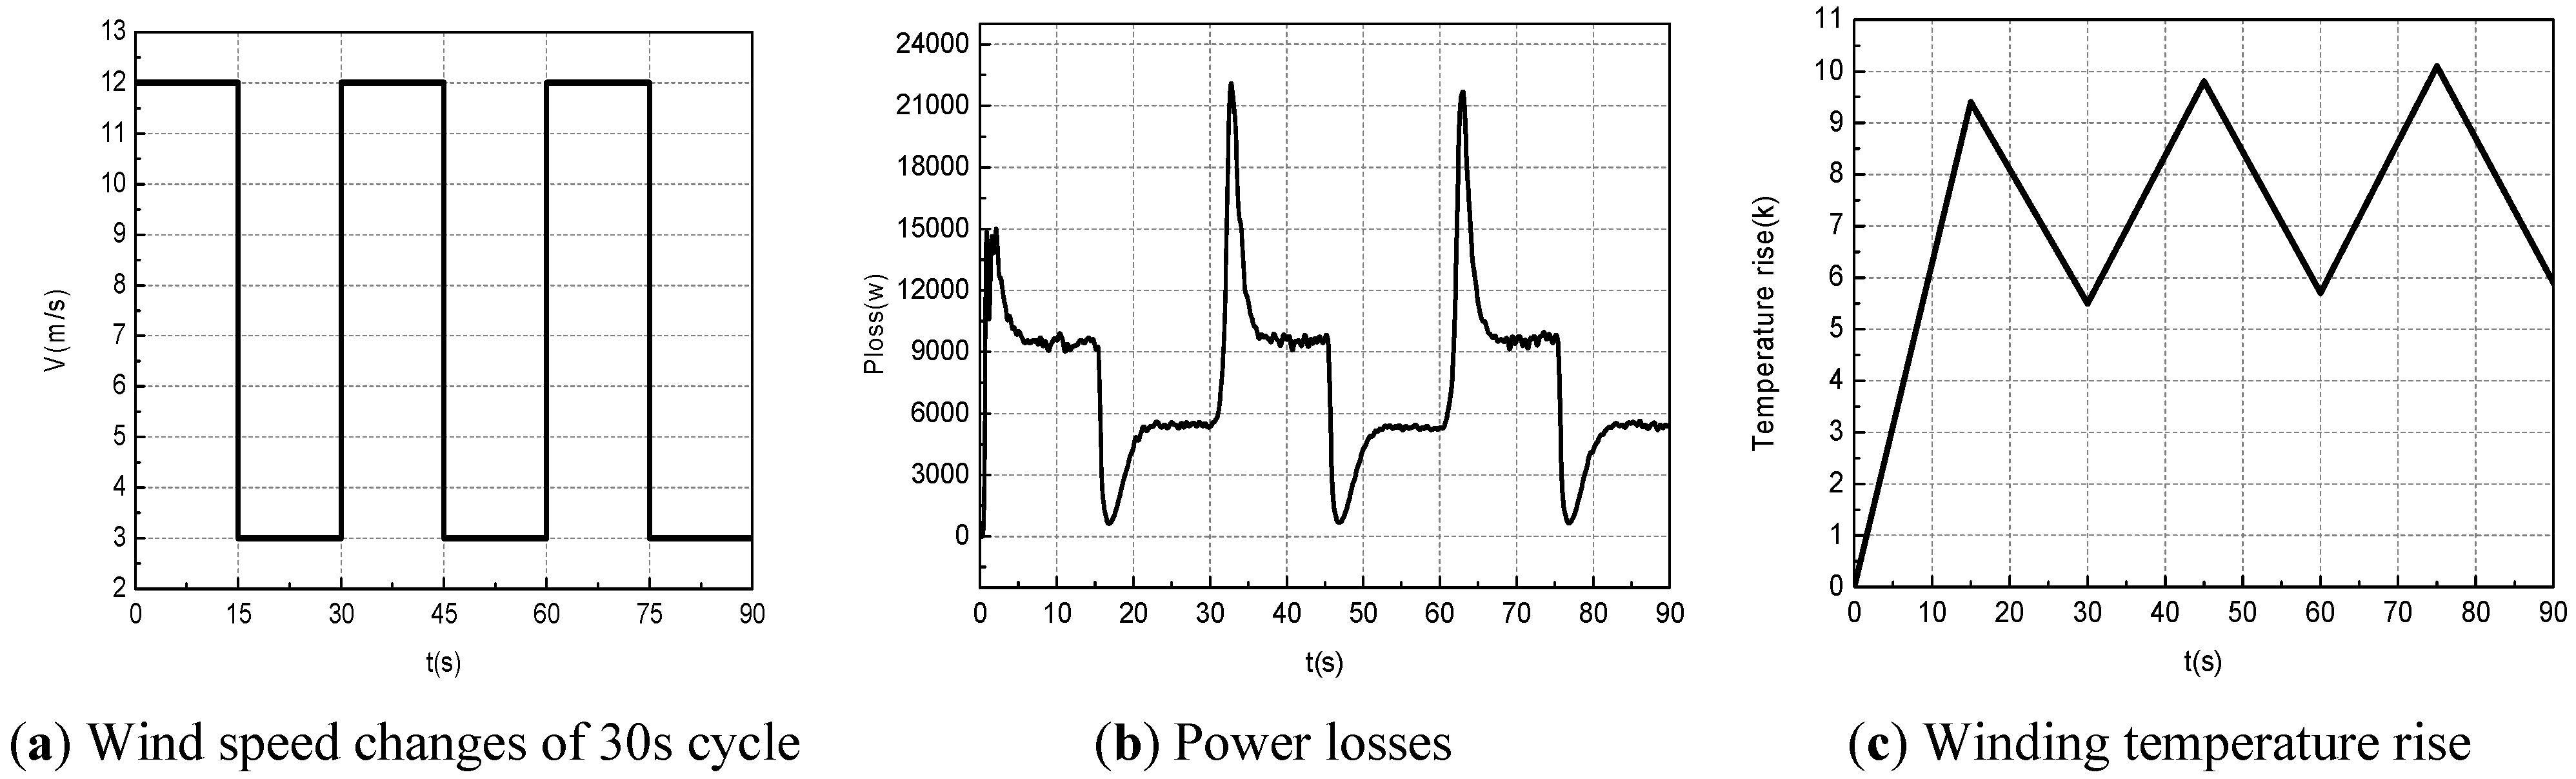
When the wind speed changes in a step cycles between 3 m/s (
i.e., start-up) and 12 m/s (
i.e., full power) in 30 s cycles (
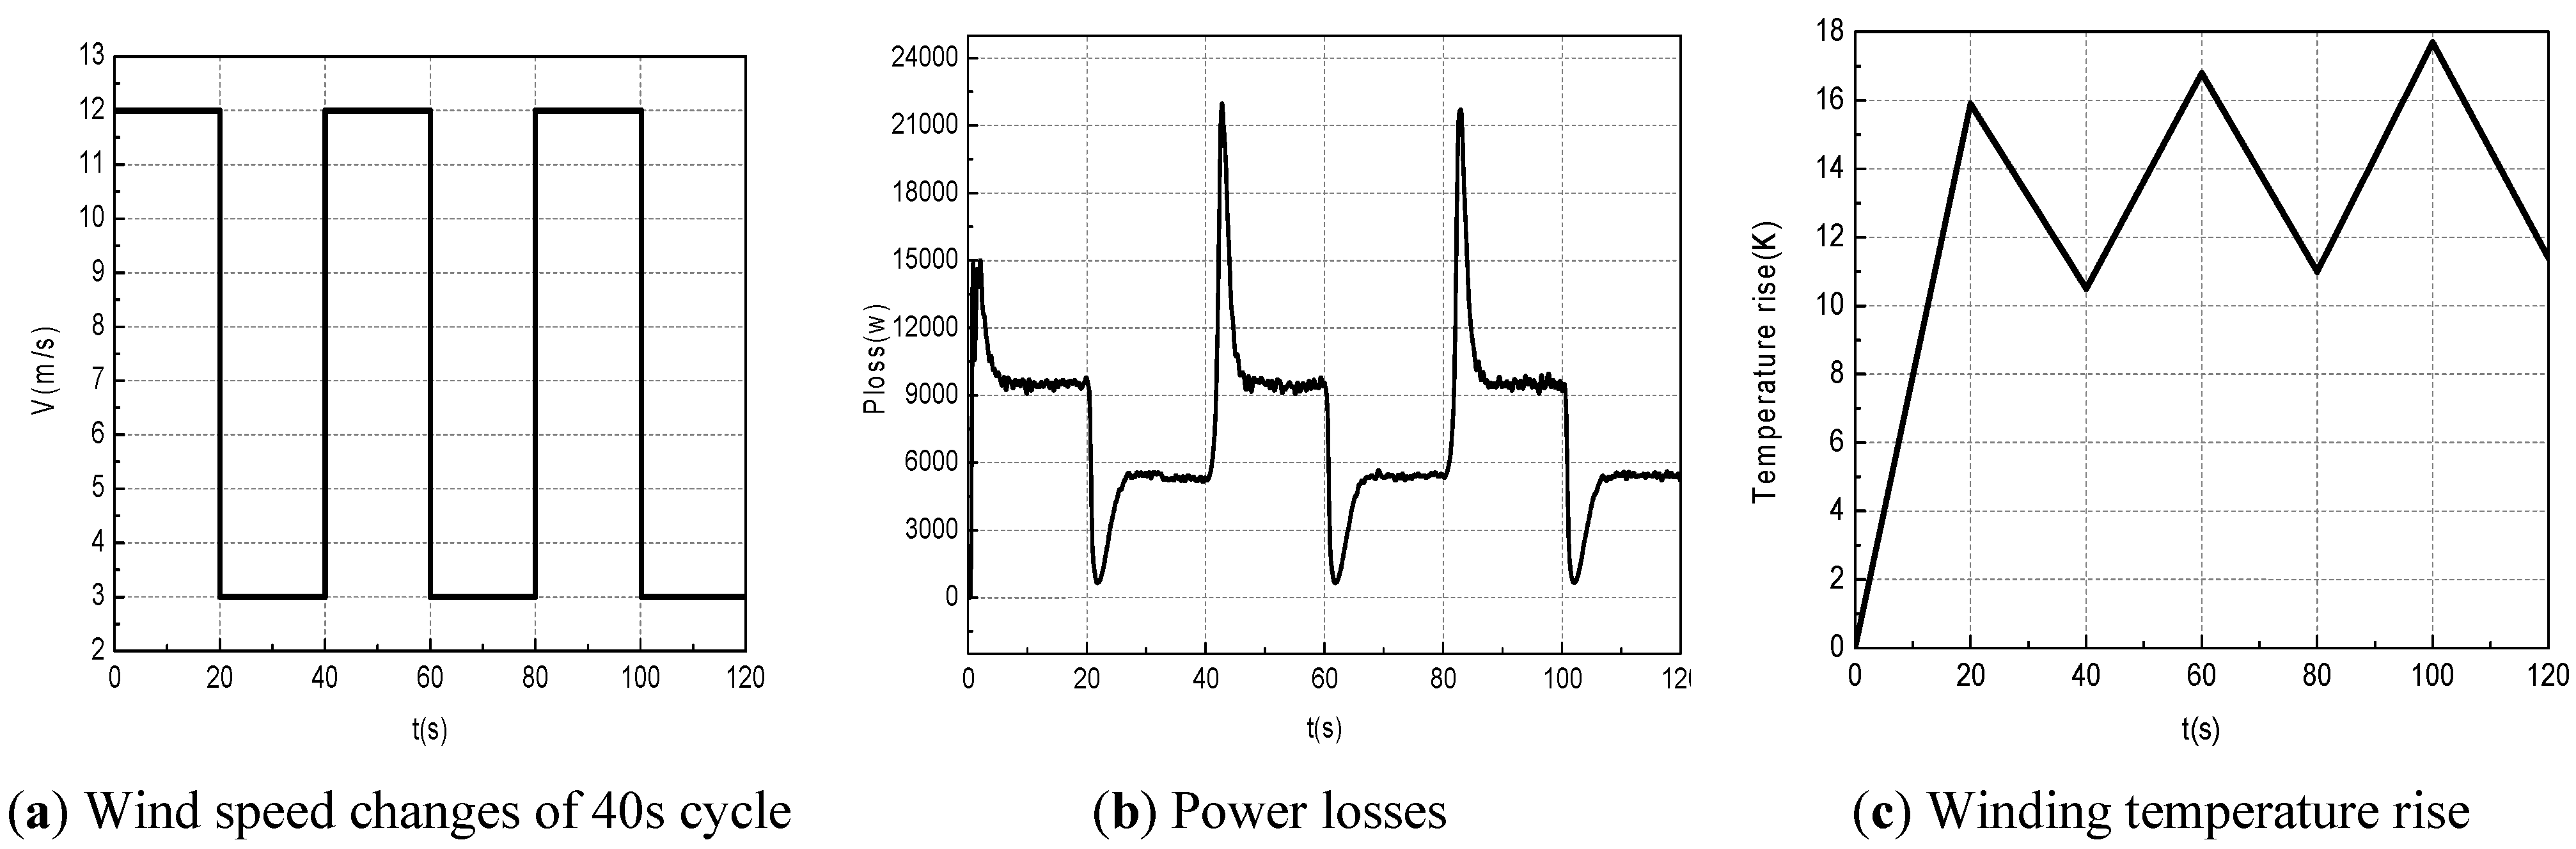
Figure 10) or in 40 s cycles (
Figure 11), their power losses are the same but the temperature rises in the stator winding are quite different. In the 30 s case,
Figure 10 shows the temperature rise is between 5 K to 10 K (or °C); In the 40 s case,
Figure 11 shows the temperature rise is between 10 K to 18 K (or °C). For the same thermal parameters
Rth &
Cth, a DFIG machine operating with a longer high wind speed duration will experience a higher temperature rise. If the scale of the wind speed change is less than the above cases, e.g., between 3 m/s and 7 m/s, the magnitude of the temperature rise will be less. Therefore, the magnitude of temperature rise depends not only on the thermal parameters of the DFIG stator winding, but also on the wind speed profile, including the scale and cycle of the wind speed change.
Figure 10.
Power losses and temperature rise of stator windings for wind speed change with a 30 s cycle.
Figure 10.
Power losses and temperature rise of stator windings for wind speed change with a 30 s cycle.
Figure 11.
Power losses and temperature rise of stator windings a for wind speed change with a 40 s cycle.
Figure 11.
Power losses and temperature rise of stator windings a for wind speed change with a 40 s cycle.
3.2. Generator Case Studies: Voltage Unbalance vs. Ventilation Fault
Voltage unbalance, also known as the phase voltage unbalance rate (PVUR), is defined as below according to the IEEE definition:
Even with the same voltage unbalance factor [
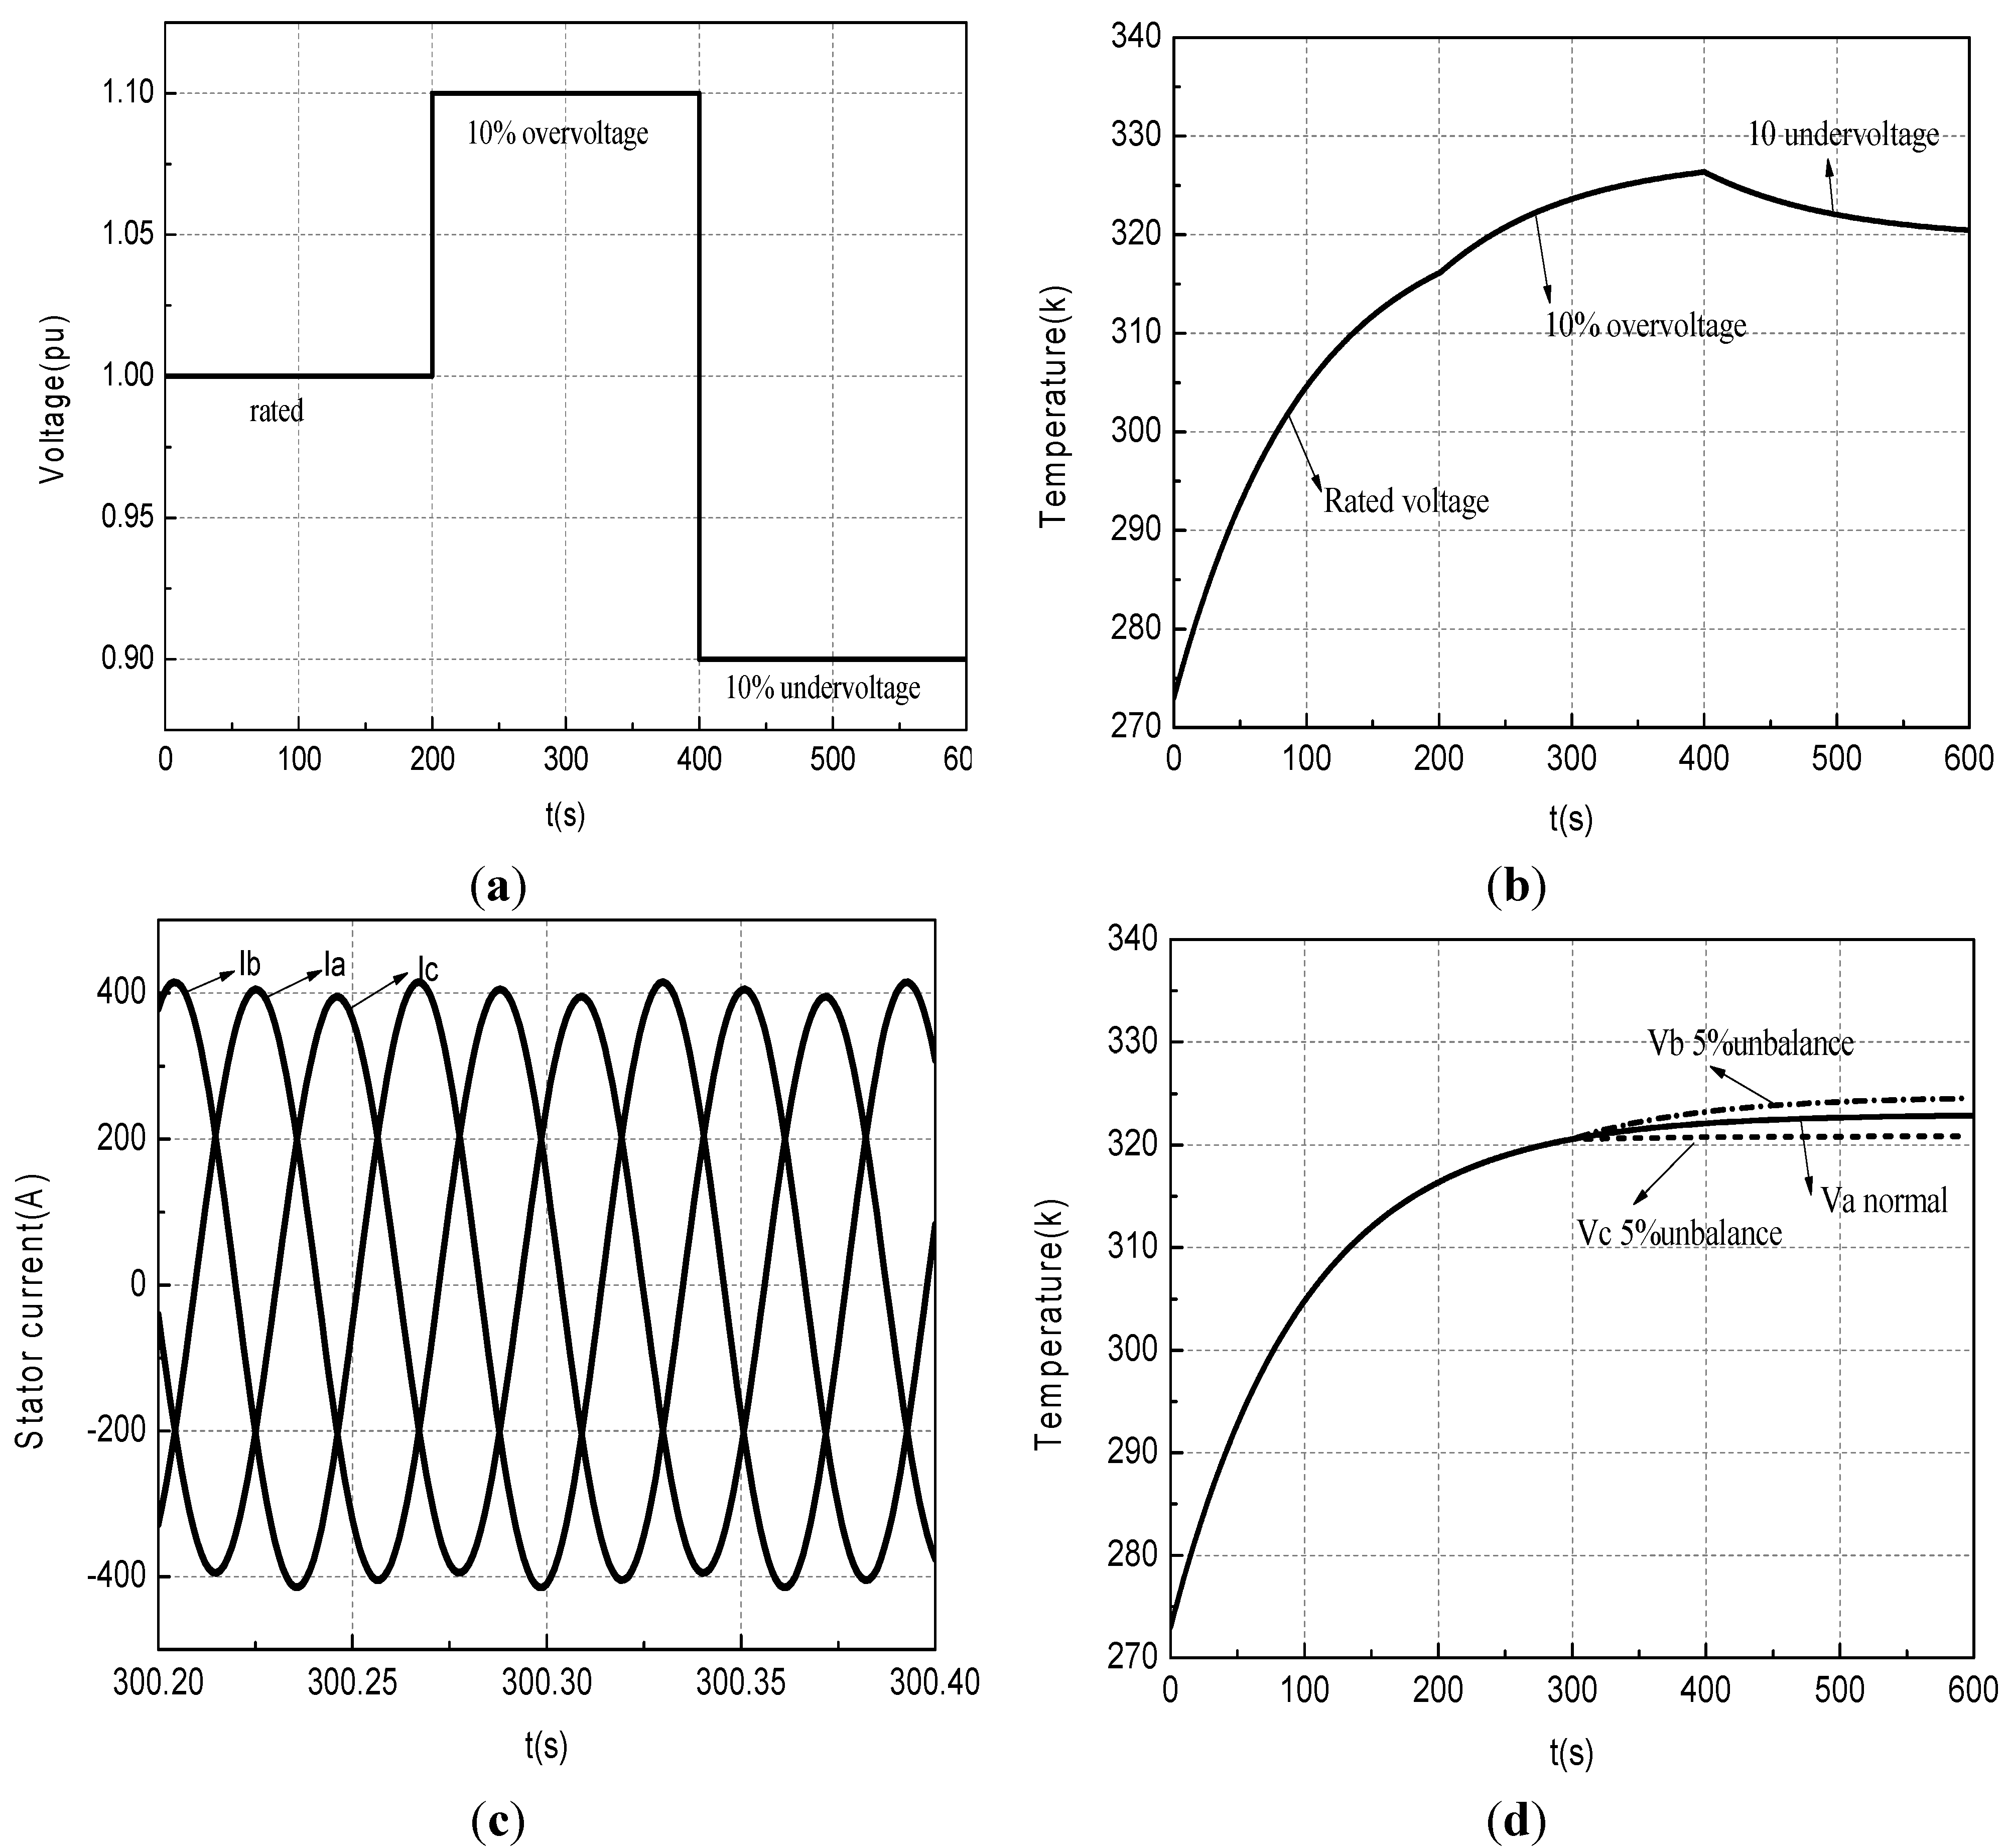
15], there could be a single phase, two-phase or three-phase voltage unbalance. Here a three-phase voltage unbalance with 10% PVUR and a two-phase unbalance with 5% PVUR (b & c phases) are injected in the DFIG model to examine the corresponding thermal behaviors. The results are shown in
Figure 12.
Figure 12a shows a case of 10% PVUR variation for the whole three-phase voltage on a time scale. The generator operates at the rated voltage for the first 200 s, then a 10% overvoltage for the next 200 s, and finally 10% under-voltage for the remaining 200 s.
Figure 12b shows the corresponding stator winding temperature changes.
Figure 12c shows the stator currents under two-phase (b & c) voltage unbalance with 5% PVUR injected at 300 s.
Figure 12d shows a, b & c stator winding temperature changes. During voltage unbalance, the three-phase currents of the DFIG are non-uniform. It is quite clear that the temperature of the windings changes subject to different voltage unbalance situations. There are several causes leading to voltage unbalance such as incomplete transposition of transmission lines, unbalanced loads, open delta transformer connections, blown fuses on three-phase capacitor hanks. Apart from the grid code violation, the voltage unbalance will also have negative impacts on electric machines, such as overheating, current unbalance, de-rating and inefficiency, leading to winding insulation degradation [
16].
For a wind turbine with DFIG configuration, MPPT control is realized under the rated wind speed range to tune the rotor speed through electromagnetic torque control of the induction generator. As the induction generator torque is subject to the rotor current and stator voltage, therefore any unbalance of the stator voltage will cause an unstable rotor current in order to maintain an appropriate torque value rather than to maintain a constant power output. Therefore, an increase of stator voltage will cause a slight increase of stator current, and thus an increase of winding temperature.
Figure 12.
DFIG stator winding temperature variation due to different PVUR situations. (a) Three-phase voltage unbalance; (b) Temperature for three-phase unbalance; (c) b & c phase voltage unbalance; (d) Temperature for two-phase unbalance.
Figure 12.
DFIG stator winding temperature variation due to different PVUR situations. (a) Three-phase voltage unbalance; (b) Temperature for three-phase unbalance; (c) b & c phase voltage unbalance; (d) Temperature for two-phase unbalance.
3.3. Comparisons between Simulation Results and Real WT Data
Performance data such as temperature and power output are continuously monitored by the WT SCADA system. Here real data are collected in a 10-minute interval from an operating 1–2 MW WT, and further averaged in block according to the normalized power output. The temperatures of the generator stator windings are measured by PT100 thermal resistance elements which are embedded in the windings. To reduce the data volume, the SCADA system recorded the average temperature measured from the PT100s installed in different locations of the generator stator winding.
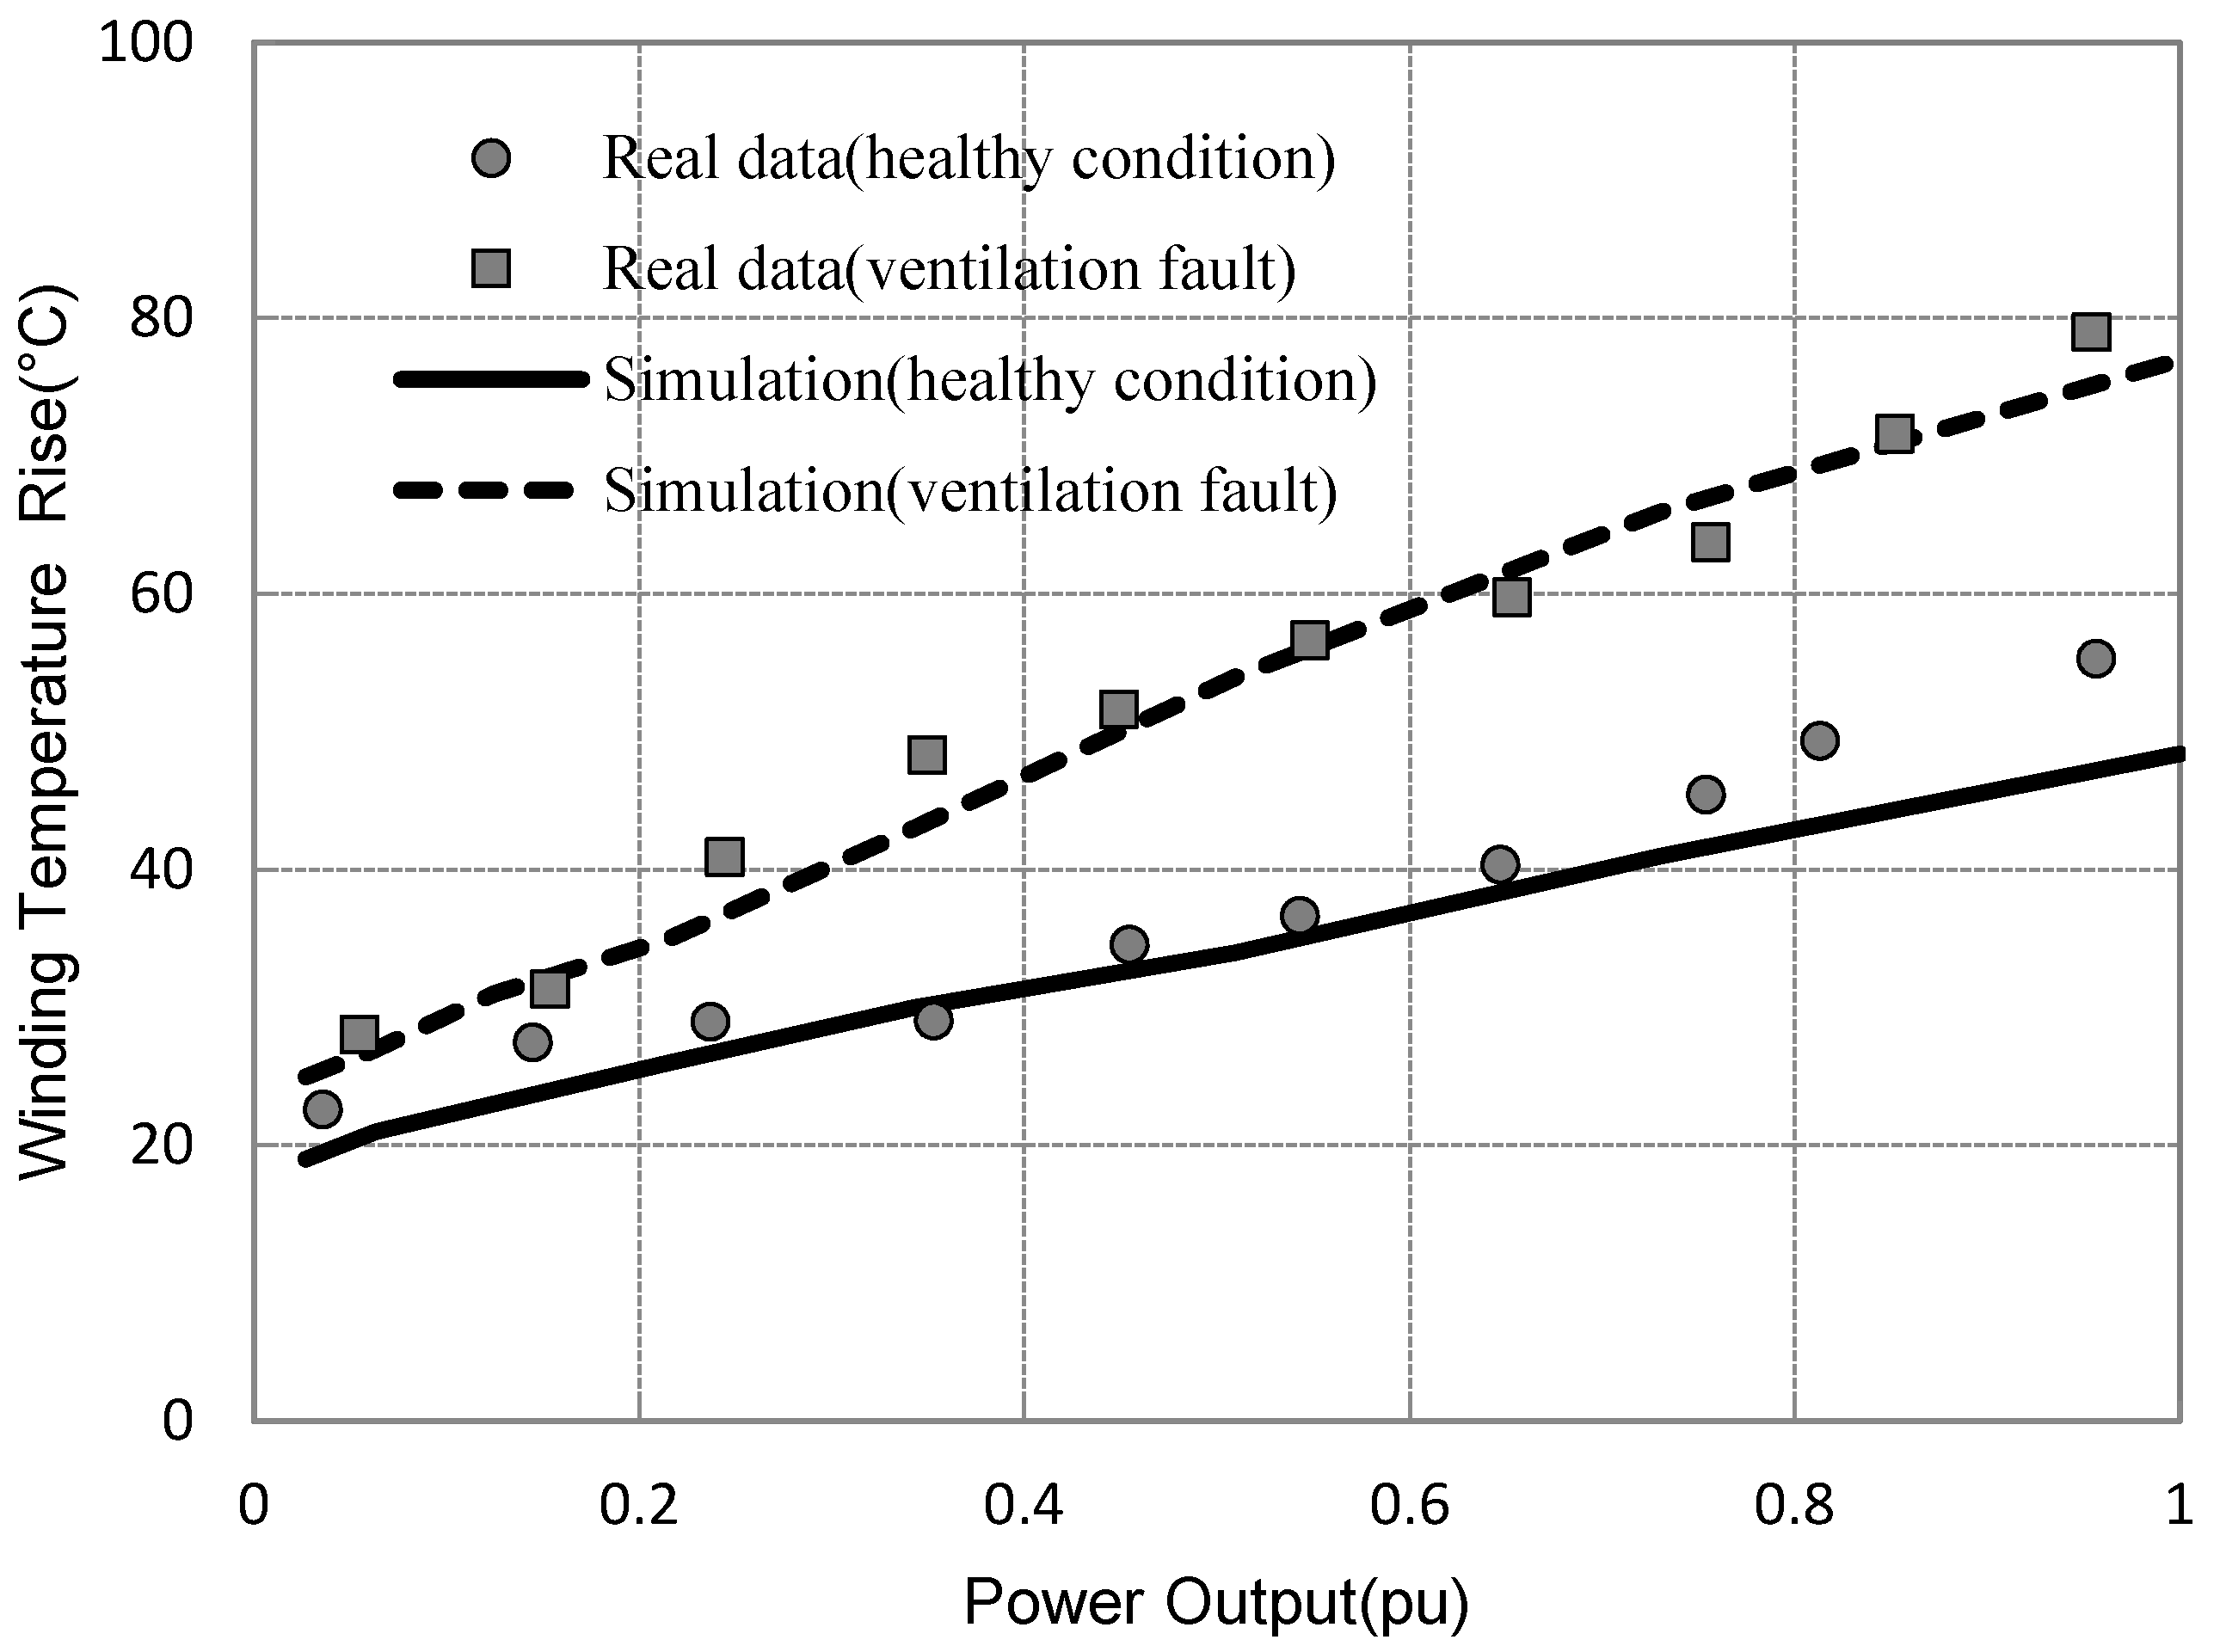
Figure 13 shows the real data collected under two conditions by plotting the absolute winding temperature rise (K)
vs. normalized power output (pu) for a DFIG operating under healthy conditions (circles), and after generator ventilation failure (squares). The simulated data are further plotted under the same conditions: DFIG operating under healthy conditions (solid line), and after generator ventilation failure (dashed line). Besides the generator rating, the parameters in the simulation model such as stator winding resistance, thermal resistance and capacitance in the LPN model are adjusted accordingly to match the real data. The stator winding resistance is set to 0.016 Ω and its temperature coefficient is chosen as 0.0039 Ω/K. It is clear in
Figure 13 that good agreement between the simulation result and the real data is reached. From the simulation, the R
th is 0.0101 K/W and
Cth is 19,200 Ws/K before the generator ventilation failure, however, R
th increases to 0.0174 K/W and
Cth remains the same after the ventilation failure. When the ventilation system is faulty, an increase of the gradient and the same intercept are found in the plot of stator winding temperature rise against power output.
Figure 13.
Winding temperature rise against normalized power output when DFIG under healthy condition and with ventilation system fault.
Figure 13.
Winding temperature rise against normalized power output when DFIG under healthy condition and with ventilation system fault.
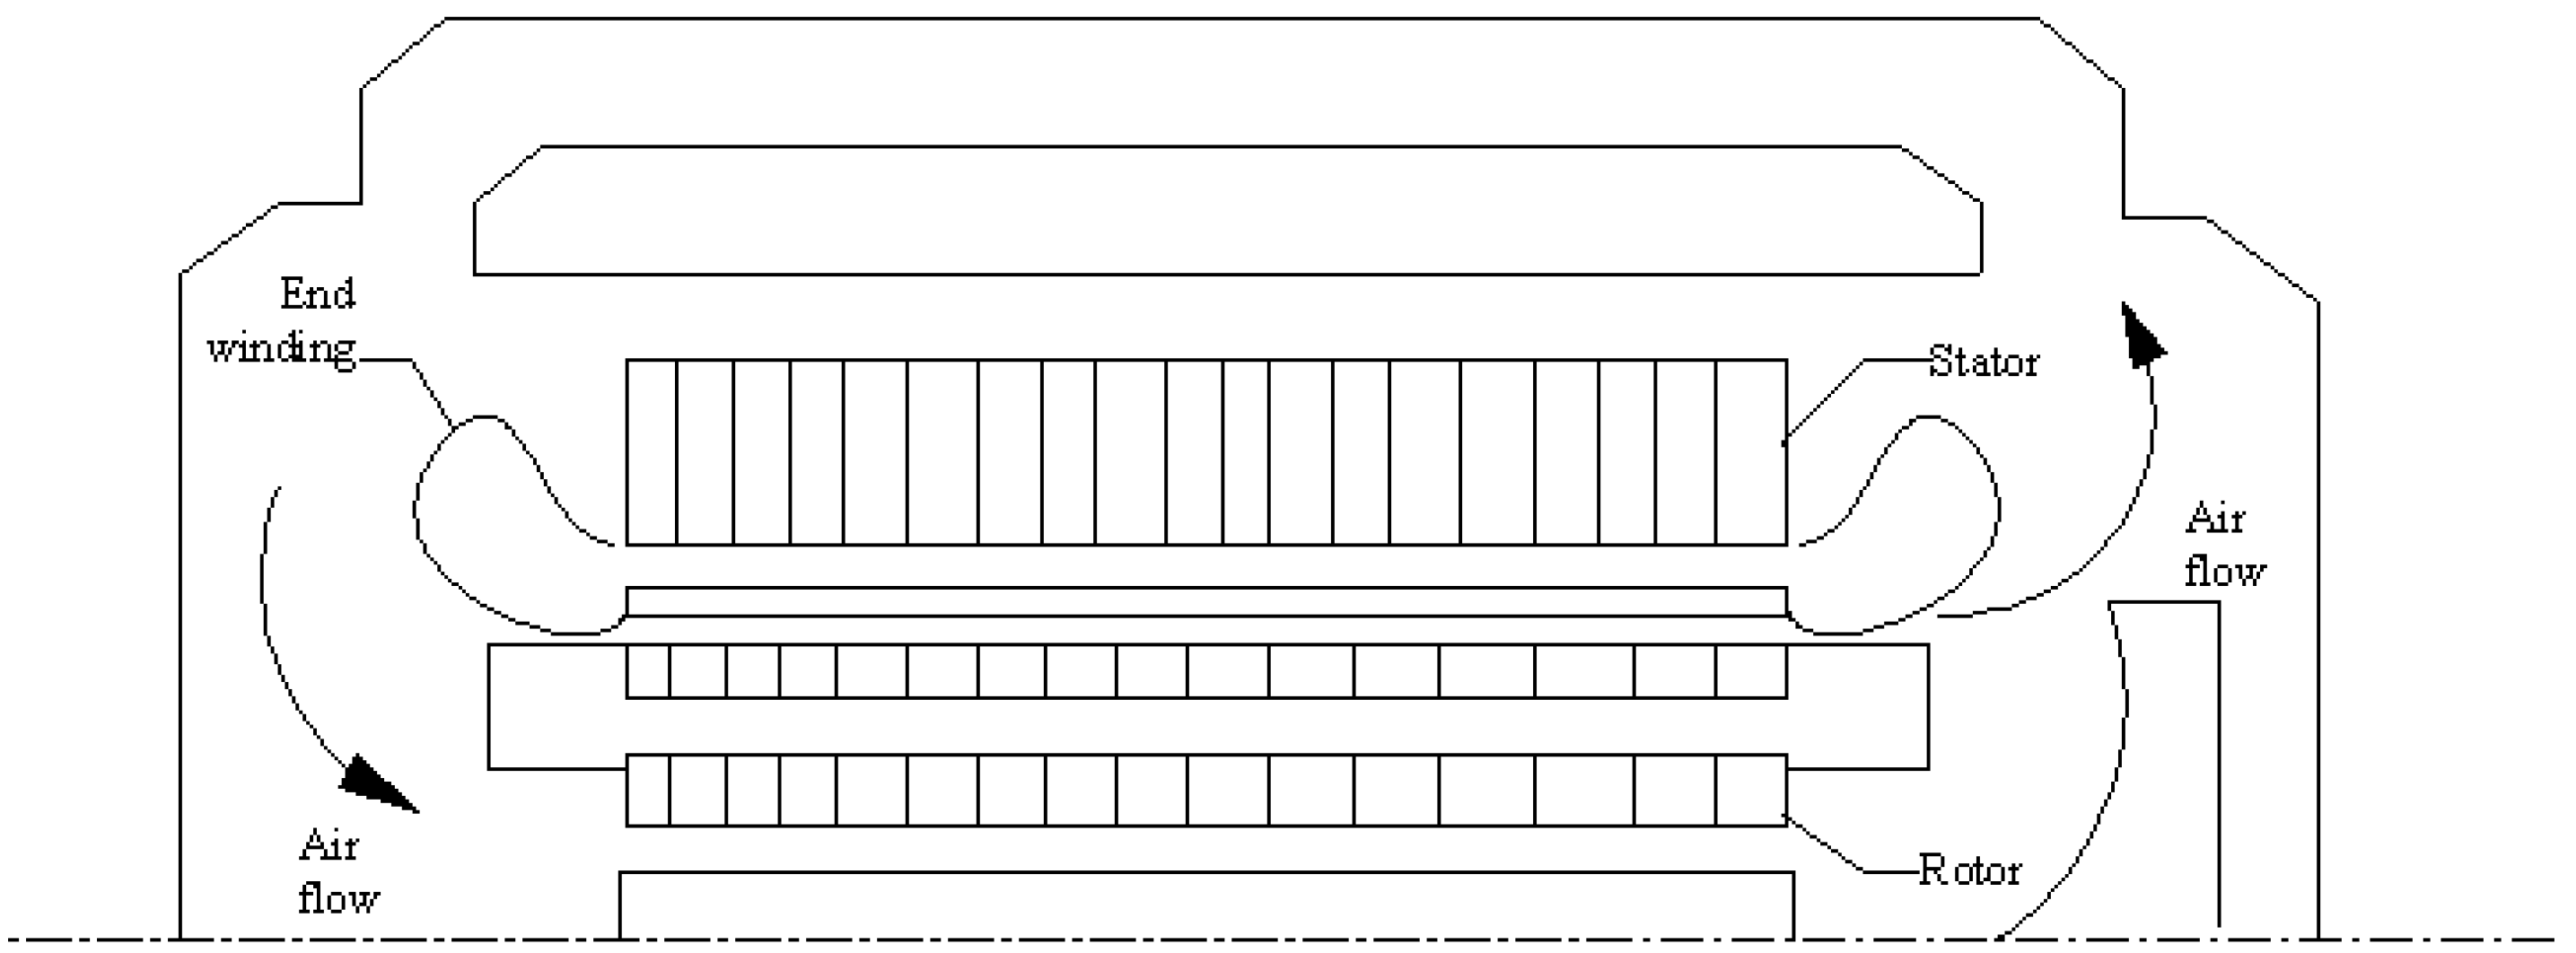
It is important to understand the thermal process within a DFIG generator with a faulty ventilation system. Since the generator is air-cooled, the air flow inside the generator will change from forced convection to natural convection as long as the ventilation system is faulty. In this situation, it is more difficult to dissipate the heat, which leads to an increase of the convection resistance coefficient. Due to the increase of the internal temperature of the DFIG, the stator winding resistance will increase with the temperature coefficient of 0.0039 Ω/K of copper. This further leads to an increase of power loss. The increase of power loss and the variation of thermal resistance will lead to an increase of the winding temperature rise. The fitting shows that a good agreement is obtained by increasing the thermal resistance from 0.0101 K/W to 0.0174 K/W for the DFIG switching from healthy situation to faulty ventilation circumstances. The temperature rise of the DFIG is determined jointly by the stator winding resistance and thermal resistance while the thermal capacity Cth remains the same. The increase of thermal resistance of Rth will also result in a shorter time for the generator temperature to become stable, which can be observed from the detailed analysis that shows increased scattering of the temperature data
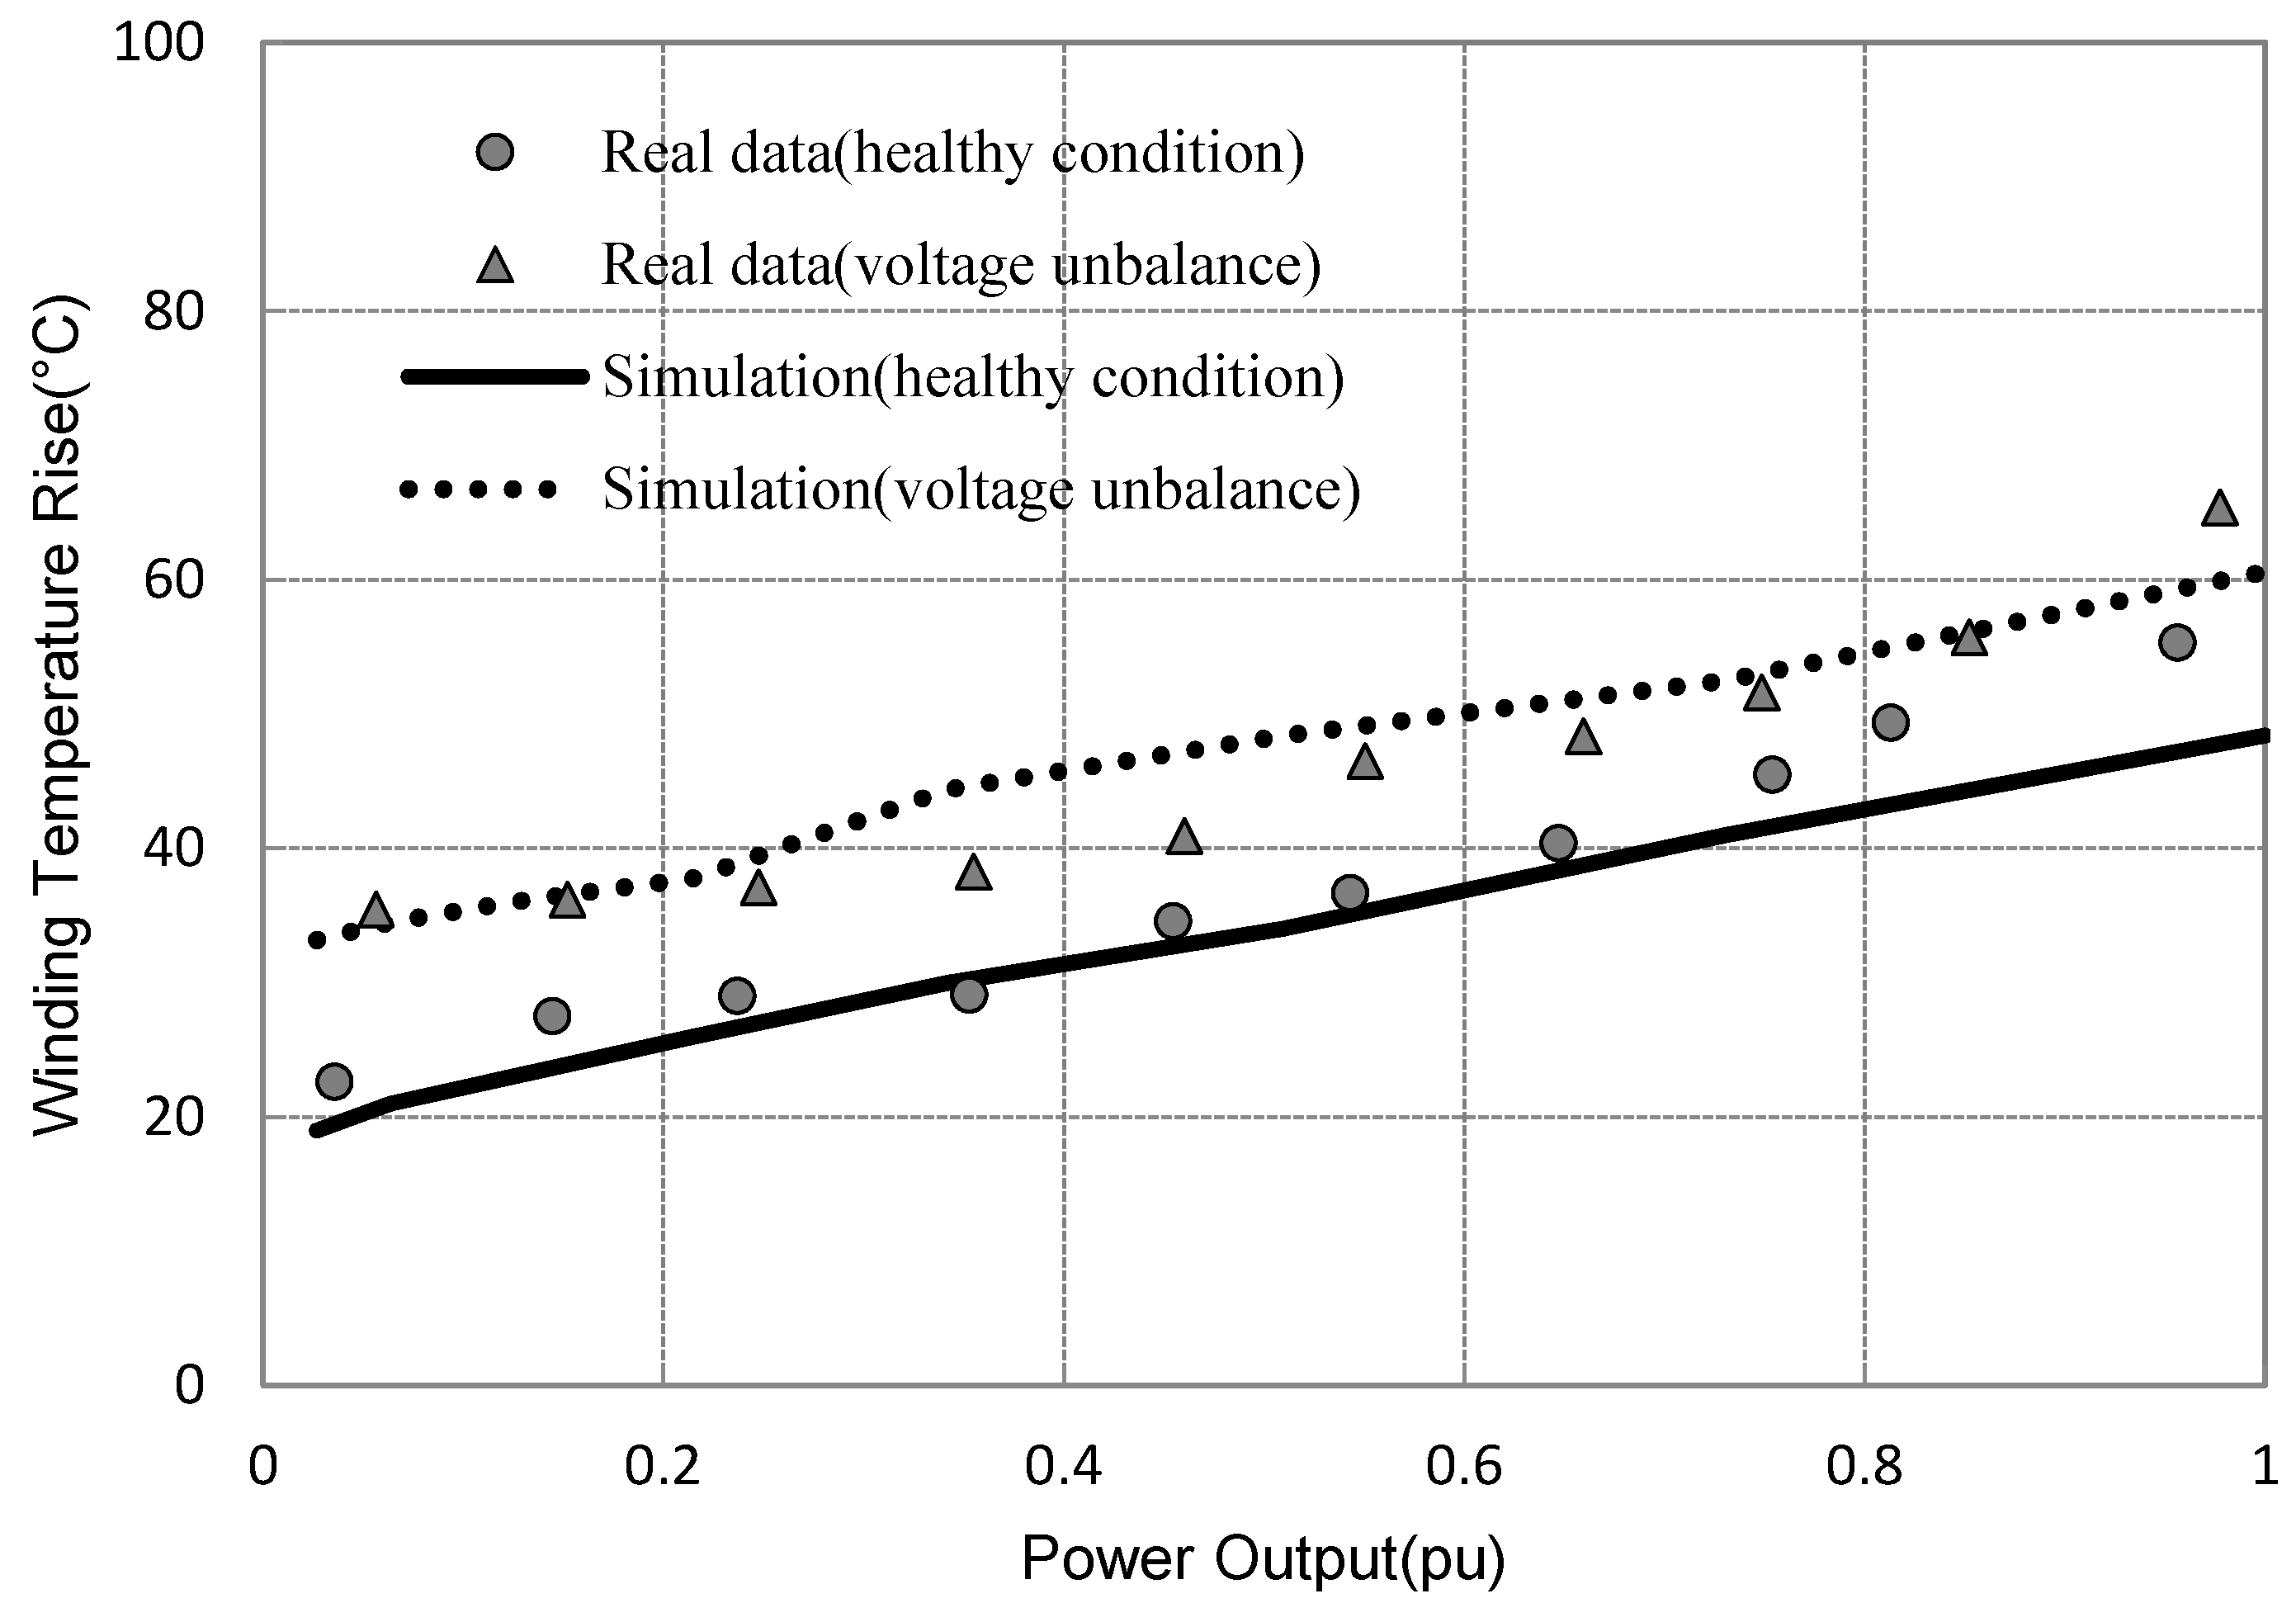
Figure 14 shows the real data of absolute winding temperature rise (K)
vs. normalized power output (pu) collected under another two conditions: a DFIG operating under healthy conditions (circles), and a DFIG operating under all three-phase voltage unbalance with 5% overvoltage (triangles). Similarly, the simulated data are further plotted under the same machine conditions, including a DFIG operating under healthy conditions (solid line) and a DFIG operating with a three-phase voltage unbalance with 5% overvoltage (dotted line). After the supply voltage is unbalanced with 5% overvoltage, the line intercept becomes greater, the gradient of stator winding temperature rise against power output remains the same as under healthy conditions.
Figure 14.
Winding temperature rise against normalized power output when the DFIG is under healthy conditions and with voltage unbalance.
Figure 14.
Winding temperature rise against normalized power output when the DFIG is under healthy conditions and with voltage unbalance.
The thermal mechanism due to voltage unbalance within the generator is different from a ventilation system failure. Voltage unbalance will have a direct impact on the generator output current, which further affects the losses in the generator. In this case, both the current and resistance of the stator winding increases while the thermal resistance and capacity is the same as the healthy situation. The result shows that a 5% overvoltage on the DFIG leads to a 6–12 K (or °C) temperature increase in the generator stator winding. The magnitudes of the temperature increases are nearly in proportion for different power generations. It is proved by the same gradient as shown in the plot. By combining both simulation and real data analysis, a curve of winding temperature against power output can reveal certain thermals mechanism in the DFIG. Failure modes related to the change of thermal behaviors such as ventilation faults and voltage unbalance can be distinguished clearly using this approach. The approach is thus proven to be useful for fault detection and diagnosis of WT DFIGs and the simulation model plays a key role in providing guidance for post-data analysis and interpretation.
3.4. Influence of Wind Speed and Failure Mode on Winding Lifetime
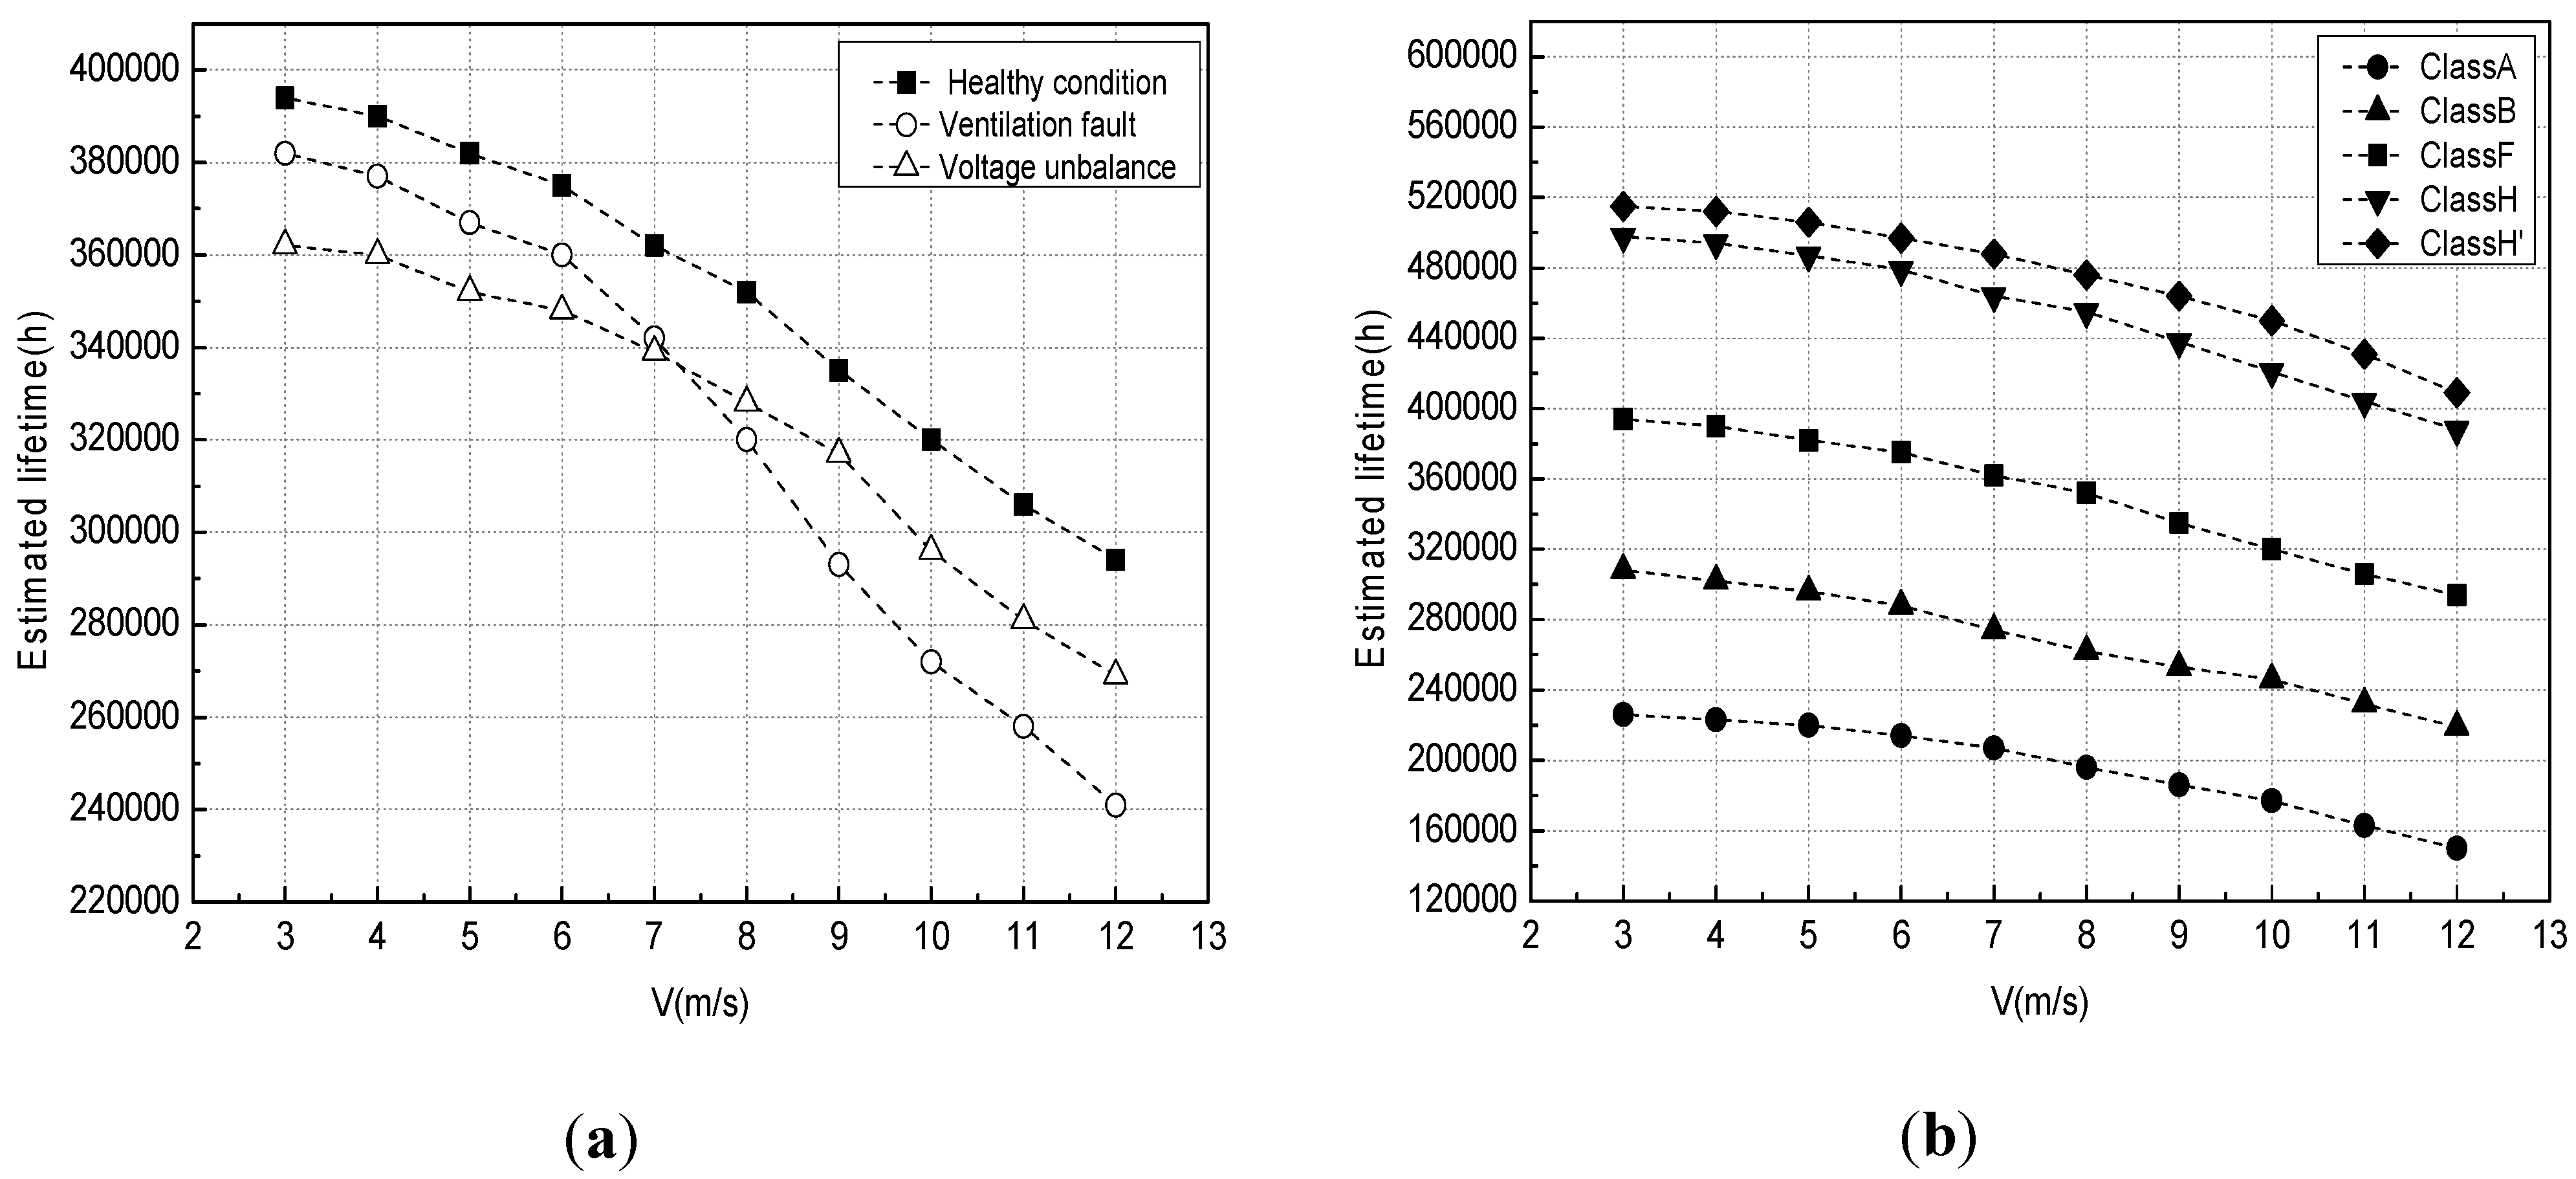
Assuming Class F insulation for a generator stator winding,
Figure 15a shows the estimated lifetime of a WT DFIG operating at a certain wind speed. Under healthy operating conditions, the estimated lifetime of the DFIG will be reduced by an increase of wind speed.
Figure 15a also shows the estimated lifetime of stator windings subjected to two failure modes,
i.e., voltage unbalance with 10% overvoltage and ventilation system failure with thermal resistance increasing by 12.5% and thermal capacitance decreasing by 46.2%. In the higher wind speed range above 7 m/s, ventilation failure has a greater impact on shortening generator lifetime. However, the voltage unbalance has nearly the same effects on shortening generator lifetime at different wind speeds, so the estimated lifetime curve is shifting downwards vertically.
Figure 15b shows the estimated lifetimes of stator windings with different Class ratings. To choose an appropriate generator insulation Class, a tradeoff should be made between lifetime design and overall cost.
Figure 15.
Lifetime downrating of stator windings subjected to generator system faults (a); lifetime estimation of stator windings with different Class ratings (b).
Figure 15.
Lifetime downrating of stator windings subjected to generator system faults (a); lifetime estimation of stator windings with different Class ratings (b).


