1. Introduction
In distribution systems, events caused by reconfiguration, maintenance or faults can leave all or part of a LV distribution network operating without the connection to the Medium Voltage (MV) distribution system and remaining energized as an autonomous entity by the Distributed Generators (DGs) connected to the isolated grid. Such an operation is referred to as islanding or loss-of-mains of the LV distribution network [
1,
2]. Unintentional islanding creates hazards for the utility personnel, who may intervene on parts of the LV network which should be isolated but are actually still energized by the DGs. Furthermore, such an unsupervised system operation may entail adverse power quality and impact on the equipment and customers within the islanded area. Eventually, the electrical equipment can be damaged by out-of-phase closure occurring when, after a fault, the unwanted island is reconnected to the utility network by automatic reclosing of MV breakers without any synchronizing action [
3]. For all these reasons, the adoption of an adequate protection system able to detect any islanding condition and disconnect the DGs from the isolated network is essential to ensure the safe and secure operation of LV distribution systems.
Until a few years ago, the adoption of low-and high-voltage and low-and high-frequency relays, installed in the interface protection system at the DG premises, ensured the detection of islanding conditions. In fact, the low level of DG penetration in distribution networks caused a significant unbalance between generation and load during islanded operation; the resulting voltage and frequency perturbations were large enough to be detected by the low-and high-voltage and low-and high-frequency relays that tripped the DGs [
4]. Over the last decade, the wide spread of DGs in LV distribution networks, especially of photovoltaic systems, has made it possible that, following the loss-of-mains, generation may balance load, maintaining the voltage and frequency within the admissible limits and preventing the intervention of the classical anti-islanding relays adopted by DGs [
5].
A further issue is related to the false tripping of the DGs which is caused by classical anti-islanding relays. In fact, although the low-and high-voltage and low-and high-frequency relays do not permit the detection of “balanced islands”, their sensitivity is high enough to confuse voltage and frequency excursions due to islanded operation with the ones due to perturbations generated at the transmission or distribution level, such as faults or sudden load changes [
5,
6]. Nowadays, false islanding detections can cause a massive loss of generation through a domino effect in the distribution systems, with consequences on the stability of the transmission system [
7]. Then, many national and international standards for the connection of DGs to the distribution networks have recently been revised and less restrictive thresholds for the classical DG relays have been adopted, with the adverse effect of increasing the inadequacy of the classical relays to detect balanced islanding operating conditions [
1,
8].
To avoid missing the detection of balanced islands as well as misclassifying other perturbations as loss-of-mains, a number of innovative solutions for the anti-islanding protection systems of the LV distribution networks have been proposed, including new relays based on communication systems [
5,
9] or classical relays equipped with additional new passive anti-islanding detection methods [
5,
10]. In the former solution, when an utility circuit breaker opens yielding an islanding condition, a communication-based relay detects the status of the breaker and sends signals to remotely disconnect the DGs. This solution could be very effective but may incur in prohibitive costs, especially for the LV distribution networks because it requires the realization of dedicated communication infrastructures between MV/LV substations and DGs. The second type of solution appears to be more adequate and economically-viable for LV distribution systems. The idea is to add new passive detection methods to the existing protection systems so as to correctly detect balanced islands without increasing DG false tripping in the case of other perturbations.
This paper proposes a new protection system for islanding detection in LV distribution systems which enriches the classical voltage and frequency relays installed at the DG premises with an innovative Smart Islanding Detector (SmartID), recently proposed from the authors to guarantee a reliable detection of the balanced islands when the classical relays fail. The SmartID adopts a new passive method based on a linear representation of the distribution system as seen from the SmartID installation point, which is named Thevenin-like model. Details about the method and its implementation in an actual device as well as about its validation in real grids can be found in [
1,
2]. The specific contribution of this paper is to analyze the features and the performance of the overall LV anti-islanding protection system, including both classical relays and the SmartID.
The paper is organized as follows: in
Section 2 the events causing the islanded operation of the LV distribution system are identified and classified, so as to define the requirements of a reliable anti-islanding protection system. The architecture and operation of the proposed protection system is described in
Section 3. Finally, experimental simulations results are reported in
Section 4. The performance analysis is carried out by a hardware-in-the-loop test facility, whose core is the Real-Time Digital Simulator (RTDS) [
11] that allows interfacing the real-time distribution system simulation with an actual SmartID device.
2. The Islanding Events in LV Distribution System
An islanding condition arises when a portion of the distribution system, including the DGs and loads, is inadvertently isolated from the upstream utility network and kept energized by the DGs [
2]. The islanded operation of all/part of a LV distribution system can occur when there is the loss of the main supply delivered by the MV distribution system through the MV/LV substation. The islanded operation presents different features according to the cause that determines the loss of the main supply. In general, four cases can be recognized
loss of the MV supply in normal operation of the MV distribution system,
loss of the MV supply due to faults in the MV distribution system,
loss of the MV/LV substation in normal operation of the LV distribution system,
loss of the MV/LV substation due to faults in the LV distribution system.
To analyze in details these cases, let the distribution system in
Figure 1 be considered. The MV distribution system is composed of two feeders, indicated as
and
, supplied by two HV/MV transformers. Each MV feeder is protected by a circuit breaker at its head, named CB
1 and CB
2 respectively, and can be sectionalized by the switch disconnectors SD
1, ..., SD
13. In normal operation the two feeders are separated by SD
7 which is normally opened but can change its status to guarantee a flexible reconfiguration of the MV distribution system. Two LV networks including DGs are evidenced and indicated as LV
and LV
: each one is supplied by a MV/LV substation, named Sub
1 and Sub
2 respectively, which are protected at their heads by two circuit breaker, CB
3 and CB
4; the two LV networks operate separately and the normally opened disconnector D
1 can be used only for load transfer [
12].
Figure 1.
Simple distribution system with DGs.
Figure 1.
Simple distribution system with DGs.
2.1. Loss of the MV Supply in Normal Operation of the MV Distribution System
The loss of the MV supply can occur during the normal operation of the MV distribution system, as a consequence of switching operations for network reconfiguration or maintenance, or of false tripping in the MV networks. The MV network reconfiguration is used to reduce the distribution power losses and/or to relieve overloads; the maintenance is usually performed to improve the reliability of the MV distribution system; false tripping of the circuit breakers is caused by unexpected events [
13,
14,
15]. Depending on the considered case, the loss of the MV supply can last for different time intervals. With reference to
Figure 1 some examples are described in the following. A network reconfiguration can lead to supply Sub
1 from
by automatically closing SD
7. In most cases this procedure does not cause the loss of the MV supply. However, if the network reconfiguration involves the simultaneous opening of the switch disconnectors in
and
, it will cause the loss of the MV supply for several seconds. The maintenance of a component of
can require the intervention of the utility personnel, that manually opens CB
1 to electrically isolate the component to be maintained; such an operation can last from minutes to hours. Finally, consequent to a false tripping of CB
1, a loss of the MV supply can last for around few hundreds of milliseconds (typically 200 ms), after which
is re-energised by the automatic reclosure of the circuit breaker.
2.2. Loss of the MV Supply due to Faults in the MV Distribution System
The loss of the MV supply can occur as a consequence of switching operations due to single/multiple phases faults in the MV distribution system; the duration of the faults is minimized by automatic reclosing procedures of the MV protection system [
16]. In
Figure 1, for example, subsequent to the fault along
, the relays of the MV distribution system will detect the fault operating condition and will send an opening command to CB
1. A first fast reclosure of CB
1 is around 200 ms after the first CB
1 opening. If the fault is cleared before the CB
1 reclosure, the re-energization of the distribution system is successful; otherwise, CB
1 is opened again together with SD
1, ..., SD
6. In this latter case, a second slow reclosure of CB
1 is expected around 30 s after its first opening. After this reclosure, all the switch disconnectors are sequentially closed starting from SD
1. If the fault is not cleared yet, the MV protection system can foresee further steps of the reclosing procedure, otherwise the fault has to be repaired.
2.3. Loss of the MV/LV Substation in Normal Operation of the LV Distribution System
In comparison with the MV distribution system, the LV distribution system does not present an high level of automation [
17]. Thus, network reconfiguration, maintenance and false tripping require the intervention of the utility personnel, which causes lack of supply of LV system for long time intervals (minutes-hours). In
Figure 1, for example, the maintenance of Sub
1 requires to open both SD
5, SD
6 and CB
3. If a network reconfiguration is expected, the LV network can be re-energized by opening CB
4, changing the status of D
1 and closing CB
3 again. This manual procedure takes at least several minutes.
2.4. Loss of the MV/LV Substation due to Faults in the LV Distribution System
The loss of the MV/LV substation can occur as a consequence of single/multiple phases faults in the LV distribution system. For example, subsequent to the fault along the LV
in
Figure 1, the opening of CB
3 yields the loss of Sub
1. The reclosure of CB
3 is not automatic and requires the manual intervention of the utility personnel that takes a long time (minutes-hours). If the fault is cleared, the first reclosure attempt is successful; otherwise the failure component must be repaired and the loss of the MV/LV substation lasts for even more time. Moreover, also in the case of a successful reclosure, part of the LV network could still remain unfed by Sub
1, because the fault may cause a joint disconnection, evidenced in
Figure 1 as a line interruption at the fault point in the LV
.
From the previous analysis, some general considerations about the islanded operation of the LV distribution system can be derived, that allows to define the requirements of the anti-islanding protection system. They can be summarized as follows
- -
the islanded operation of the whole LV distribution system can be caused by events occurring in the MV distribution system and can last for about 200 ms or for at least 30 s;
- -
the islanded operation of all/part of the LV distribution system can be caused by events occurring in the LV distribution system and can lasts for long time intervals (minutes-hours).
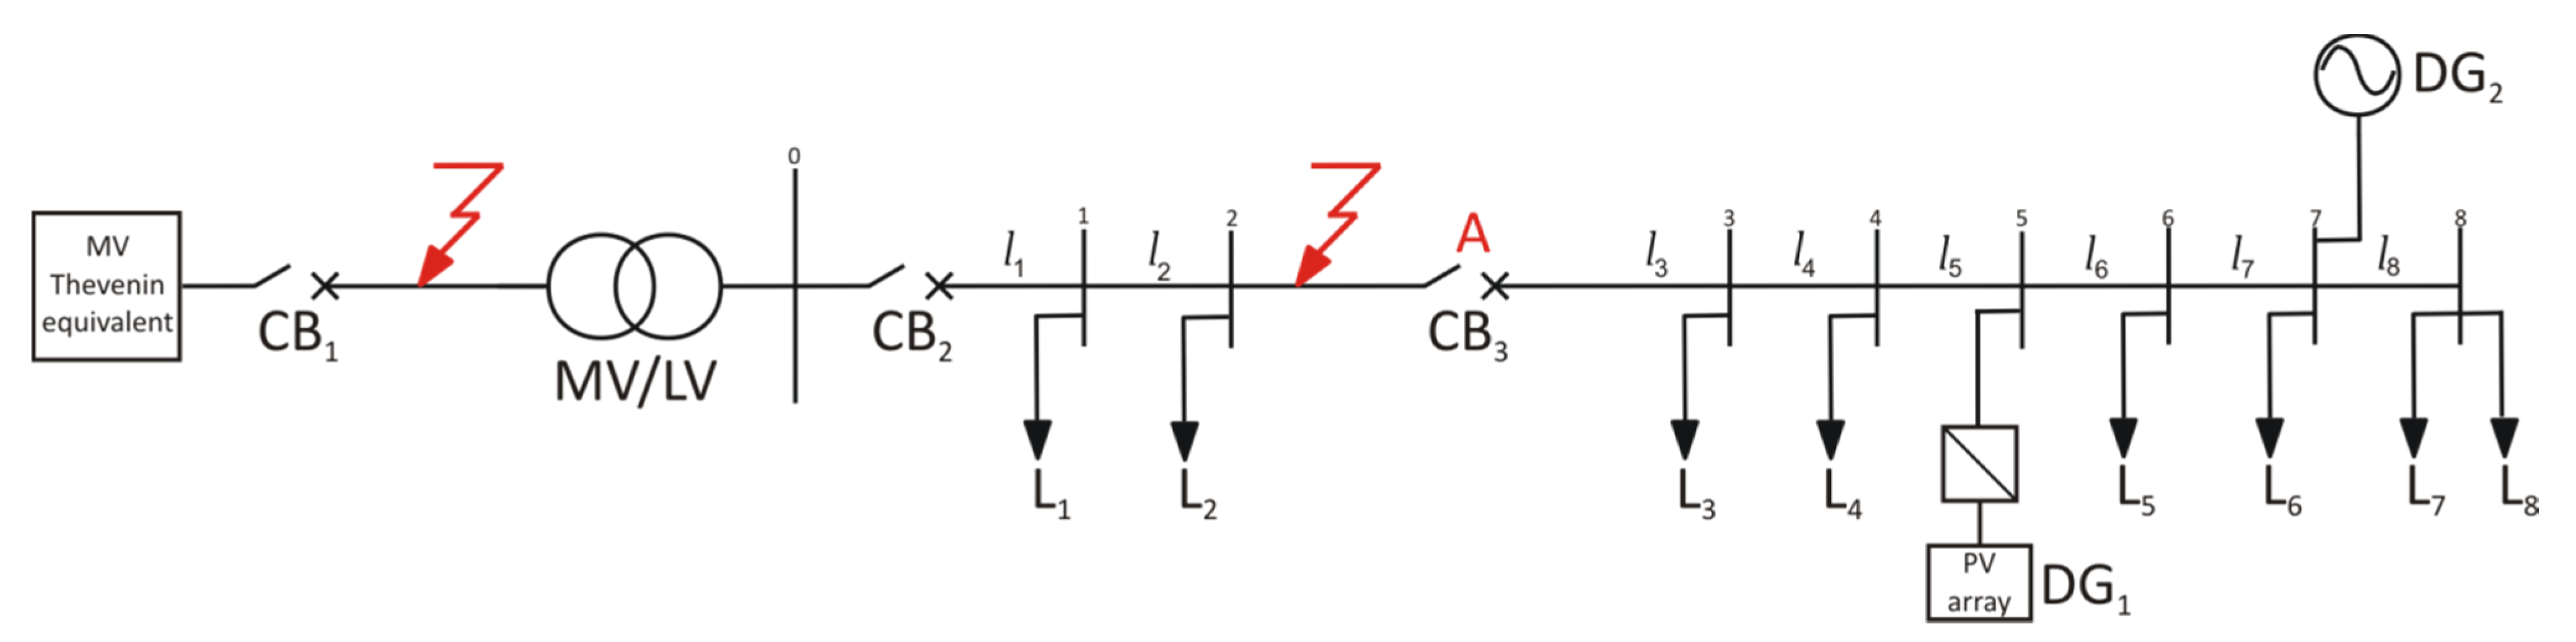
4. Numerical Simulations
The experimental studies have been performed with reference to the test distribution system in
Figure 3. It is composed of a
distribution system, represented by a Thevenin equivalent and the circuit breaker CB
1, which supplies through a
-
transformer a
three-phases feeder protected by the utility breaker CB
2. The electric parameters of the lines
,...,
are reported in
Table 4. The active and reactive powers absorbed by the loads
supplied by the LV feeder are shown in
Table 5; loads
are subject to random variations within the range reported in
Table 5. The LV distribution system includes two
DGs, named DG
1 and DG
2. DG
1 is a photovoltaic system coupled with the grid by a power converter; the active power is controlled and varies following the random irradiation, while the reactive power is controlled with a power factor equal to 0.9. DG
2 is a small hydro-turbine moving a three-phase synchronous generator, which is equipped with active and reactive power control systems, whose set-points are fixed so as to create and sustain balanced islands, as described in the following. Both the DG interfaces include the low-and high-voltage and low-and high-frequency relays, whose thresholds are fixed according to the CEI standard as reported, respectively, in
Table 1 and
Table 2. The SmartID device is connected at the terminals of either DG
1 or DG
2 and its thresholds are reported in
Table 3.
Figure 3.
Test distribution system.
Figure 3.
Test distribution system.
Table 4.
Electric parameters of the lines.
Table 4.
Electric parameters of the lines.
| | | | | | |
|---|
| R | X | R | X | R | X | R | X | R | X | R | X | R | X |
| (Ω) | (Ω) | (Ω) | (Ω) | (Ω) | (Ω) | (Ω) | (Ω) | (Ω) | (Ω) | (Ω) | (Ω) | (Ω) | (Ω) |
| 0.067 | 0.016 | 0.038 | 0.009 | 0.073 | 0.017 | 0.051 | 0.009 | 0.061 | 0.009 | 0.033 | 0.005 | 0.026 | 0.004 |
Table 5.
Active and reactive powers absorbed by the loads.
Table 5.
Active and reactive powers absorbed by the loads.
| Powers | | | | | | | | |
|---|
| P (kW) | 1.5 | 0.58 | 21.0 | 0.0 ÷ 1.5 | 4.44 | 1.5 | 0.0 ÷ 1.6 | 3.0 |
| Q (kVAr) | 0.68 | 0.26 | 9.45 | 0.0 ÷ 0.68 | 2.0 | 0.68 | 0.0 ÷ 0.72 | 1.35 |
The analysis is carried out by a hardware-in-the-loop test facility. The core of the set-up is the RTDS [
11] equipped with RSCAD/EMTDC, which is used to simulate in real-time the distribution network, the DGs and the classical interface protections. Conversely, the SmartID is an actual device, interfaced with the RTDS by D/A converters.
The aim of the case study is to compare the proposed anti-islanding protection system with the classical one. Two different analysis are carried out. The first one aims at comparing the performance of the two protection systems in detecting islands characterized by the exact balance between generation and load. The second one is a sensitivity analysis that aims at evaluating the impact of different imbalances of the active power
and of the reactive power
on the performance of the two protection systems. In both the analysis two events are considered (see
Section 2)
Event 1: islanded operation of the whole LV distribution system caused by a single-phase fault in the MV distribution system with the failure of the fast reclosure;
Event 2: islanded operation of part of the LV distribution system caused by a three-phase fault in the LV distribution system yielding joint-disconnection.
To take into account the stochastic nature of loads and irradiation, the analysis are carried out by adopting a statistical approach. Repeated simulations of the same distribution system changing from grid-connected to islanded operation are performed by imposing random variations of the two variable loads and the irradiation of the photovoltaic system.
The transition from grid-connected to islanded operation is simulated by opening a circuit breaker in the distribution system when the power imbalance in the island is equal to the desired value, achievable by acting on the DG2 control system.
In the case of Event 1, the simulation starts with both the DGs in connection with the MV supplying system; acting on the DG
2 control system, the powers flowing through CB
2 are reduced to the desired power imbalances
and
. Then, a single-phase fault occurs at the MV busbar, as shown in
Figure 3. After 150 ms, CB
1 is opened thus simulating the action of the MV protection system against fault; after further 200 ms, the fast reclosure of CB
1 takes place but fails and CB
1 is opened again after 150 ms. In this way, the whole LV distribution system operates in island while the single-phase fault in the MV network is not extinguished.
In the case of Event 2, the joint is located in the point A of the line
in
Figure 3 and its disconnection is simulated by the opening of the breaker CB
3. The simulation starts with both the DGs in connection with the MV/LV substation; acting on the DG
2 control system, the powers flowing through CB
3 are reduced to the desired power imbalances
and
. Then, a three-phase fault occurs along the line
, as shown in
Figure 3. After 50 ms, CB
3 is opened thus simulating the joint disconnection and a part of the LV distribution system operates in island.
The performance of the anti-islanding protection systems is measured on the basis of the successful detections and the related detection times (the detection time represents the time interval elapsing between the occurrence of the island and the change of the relay output) for the voltage and frequency relays and the SmartID. The use of detection times rather than the clearing times allows the use of the same simulation to compare the performance of the two protection systems. The detection times are expressed in terms of Gaussian statistical distributions. For the sake of comparison, some performance indices are derived from the distributions, namely the percentage of missed detections , the mean value and the standard deviation of the detection times in the cases of successful detections.
4.2. Sensitivity Analysis with Respect to Power Imbalances
The impact of different
and
on the performance of the two protection systems is analyzed. Four cases are considered, combining the two events causing the islanded operation and different types and amplitudes of the power imbalance:
- (a)
Case A: Event 1 with and ;
- (b)
Case B: Event 1 with and ;
- (c)
Case C: Event 2 with and ;
- (d)
Case D: Event 2 with and .
In all the cases the SmartID has been installed at the DG1 premises whose voltage and frequency relays present less restrictive thresholds. As in the previous analysis, twenty simulations are carried out for each considered case.
4.2.1. Case A
The results of a sensitivity analysis of the performance indices with respect to an active power imbalance
ranging from −10% to +10% are reported in
Table 11. Also in the case of significant power imbalances,
fails by either missing detection or presenting an unacceptable detection time. On the contrary,
and
successfully detect the unwanted conditions with adequate detection times. Comparing the performance indices of the classical and of the proposed protection systems, the correct operation within 30 s of both the solutions is evident, although the proposed system always presents smaller
and
. This result could be misleading: the successful intervention of the classical protection system is due to the presence of
characterized by strict thresholds, that are going out of use. It is worth noticing that further increases of
are not analyzed because the larger the frequency and voltage excursions are, the faster the intervention of the classical relays.
Table 11.
Comparison between the classical and the proposed protection systems in the Case A.
Table 11.
Comparison between the classical and the proposed protection systems in the Case A.
| Performance indices | Single relay | Classical protection system | Proposed protection system |
|---|
| | |
|---|
| (%) | | 30 | 0 | 0 | 0 | 0 |
| 60 | 0 | 0 | 0 | 0 |
| 30 | 0 | 0 | 0 | 0 |
| 25 | 0 | 0 | 0 | 0 |
| (s) | | 63.38 | 6.05 | 11.54 | 11.53 | 5.98 |
| 26.14 | 7.97 | 3.63 | 3.55 | 2.64 |
| 31.13 | 7.08 | 11.14 | 11.12 | 5.75 |
| 73.69 | 7.44 | 1.82 | 1.76 | 1.62 |
| (s) | | 18.05 | 2.19 | 3.38 | 3.40 | 2.06 |
| 23.77 | 3.00 | 3.86 | 3.75 | 2.59 |
| 31.65 | 3.36 | 4.91 | 4.94 | 2.05 |
| 31.79 | 2.06 | 2.35 | 2.30 | 1.97 |
4.2.2. Case B
In
Table 12, the results of a sensitivity analysis of the performance indices with respect to a reactive power imbalance
ranging from −5% to +5% are reported. Concerning
, it presents an opposite behavior with respect to the sign of
: for a positive variation it always detects islanded operation whereas for a negative one it always misses detection. This is due to the asymmetrical setting of the voltage thresholds reported in
Table 2. Concerning
, it always detects the unwanted conditions in a small time thanks to the frequency relay with strict threshold settings. Concerning
, it always identifies islands with a performance similar to the one observed for imbalances of
; it can be stated that the SmartID is quite insensitive to the type, the sign and the amplitude of the power imbalance. Concerning the classical and the proposed protection systems, considerations similar to the ones of the previous case can be made.
Table 12.
Comparison between the classical and the proposed protection systems in the Case B.
Table 12.
Comparison between the classical and the proposed protection systems in the Case B.
| Performance indices | Single relay | Classical protection system | Proposed protection system |
|---|
| | |
|---|
| (%) | | 0 | 0 | 0 | 0 | 0 |
| 100 | 0 | 0 | 0 | 0 |
| (s) | | 23.62 | 7.87 | 1.06 | 1.04 | 0.95 |
| - | 7.40 | 2.52 | 2.43 | 2.21 |
| (s) | | 10.27 | 2.83 | 1.55 | 1.51 | 1.13 |
| - | 1.67 | 3.72 | 3.64 | 3.22 |
4.2.3. Case C
Table 13 reports the performance indices of the single relays and of the two protection systems which are obtained by varying the active power imbalance
from −10% to +10%. Even if significant power imbalances arise,
misses detection several times. Even when
detects island, it takes minutes and the order of magnitude of its
and
are too large to guarantee an adequate level of power quality so as to avoid electric equipment damages. On the contrary,
and
and both the classical and the proposed protection systems successfully detect the unwanted conditions with adequate detection times. As already explained, the successful intervention of the classical protection system is due to the presence of
characterized by strict thresholds, that are going out of use.
Table 13.
Comparison between the classical and the proposed protection systems in the Case C.
Table 13.
Comparison between the classical and the proposed protection systems in the Case C.
| Performance indices | Single relay | Classical protection system | Proposed protection system |
|---|
| | |
|---|
| (%) | | 15 | 0 | 0 | 0 | 0 |
| 35 | 0 | 0 | 0 | 0 |
| 15 | 0 | 0 | 0 | 0 |
| 30 | 0 | 0 | 0 | 0 |
| (s) | | 67.80 | 7.35 | 17.13 | 17.10 | 6.90 |
| 53.54 | 6.95 | 0.77 | 0.77 | 0.77 |
| 46.26 | 8.44 | 10.20 | 10.20 | 5.42 |
| 35.67 | 7.96 | 0.66 | 0.66 | 0.66 |
| (s) | | 19.41 | 2.06 | 5.88 | 5.90 | 2.29 |
| 28.35 | 1.54 | 0.01 | 0.01 | 0.01 |
| 33.10 | 2.24 | 8.37 | 8.37 | 3.82 |
| 31.14 | 1.68 | 0.07 | 0.07 | 0.07 |
4.2.4. Case D
Table 14 reports the performance indices of the single relays and of the two protection systems which are obtained by varying the reactive power imbalance
from −5% to +5%. For a positive variation of
misses detection for 5% of the simulations whereas for a negative one it always misses detection. Concerning
,
and both the classical and the proposed protection systems, they always identify islands with a small detection time.
Table 14.
Comparison between the classical and the proposed protection systems in the Case D.
Table 14.
Comparison between the classical and the proposed protection systems in the Case D.
| Performance indices | Single relay | Classical protection system | Proposed protection system |
|---|
| | |
|---|
| (%) | | 5 | 0 | 0 | 0 | 0 |
| 100 | 0 | 0 | 0 | 0 |
| (s) | | 13.67 | 11.75 | 0.64 | 0.64 | 0.64 |
| - | 7.02 | 2.79 | 2.79 | 2.52 |
| (s) | | 9.72 | 5.24 | 0.07 | 0.07 | 0.07 |
| - | 1.57 | 3.40 | 3.40 | 3.06 |


