1. Introduction
A microgrid can not only achieve grid-connected operation with distributed generators and a flexible and effective access distribution network, but also can run on islands. To some degree, this improves the reliability of the power supply and power quality (PQ) of the grid. However, the intermittent and random output characteristics of the distributed generators, such as photovoltaic and wind power, directly affect the microgrid’s voltage quality. Meanwhile, in order to realize distributed power consumption and flexible scheduling, a lot of nonlinear power electronic equipment is widely used and system operations (power and compensation capacitor switching) are frequently carried out in the microgrid. As a result, these lead to an increase in the number of PQ disturbance events [
1,
2,
3,
4]. In addition, the transient faults (including ground faults and phase faults, etc.) can lead to the breakdown of line insulation, power outages, and other serious consequences. Therefore, the PQ in the microgrid is further deteriorated [
5,
6,
7,
8].
Accurate recognition of power quality disturbances (PQD) is an important prerequisite and foundation for improving the PQ of the microgrid [
9]. In the smart microgrid, it is necessary to carry out PQ monitoring for microgrid networks and distributed generators. In this process, a large amount of PQ data has been accumulated, which has put forward higher efficiency requirements for PQD analysis methods [
10]. On the other hand, due to short duration and small changes in the electrical indicators, PQD analysis is more difficult [
11,
12]. Furthermore, compared to the PQ monitoring and analysis for traditional transmission network, the PQ signals recorded in the microgrid have many more noise components. The amplitude and frequency of the voltage change are irregular and the range of fluctuation is larger, which further increases the difficulty of PQD analysis [
13]. Consequently, we should design an efficient classifier with high accuracy and noise immunity to improve the ability and efficiency of PQD recognition in microgrid.
Features extracted from the time-frequency analysis method are always used as the input of the classifier for PQD recognition. Common signal processing approaches used for PQD signal processing include fast Fourier transform (FFT) [
14], wavelet transform (WT) [
15,
16], Hilbert-Huang transform (HHT) [
17], and S-transform (ST) [
18,
19,
20,
21,
22,
23]. Of the existing methods, ST and its modified forms are widely used for feature extraction of disturbance signals and have achieved good effects [
18,
19,
20,
21,
22,
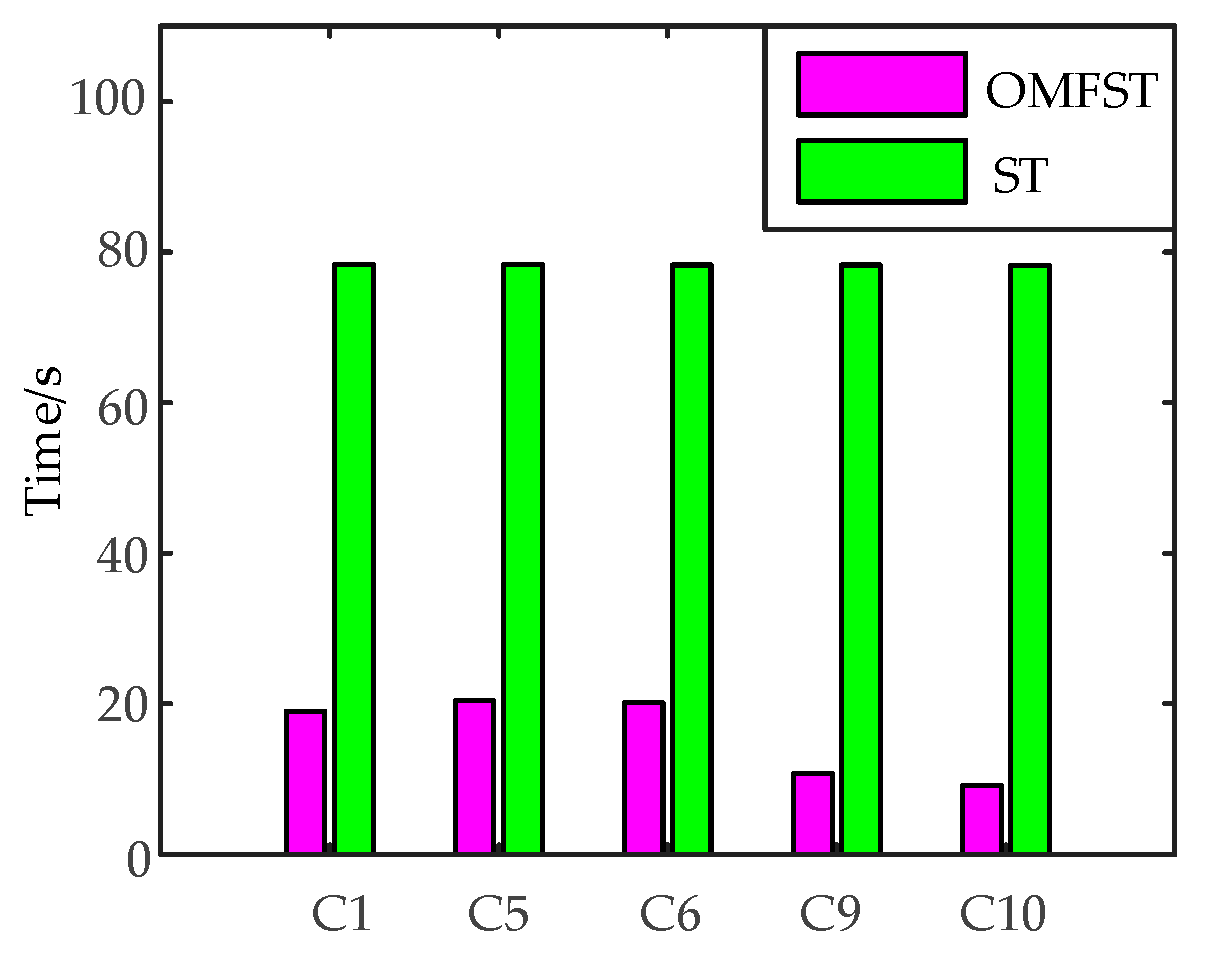
23]. ST has powerful time-frequency analysis ability and is not sensitive to noise, which is conducive to the extraction of multiple time-frequency features for PQD recognition. However, the major limitation of ST is its high computational and spatial complexity.
Feature extraction of disturbance signals is generally carried out in specific parts of the ST modulus matrix. Thus, we need not carry out inverse fast Fourier transform (IFFT) on the entire frequency area. Some researchers have proposed a fast S-transform (FST) method. Compared to ST, FST selects the main disturbance frequency points and only carries out IFFT on the selected frequencies to minimize the number of computations [
19,
20]. However, the frequency domain energy of transient oscillation is widely distributed in the high frequency range with short duration and small energy. The main disturbance frequency domain is difficult to get through the FFT spectrum, especially in high noise environments. Hence, the existing FST methods cannot completely satisfy the needs of disturbance recognition. In addition, when disposing complex disturbances, the time resolution and frequency resolution of ST and FST, which are conditioned by the Heisenberg uncertainty principle, cannot be satisfied simultaneously with a uniform time-frequency window width factor. As for the analysis of the complex disturbance with harmonic and sag component, the harmonic component analysis requires a higher frequency resolution, while sag component analysis requires a higher time resolution. Accordingly, multi-resolution generalized S-transform (MGST) [
21] is designed with different window width factors in different frequency ranges to enhance the performance for complex PQD signals analysis. Although the demand of feature extraction of complex disturbance signals is satisfied, the redundant computation is still in existence.
In the pattern recognition of PQD, probabilistic neural network (PNN) [
24,
25], extreme learning machine (ELM) [
26], support vector machine (SVM) [
27,
28,
29], and decision tree (DT) [
19,
30,
31,
32,
33] have been applied for PQD recognition and achieved good classification results. Compared with other classifiers, the DT has a simple structure, high classification efficiency, and accuracy. It is suitable for real applications with high real-time requirements. Meanwhile, it is convenient to achieve in a low-cost embedded system, and can satisfy the demands of efficiency, accuracy, and cost of PQ big data analysis [
19,
30,
31,
32,
33]. However, the effects of DT depend on the determination of feature selection and classification threshold. For one thing, the existing DT classifiers are used to determine the features and classification thresholds based on statistical experiments, which makes it easier to fall into overfitting. Moreover, the DT methods used in the PQD analysis area are not optimal or automatic. All of these limitations affect the classification performance of DT classifier. For another, due to the interference of noise signals, the optimal threshold of each node of DT is changed greatly. So, it is difficult to design a DT classification system that can meet the classification accuracy requirements under different levels of noise.
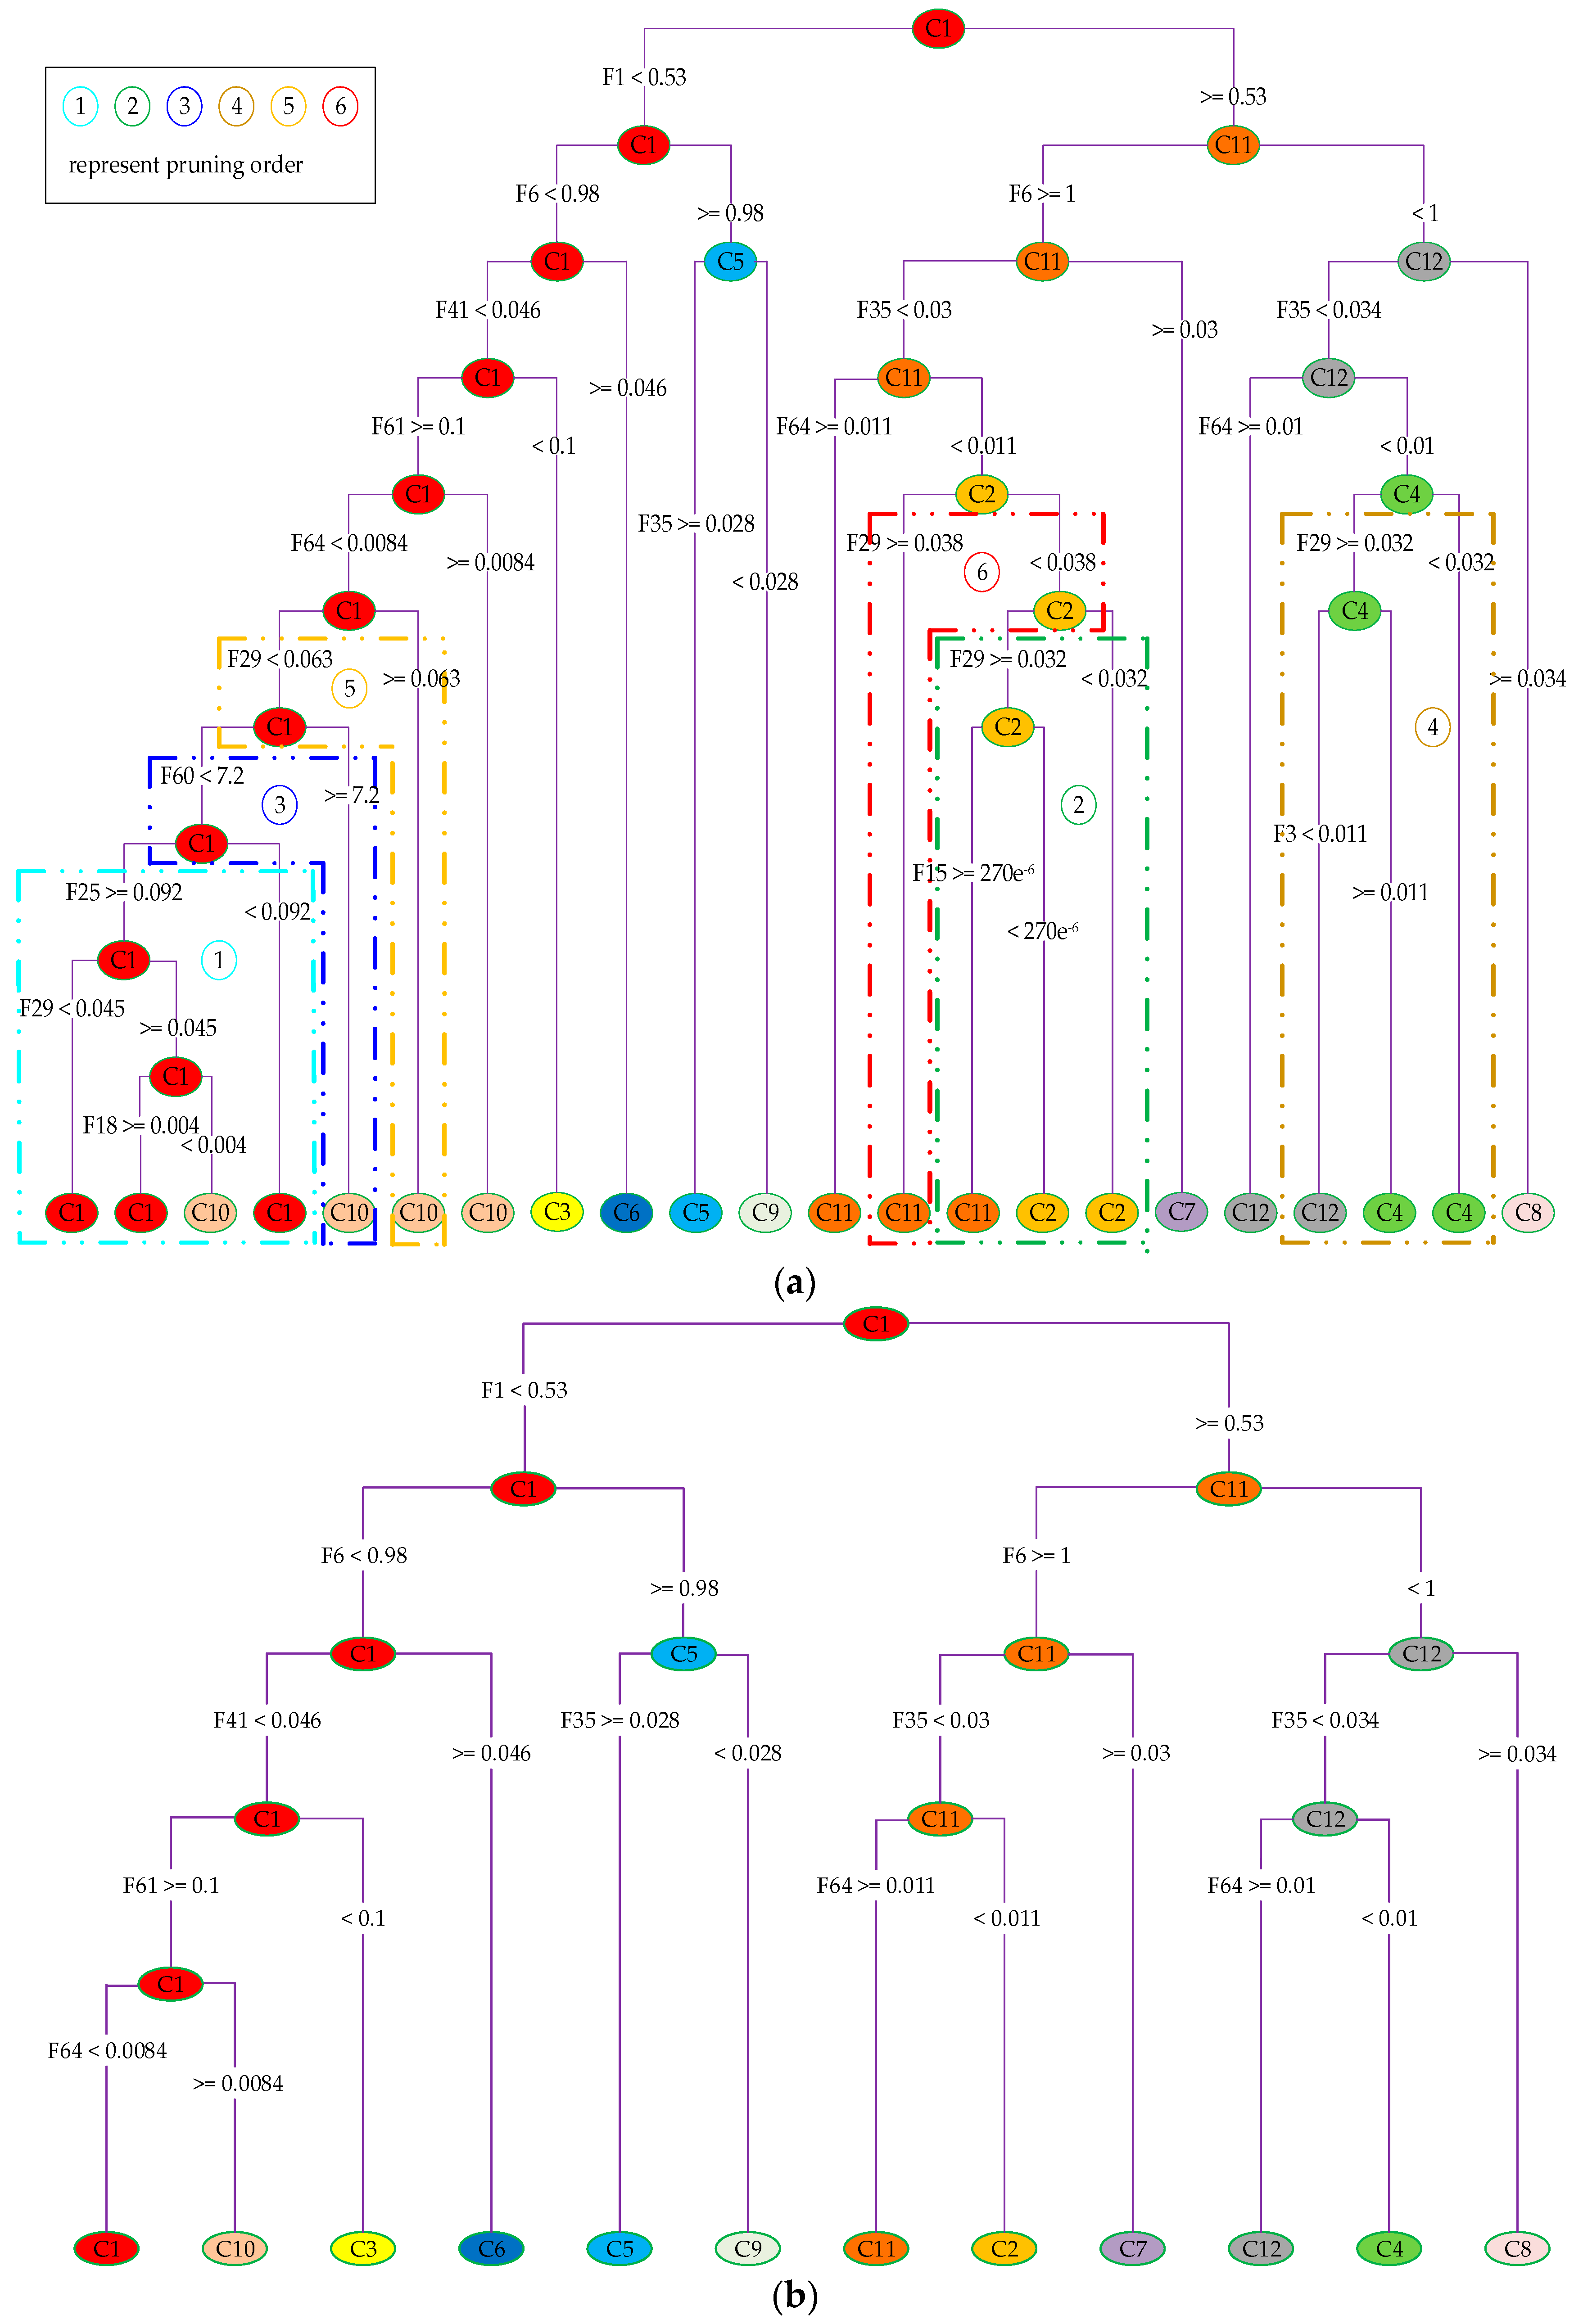
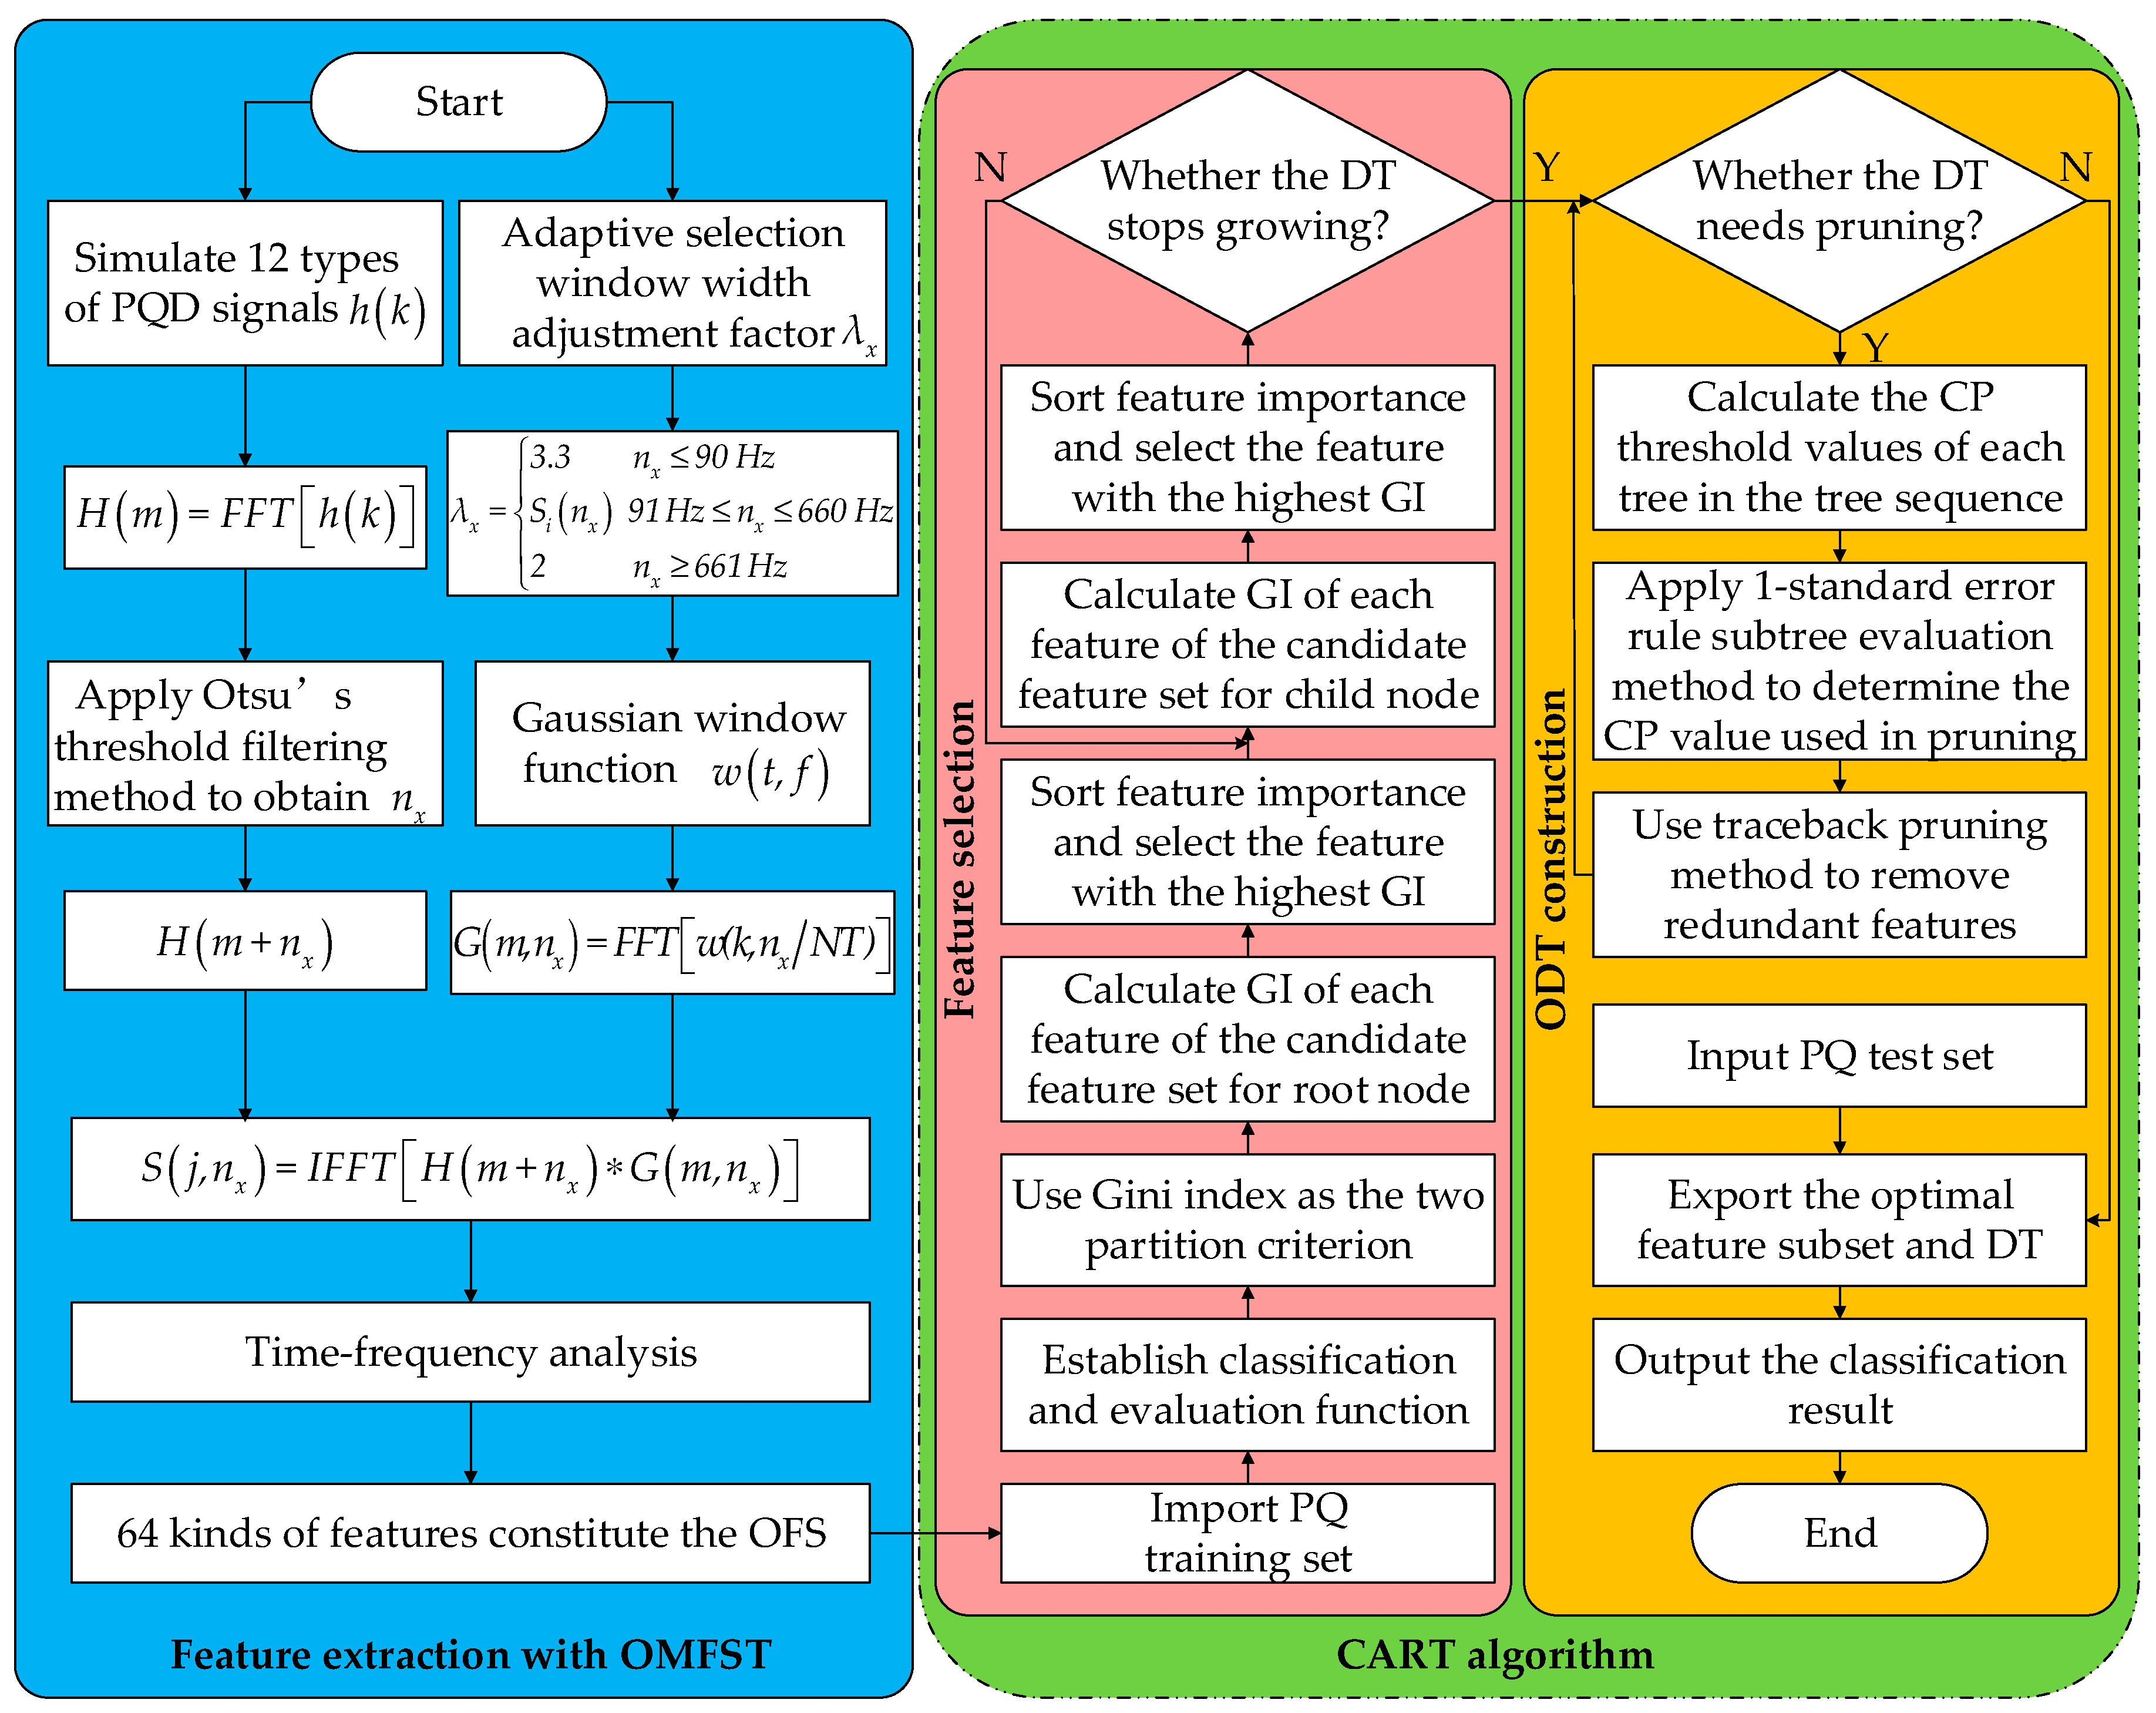
In order to solve the limitations, a novel PQD feature selection and optimal decision tree (ODT) construction method using optimal multi-resolution fast S-transform (OMFST) and classification and regression tree (CART) algorithm is proposed in this paper. Firstly 12 kinds of PQD signals including six kinds of complex disturbances are simulated by a mathematical model. Subsequently, the disturbance signals are processed by OMFST, and 67 kinds of commonly used PQ features are extracted from the result of OMFST to constitute the original feature set (OFS). Then, a CART algorithm is used to construct the DT and analyze the Gini index of the classification features of each node. On this basis, embedded feature selection is carried out to reduce the feature dimension. Finally, subtree evaluation methods based on one standard error (1-SE) rule of the cross-validation evaluation are applied to determine the complexity parameter (CP) value, which is used for cost complexity pruning (CCP). After that, the ODT can be constructed automatically. Through simulations, the robustness and effectiveness of the new method was validated.
4. Optimal Feature Selection and Automatic DT Construction by CART Algorithm
DT is an excellent classifier with high classification efficiency and is simple to realize. However, when the existing DT methods are applied to the PQD recognition, the features and classification thresholds of each node used in DT are generally based on the researcher’s empirical or statistical conclusions. Hence, DT has limitations compared to the feature selection and ODT construction methods. CART is an effective binary recursive partitioning algorithm that can automatically construct the ODT and complete feature selection according to the classification effect of the features at each node. Thereby, the feature computation is reduced, the structure of the classifier is simplified, and the classification efficiency and accuracy are improved [
38,
39,
40]. The processing of the CART algorithm is described as follows (F indicates the current PQ sample set, and F_attributelist represents the current candidate feature set):
- (a)
Establish the root node N, and allocate the class that to be divided for this node.
- (b)
If F belongs to the same class or just one sample remains, then return N as the leaf node.
- (c)
Carry out feature selection for the features of each F attributelist. By dividing the branches and calculating the Gini importance (GI) and sorting, the feature with the highest GI will be selected.
- (d)
According to the selected features, F is divided into two subsets, F1 and F2. Afterwards, the DT is obtained with the recursive construction.
- (e)
Prune DT using CCP method. After pruning, ODT is acquired automatically.
As in the above description, the CART algorithm mainly embraces two parts: feature selection and ODT construction.
4.1. Embedded Feature Selection Based on GI
CART uses the Gini index as the binary partition criterion for the partition attribute selection [
38,
39]. In the process of DT training and growing, the classification and evaluation function is established. When the nodes are split with different features, the classification effects can be evaluated by using the impurity (Gini index) of the child node after binary branching. Subsequently, feature selection can be implemented by computing the GI of features and sorting them by their classification capability. From this, the CART algorithm can be used to obtain the generation process of ODT, which is the process of feature selection.
Assume node
is composed of a set
that contains
samples and
classes of
.
denotes the correct number in the subset after classification through a feature. The optimal classification method should satisfy the rule of minimum impurity of subset and false recognition. Accordingly, the impurity function is designed as:
In this equation, expresses the probability that a sample belongs to class in dataset .
When a disturbance feature
is used to split the node, the dataset
can be divided into
subsets, described as
. Then the excellent and inferior degree of the branch (impurity reduction) function is given as
According to Equation (5), the Gini index is used as the standard measure of the node impurity. Thereafter, the original Gini index for dataset
D is defined as
where
. When the dataset
comprises only one class, its Gini index is zero; when all the sample classes are evenly distributed in
, the maximum value of the Gini index is taken.
When CART uses a disturbance feature
to split the node, the dataset
can be divided into two subsets,
and
. Afterwards, the Gini index of this feature is expressed as
According to Equation (6), the Gini impurity reduction (GI) of
can be acquired as
Eventually, the GI of each feature can be calculated by the above equations. The higher the GI value of the feature, the greater the role of the classification process. On the basis of this theory, the features with higher GI value are chosen as the segmentation features. If the GI value is 0, it means that the feature does not play a role in the process of the classification, which can be removed from the OFS. Consequently, the last remaining features can be used to constitute the optimal feature subset.
4.2. Automatic ODT Construction via CCP Pruning
The generation of an optimal classification tree based on the CART algorithm firstly adopts the divide-and-conquer stop threshold method with the order of top-down, which essentially belongs to the greedy algorithm. Thereafter, the post-pruning method based on CCP is used to make the relative error of cross-validation and the node number of DT as small as possible to determine the CP. With these CP values as the threshold, pruning is carried out in order. This can simplify the process of classifier design while effectively maintaining recognition accuracy [
38,
40].
From the foregoing, in order to generate ODT, pruning is required to reduce the complexity of DT. Therefore, pruning is an important step in constructing ODT with a CART algorithm [
38,
40].
4.2.1. Calculate the CP Thresholds of Each Tree in the Tree Sequence
In order to obtain the corresponding CP threshold values of each tree in the tree sequence, the complexity of the DT needs to be evaluated. The cost complexity function is defined as
where
denotes the CP of tree
,
represents the misclassification cost of tree
,
expresses a variable of CP value, and
indicates the number of leaf nodes of DT.
The independent variable of function
can be a tree or a node. Define the node as its independent variable:
Make
gradually increase from zero until there is a node meeting the constraint of
, that is, the node corresponding to the min threshold
. Then the subtree
can be obtained by pruning (
represents the tree without pruning, namely the maximum tree, named
). On this basis, increase the value of
, and repeat the pruning process until only one root node remains. Thereby, the subtree sequence
can be acquired, where
denotes the subtree number. When Equations (10) and (11) are equal, each pruning threshold is available in the tree sequence, which is
where
is the misclassification cost of node
after pruning subtree
, and
is the misclassification cost of subtree
without pruning.
4.2.2. Determine the Pruning CP Thresholds Based on Subtree Estimation
After obtaining the tree sequence and the pruning thresholds of each tree, the subtree estimate approach can be applied to determine the CP values used in the pruning process to construct the ODT with the classification error and the node number as small as possible.
In the process of subtree evaluation, the cross-validation estimate function is used to evaluate the DT classification error, which is defined as
In this equation, is the misclassification cost of cross-validation of , is the cost that is divided into by mistake, is the number of training samples, and represents the number of misclassification samples.
According to the cross-validation method, the training set
is divided into
subsets
at first, then
subtrees are generated from
. Let
; the true error of
is measured by the mean value of
:
Through cycled cross-validation, the subtree with the minimum value of cost complexity can be determined. Hence, its minimum result of cross-validated relative error is
On this foundation, the 1-SE rule function is constructed to obtain the acceptable increasing threshold with respect to the minimum error, as presented in Equation (16):
In this formula, indicates the number of training samples of validation.
With Equations (15) and (16), to determine the optimal subtree, cross-validated relative error should satisfy the constraints as follows:
By the above theory, the CP values of this rule can be ultimately determined. On this basis, ODT can be automatically constructed by pruning. The construction process of ODT is as follows:
- (a)
Ensure that the node number of DT and the cross-validated relative error achieve balance, that is, the cross-validated relative error is within the scope of Equation (17).
- (b)
After satisfying the above constrains, the trees with the minimum number are selected from the subtree sequences.
- (c)
With the CP values of these trees as the threshold, pruning is carried out in order. ODT can be obtained in this way.


