Whole Transcription Profile of Responders to Anti-TNF Drugs in Pediatric Inflammatory Bowel Disease


 , , , , ,
  ,
,  add
Show full author list
add
Show full author list
Abstract
:1. Introduction
2. Materials and Methods
2.1. Patient Samples
2.2. Ethics Statement
2.3. Extraction of Total RNA from Whole Blood
2.4. RNA Sequencing
2.5. Quantitative Reverse Transcription-Polymerase Chain Reaction (qRT-PCR)
2.6. Statistical Analysis
3. Results
3.1. Patients’ Characteristics
3.2. Differential Gene Expression Using RNAseq in the Response of Anti-TNF Agents Prior to Starting Treatment
3.3. Differential Gene Expression in Response to Anti-TNF Agents at Week 2 Post-Treatment
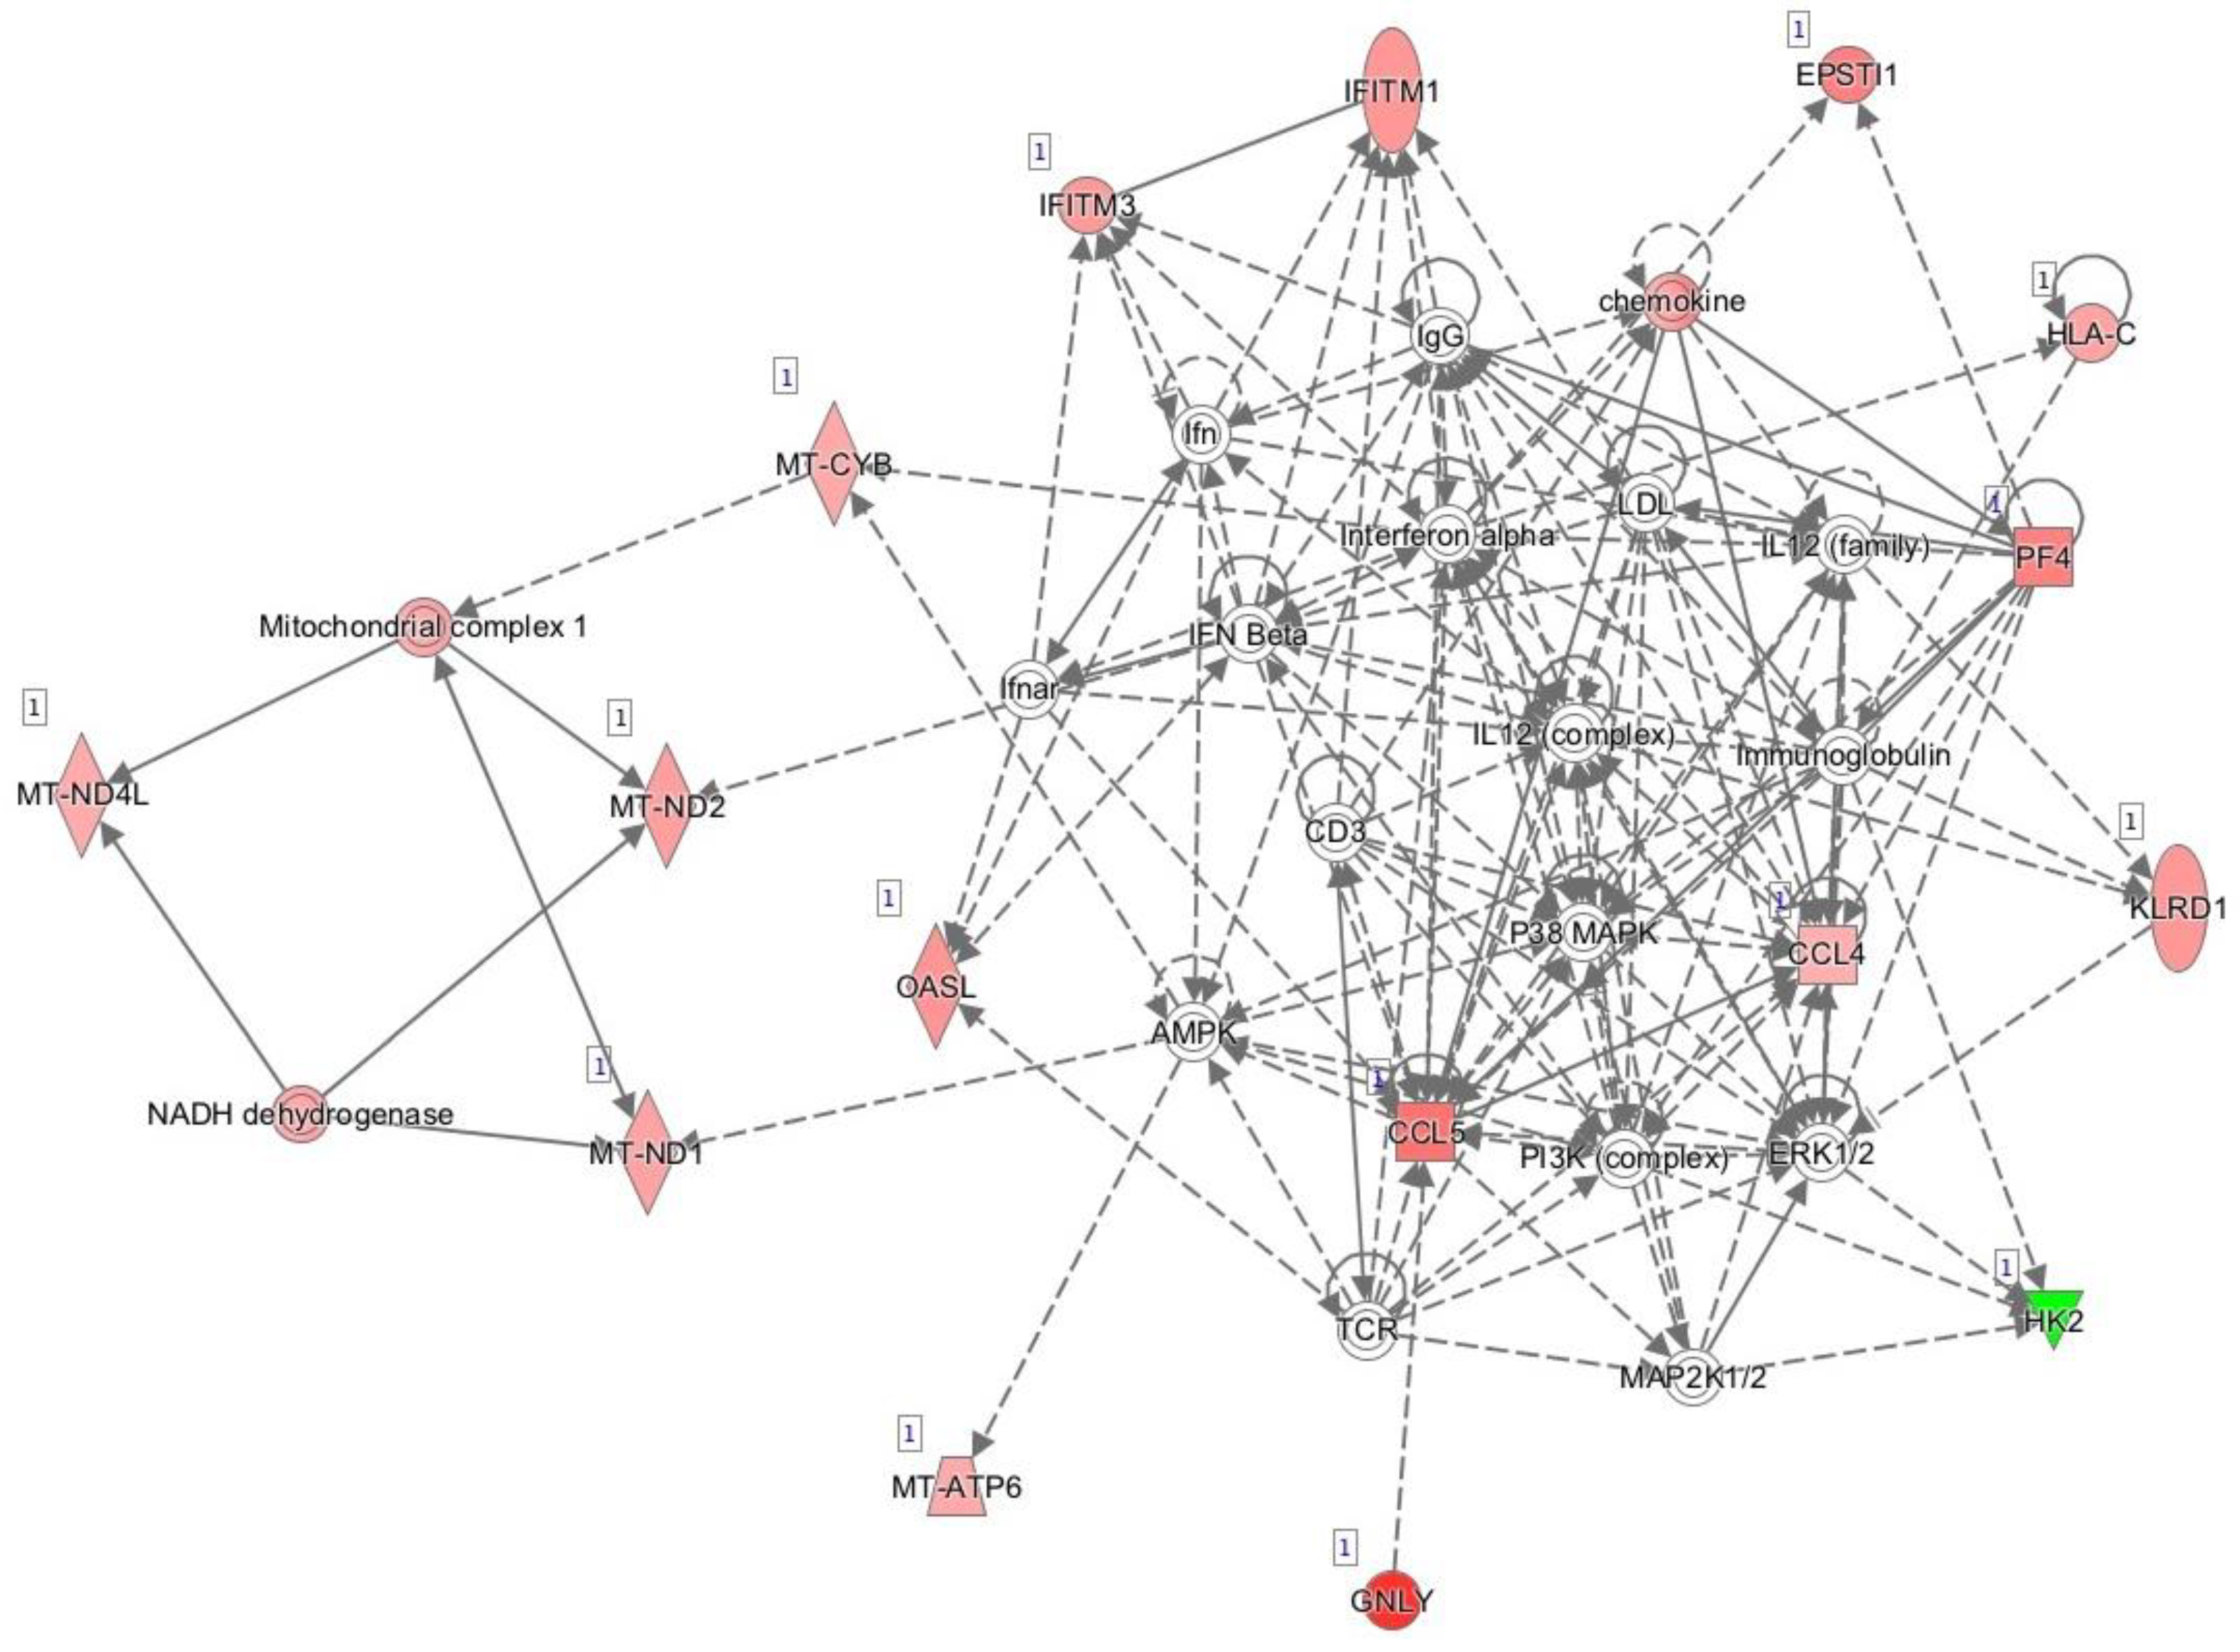
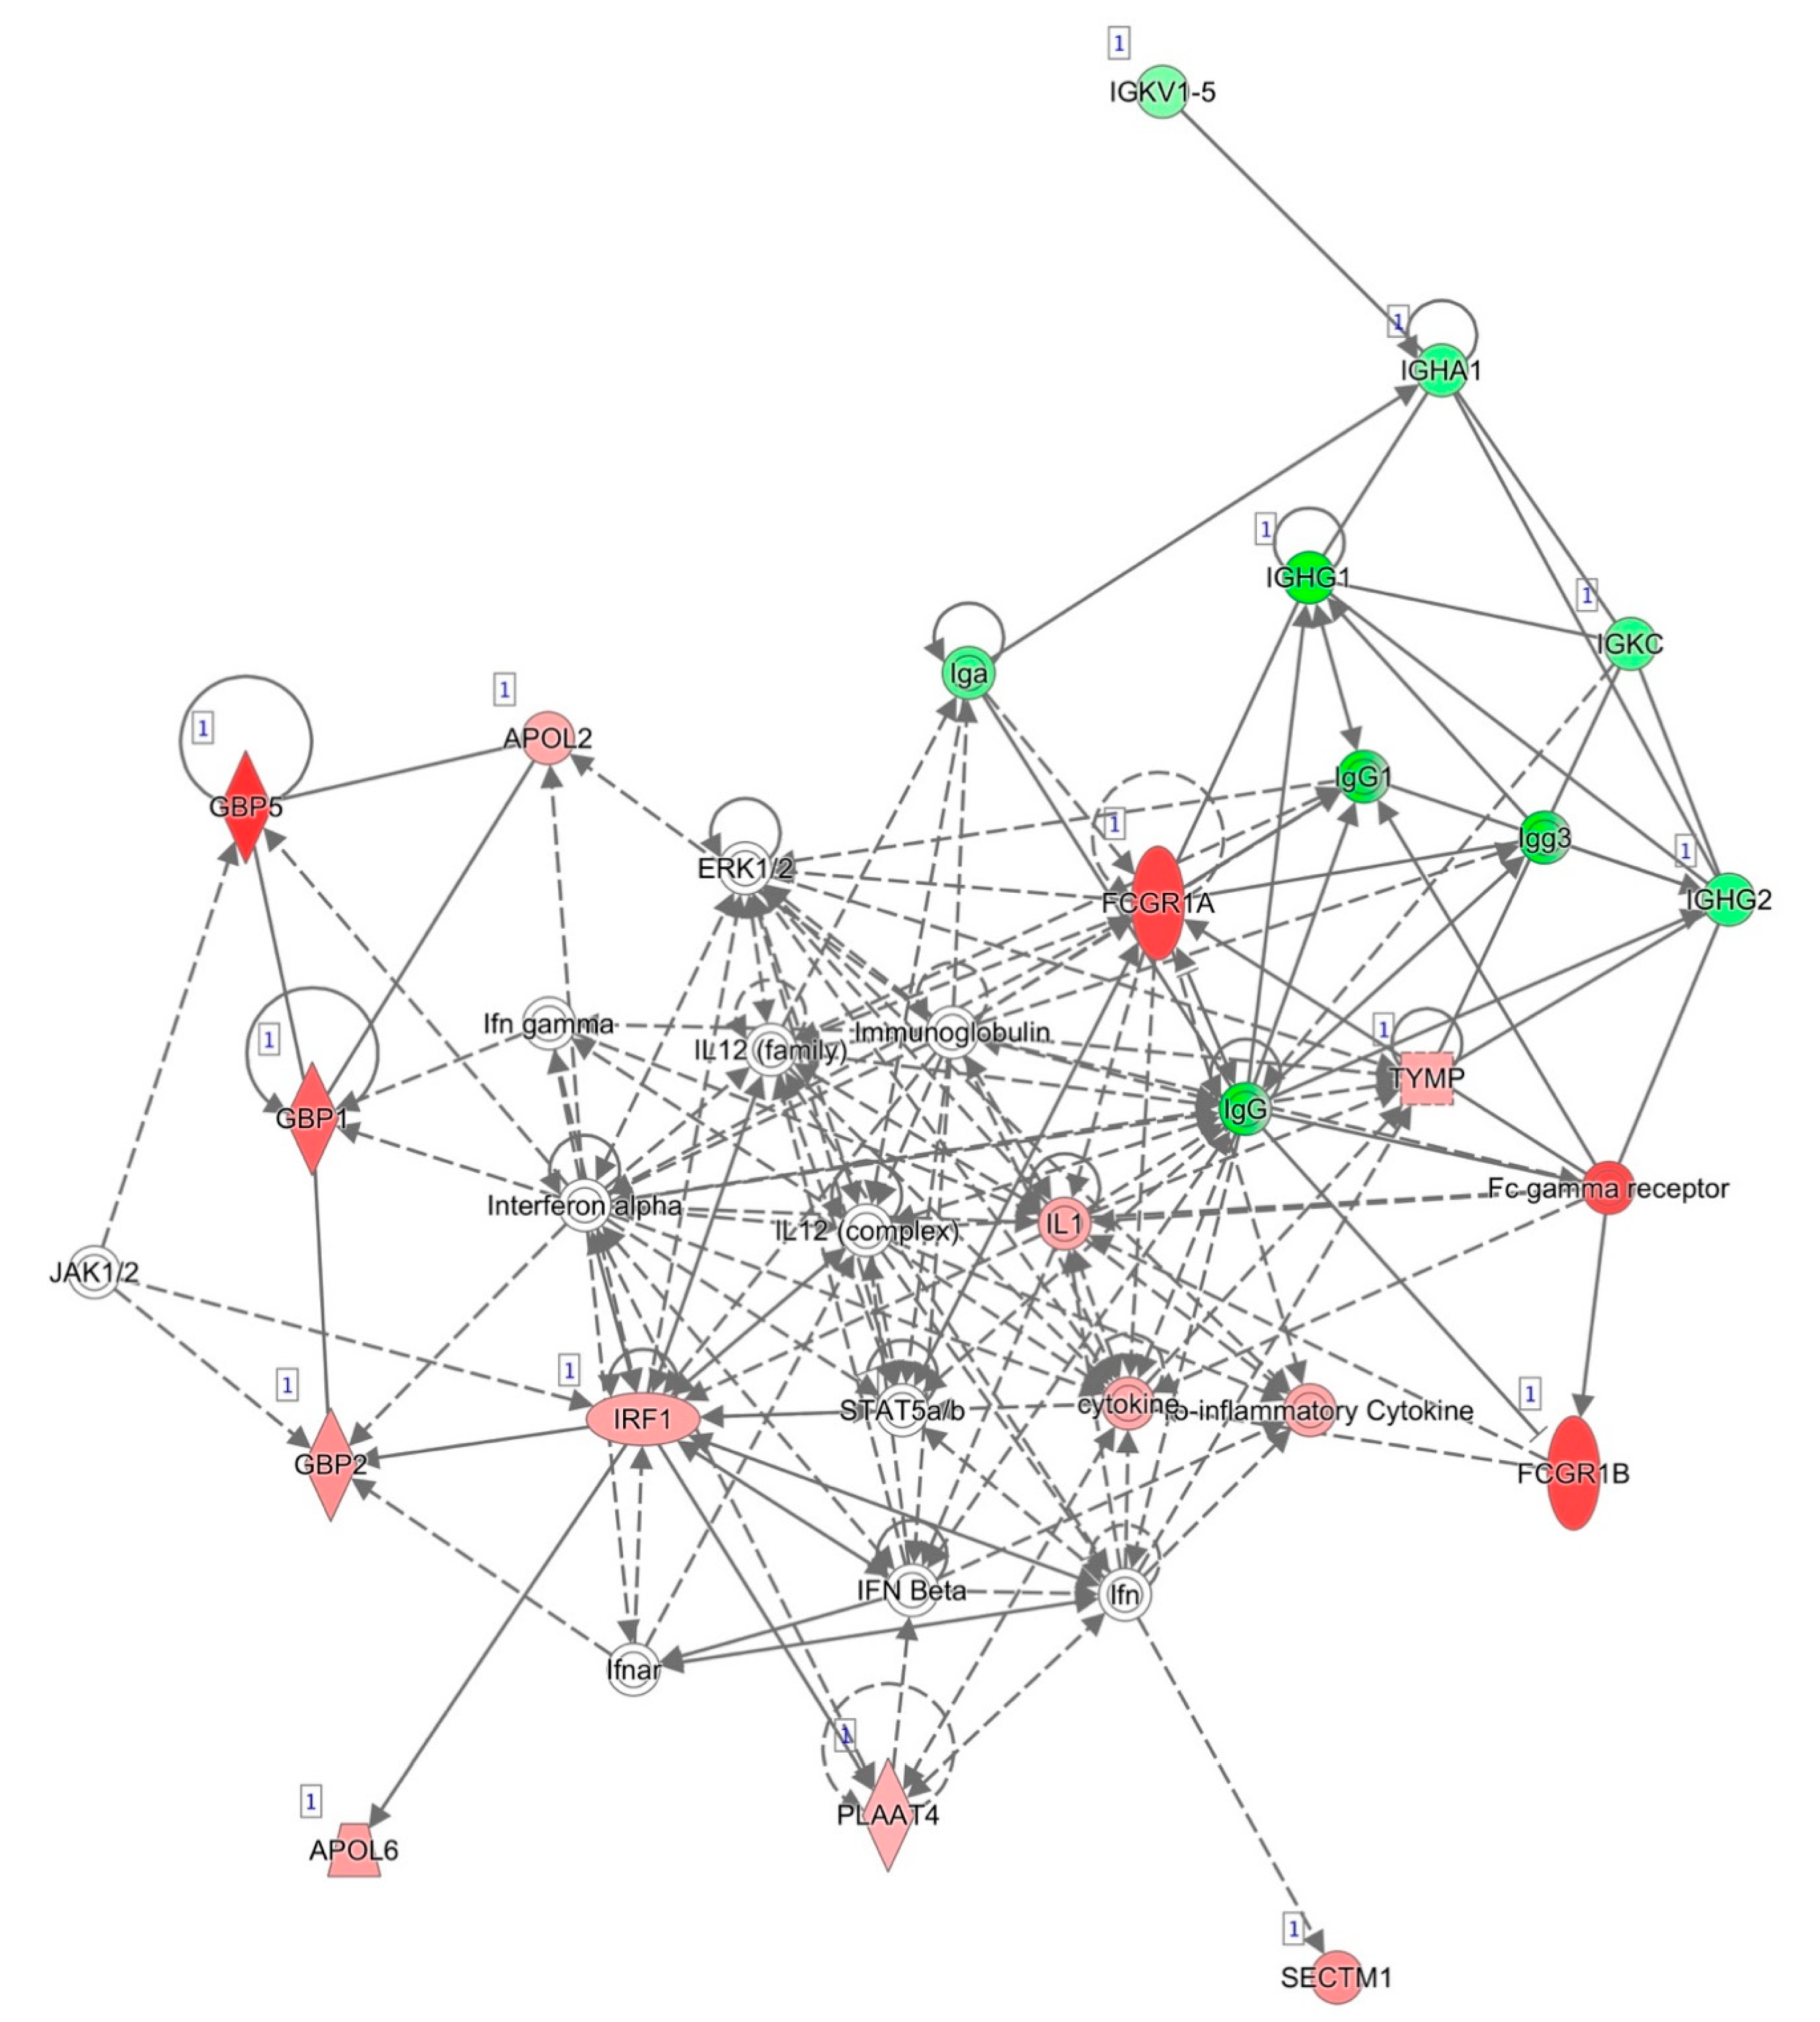
3.4. Functional in Silico Analysis
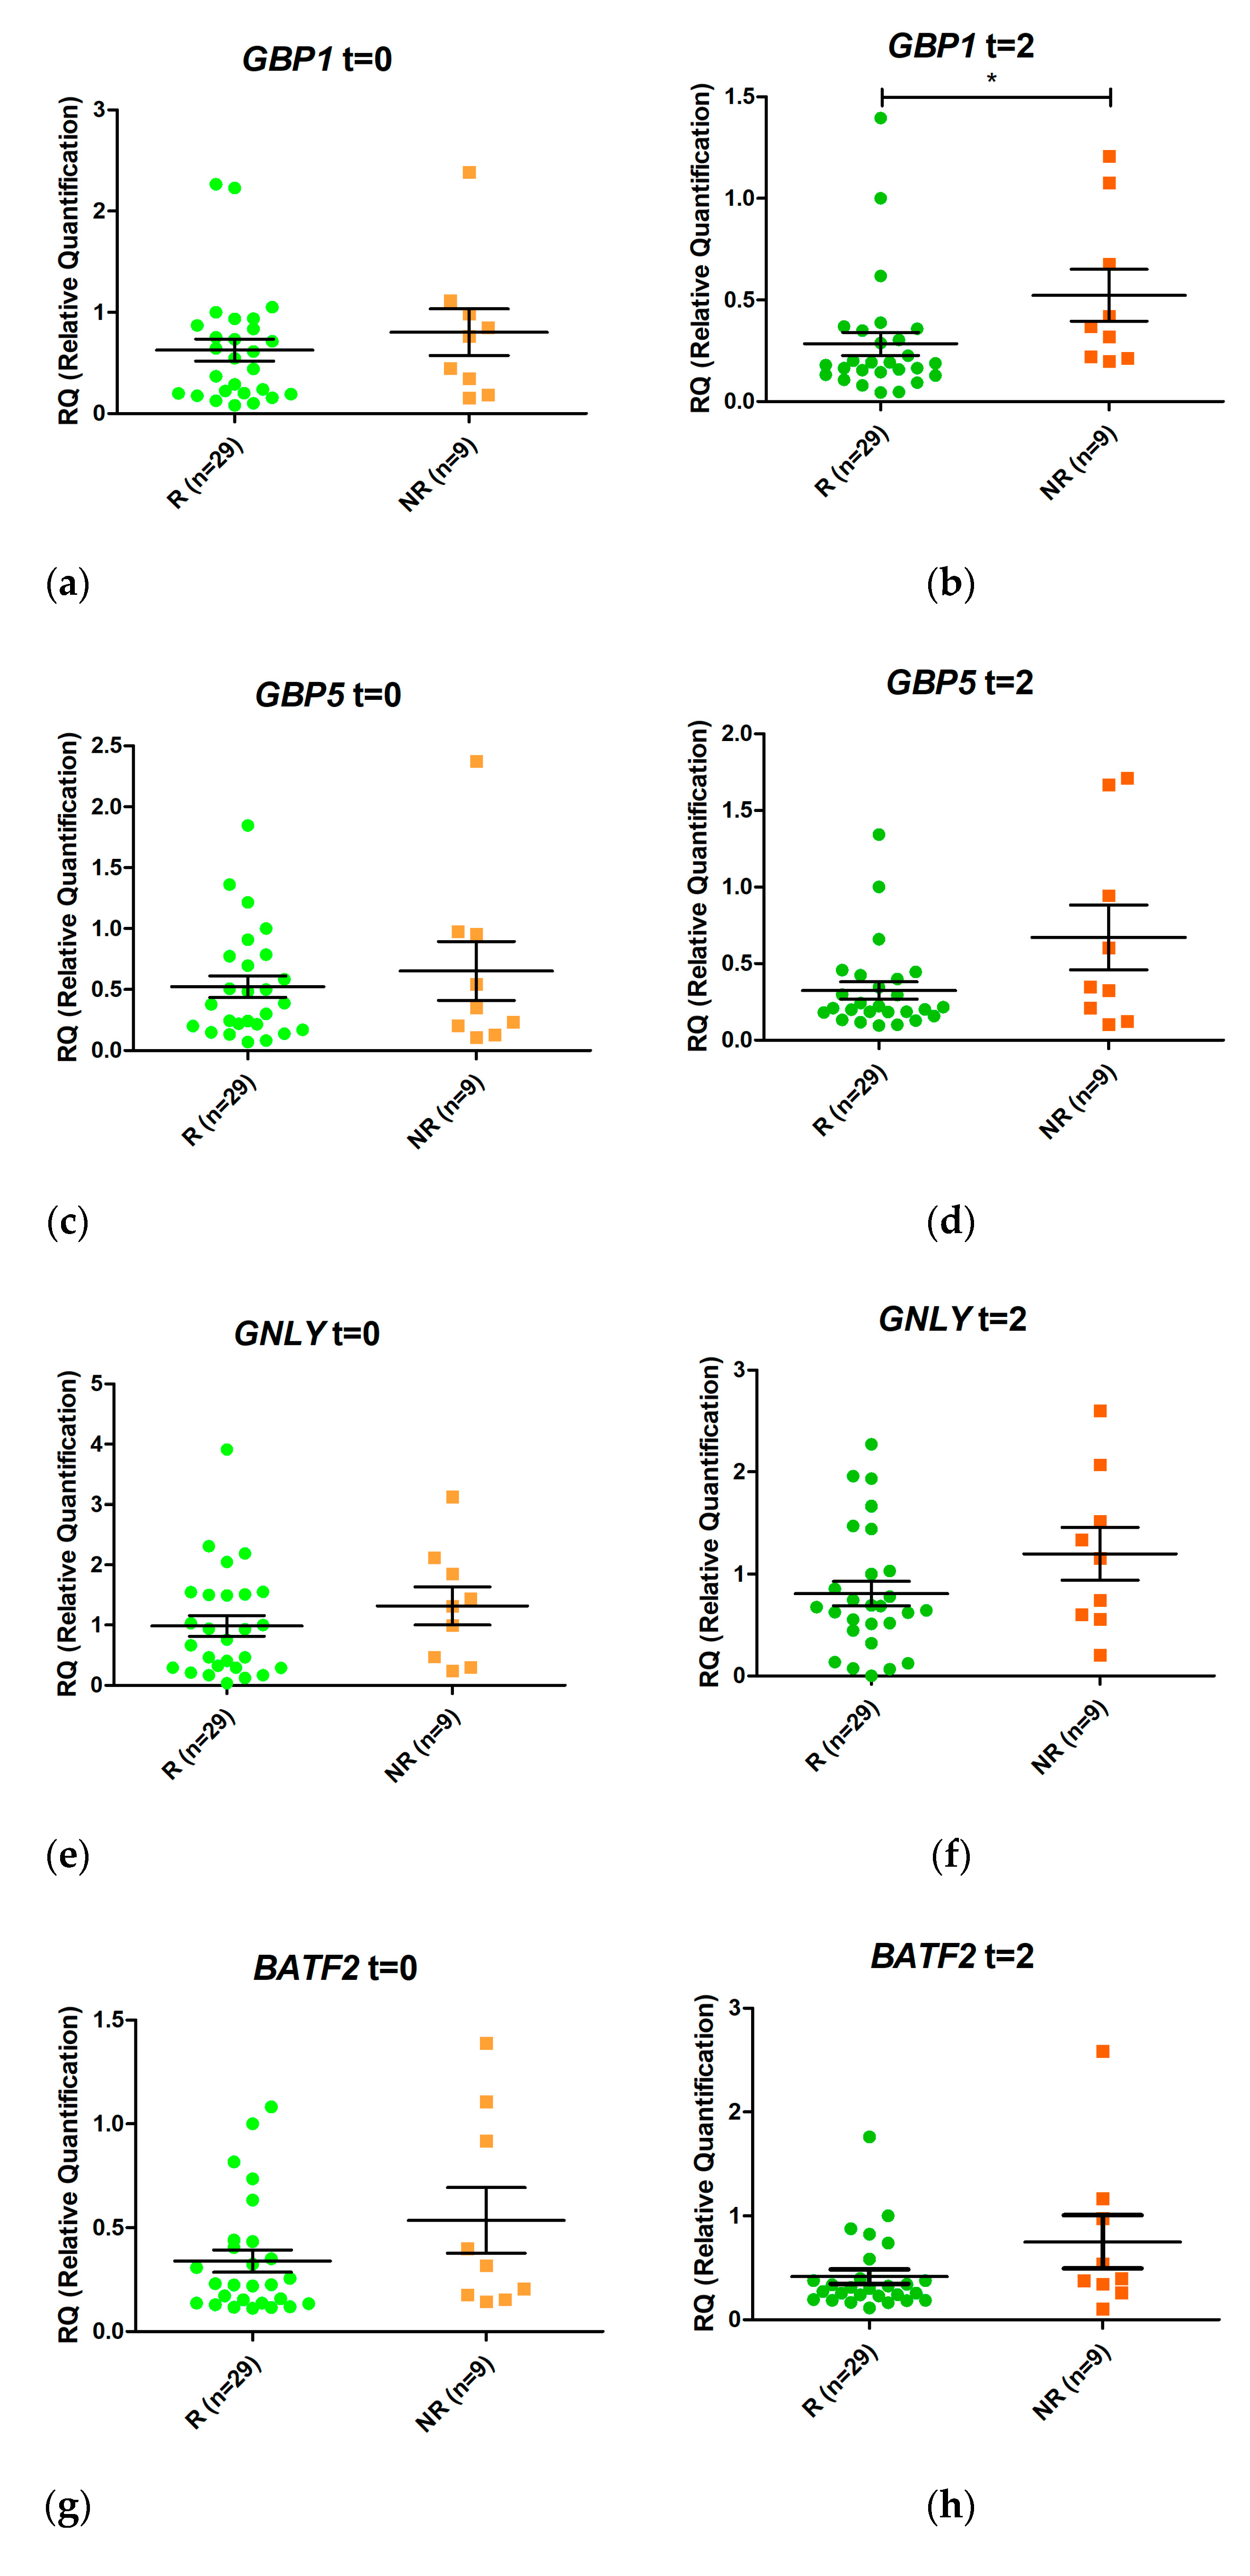
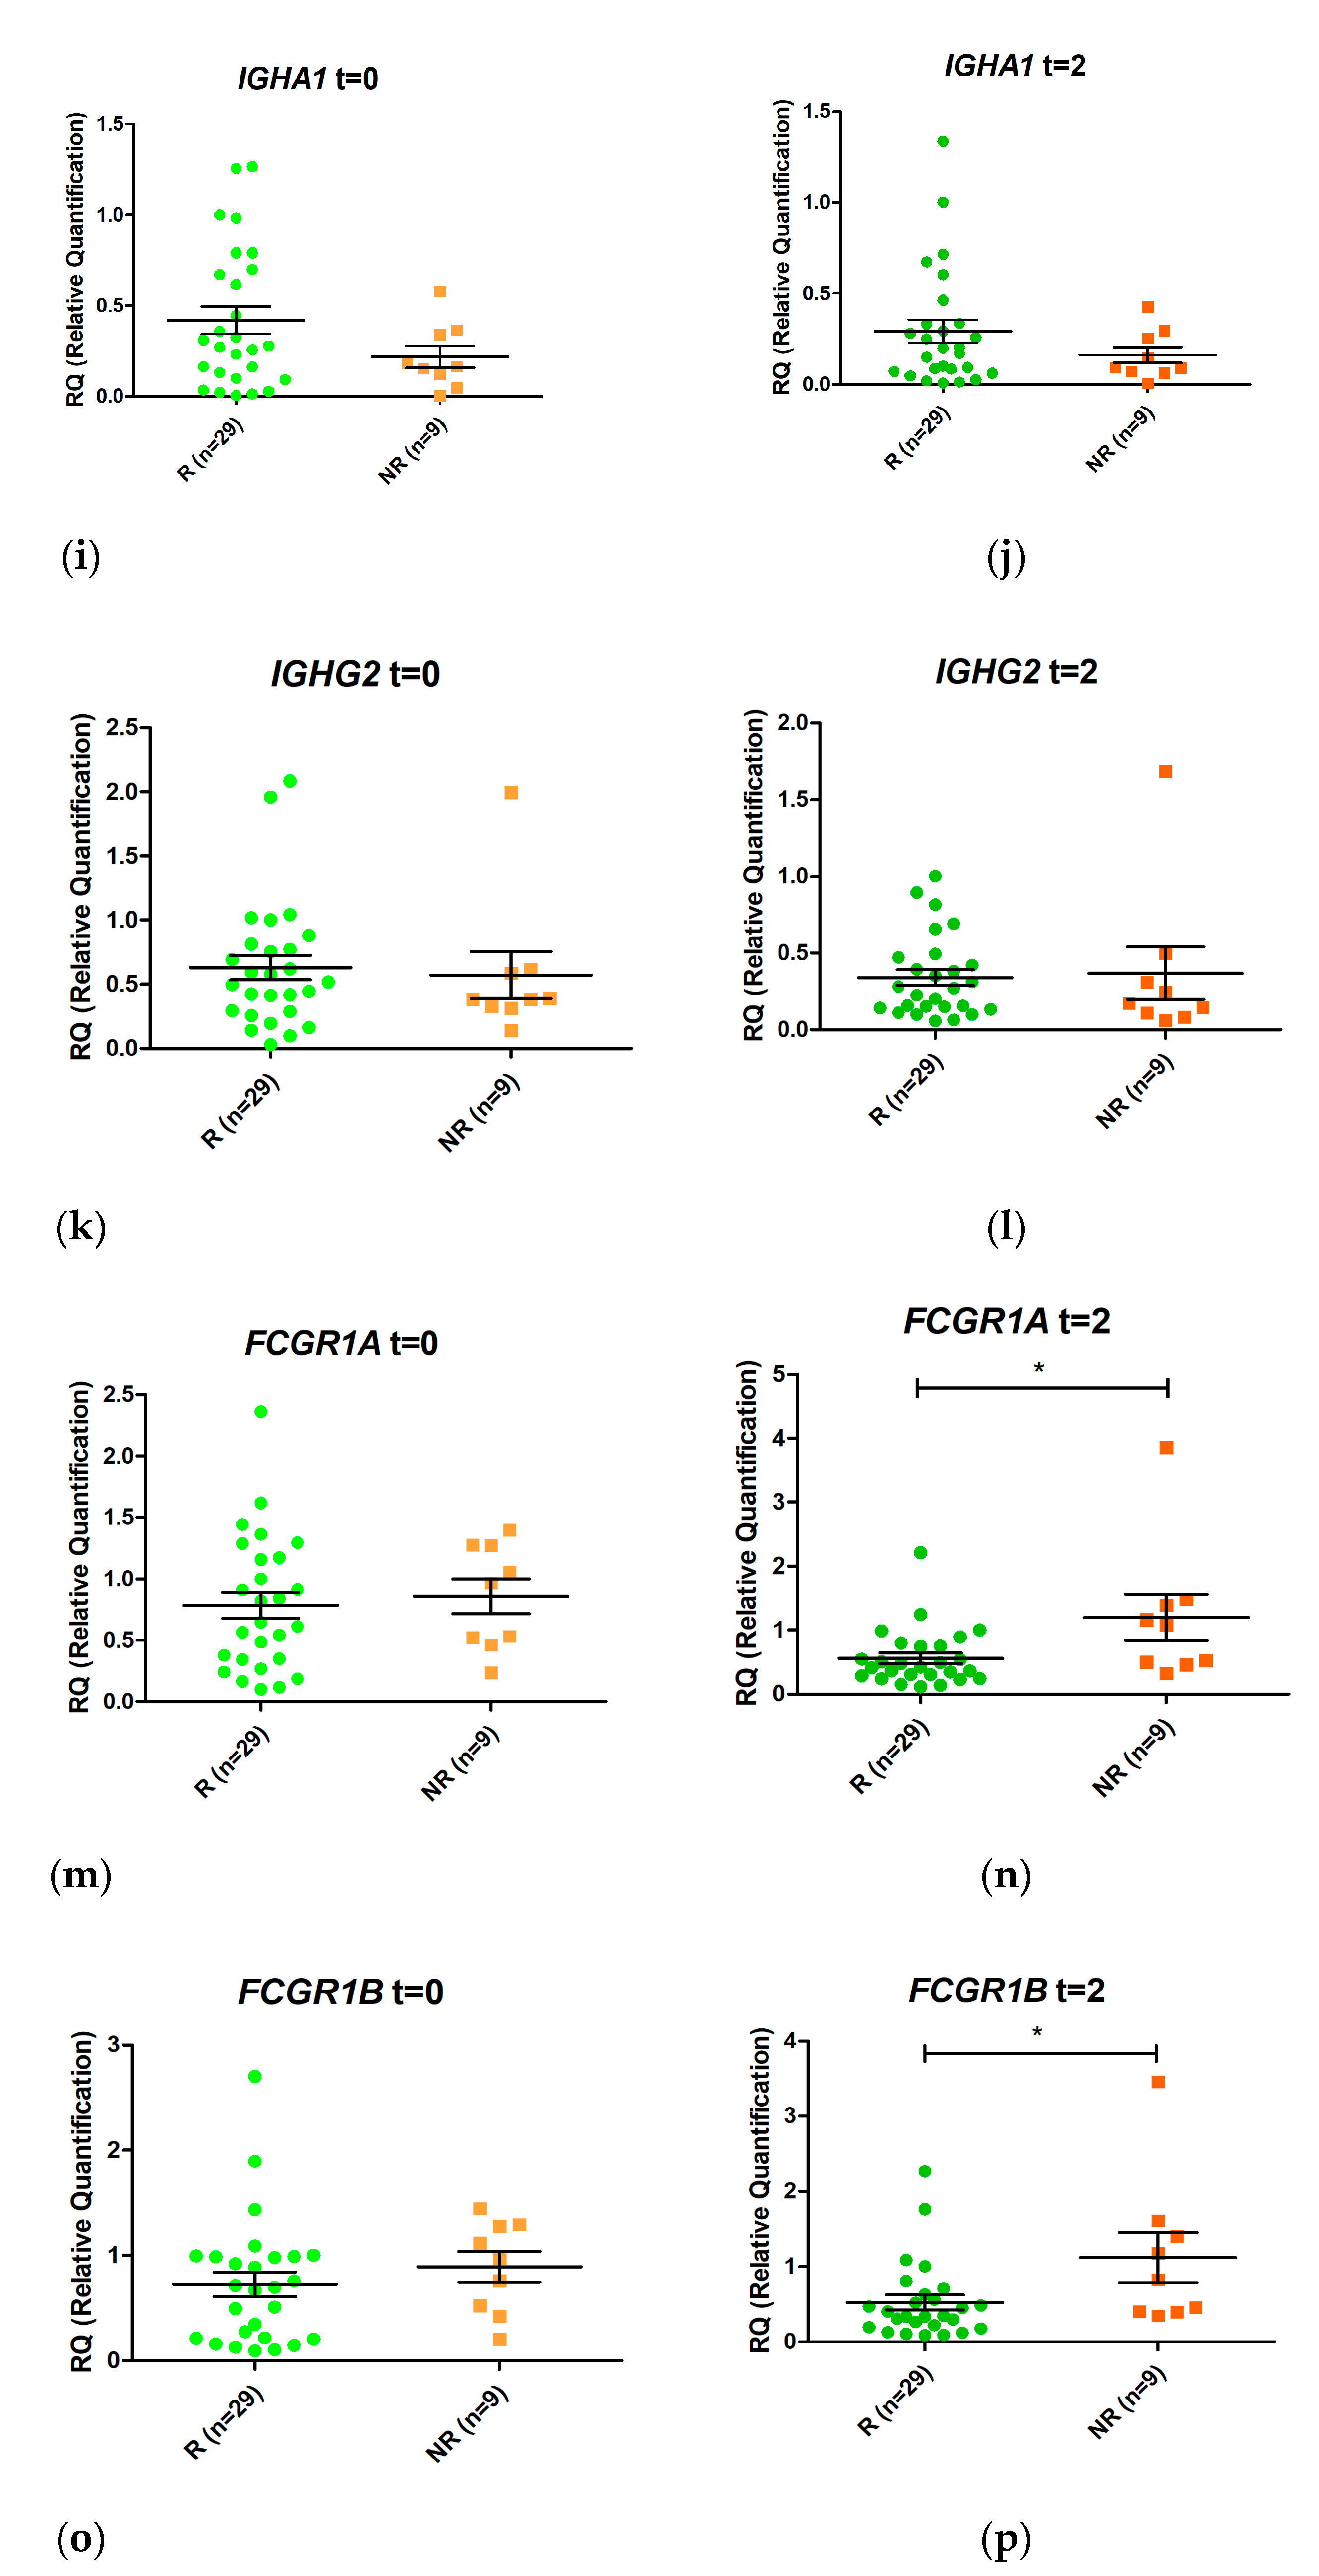
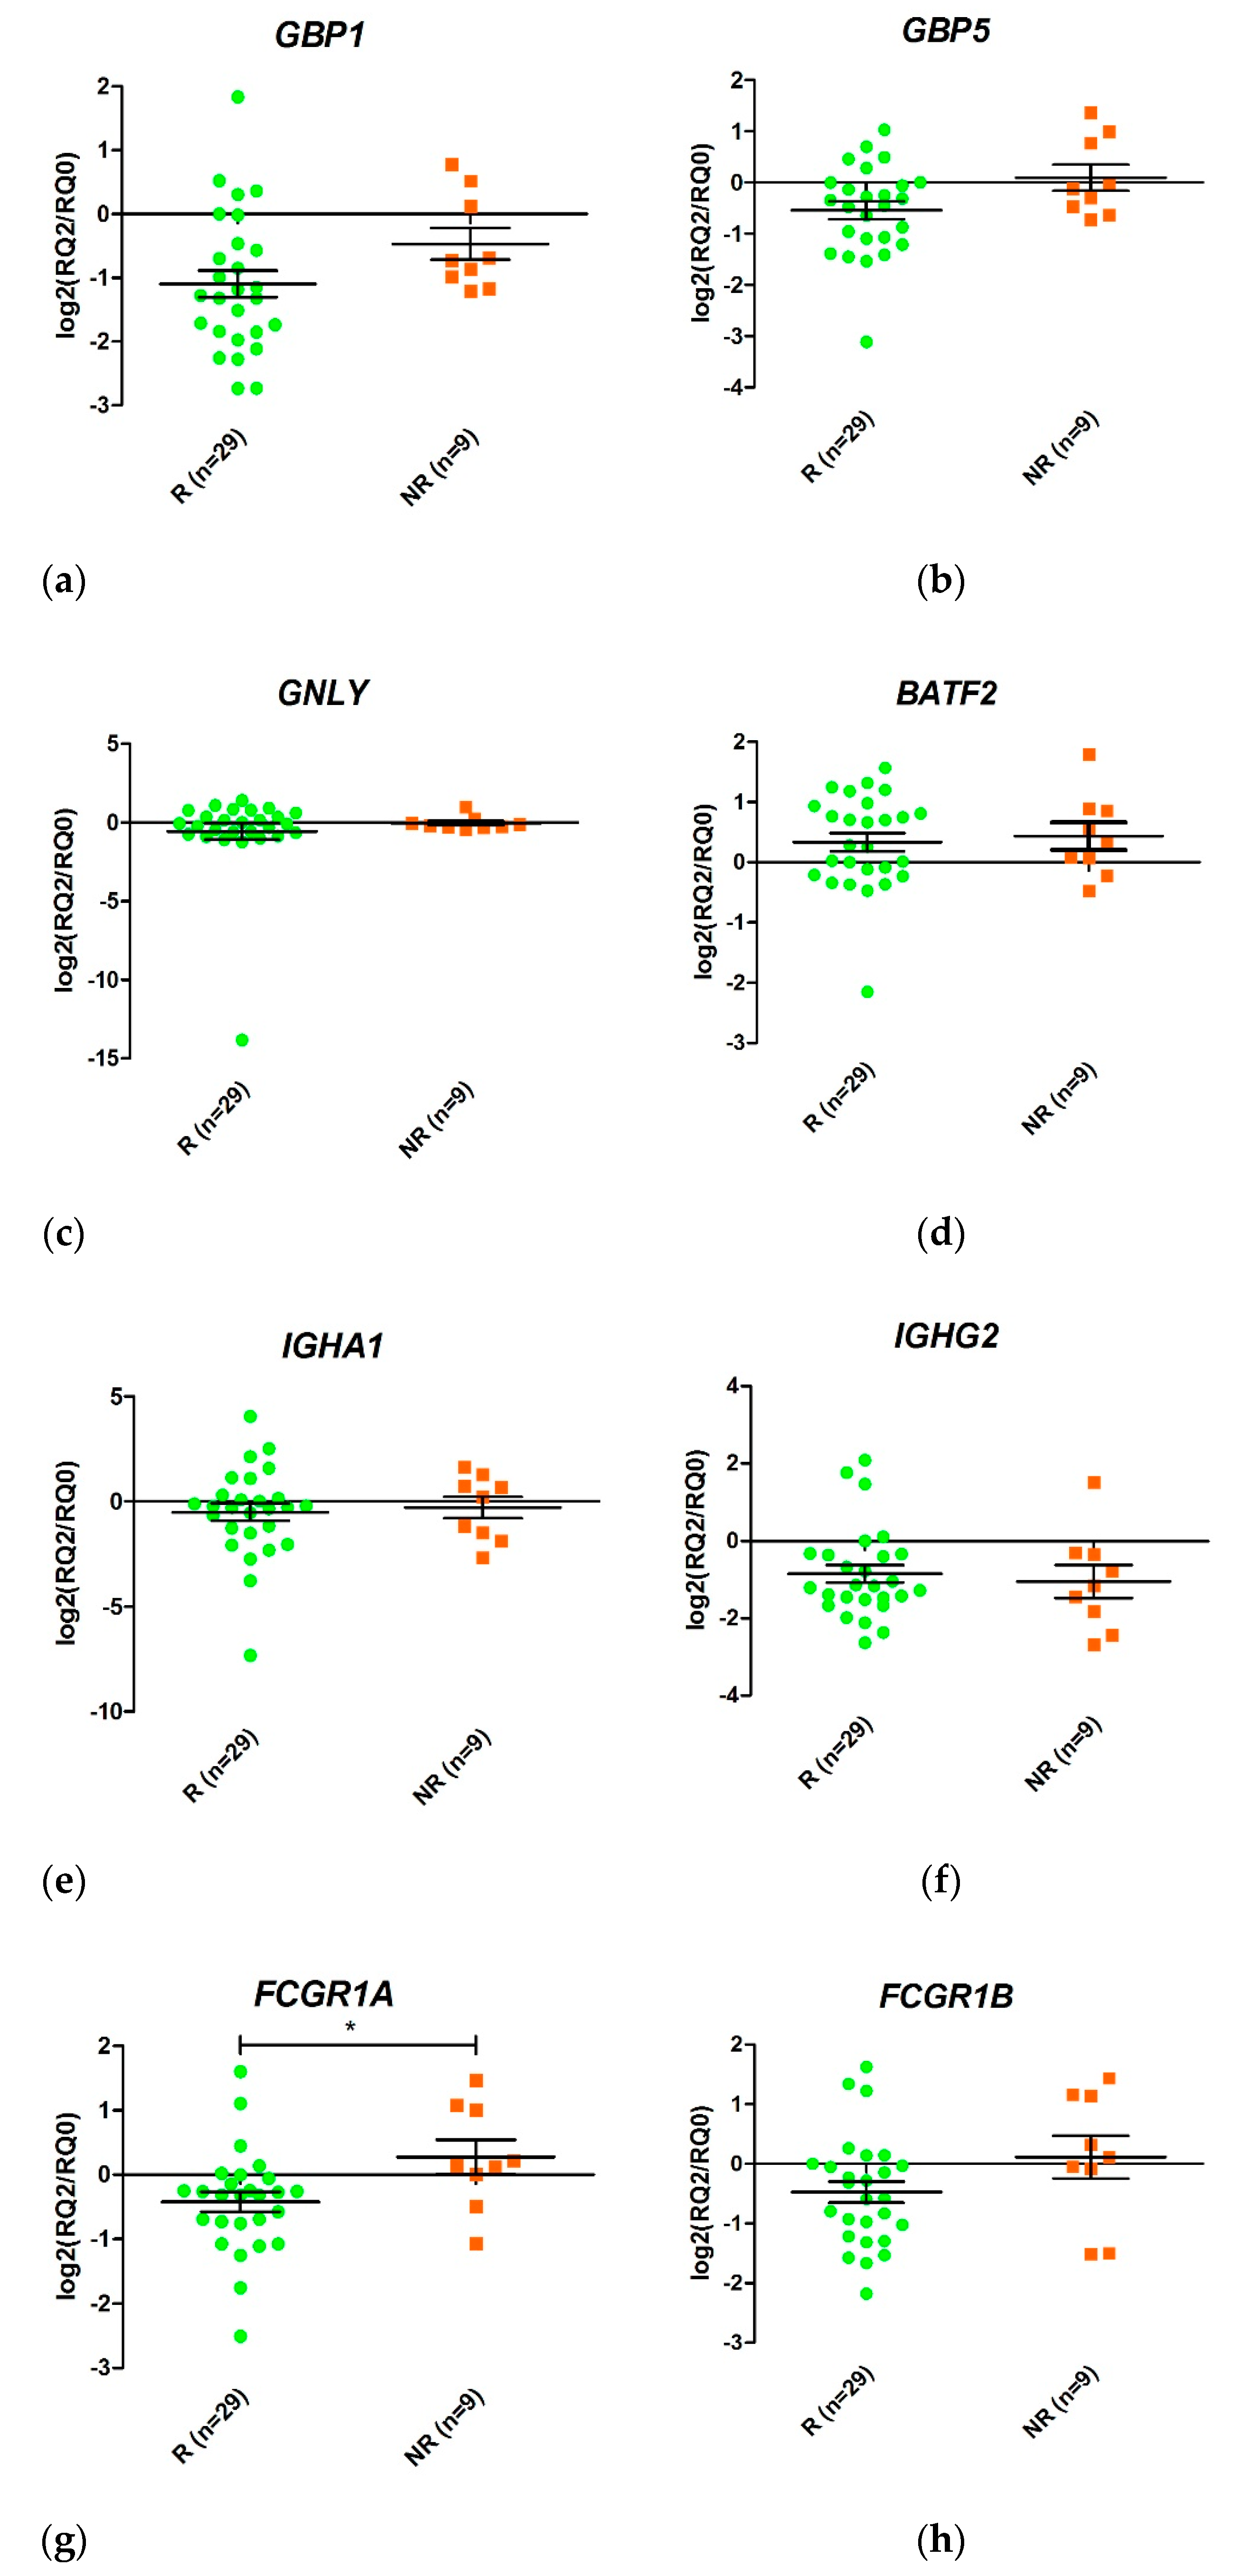
3.5. Validation of Differentially Expressed Genes by qRT-PCR
3.6. Prediction of Response to Anti-TNF Therapy Based on Expression of GBP1, FCGR1A, and FCGR1B after Two Weeks of Treatment
3.7. Differences in Gene Expression between Responders and Non-Responders during the First Two Weeks of Anti-TNF Therapy
4. Discussion
5. Conclusions
Supplementary Materials
Author Contributions
Funding
Institutional Review Board Statement
Informed Consent Statement
Data Availability Statement
Acknowledgments
Conflicts of Interest
References
- Gu, P.; Feagins, L.A. Dining with Inflammatory Bowel Disease: A Review of the Literature on Diet in the Pathogenesis and Management of IBD. Inflamm. Bowel Dis. 2019. [Google Scholar] [CrossRef] [PubMed] [Green Version]
- Kuhnen, A. Genetic and Environmental Considerations for Inflammatory Bowel Disease. Surg. Clin. N. Am. 2019, 99, 1197–1207. [Google Scholar] [CrossRef] [PubMed]
- Sawczenko, A.; Sandhu, B.K. Presenting features of inflammatory bowel disease in Great Britain and Ireland. Arch. Dis. Child. 2003, 88, 995–1000. [Google Scholar] [CrossRef] [PubMed] [Green Version]
- Henderson, P.; van Limbergen, J.E.; Wilson, D.C.; Satsangi, J.; Russell, R.K. Genetics of childhood-onset inflammatory bowel disease. Inflamm. Bowel Dis. 2011, 17, 346–361. [Google Scholar] [CrossRef]
- Hyams, J.; Crandall, W.; Kugathasan, S.; Griffiths, A.; Olson, A.; Johanns, J.; Liu, G.; Travers, S.; Heuschkel, R.; Markowitz, J.; et al. Reach Study Group Induction and Maintenance Infliximab Therapy for the Treatment of Moderate-to-Severe Crohn’s Disease in Children. Gastroenterology 2007, 132, 863–873. [Google Scholar] [CrossRef]
- Hendy, P.; Hart, A.; Irving, P. Anti-TNF drug and antidrug antibody level monitoring in IBD: A practical guide. Frontline Gastroenterol. 2016, 7, 122–128. [Google Scholar] [CrossRef]
- Kelly, O.B.; Donnell, S.O.; Stempak, J.M.; Steinhart, A.H.; Silverberg, M.S. Therapeutic Drug Monitoring to Guide Infliximab Dose Adjustment is Associated with Better Endoscopic Outcomes than Clinical Decision Making Alone in Active Inflammatory Bowel Disease. Inflamm. Bowel Dis. 2017, 23, 1202–1209. [Google Scholar] [CrossRef] [Green Version]
- Courbette, O.; Aupiais, C.; Viala, J.; Hugot, J.-P.; Roblin, X.; Candon, S.; Louveau, B.; Chatenoud, L.; Martinez-Vinson, C. Trough Levels of Infliximab at W6 Are Predictive of Remission at W14 in Pediatric Crohn Disease. J. Pediatr. Gastroenterol. Nutr. 2019, 70, 310–317. [Google Scholar] [CrossRef]
- Arijs, I.; Li, K.; Toedter, G.; Quintens, R.; Van Lommel, L.; Van Steen, K.; Leemans, P.; De Hertogh, G.; Lemaire, K.; Ferrante, M.; et al. Mucosal gene signatures to predict response to infliximab in patients with ulcerative colitis. Gut 2009, 58, 1612–1619. [Google Scholar] [CrossRef]
- Arijs, I.; Quintens, R.; Van Lommel, L.; Van Steen, K.; De Hertogh, G.; Lemaire, K.; Schraenen, A.; Perrier, C.; Van Assche, G.; Vermeire, S.; et al. Predictive value of epithelial gene expression profiles for response to infliximab in Crohn’s disease. Inflamm. Bowel Dis. 2010, 16, 2090–2098. [Google Scholar] [CrossRef]
- Julià, A.; Erra, A.; Palacio, C.; Tomas, C.; Sans, X.; Barceló, P.; Marsal, S. An eight-gene blood expression profile predicts the response to infliximab in rheumatoid arthritis. PLoS ONE 2009, 4, e7556. [Google Scholar] [CrossRef] [Green Version]
- Nakamura, S.; Suzuki, K.; Iijima, H.; Hata, Y.; Lim, C.R.; Ishizawa, Y.; Kameda, H.; Amano, K.; Matsubara, K.; Matoba, R.; et al. Identification of baseline gene expression signatures predicting therapeutic responses to three biologic agents in rheumatoid arthritis: A retrospective observational study. Arthritis Res. Ther. 2016, 18, 159. [Google Scholar] [CrossRef] [Green Version]
- Toedter, G.; Li, K.; Marano, C.; Ma, K.; Sague, S.; Huang, C.C.; Song, X.-Y.; Rutgeerts, P.; Baribaud, F. Gene Expression Profiling and Response Signatures Associated with Differential Responses to Infliximab Treatment in Ulcerative Colitis. Am. J. Gastroenterol. 2011, 106, 1272–1280. [Google Scholar] [CrossRef]
- Ostrowski, J.; Dabrowska, M.; Lazowska, I.; Paziewska, A.; Balabas, A.; Kluska, A.; Kulecka, M.; Karczmarski, J.; Ambrozkiewicz, F.; Piatkowska, M.; et al. Redefining the Practical Utility of Blood Transcriptome Biomarkers in Inflammatory Bowel Diseases. J. Crohn Colitis 2019, 13, 626–633. [Google Scholar] [CrossRef]
- Verstockt, B.; Verstockt, S.; Dehairs, J.; Ballet, V.; Blevi, H.; Wollants, W.-J.; Breynaert, C.; Van Assche, G.; Vermeire, S.; Ferrante, M. Low TREM1 expression in whole blood predicts anti-TNF response in inflammatory bowel disease. EBioMedicine 2019. [Google Scholar] [CrossRef] [Green Version]
- Toonen, E.J.M.; Gilissen, C.; Franke, B.; Kievit, W.; Eijsbouts, A.M.; den Broeder, A.A.; van Reijmersdal, S.V.; Veltman, J.A.; Scheffer, H.; Radstake, T.R.D.J.; et al. Validation Study of Existing Gene Expression Signatures for Anti-TNF Treatment in Patients with Rheumatoid Arthritis. PLoS ONE 2012, 7, e33199. [Google Scholar] [CrossRef] [Green Version]
- Salvador-Martín, S.; Raposo-Gutiérrez, I.; Navas-López, V.M.; Gallego-Fernández, C.; Moreno-álvarez, A.; Solar-Boga, A.; Muñoz-Codoceo, R.; Magallares, L.; Martínez-Ojinaga, E.; Fobelo, M.J.; et al. Gene signatures of early response to anti-TNF drugs in pediatric inflammatory bowel disease. Int. J. Mol. Sci. 2020, 21, 3364. [Google Scholar] [CrossRef]
- Harris, P.A.; Taylor, R.; Thielke, R.; Payne, J.; Gonzalez, N.; Conde, J.G. Research electronic data capture (REDCap)—A metadata—Driven methodology and workflow process for providing translational research informatics support. J. Biomed. Inform. 2009, 42, 377–381. [Google Scholar] [CrossRef] [Green Version]
- Edgar, R.; Domrachev, M.; Lash, A.E. Gene Expression Omnibus: NCBI gene expression and hybridization array data repository. Nucleic Acids Res. 2002, 30, 207–210. [Google Scholar] [CrossRef] [Green Version]
- Glas, A.S.; Lijmer, J.G.; Prins, M.H.; Bonsel, G.J.; Bossuyt, P.M.M. The diagnostic odds ratio: A single indicator of test performance. J. Clin. Epidemiol. 2003, 56, 1129–1135. [Google Scholar] [CrossRef]
- Gazouli, M.; Pachoula, I.; Panayotou, I.; Mantzaris, G.; Chrousos, G.; Anagnou, N.P.; Roma-Giannikou, E. NOD2/CARD15, ATG16L1 and IL23R gene polymorphisms and childhood-onset of Crohn’s disease. World J. Gastroenterol. 2010, 16, 1753–1758. [Google Scholar] [CrossRef] [PubMed]
- Moran, C.J.; Walters, T.D.; Guo, C.-H.; Kugathasan, S.; Klein, C.; Turner, D.; Wolters, V.M.; Bandsma, R.H.; Mouzaki, M.; Zachos, M.; et al. IL-10R polymorphisms are associated with very-early-onset ulcerative colitis. Inflamm. Bowel Dis. 2013, 19, 115–123. [Google Scholar] [CrossRef] [PubMed]
- Vaiopoulou, A.; Gazouli, M.; Papadopoulou, A.; Anagnostopoulos, A.K.; Karamanolis, G.; Theodoropoulos, G.E.; M’Koma, A.; Tsangaris, G.T. Serum protein profiling of adults and children with Crohn disease. J. Pediatr. Gastroenterol. Nutr. 2015, 60, 42–47. [Google Scholar] [CrossRef] [Green Version]
- Dubinsky, M.C.; Mei, L.; Friedman, M.; Dhere, T.; Haritunians, T.; Hakonarson, H.; Kim, C.; Glessner, J.; Targan, S.R.; McGovern, D.P.; et al. Genome wide association (GWA) predictors of anti-TNF α therapeutic responsiveness in pediatric inflammatory bowel disease. Inflamm. Bowel Dis. 2010, 16, 1357–1366. [Google Scholar] [CrossRef]
- Li, N.; Shi, R.-H. Updated review on immune factors in pathogenesis of Crohn’s disease. World J. Gastroenterol. 2018, 24, 15–22. [Google Scholar] [CrossRef]
- Tatiya-Aphiradee, N.; Chatuphonprasert, W.; Jarukamjorn, K. Immune response and inflammatory pathway of ulcerative colitis. J. Basic Clin. Physiol. Pharmacol. 2018, 30, 1–10. [Google Scholar] [CrossRef]
- Everaert, C.; Luypaert, M.; Maag, J.L.V.; Cheng, Q.X.; Dinger, M.E.; Hellemans, J.; Mestdagh, P. Benchmarking of RNA-sequencing analysis workflows using whole-transcriptome RT-qPCR expression data. Sci. Rep. 2017, 7, 1559. [Google Scholar] [CrossRef] [Green Version]
- Li, Y.; Zhang, L.; Li, R.; Zhang, M.; Li, Y.; Wang, H.; Wang, S.; Bao, Z. Systematic identification and validation of the reference genes from 60 RNA-Seq libraries in the scallop Mizuhopecten yessoensis. BMC Genom. 2019, 20, 288. [Google Scholar] [CrossRef]
- Zhang, Z.; Duan, Y.; Wu, Z.; Zhang, H.; Ren, J.; Huang, L. PPARD is an Inhibitor of Cartilage Growth in External Ears. Int. J. Biol. Sci. 2017, 13, 669–681. [Google Scholar] [CrossRef] [Green Version]
- Britzen-Laurent, N.; Herrmann, C.; Naschberger, E.; Croner, R.S.; Sturzl, M. Pathophysiological role of guanylate-binding proteins in gastrointestinal diseases. World J. Gastroenterol. 2016, 22, 6434–6443. [Google Scholar] [CrossRef]
- De Buhr, M.F.; Mahler, M.; Geffers, R.; Hansen, W.; Westendorf, A.M.; Lauber, J.; Buer, J.; Schlegelberger, B.; Hedrich, H.J.; Bleich, A. Cd14, Gbp1, and Pla2g2a: Three major candidate genes for experimental IBD identified by combining QTL and microarray analyses. Physiol. Genom. 2006, 25, 426–434. [Google Scholar] [CrossRef] [Green Version]
- Minar, P.; Haberman, Y.; Jurickova, I.; Wen, T.; Rothenberg, M.E.; Kim, M.-O.; Saeed, S.A.; Baldassano, R.N.; Stephens, M.; Markowitz, J.; et al. Utility of neutrophil Fc γ receptor I (CD64) index as a biomarker for mucosal inflammation in pediatric Crohn’s disease. Inflamm. Bowel Dis. 2014, 20, 1037–1048. [Google Scholar] [CrossRef] [Green Version]
- Tillinger, W.; Jilch, R.; Jilma, B.; Brunner, H.; Koeller, U.; Lichtenberger, C.; Waldhor, T.; Reinisch, W. Expression of the high-affinity IgG receptor FcRI (CD64) in patients with inflammatory bowel disease: A new biomarker for gastroenterologic diagnostics. Am. J. Gastroenterol. 2009, 104, 102–109. [Google Scholar] [CrossRef]
- Muthas, D.; Reznichenko, A.; Balendran, C.A.; Bottcher, G.; Clausen, I.G.; Karrman Mardh, C.; Ottosson, T.; Uddin, M.; MacDonald, T.T.; Danese, S.; et al. Neutrophils in ulcerative colitis: A review of selected biomarkers and their potential therapeutic implications. Scand. J. Gastroenterol. 2017, 52, 125–135. [Google Scholar] [CrossRef]
- Wojtal, K.A.; Rogler, G.; Scharl, M.; Biedermann, L.; Frei, P.; Fried, M.; Weber, A.; Eloranta, J.J.; Kullak-Ublick, G.A.; Vavricka, S.R. Fc γ receptor CD64 modulates the inhibitory activity of infliximab. PLoS ONE 2012, 7, e43361. [Google Scholar] [CrossRef]


| Forward (5′-3′) | Reverse (5′-3′) | |
|---|---|---|
| GBP1 | TTCTCCAGAGGAAGGTGGAA | TTTTCTTCATTAGCCCAATTGTT |
| GBP5 | CAAAGTCGGCAAGCAAATTTAT | GGTGTCTGCCTCCTCAGATT |
| IGHG2 | CAGGACTCTACTCCCTCAGCA | GCACTCGACACAACATTTGC |
| GNLY | AGGGTGACCTGTTGACCAAA | CAGCATTGGAAACACTTCTCTG |
| FCGR1A | CACTGCAAAGAGACGCTTCA | AGGCAAGATCTGGACTCTATGG |
| FCGR1B | TGTCAGGAACAAAAAGAAGAACA | GATGGCCACCAACTGAGC |
| ACTB | CTGTGCTGTGGAAGCTAAGT | GATGTCCACGTCACACTTCA |
| RPL4 | AGGCCAGGAATCACAAGCTC | AGGCCAGGAATCACAAGCTC |
| Characteristic | Overall (n = 38) | Responders (n = 29) | Non-Responders (n = 9) | p Value |
|---|---|---|---|---|
| Gender | ||||
| Male, n (%) | 20 (52.6%) | 15 (51.7%) | 5 (55.6%) | 1 |
| Female, n (%) | 18 (47.4%) | 14 (48.3%) | 4 (44.4%) | |
| Age (years) | ||||
| At diagnosis, median (IQR, range) | 10.5 (4.55, 0.7–17) | 10.5 (4.63, 2–17) | 10.2 (7.5, 0.7–13) | 0.137 |
| At start of treatment, median (IQR, range) | 11.9 (4.15, 1.1–17) | 12.2 (4.6, 3.5–17) | 11.5 (6, 1.1–14.1) | 0.263 |
| Type of IBD | ||||
| CD, n (%) | 30 (78.9%) | 22 (75.9%) | 8 (88.9%) | 0.650 |
| UC, n (%) | 8 (21.1%) | 7 (24.1%) | 1 (11.1%) | |
| Type of Anti-TNF | ||||
| Infliximab, n (%) | 21 (55.3%) | 14 (48.3%) | 7 (77.8%) | 0.148 |
| Adalimumab, n (%) | 17 (44.7%) | 15 (51.7%) | 2 (22.2%) | |
| PCDAI at start of treatment, median (IQR, range) | 28.75 (25.63, 5–60) | 32.5 (31.25, 5–60) | 16.25 (11.25, 7.5–30) | 0.045 ** |
| PUCAI at start of treatment, median (IQR, range) | 47.5 (35, 5–60) * | 50 (40, 5–60) | 45 * | - |
| CRP at start of treatment, median (IQR, range) | 14.09 (28.54, 0.4–110.9) | 22.3 (32.19, 0.4–110.9) | 8.45 (17.94, 4–27.5) | 0.042 ** |
| FC at start of treatment, median (IQR, range)Concomitant immunomodulator at start of treatment | 1800 (2253, 27–9543) | 2000 (2288, 27–9543) | 1207.5 (1432, 130–3167) | 0.106 |
| Azathioprine, n (%) | 26 (68.4%) | 22 (75.9%) | 4 (44.4%) | |
| Methotrexate, n (%) | 4 (10.5%) | 4 (13.8%) | 0 | 0.006 ** |
| None, n (%) | 8 (21.1%) | 3 (10.3%) | 5 (55.56%) |
| Gene Name | Mean TPM R | Mean TMM+1 R | Log2 R | Mean TPM NR | Mean TMM+1 NR | Log2 NR | Fold Change (Log2) | p Value |
|---|---|---|---|---|---|---|---|---|
| HK2 | 46.41 | 5.98 | 2.56 | 26.02 | 3.69 | 1.89 | −0.67 | 0.0254 |
| DNAJC13 | 32.18 | 4.19 | 2.07 | 16.19 | 2.67 | 1.42 | −0.65 | 0.0107 |
| TSPAN33 | 13.53 | 2.47 | 1.31 | 25.58 | 3.77 | 1.91 | 0.61 | 0.0096 |
| MAP3K7CL | 15.98 | 2.73 | 1.45 | 30.07 | 4.16 | 2.06 | 0.61 | 0.0110 |
| TRBC2 | 171.80 | 17.93 | 4.16 | 245.97 | 27.67 | 4.79 | 0.63 | 0.0180 |
| MT-CO3 | 1097.32 | 120.77 | 6.92 | 1767.21 | 187.72 | 7.55 | 0.64 | 0.0136 |
| CCL4 | 6.51 | 1.61 | 0.69 | 14.43 | 2.53 | 1.34 | 0.65 | 0.0276 |
| DDX11L10 | 3.54 | 1.39 | 0.47 | 12.37 | 2.18 | 1.13 | 0.65 | 0.0495 |
| MT-ND4L | 132.36 | 15.82 | 3.98 | 227.85 | 25.23 | 4.66 | 0.67 | 0.0392 |
| MT-ATP6 | 1024.97 | 115.51 | 6.85 | 1739.84 | 186.20 | 7.54 | 0.69 | 0.0253 |
| MT-CYB | 868.49 | 99.71 | 6.64 | 1494.58 | 162.26 | 7.34 | 0.70 | 0.0382 |
| ACRBP | 11.09 | 2.30 | 1.20 | 25.66 | 3.76 | 1.91 | 0.71 | 0.0020 |
| TREML1 | 13.74 | 2.71 | 1.44 | 31.99 | 4.50 | 2.17 | 0.73 | 0.0297 |
| MT-ND1 | 1094.43 | 126.98 | 6.99 | 1989.71 | 212.16 | 7.73 | 0.74 | 0.0423 |
| HLA-C | 1809.25 | 194.04 | 7.60 | 2990.89 | 325.05 | 8.34 | 0.74 | 0.0080 |
| HLA-H | 80.05 | 9.74 | 3.28 | 140.43 | 16.50 | 4.04 | 0.76 | 0.0361 |
| AP001189.1 | 10.66 | 2.32 | 1.21 | 26.74 | 3.92 | 1.97 | 0.76 | 0.0221 |
| MT-ATP8 | 107.65 | 13.26 | 3.73 | 202.76 | 22.62 | 4.50 | 0.77 | 0.0251 |
| MT-ND2 | 865.51 | 99.05 | 6.63 | 1596.88 | 169.80 | 7.41 | 0.78 | 0.0168 |
| SH3BGRL2 | 8.73 | 2.04 | 1.03 | 24.59 | 3.54 | 1.82 | 0.80 | 0.0294 |
| IFITM3 | 327.49 | 37.05 | 5.21 | 594.78 | 65.05 | 6.02 | 0.81 | 0.0181 |
| KLRD1 | 37.29 | 4.30 | 2.11 | 61.96 | 7.61 | 2.93 | 0.82 | 0.0491 |
| TUBB1 | 76.43 | 10.11 | 3.34 | 163.15 | 17.92 | 4.16 | 0.83 | 0.0259 |
| GP1BB | 22.65 | 3.79 | 1.92 | 53.23 | 6.71 | 2.75 | 0.83 | 0.0172 |
| IFITM1 | 373.17 | 43.37 | 5.44 | 727.55 | 77.03 | 6.27 | 0.83 | 0.0459 |
| OASL | 23.87 | 3.31 | 1.73 | 50.93 | 5.98 | 2.58 | 0.85 | 0.0423 |
| PF4 | 23.49 | 3.63 | 1.86 | 60.29 | 7.32 | 2.87 | 1.01 | 0.0049 |
| EPSTI1 | 41.88 | 4.57 | 2.19 | 83.41 | 9.27 | 3.21 | 1.02 | 0.0344 |
| MYL9 | 11.02 | 2.41 | 1.27 | 38.53 | 5.20 | 2.38 | 1.11 | 0.0269 |
| CCL5 | 122.76 | 13.85 | 3.79 | 276.24 | 30.37 | 4.92 | 1.13 | 0.0002 |
| MYOM2 | 2.67 | 1.23 | 0.30 | 15.28 | 2.86 | 1.52 | 1.22 | 0.0377 |
| GNLY | 62.70 | 6.77 | 2.76 | 191.26 | 21.55 | 4.43 | 1.67 | 0.0409 |
| Gene Name | Mean TPM R | Mean TMM+1 R | Log2 R | Mean TPM NR | Mean TMM+1 NR | Log2 NR | Fold Change (Log2) | p Value |
|---|---|---|---|---|---|---|---|---|
| IGHG1 | 492.65 | 54.71 | 5.77 | 98.10 | 11.26 | 3.49 | −2.28 | 0.0394 |
| IGKV3-20 | 92.59 | 11.12 | 3.47 | 37.71 | 4.50 | 2.17 | −1.30 | 0.0096 |
| IGHG2 | 163.72 | 19.68 | 4.30 | 71.31 | 8.06 | 3.01 | −1.29 | 0.0372 |
| IGHA1 | 510.70 | 57.75 | 5.85 | 254.62 | 25.75 | 4.69 | −1.17 | 0.0268 |
| IGKC | 1398.17 | 155.23 | 7.28 | 669.09 | 70.45 | 6.14 | −1.14 | 0.0159 |
| IGKV1-39 | 45.72 | 5.83 | 2.54 | 18.16 | 2.83 | 1.50 | −1.04 | 0.0313 |
| IGKV2D-28 | 35.88 | 5.17 | 2.37 | 15.11 | 2.54 | 1.34 | −1.03 | 0.0061 |
| IGHV4-59 | 14.97 | 2.63 | 1.40 | 5.01 | 1.45 | 0.54 | −0.86 | 0.0272 |
| IGKV1-5 | 42.43 | 5.66 | 2.50 | 21.94 | 3.14 | 1.65 | −0.85 | 0.0380 |
| IGHV3-74 | 12.98 | 2.48 | 1.31 | 4.11 | 1.40 | 0.49 | −0.82 | 0.0091 |
| IGKV3-11 | 32.50 | 4.50 | 2.17 | 15.11 | 2.56 | 1.36 | −0.81 | 0.0070 |
| IGKV3-15 | 39.70 | 5.50 | 2.46 | 21.91 | 3.14 | 1.65 | −0.81 | 0.0300 |
| IGKV1-12 | 15.46 | 2.63 | 1.40 | 6.00 | 1.59 | 0.67 | −0.72 | 0.0095 |
| IGHV3-7 | 16.04 | 2.85 | 1.51 | 7.78 | 1.74 | 0.80 | −0.72 | 0.0146 |
| IGHV3-48 | 8.96 | 1.95 | 0.97 | 2.03 | 1.20 | 0.26 | −0.70 | 0.0459 |
| IGLV1-44 | 28.69 | 4.13 | 2.05 | 15.36 | 2.54 | 1.35 | −0.70 | 0.0272 |
| RARRES3 | 27.27 | 4.05 | 2.02 | 46.58 | 6.15 | 2.62 | 0.60 | 0.0327 |
| RHBDF2 | 46.64 | 6.02 | 2.59 | 75.71 | 9.17 | 3.20 | 0.61 | 0.0281 |
| IGFLR1 | 22.43 | 3.47 | 1.80 | 40.98 | 5.39 | 2.43 | 0.63 | 0.0070 |
| APOL2 | 67.33 | 8.64 | 3.11 | 117.78 | 13.65 | 3.77 | 0.66 | 0.0385 |
| TYMP | 266.66 | 30.75 | 4.94 | 451.43 | 48.71 | 5.61 | 0.66 | 0.0444 |
| IL1B | 29.29 | 4.23 | 2.08 | 53.16 | 6.72 | 2.75 | 0.67 | 0.0226 |
| DNAJC25-GNG10 | 26.40 | 3.93 | 1.98 | 51.09 | 6.29 | 2.65 | 0.68 | 0.0397 |
| GZMA | 14.86 | 2.62 | 1.39 | 29.03 | 4.20 | 2.07 | 0.68 | 0.0493 |
| IRF1 | 307.23 | 35.90 | 5.17 | 538.82 | 58.4 | 5.87 | 0.70 | 0.0295 |
| HLA-C | 1710.59 | 197.19 | 7.62 | 2939.53 | 323.41 | 8.34 | 0.71 | 0.0096 |
| HLA-H | 77.17 | 9.96 | 3.32 | 139.23 | 16.44 | 4.04 | 0.72 | 0.0378 |
| APOL6 | 93.85 | 11.01 | 3.46 | 166.82 | 18.54 | 4.21 | 0.75 | 0.0205 |
| DHRS9 | 17.27 | 2.75 | 1.46 | 35.50 | 4.73 | 2.24 | 0.78 | 0.0197 |
| UBE2L6 | 91.58 | 11.15 | 3.48 | 168.82 | 19.24 | 4.27 | 0.79 | 0.0272 |
| ODF3B | 26.61 | 3.85 | 1.95 | 56.06 | 6.92 | 2.79 | 0.84 | 0.0273 |
| GBP2 | 200.76 | 23.37 | 4.55 | 393.53 | 42.06 | 5.39 | 0.85 | 0.0118 |
| SECTM1 | 128.31 | 15.52 | 3.96 | 252.39 | 28.29 | 4.82 | 0.87 | 0.0484 |
| FCGR1CP | 4.89 | 1.47 | 0.56 | 18.76 | 3.13 | 1.65 | 1.09 | 0.0313 |
| SERPING1 | 20.09 | 3.07 | 1.62 | 56.06 | 6.79 | 2.76 | 1.14 | 0.0293 |
| MYOM2 | 2.43 | 1.27 | 0.34 | 14.53 | 2.80 | 1.48 | 1.14 | 0.0389 |
| GBP1 | 84.92 | 9.85 | 3.30 | 208.64 | 22.49 | 4.49 | 1.19 | 0.0201 |
| ANKRD22 | 3.24 | 1.34 | 0.42 | 19.72 | 3.11 | 1.64 | 1.22 | 0.0382 |
| FCGR1B | 33.63 | 4.77 | 2.25 | 106.67 | 12.48 | 3.64 | 1.39 | 0.0293 |
| FCGR1A | 27.68 | 4.15 | 2.05 | 93.02 | 10.90 | 3.45 | 1.39 | 0.0212 |
| BATF2 | 6.67 | 1.69 | 0.76 | 36.71 | 4.89 | 2.29 | 1.53 | 0.0201 |
| GBP5 | 130.99 | 14.13 | 3.82 | 393.84 | 41.43 | 5.37 | 1.55 | 0.0373 |
| Gene | Log2FC NR/R T0 RNAseq | Log2FC NR/R T0 qPCR | Log2FC NR/R T2 RNAseq | Log2FC NR/R T2 qPCR |
|---|---|---|---|---|
| GBP1 | 0.69 | 0.49 | 1.19 * | 1.08 * |
| GBP5 | 0.95 | 0.19 | 1.55 * | 0.78 |
| GNLY | 1.67 * | 0.54 | 1.35 | 1.15 |
| BATF2 | 1.16 | 0.48 | 1.53 * | 0.55 |
| IGHA1 | −0.76 | −0.67 | −1.17 * | −0.34 |
| IGHG2 | −0.29 | −0.01 | −1.29 * | −0.23 |
| FCGR1A | 0.22 | 0.39 | 1.39 * | 1.05 * |
| FCGR1B | 0.25 | 0.66 | 1.39 * | 1.21 * |
| GBP11 | FCGR1A1 | FCGR1B1 | |
|---|---|---|---|
| Sensitivity | 67% | 78% | 89% |
| Specificity | 70% | 63%1 | 52% |
| PPV | 43% | 41% | 38% |
| NPV | 86% | 89% | 93% |
| Diagnostic odds ratio | 4.75 | 5.95 | 8.61 |
| +LR | 2,25 | 2.1 | 1.84 |
| –LR | 0.47 | 0.35 | 0.21 |
Publisher’s Note: MDPI stays neutral with regard to jurisdictional claims in published maps and institutional affiliations. |
© 2021 by the authors. Licensee MDPI, Basel, Switzerland. This article is an open access article distributed under the terms and conditions of the Creative Commons Attribution (CC BY) license (http://creativecommons.org/licenses/by/4.0/).
Share and Cite
Salvador-Martín, S.; Kaczmarczyk, B.; Álvarez, R.; Navas-López, V.M.; Gallego-Fernández, C.; Moreno-Álvarez, A.; Solar-Boga, A.; Sánchez, C.; Tolin, M.; Velasco, M.; et al. Whole Transcription Profile of Responders to Anti-TNF Drugs in Pediatric Inflammatory Bowel Disease. Pharmaceutics 2021, 13, 77. https://doi.org/10.3390/pharmaceutics13010077
Salvador-Martín S, Kaczmarczyk B, Álvarez R, Navas-López VM, Gallego-Fernández C, Moreno-Álvarez A, Solar-Boga A, Sánchez C, Tolin M, Velasco M, et al. Whole Transcription Profile of Responders to Anti-TNF Drugs in Pediatric Inflammatory Bowel Disease. Pharmaceutics. 2021; 13(1):77. https://doi.org/10.3390/pharmaceutics13010077
Chicago/Turabian StyleSalvador-Martín, Sara, Bartosz Kaczmarczyk, Rebeca Álvarez, Víctor Manuel Navas-López, Carmen Gallego-Fernández, Ana Moreno-Álvarez, Alfonso Solar-Boga, Cesar Sánchez, Mar Tolin, Marta Velasco, and et al. 2021. "Whole Transcription Profile of Responders to Anti-TNF Drugs in Pediatric Inflammatory Bowel Disease" Pharmaceutics 13, no. 1: 77. https://doi.org/10.3390/pharmaceutics13010077
APA StyleSalvador-Martín, S., Kaczmarczyk, B., Álvarez, R., Navas-López, V. M., Gallego-Fernández, C., Moreno-Álvarez, A., Solar-Boga, A., Sánchez, C., Tolin, M., Velasco, M., Muñoz-Codoceo, R., Rodriguez-Martinez, A., Vayo, C. A., Bossacoma, F., Pujol-Muncunill, G., Fobelo, M. J., Millán-Jiménez, A., Magallares, L., Martínez-Ojinaga, E., ... López-Fernández, L. A. (2021). Whole Transcription Profile of Responders to Anti-TNF Drugs in Pediatric Inflammatory Bowel Disease. Pharmaceutics, 13(1), 77. https://doi.org/10.3390/pharmaceutics13010077