Decoupling and Driving Factors of Economic Growth and Groundwater Consumption in the Coastal Areas of the Yellow Sea and the Bohai Sea

Abstract
:1. Introduction
2. Study Region, Methods, and Data
2.1. Study Region
2.2. Tapio Decoupling Model
2.3. Decomposition of the Drivers of Groundwater Consumption
- The level of economic development is a measure of the scale of socioeconomic activities in a specific period, and it is an important driver of groundwater consumption. In the primary industry, substantial amount of groundwater was extracted for agricultural irrigation (e.g., flood irrigation). Therefore, the per capita GDP () of the primary industry [13,43] can represent the level of economic development.
- From technical perspective, water consumption per 10,000 yuan of GDP () [44,45] is commonly used to indicate the technical efficiency of water resources. It also represents the regional environmental pressure. For groundwater research, the water use efficiency of surface water and groundwater is similar. Therefore, current study adopts the water consumption of 10,000 yuan of GDP to gauge the technical factors of water environment pressure in the coastal provinces and cities around the Yellow Sea and Bohai Sea.
- Groundwater consumption is affected by the water resources consumption structure (). Hence, optimizing agricultural irrigation water consumption and other forms of water consumption would help with managing the issue of groundwater exploitation. Following Lin [46] and He [34], the water resources consumption structure (i.e., the proportion of surface water consumption to water consumption) was introduced into the model.
- Key variables affecting groundwater consumption were incorporated:
- (1)
- The effective irrigation area (A) is the area of farmland covered by irrigation projects or facilities. It indicates the degree of regional water conservation, and affects the groundwater consumption. It was introduced into the model in order to evaluate the impact of water conservation on groundwater consumption.
- (2)
- Sewage charge [47] () indicates the short-term impact of environmental regulation on groundwater consumption. It is a kind of fee-based environmental regulation. Its inclusion in the model enabled the current study to evaluate the role of short-term environmental regulation on groundwater consumption.
- (3)
- The proportion of investment in drainage and sewage treatment infrastructure in urban environmental infrastructure (S). The investment of drainage and sewage treatment infrastructure affects the groundwater consumption. This study took the proportion of investment in drainage and sewage treatment infrastructure in urban environmental infrastructure as a measure of the impact of water infrastructure investment scale on groundwater consumption.
- (4)
- Policy factors. The Chinese government has introduced a series of water resources management policies (since the 1970s), which also affected groundwater consumption. This study introduced the time trend variable to examine the sustainability of these policies.
2.4. Data
3. Decoupling Effect Analysis
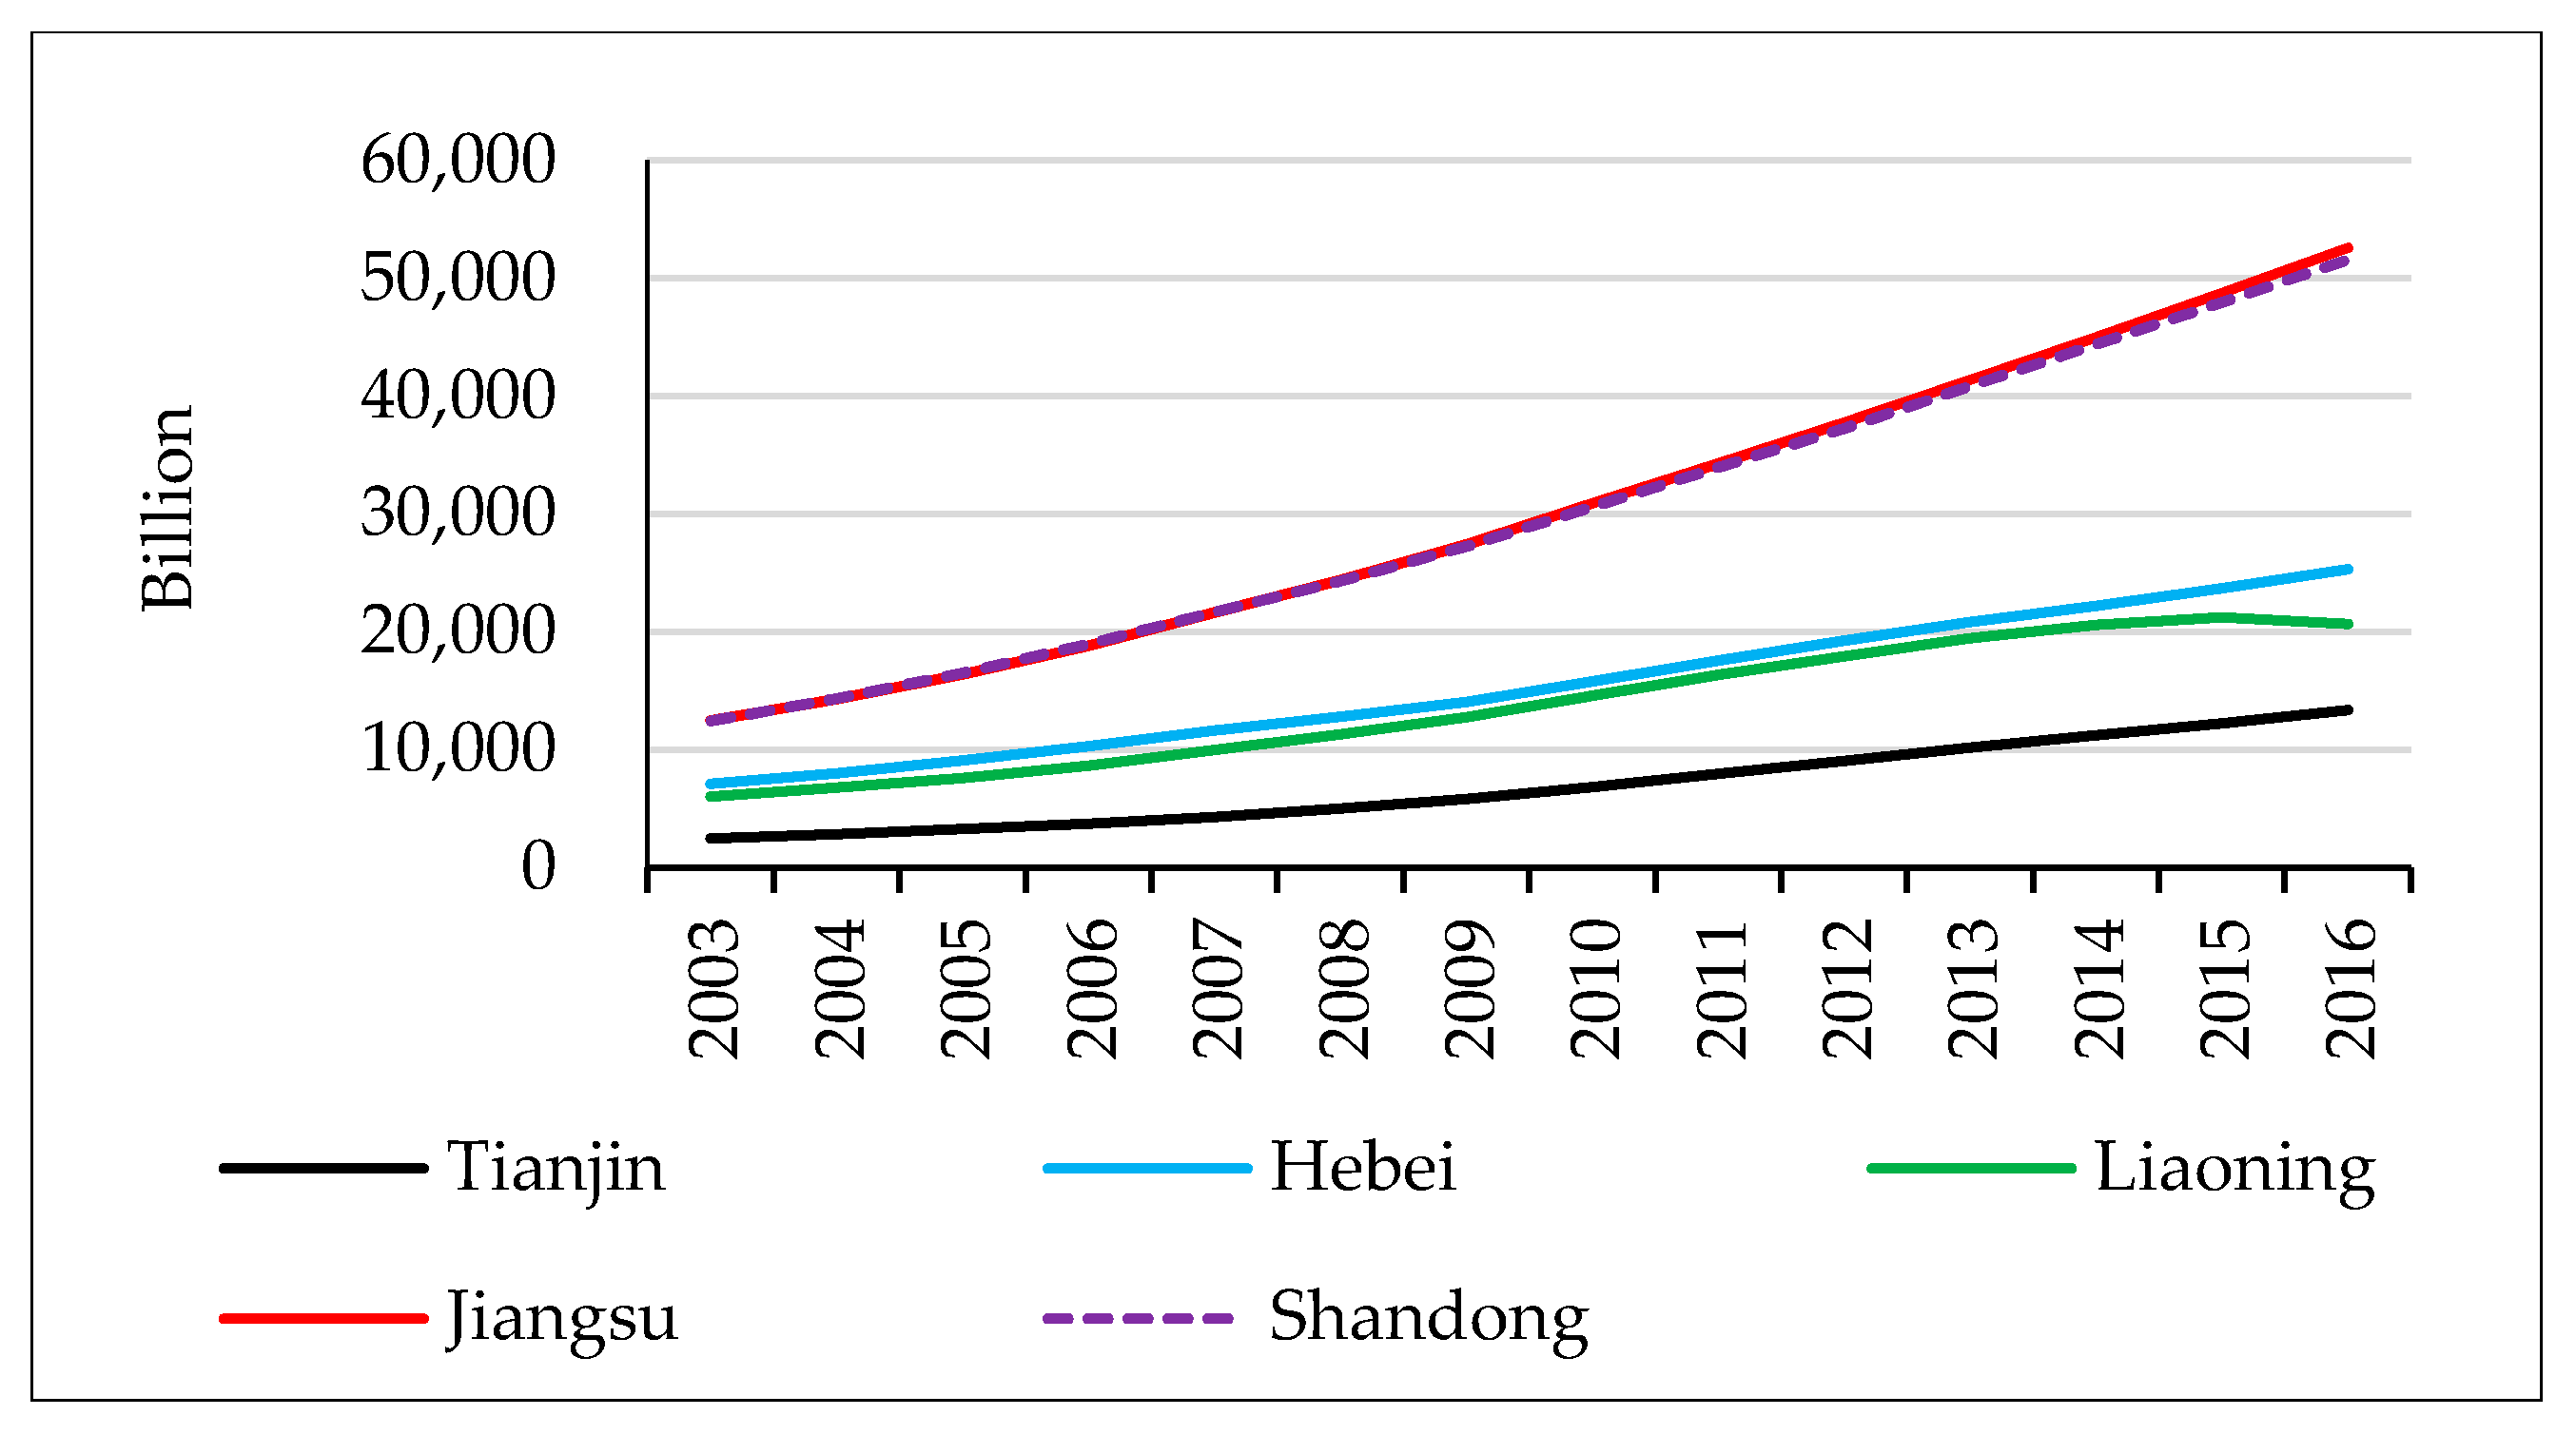
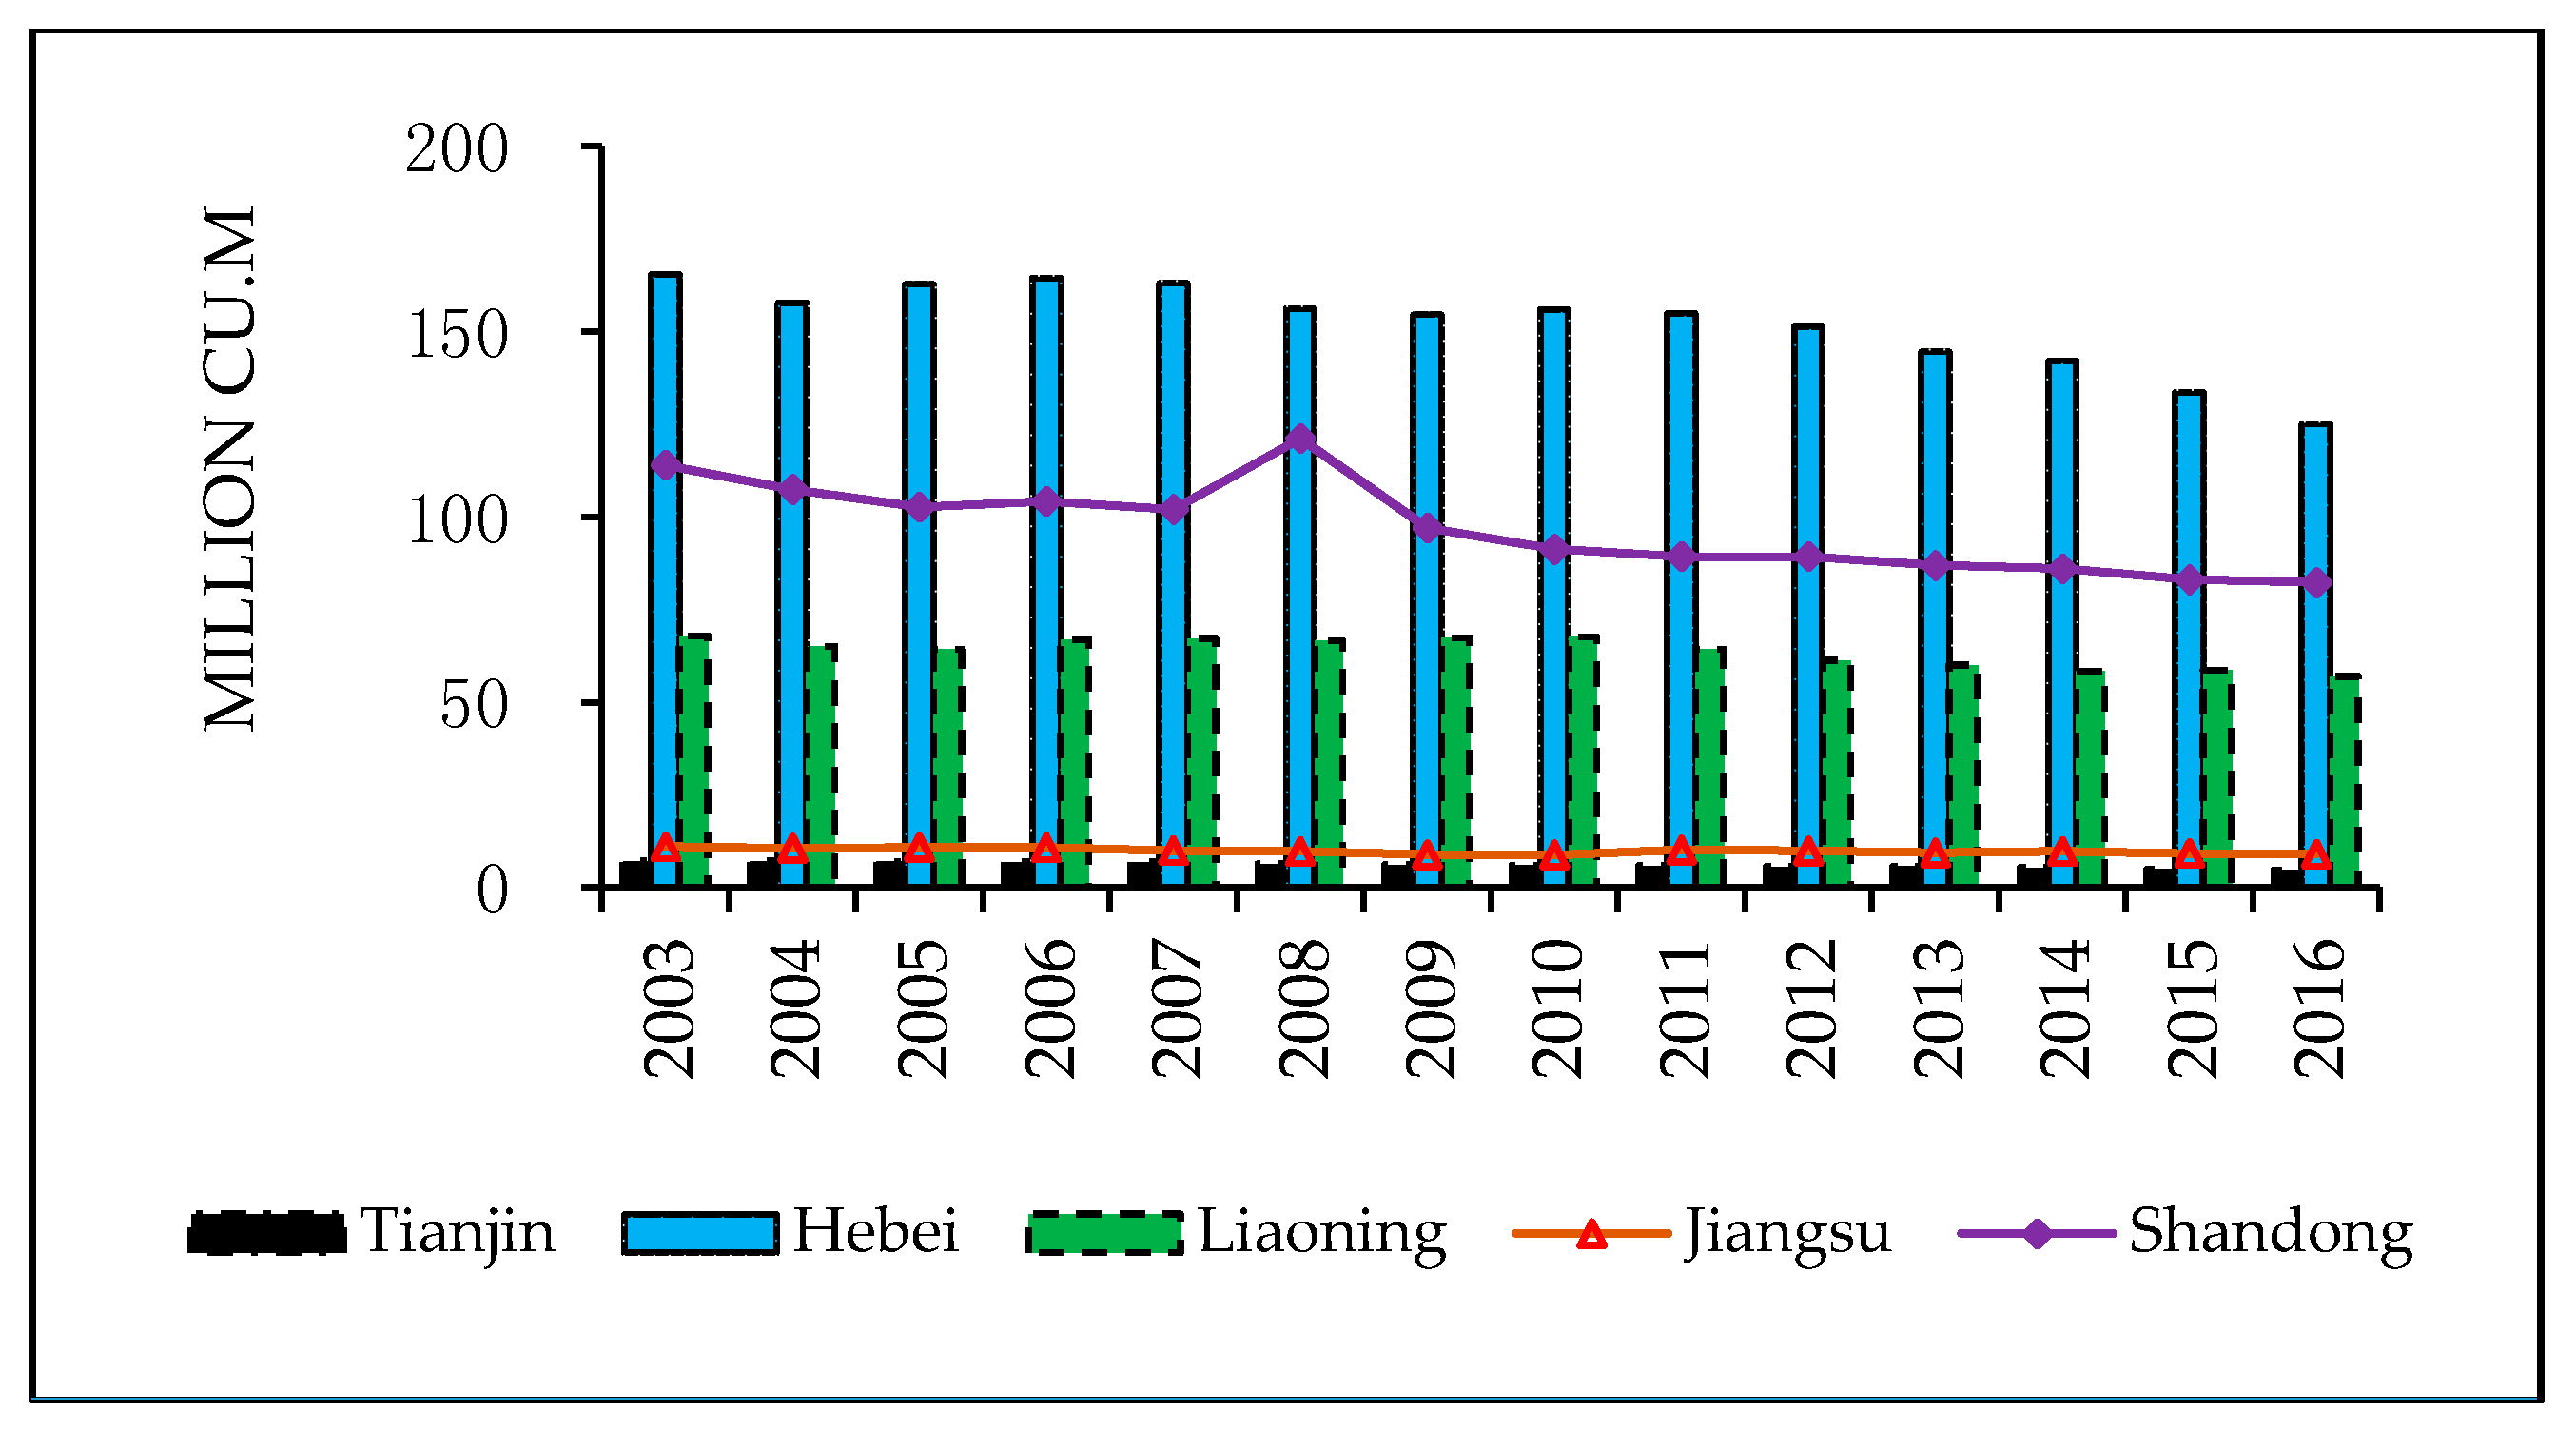
3.1. Trend Analysis of GDP and Groundwater Consumption
3.2. Temporal and Spatial Characteristics of Decoupling Effect
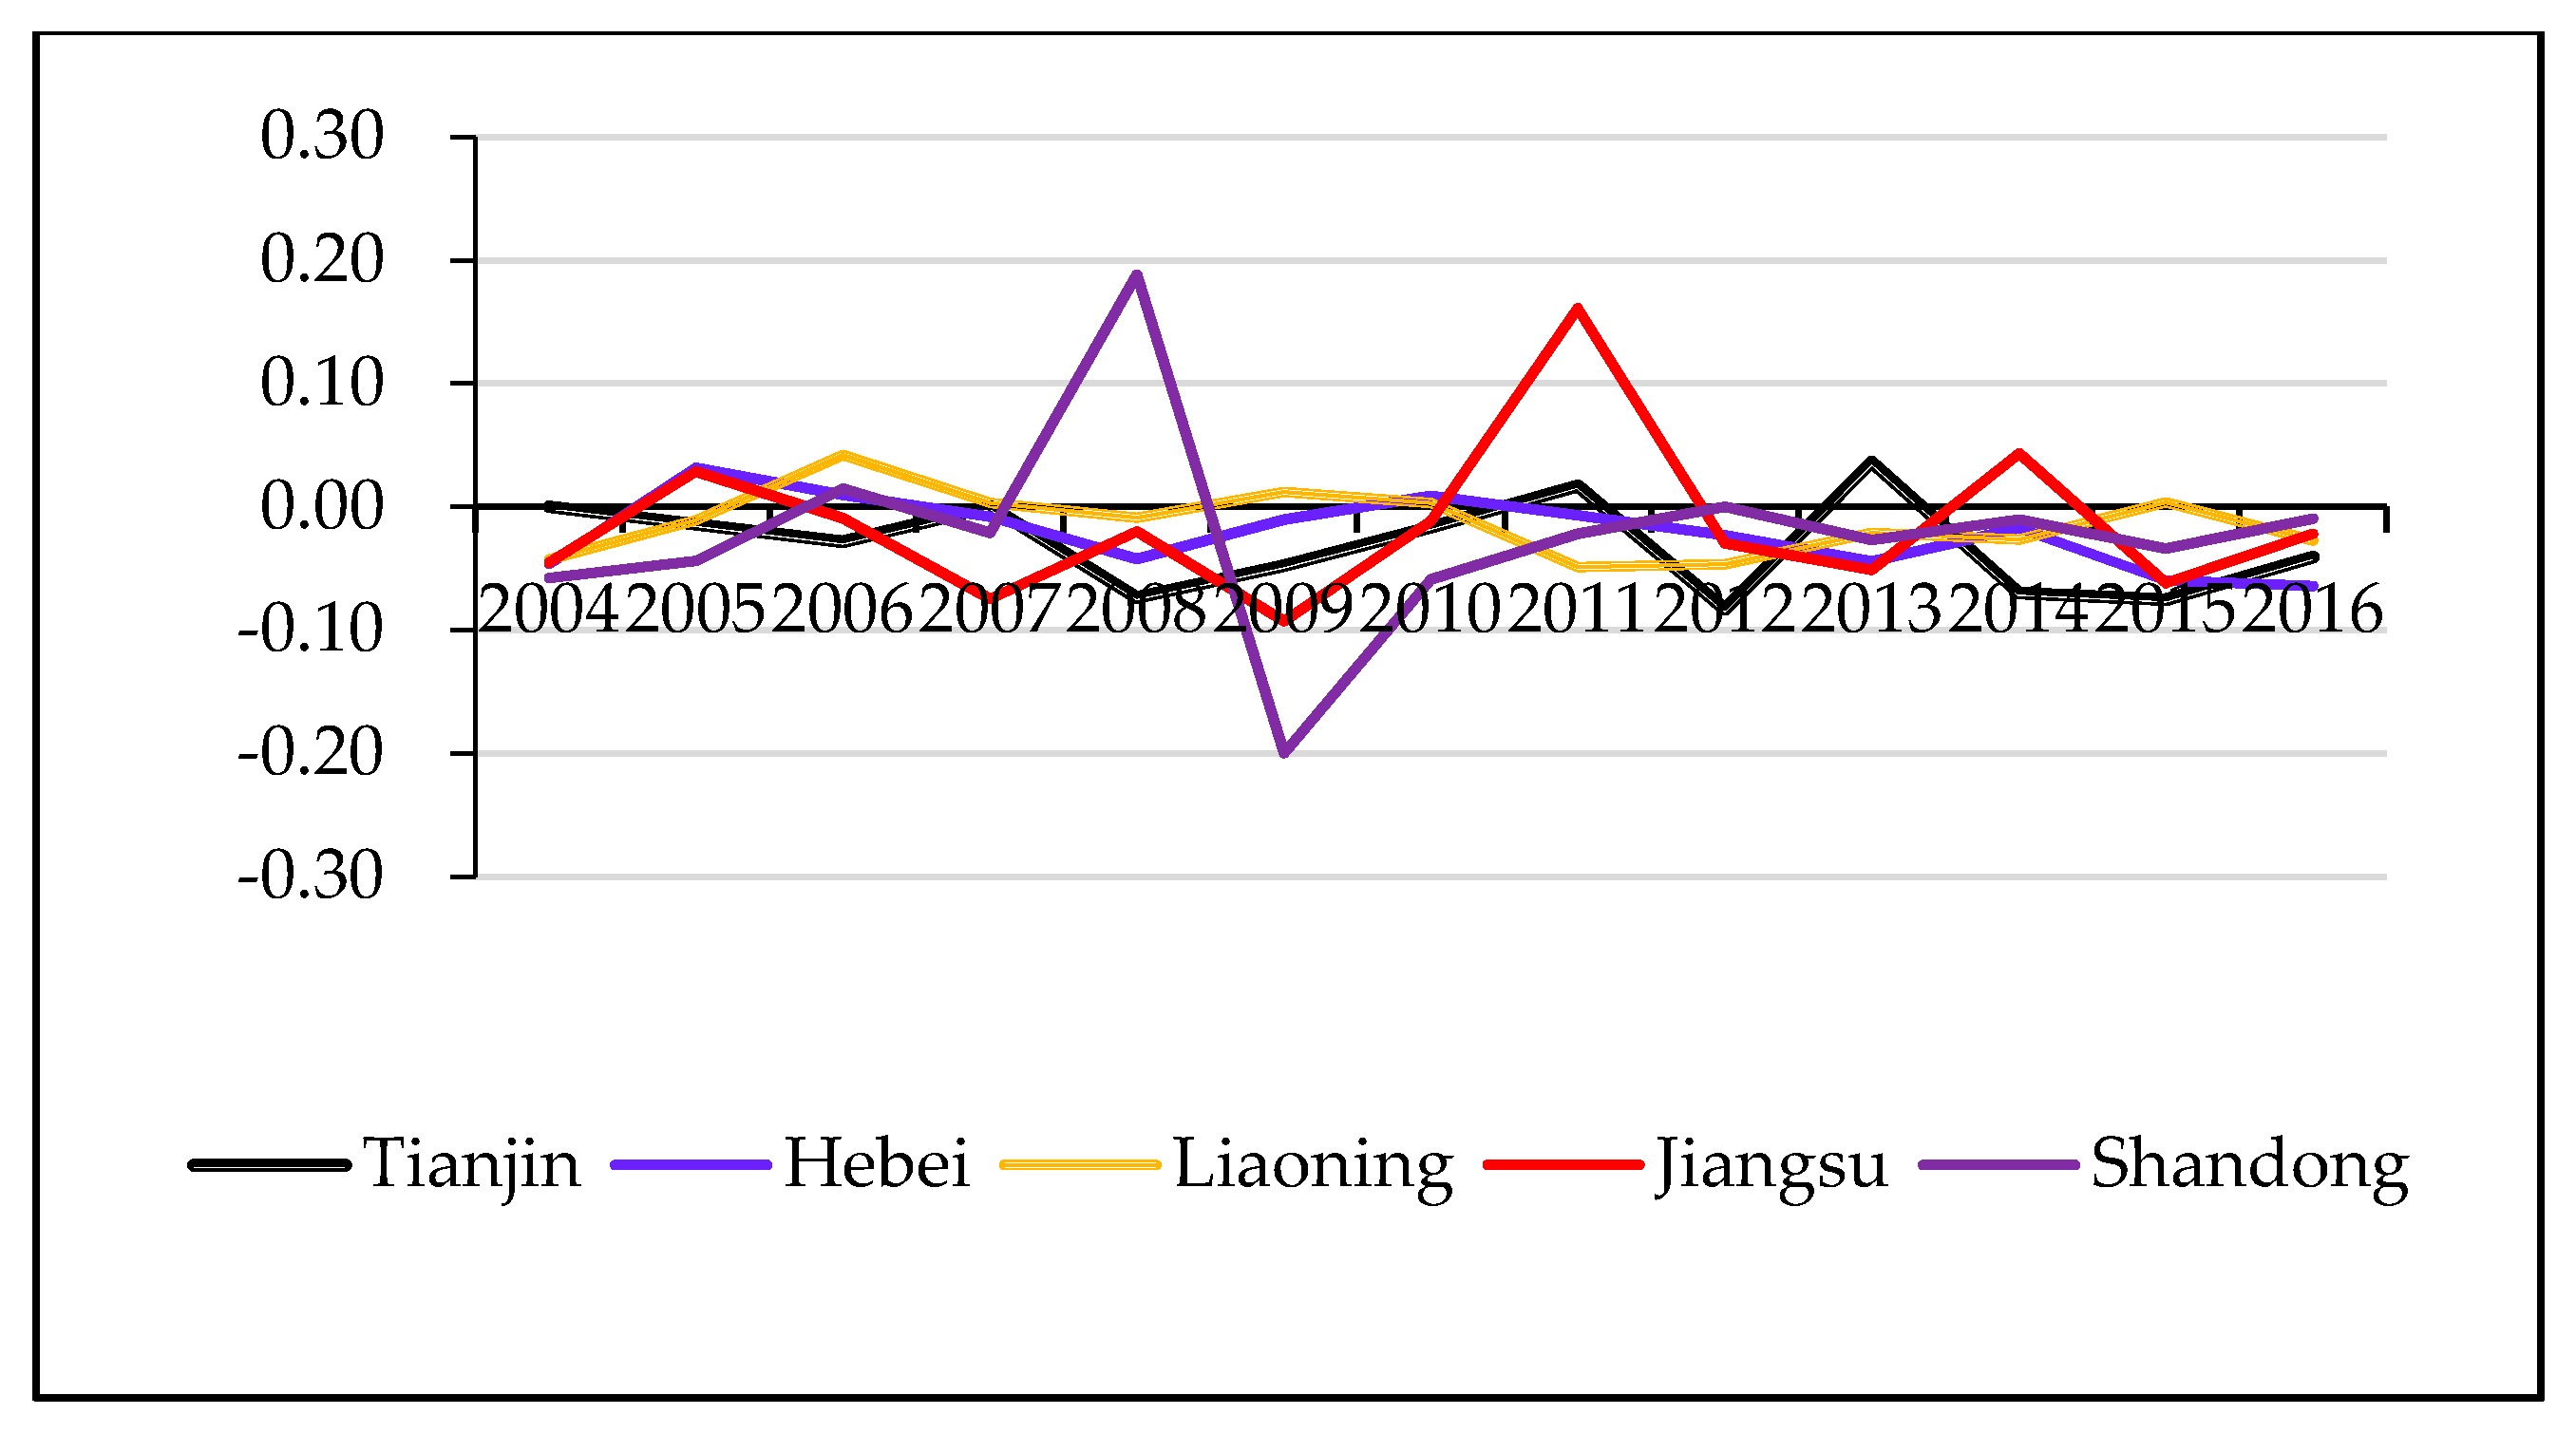
3.2.1. Temporal Variation Characteristics
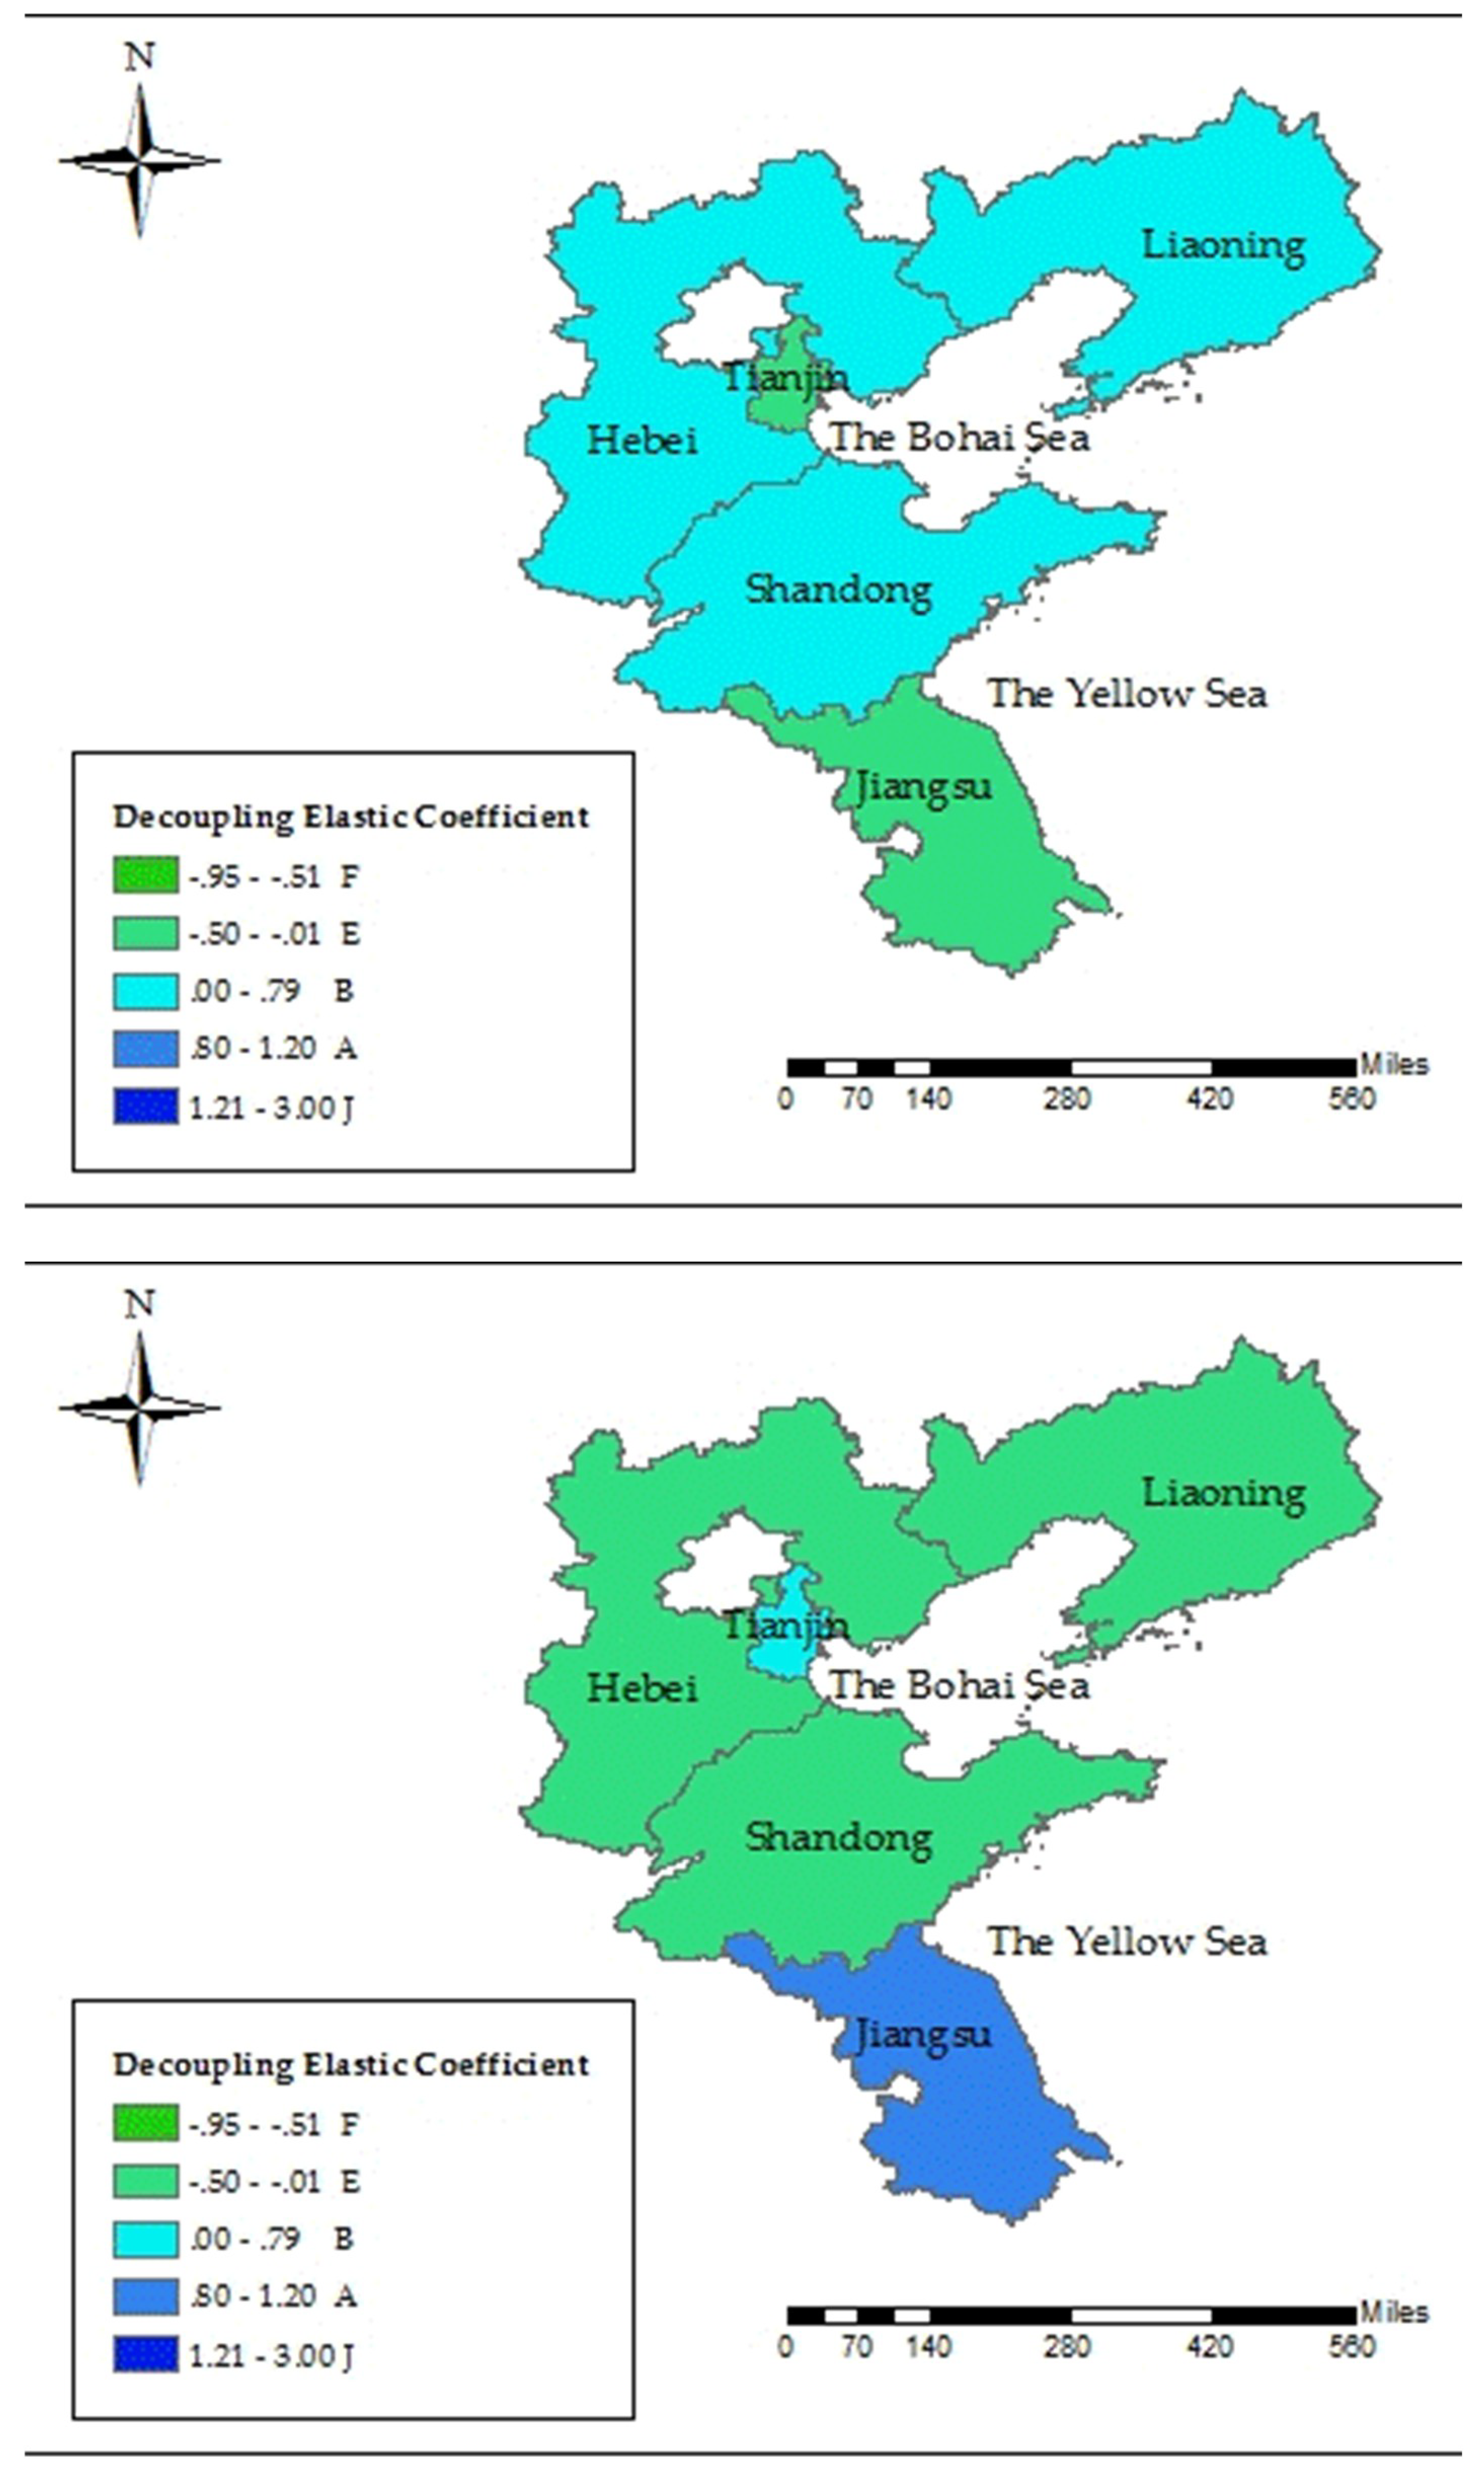
3.2.2. Spatial Difference Characteristics
4. Driving Factor Analysis
5. Policy Implication
- Innovation in the farmland management mode and readjustment of the crop planting structure. The coastal provinces and cities in the Yellow Sea and Bohai Sea utilize excessive amounts of water for agricultural production, and they have unreasonable crop planting structures. The existing crop planting structure needs to be rectified. Plausible measures include constructing farmland demonstration areas, drawing lessons of agricultural production methods from foreign countries, realizing modern farming practices through modern machineries/equipment, promoting the construction of modern ecological irrigation areas, popularizing high-efficiency water-saving technologies (such as sprinkler irrigation, micro-irrigation, low-pressure pipeline irrigation, and fully tap the potential of agricultural water-saving).
- Investment in water conservation public facilities, and the introduction of advanced equipment and expansion of effective irrigation area. Effective irrigation area is an important index to measure the degree of water conservation in agricultural production units and regions. Advanced irrigation technology can effectively save water resources and reduce groundwater consumption. The investment in water conservation public facilities would significantly improve water use efficiency, and should be an effective measure to promote water saving. We should also make full use of international coordination mechanism on groundwater consumption, introduce advanced water-saving technology and equipment from abroad, reduce groundwater consumption, and prevent seawater intrusion.
- Strengthen the government’s control of groundwater resources, establish and improve the agricultural water price mechanism, and establish the mechanism of precision subsidy for agricultural water use and water-saving incentive mechanisms. Surveys have shown that that large numbers and a wide distribution of groundwater users would restrict conventional management. In such case, management agencies should perform targeted management in accordance with the different types of users, strengthen groundwater management, and perhaps political intervention.
- Establishment of a better water resource supply structure, and optimization of water resource allocation. Under the sustainable development framework, it would be useful to adopt the water control policy of “water-saving priority and space balance”. In particular, we need to make efficient use of the south-to-north water diversion project, and establish a water resource allocation system to obtain desirable water quantity and quality outcomes. Plausible measures include encouraging the usage of unconventional water, building a highly efficient modern ecological water network, enhancing surface water allocation, prioritizing the usage of reclaimed water and surface water, reducing the groundwater consumption, and strengthening the management and protection of groundwater.
- Introduction of engineering techniques/methods to improve groundwater environment. These include improving and optimizing groundwater recharge technology, recirculating freshwater and improving the level of groundwater, constructing underground dams to prevent the loss of underground freshwater, and improving the groundwater environment through underground dam projects.
Author Contributions
Funding
Acknowledgments
Conflicts of Interest
References
- Wu, J.C.; Wu, Y.X.; Lin, J.; Han, J.B. Comprehensive prevention and management of seawater intrusion in the coastal area of the Yellow Sea and the Bohai Sea. Chin. J. Environ. Manag. 2018, 91–92. Available online: http://www.cnki.net/KCMS/detail/detail.aspx?QueryID=16&CurRec=1&filename=ZHGL201802017&dbname=CJFDLAST2018&dbcode=CJFQ&pr=&urlid=&yx=&v=MjI1ODIxTHV4WVM3RGgxVDNxVHJXTTFGckNVUkxLZVp1ZHRGeW5uV3IvQVB5WE1Zckc0SDluTXJZOUVZNFI4ZVg= (accessed on 12 November 2018). (in Chinese). [CrossRef] [PubMed]
- Shandong Marine Environmental Quality Bulletin. 2007. Available online: http://www.soa.gov.cn/lwzsj/yhsshyhjzlgb/2007nsds/201212/t20121212_22418.html (accessed on 30 June 2010).
- Liaoning Marine Environmental Quality Bulletin. 2007. Available online: http://www.soa.gov.cn/lwzsj/yhsshyhjzlgb/2007nlns/201212/t20121212_22447.html (accessed on 30 June 2010).
- China Marine Disaster Bulletin. 2013. Available online: http://www.soa.gov.cn/zwgk/hygb/zghyzhgb/201403/t20140318_31018.html (accessed on 19 March 2014).
- China Marine Disaster Bulletin. 2014. Available online: http://www.soa.gov.cn/zwgk/hygb/zghyzhgb/201503/t20150318_36388.html (accessed on 03 March 2015).
- China Marine Disaster Bulletin. 2015. Available online: http://www.soa.gov.cn/zwgk/hygb/zghyzhgb/201603/t20160324_50521.html (accessed on 24 March 2016).
- China Marine Disaster Bulletin. 2016. Available online: http://www.soa.gov.cn/zwgk/hygb/zghyzhgb/201703/t20170322_55290.html (accessed on 22 March 2017).
- Vehmas, J.; Kaivo-oja, J.; Luukkanen, J. Global Trends of Linking Environmental Stress and Economic Growth. Available online: https://www.utu.fi/fi/yksikot/ffrc/julkaisut/tutu-julkaisut/Documents/Tutu_2003-7.pdf (accessed on 8 November 2018).
- Indicators to Measure Decoupling of Environmental Pressure from Economic Growth. Available online: http://www.oecd.org/environment/indicators-modelling-outlooks/1933638.pdf (accessed on 8 November 2018).
- OECD. Environment Indicators-Development, Measurement and Use; Organisation for Economic Co-operation and Development: Paris, France, 2003; Volume 13. [Google Scholar]
- Tapio, P. Towards a theory of decoupling: Degrees of decoupling in the EU and the case of road traffic in Finland between 1970 and 2001. Transp. Policy 2005, 12, 137–151. [Google Scholar] [CrossRef]
- Zhang, C.; Cai, W.H.; Yu, T.S. Regional economic development and carbon productivity—A convergent and decoupling index analysis. China Ind. Econ. 2013, 18–30. Available online: http://www.cnki.net/KCMS/detail/detail.aspx?QueryID=62&CurRec=1&filename=GGYY201305001&dbname=CJFDLAST2015&dbcode=CJFQ&pr=&urlid=&yx=&v=MjU4NzFNcW85RlpZUjhlWDFMdXhZUzdEaDFUM3FUcldNMUZyQ1VSTEtlWnVkdEZ5bmdWNy9JSWlyU2Q3RzRIOUw= (accessed on 12 November 2018). (in Chinese).
- You, H.X.; Yue, J.G. Decoupling analysis of water resources and economic development in Jiangsu Province. J. Econ. Water Resour. 2015, 7, 13–79. [Google Scholar]
- Jia, S.F.; Zhang, S.F.; Yang, H.; Xia, J. Relation of industrial water use and economic development: Water use Kuznets Curve. J. Nat. Resour. 2004, 3, 279–284. [Google Scholar]
- Wu, D. Evaluation and prospect on the decoupling trend of economic development and water resource utilization in China. J. Nat. Resour. 2014, 1, 46–54. [Google Scholar]
- Han, W.Y.; Chen, X.P.; Zhang, Z.L. Research on relationship between urban water use and economic growth based on decoupling analysis theory. Bull. Soil Water Conserv. 2017, 140–145. Available online: http://www.cnki.net/KCMS/detail/detail.aspx?QueryID=77&CurRec=1&filename=STTB201705024&dbname=CJFDLAST2017&dbcode=CJFQ&pr=&urlid=&yx=&v=MTM3NzExVDNxVHJXTTFGckNVUkxLZVp1ZHRGeW5nVmJ2SU5qbmZiTEc0SDliTXFvOUhZSVI4ZVgxTHV4WVM3RGg= (accessed on 12 November 2018). (in Chinese).
- Yuan, Q.M.; Qiu, J.; Qin, C.C. Decoupling relationship and rebound effect between economic growth and the resource environment for Tianjin. Resour. Sci. 2014, 954–962. Available online: http://www.cnki.net/KCMS/detail/detail.aspx?QueryID=82&CurRec=1&filename=ZRZY201405009&dbname=CJFD2014&dbcode=CJFQ&pr=&urlid=&yx=&v=MDc5Nzc3L05Qei9SZDdHNEg5WE1xbzlGYllSOGVYMUx1eFlTN0RoMVQzcVRyV00xRnJDVVJMS2VadWR0RnluZ1c= (accessed on 12 November 2018). (in Chinese).
- Gai, M.; Hu, H.G.; Ke, L. Decoupling analysis between economic development and resources and environmental of the Yangtze River Delta. J. Nat. Resour. 2013, 28, 185–197. [Google Scholar]
- Ma, H.L.; Hou, Y.R.; Li, S.S. Decoupling relationship between industrial wastewater discharges and economic growth in regional differentiation of China. China Popul. Resour. Environ. 2017, 185–192. Available online: http://www.cnki.net/KCMS/detail/detail.aspx?QueryID=90&CurRec=1&filename=ZGRZ201711020&dbname=CJFDLAST2017&dbcode=CJFQ&pr=&urlid=&yx=&v=MzExMjRSTEtlWnVkdEZ5bmhVcjdCUHlyWmRMRzRIOWJOcm85SFpJUjhlWDFMdXhZUzdEaDFUM3FUcldNMUZyQ1U= (accessed on 12 November 2018). (in Chinese).
- Li, Y. Decoupling Water Consumption and Environmental Impact on China’s Textile Industrial Economic Growth. Master’s Thesis, Zhejiang Sci-Tech University, Hangzhou, China, 2018. [Google Scholar]
- Zhang, F.; Song, X.N.; Xue, H.F.; Dong, H.Z. Decoupling relationship and dynamic response between industrial water intensity, environmental regulation and technological progress. China Popul. Resour. Environ. 2017, 193–201. Available online: http://www.cnki.net/KCMS/detail/detail.aspx?QueryID=102&CurRec=1&filename=ZGRZ201711021&dbname=CJFDLAST2017&dbcode=CJFQ&pr=&urlid=&yx=&v=MDY0ODhIOWJOcm85SFpZUjhlWDFMdXhZUzdEaDFUM3FUcldNMUZyQ1VSTEtlWnVkdEZ5bmhVNy9OUHlyWmRMRzQ= (accessed on 12 November 2018). (in Chinese).
- Li, Y.; Lu, L.Y.; Tan, Y.X.; Wang, L.L.; Shen, M.H. Decoupling water consumption and environmental impact on textile industry by using water footprint method: A case study in China. Water 2017, 9, 124. [Google Scholar] [CrossRef]
- Li, N.; Sun, T. Environmental regulation, water environmental pressure and economic growth—Based on the decomposition of Tapio decoupling elasticity. Sci. Technol. Manag. Res. 2016, 258–262. Available online: http://www.cnki.net/KCMS/detail/detail.aspx?QueryID=110&CurRec=1&filename=KJGL201604047&dbname=CJFDLAST2016&dbcode=CJFQ&pr=&urlid=&yx=&v=MDI5NTk4ZVgxTHV4WVM3RGgxVDNxVHJXTTFGckNVUkxLZVp1ZHRGeW5oVjcvSkxpZk1Zckc0SDlmTXE0OUJZNFI= (accessed on 12 November 2018). (in Chinese).
- Pan, A.E.; Chen, L. Decoupling and water footprint analysis of the coordinated development between water utilization and the economy in Hubei. Resour. Sci. 2014, 36, 328–329. [Google Scholar]
- Guo, C.X. An analysis of the increase of CO2 emission in China—Based on SDA Technique. China Ind. Econ. 2010, 47–56. Available online: http://www.cnki.net/KCMS/detail/detail.aspx?QueryID=114&CurRec=1&filename=GGYY201012006&dbname=CJFD2010&dbcode=CJFQ&pr=&urlid=&yx=&v=MjU3MzVoVjd2SklpclNkN0c0SDlITnJZOUZZb1I4ZVgxTHV4WVM3RGgxVDNxVHJXTTFGckNVUkxLZVp1ZHRGeW4= (accessed on accessed on 12 November 2018). (in Chinese).
- Su, B.; Ang, B.W. Structural decomposition analysis applied to energy and emissions: Some methodological developments. Energy Econ. 2012, 28, 177–188. [Google Scholar] [CrossRef]
- Yan, Y.F.; Yang, L.K. China’s foreign trade and climate change: A case study of CO2 emissions. Energy Policy 2010, 38, 350–356. [Google Scholar]
- Zhao, Z.Y.; Guo, C.F. The decomposition analysis on the driving factors of China’s carbon emission. China Soft Sci. 2012, 6, 175–183. [Google Scholar]
- Fan, T.J.; Luo, R.L.; Fan, Y.D.; Zhang, L.L.; Chang, X.Y. Study on influence factors for carbon dioxide emissions in China’s chemical industry with LMDI method. China Soft Sci. 2013, 3, 166–174. [Google Scholar]
- Zhao, C.; Chen, B. Driving force analysis of the agricultural water footprint in China based on the LMDI method. Environ. Sci. Technol. 2014, 48, 12723–12731. [Google Scholar] [CrossRef] [PubMed]
- Yang, L.J.; Wu, W.; Su, Q.; Du, Z.P.; Jiang, X.W. Carbon emissions of transportation energy consumption and its decoupling analysis in Jiangsu Province. Resour. Environ. Yangtze Basin 2014, 23, 1383–1390. [Google Scholar]
- Zou, M.Z.; Kang, S.Z.; Niu, J.; Lu, H.N. A new technique to estimate regional irrigation water demand and driving factor effects using an improved SWAT model with LMDI factor decomposition in an arid basin. J. Clean. Prod. 2018, 185, 814–828. [Google Scholar] [CrossRef]
- Wang, X. Impacts of social and economic factors on water environment pressure in Beijing based on STIRPAT model. Environ. Sci. Technol. 2015, 38, 48–52. [Google Scholar]
- He, X.G.; Zhang, Y.H. Influence factors and environmental Kuznets curve relink effect of Chinese industry’ s carbon dioxide emission—Empirical research based on STIRPAT model with industrial dynamic panel data. China Ind. Econ. 2012, 1, 26–35. [Google Scholar]
- Fan, Y.; Liu, L.C.; Wu, G.; Wei, Y.M. Analyzing impact factors of CO2 emissions using the STIRPAT model. Environ. Impact Assess. Rev. 2006, 26, 377–395. [Google Scholar] [CrossRef]
- China Environmental Statistics Yearbook; China Statistics Press: Beijing, China, 2004–2017.
- Diakoulaki, D.; Mandaraka, M. Decomposition analysis for assessing the progress in decoupling industrial growth from CO2 emissions in the EU manufacturing sector. Energy Econ. 2007, 29, 636–664. [Google Scholar] [CrossRef]
- Salahuddin, M.; Gow, J. Economic growth, energy consumption and CO2 emissions in Gulf Cooperation Council countries. Energy 2014, 73, 44–58. [Google Scholar] [CrossRef]
- Zhong, X.J.; Long, S.B. Rethinking the environmental impact of the IPAT model. China Popul. Resour. Environ. 2016, 3, 61–68. [Google Scholar]
- Waggoner, P.E.; Ausubel, J.H. A framework for sustainability science: A renovated IPAT identity. Proc. Natl. Acad. Sci. USA 2002, 99, 7860–7865. [Google Scholar] [CrossRef] [PubMed] [Green Version]
- Diets, T.; Rosa, E.A. Rethinking the environment impact of population, affluence and technology. Hum. Econ. Rev. 1994, 1, 277–300. [Google Scholar]
- Diets, T.; Rosa, E.A. Effects of population and affluence on CO2 emissions. Ecology 1997, 94, 175–179. [Google Scholar] [CrossRef]
- Qi, S.Z.; Lin, S.; Wang, B.B. Impact of economic growth pattern of the six provinces of central China on regional Carbon Emission: Based on the Tapio Model and Lag Instrumental Variable Analysis of Panel Data. China Popul. Resour. Environ. 2015, 59–66. Available online: http://www.cnki.net/KCMS/detail/detail.aspx?QueryID=118&CurRec=1&filename=ZGRZ201505008&dbname=CJFDLAST2015&dbcode=CJFQ&pr=&urlid=&yx=&v=MTUzNDhadWR0RnluaFZMM09QeXJaZExHNEg5VE1xbzlGYklSOGVYMUx1eFlTN0RoMVQzcVRyV00xRnJDVVJMS2U= (accessed on 12 November 2018). (in Chinese).
- Wu, D. An analysis of evolution trend and decoupling evaluation mechanism of economic development and water resource utilization in China based on comparative analysis of China and America. J. Hohai Univ. (Philos. Soc. Sci.) 2016, 18, 47–91. [Google Scholar]
- Tong, J.P.; Ma, J.F.; Liu, G.F. Analysis of variations and factors of water use amount per ten thous and Yuan GDP in China based on a complete decomposition model. Resour. Sci. 2010, 33, 1870–1876. [Google Scholar]
- Lin, B.Q.; Jiang, Z.J. Environmental Kuznets Curve prediction and influencing factors analysis of carbon dioxide in China. Manag. World 2009, 27–36. Available online: https://www.researchgate.net/publication/285853566_Environmental_Kuznets_curve_prediction_and_influence_factors_analysis_of_Chinas_carbon_emissions (accessed on 12 November 2018). (in Chinese).
- Zhang, P.; Zhang, P.P.; Cai, G.Q. Comparative study on impacts of different types of environmental regulation on enterprise technological innovation. China Popul. Resour. Environ. 2016, 4, 8–13. [Google Scholar] [CrossRef] [PubMed]
- China Statistical Yearbook. Available online: http://www.stats.gov.cn/tjsj/ndsj/ (accessed on 9 November 2018).
- China Environmental Yearbook. Available online: http://www.stats.gov.cn/ztjc/ztsj/hjtjzl/ (accessed on 9 November 2018).
- National Economic and Social Development Report. Available online: http://www.shandong.gov.cn/art/2013/4/2/art_2188_55810.html (accessed on 9 November 2018).
- An, S.X. A research on the path of promoting high-quality economic development: A literature Review. Contemp. Econ. Manag. 2018, 40, 11–17. [Google Scholar]
- Wang, M.J. How to recognize China’s economy shifting to high quality development stage—China’s Macroeconomic Research Institute studies and implements the report of the party’s 19th National Spirit Series Seminar. China Econ. Trade Her. 2018, pp. 63–68. Available online: http://www.cnki.net/KCMS/detail/detail.aspx?QueryID=163&CurRec=25&filename=ZJMD201801029&dbname=CJFDLAST2018&dbcode=CJFQ&pr=&urlid=&yx=&v=MjMzMDR1eFlTN0RoMVQzcVRyV00xRnJDVVJMS2VadWR0Rnlqa1ZML01QeWZHYXJHNEg5bk1ybzlIYllSOGVYMUw= (accessed on 12 November 2018). (in Chinese).
- Ren, B.P. Theoretical interpretation and practical orientation of China’s economy from high speed growth to high quality development in new era. Acad. Mon. 2018, 50, 66–74. [Google Scholar]
- Wang, M.; Gao, L. On Dawworth: High quality growth is a pressing issue. China Enterprise News. Available online: http://m.ccidnet.com/pcarticle/2767977 (accessed on 9 November 2018).
- Xu, C. Analysis of the causes of economic recession in Liaoning Province from the demand side. Times Finance 2018, 5, 120–121. [Google Scholar]
- The Eleventh Five-Year Plan. Available online: http://www.gov.cn/gongbao/content/2006/content_268766.htm (accessed on 14 March 2006).
- Shandong Water Resources Bulletin. 2016. Available online: http://www.shandong.gov.cn/art/2017/2010/2013/art_2529_10801.html (accessed on 13 October 2017).
- The Twelve Five-Year Plan. Available online: http://finance.people.com.cn/GB/14164290.html (accessed on 17 March 2011).
- The Thirteenth Five-Year Plan. Available online: http://www.xinhuanet.com//politics/2016lh/2016-03/17/c_1118366322.htm (accessed on 17 March 2016).
- Akiyama, T.; Kharrazi, A.; Li, J.; Avtar, R. Agricultural water policy reforms in China: A representative look at Zhangye City, Gansu Province, China. Environ. Monit. Assess. 2017, 190, 9. [Google Scholar] [CrossRef] [PubMed]


| Decoupling Type | Δ | Δ | Decoupling Elasticity Index | Decoupling Timing Discrimination |
|---|---|---|---|---|
| Relative decoupling | Increase | Increase | >1.2 | Expansion relative negative decoupling (A) |
| Increase | Increase | 0 ≤ e < 0.8 | Expansion relative decoupling (B) | |
| Decline | Decrease | >1.2 | Declining relative decoupling (C) | |
| Decline | Decrease | 0 ≤ e < 0.8 | Declining relative negative decoupling (D) | |
| Absolute decoupling | Increase | Decrease | −0.5 ≤ e < 0 | Expansion weak absolute decoupling (E) |
| Increase | Decrease | <−0.5 | Extended strong absolute decoupling (F) | |
| Decline | Increase | −0.5 ≤ e < 0 | Declining weak absolute negative decoupling (G) | |
| Decline | Increase | <−0.5 | Declining strong absolutely negative decoupling (H) | |
| Connection | Increase | Increase | 0.8 ≤ e ≤ 1.2 | Expansion connection (I) |
| Decline | Decrease | 0.8 ≤ e ≤ 1.2 | Recession connection (J) |
| Year | GDP Growth Rate | U Growth Rate | Elastic Value | Decoupling State |
|---|---|---|---|---|
| 2004 | 0.1441 | −0.048 | −0.336 | Expansion weak absolute decoupling (E) |
| 2005 | 0.1421 | −0.0006 | −0.004 | Expansion weak absolute decoupling (E) |
| 2006 | 0.1443 | 0.0158 | 0.110 | Expansion relative decoupling (B) |
| 2007 | 0.1439 | −0.0116 | −0.081 | Expansion weak absolute decoupling (E) |
| 2008 | 0.1238 | 0.0315 | 0.255 | Expansion relative decoupling (B) |
| 2009 | 0.1231 | −0.073 | −0.591 | Extended strong absolute decoupling (F) |
| 2010 | 0.1303 | −0.013 | −0.099 | Expansion weak absolute decoupling (E) |
| 2011 | 0.1157 | −0.0024 | −0.134 | Expansion weak absolute decoupling (E) |
| 2012 | 0.1011 | −0.035 | −0.220 | Expansion weak absolute decoupling (E) |
| 2013 | 0.0946 | −0.0338 | −0.357 | Expansion weak absolute decoupling (E) |
| 2014 | 0.0803 | −0.0163 | −0.203 | Expansion weak absolute decoupling (E) |
| 2015 | 0.0735 | −0.0405 | −0.550 | Extended strong absolute decoupling (F) |
| 2016 | 0.0627 | −0.039 | −0.629 | Extended strong absolute decoupling (F) |
| Year | Tianjin | Hebei | Liaoning | Jiangsu | Shandong | |||||
|---|---|---|---|---|---|---|---|---|---|---|
| Elastic Value | Decoupling State | Elastic Value | Decoupling State | Elastic Value | Decoupling State | Elastic Value | Decoupling State | Elastic Value | Decoupling State | |
| 2004 | 0.00 | B | −0.36 | E | −0.33 | E | −0.31 | E | −0.38 | E |
| 2005 | −0.10 | E | 0.24 | B | −0.09 | E | 0.20 | B | −0.29 | E |
| 2006 | −0.20 | E | 0.07 | B | 0.30 | B | −0.06 | E | 0.10 | B |
| 2007 | 0.00 | B | −0.06 | E | 0.02 | B | −0.50 | F | −0.15 | E |
| 2008 | −0.45 | E | −0.42 | E | −0.07 | E | −0.16 | E | 1.57 | A |
| 2009 | −0.29 | E | −0.10 | E | 0.09 | B | −0.75 | F | −1.64 | F |
| 2010 | −0.10 | E | 0.07 | B | 0.02 | B | −0.09 | E | −0.48 | E |
| 2011 | 0.10 | B | −0.06 | E | −0.40 | E | 1.46 | A | −0.20 | E |
| 2012 | −0.60 | F | −0.24 | E | −0.49 | E | 0.29 | B | 0.00 | B |
| 2013 | 0.29 | B | −0.54 | F | −0.24 | E | −0.53 | F | −0.28 | E |
| 2014 | −0.70 | F | −0.27 | E | −0.46 | E | 0.49 | B | −0.12 | E |
| 2015 | −0.81 | F | −0.88 | F | 0.11 | B | −0.73 | F | −0.42 | E |
| 2016 | −0.45 | E | −0.95 | F | 1.09 | J | −0.28 | E | −0.13 | E |
| Explanatory Variables | Model 1 | Model 2 | Model 3 | Model 4 | Model 5 |
|---|---|---|---|---|---|
| 0.682 *** | 1.432 *** | 6.569 *** | 6.551 *** | 2.749*** | |
| (0.070) | (0.227) | (0.468) | (0.474) | (0.517) | |
| −0.198 *** | 0.003 | 1.403 *** | 1.392 *** | 1.030 *** | |
| (0.103) | (0.033) | (0.138) | (0.142) | (0.100) | |
| −1.620 *** | −1.760 *** | −0.520 *** | −0.532 | −2.328 *** | |
| (0.117) | (0.116) | (0.127) | (0.131) | (0.215) | |
| −0.903 *** | −3.986 *** | −3.981 *** | −2.471 *** | ||
| (0.262) | (0.308) | (0.310) | (0.260) | ||
| −5.067 *** | −5.036 *** | −2.101 *** | |||
| (0.444) | (0.455) | (0.436) | |||
| 0.032 | −0.007 | ||||
| (0.088) | (0.057) | ||||
| 0.056 *** | |||||
| (0.006) | |||||
| Constant term | 17.276 *** | 24.371 *** | 130.575 *** | 130.100 *** | 73.508 *** |
| (0.455) | (2.105) | (9.376) | (9.533) | (8.740) | |
| 131.504 | 119.106 | 326.837 | 268.394 | 566.286 | |
| 0.866 | 0.888 | 0.965 | 0.965 | 0.986 | |
| Sample number | 65 | 65 | 65 | 65 | 65 |
© 2018 by the authors. Licensee MDPI, Basel, Switzerland. This article is an open access article distributed under the terms and conditions of the Creative Commons Attribution (CC BY) license (http://creativecommons.org/licenses/by/4.0/).
Share and Cite
Qiu, L.; Huang, J.; Niu, W. Decoupling and Driving Factors of Economic Growth and Groundwater Consumption in the Coastal Areas of the Yellow Sea and the Bohai Sea. Sustainability 2018, 10, 4158. https://doi.org/10.3390/su10114158
Qiu L, Huang J, Niu W. Decoupling and Driving Factors of Economic Growth and Groundwater Consumption in the Coastal Areas of the Yellow Sea and the Bohai Sea. Sustainability. 2018; 10(11):4158. https://doi.org/10.3390/su10114158
Chicago/Turabian StyleQiu, Lei, Jingyi Huang, and Wenjuan Niu. 2018. "Decoupling and Driving Factors of Economic Growth and Groundwater Consumption in the Coastal Areas of the Yellow Sea and the Bohai Sea" Sustainability 10, no. 11: 4158. https://doi.org/10.3390/su10114158
APA StyleQiu, L., Huang, J., & Niu, W. (2018). Decoupling and Driving Factors of Economic Growth and Groundwater Consumption in the Coastal Areas of the Yellow Sea and the Bohai Sea. Sustainability, 10(11), 4158. https://doi.org/10.3390/su10114158