4.1. Patterns of Jobs Reallocation
During the observed period 2000–2015, there have been some important changes in the labor market in Europe.
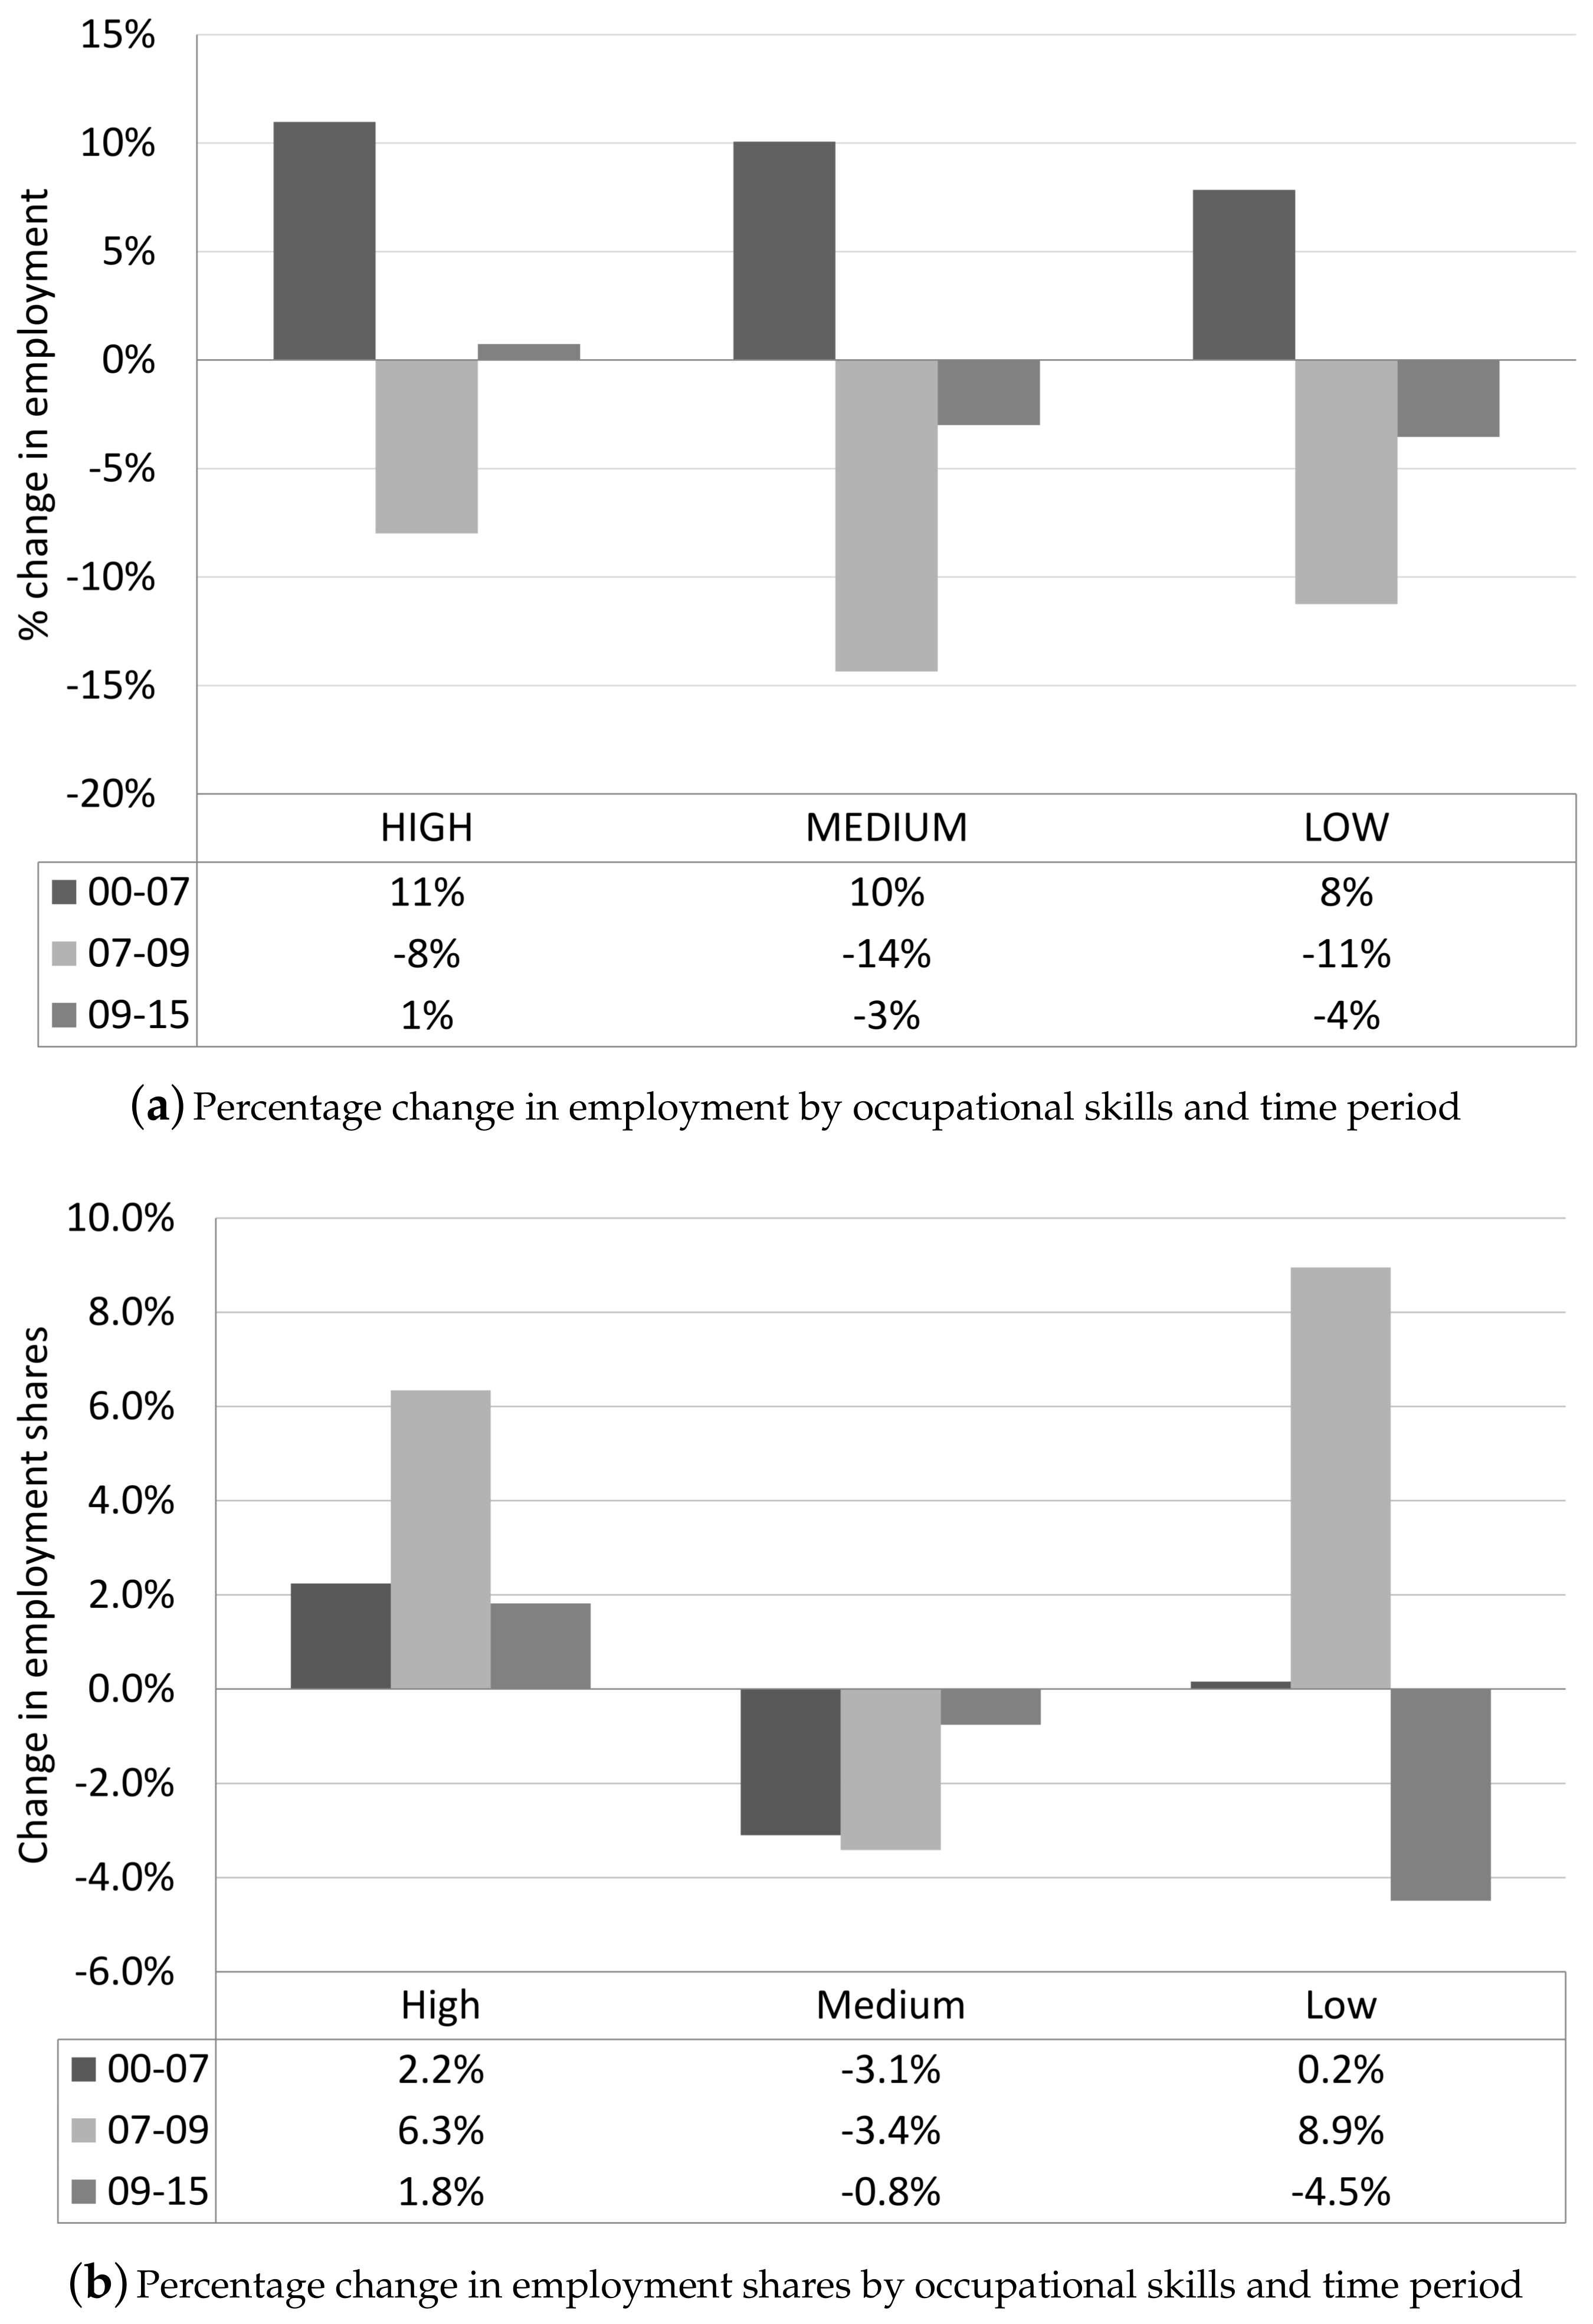
Figure 1a shows the percentage growth in total employment by occupational skills before, during and after the crisis.
Overall, in all three categories of occupational skill, the employment has suffered the consequences of the crisis and is currently under recovery. However, employment in high-skill jobs grew by 1 percent during the period 2009–2015, outpacing the employment change in medium- and low-skill jobs, which are still picking up.
Figure 1b confirms that, in the last period (2009–2015), employment expanded mainly at the top of the occupational hierarchy, among managers and professionals.
The evidence of job polarization in Europe and U.S.—jobs concentrated in relatively high-skill jobs and low-skill jobs—reported by previous studies [
7,
9] seems to match only the period 2000–2009 of our sample, where the U-shaped employment shares growth is evident. However, the more recent data presented in this paper shows that, in the last period (2009–2015), Europe has increased its employment of skilled workers at the expense of job opportunities for middle and low skilled workers, pointing to skill upgrading rather than polarization.
Hence, the rigid technological argument of polarization, where machines are a substitute for labor in the middle of the employment structure, does not fit with the evidence based on the most recent data presented here. Moreover,
Table 2 and
Table 3 show that there is more than one pattern across countries and sectors, suggesting that technology may not be the sole driving force of structural employment change. The work of [
26] emphasizes the structuring effect of institutional frameworks, which is largely neglected in the polarization arguments. Indeed, institutions like unions and employment protection legislation can make labor markets less responsive to technological changes. State regulation also has a direct effect on labor market composition, as it may create or reallocate jobs within certain occupations, whose function depends on politically defined social needs.
Examining the changes in employment shares by country (
Table 2), we find the emergence of two main patterns of employment reallocation, namely skill upgrading and polarization. Skill upgrading occurs when employment shares in medium- and low-skill jobs decrease over the period 2000–2015, while that of high-skill employment increase. Skill polarization is the situation where the relative share of middling jobs falls, while high- and low-skill employment shares increase.
Table 2 reports the initial averages (in 2000) and the percentage point changes between 2000 and 2015 of the employment shares in high-, medium- and low-skill occupations by country and by patterns of job reallocation. Overall, the changes in employment structure, via polarization or skill upgrading, vary considerably across countries in the European Economic Area. For example, while the Netherlands, Ireland and Slovakia had little to no change in their labor market composition, countries like Norway, Luxembourg, Portugal, Iceland and Slovenia experienced drastic changes.
Table 3 shows the within and between industry differences in employment shares. Differently from other studies, we investigate the changes in the shares of skilled, unskilled and middling employment within sectors, and categorize them into patterns of restructuring. Skill upgrading sectors are information and communication, financial and insurance services, construction, and public administration. The sector of information and communication, in particular, has undergone a radical face-lift, going from being a sector with predominantly middle-skill workers, to becoming a high-skill sector with a high-skill employment share of 82% in 2015. Polarizing sectors such as the manufacturing one are undergoing an important transformation. On the one hand, the computerization of manufacturing, the inclusion of new advanced materials and technologies, and the current trend of automation and data exchange in manufacturing technologies increased the demand for high skilled workers. On the other hand, the international fragmentation of the production processes within vertically integrated manufacturing industries generally involves the relocation of unskilled labor-intensive production to countries where labor costs are relatively low. At the same time, it retains the production activities that require domestic high skills. Mining and quarrying, and electricity and gas are also skill polarizing sectors, as they have lost between 4.1 and 31.6 percentage points of the share of middling occupations.
In addition to skill upgrading and polarization patterns, we identify two additional trends, which we called skill ‘midgrading’ and ‘downgrading’. Skill midgrading is defined as a situation where the share of middle skill employment increases, while both the shares of high and low skill jobs decrease or remain unchanged. Real estate, education, technical, professional, and other services belong to this group of sectors. These sectors are characterized by large shares of high-skill occupations (apart from other service). Possibly as a consequence of national investment in high-quality education and training, there has been a redistribution from low-skill to middle-skill jobs, as the share of high-skill employment dropped less than the shares of low-skill workers. Moreover, the middle skill jobs in these sectors may be less susceptible to machine replacement, given the relevant non-routinized human component of jobs such as teachers and instructors, legal advisors and representatives, or real estate advisors.
Sectors with a trend of increasing low-skill employment share are business support services, wholesale and retail, accommodation and food services, agriculture, transport and storage, and water supply and waste management. These sectors are characterized by a relatively large initial average share of medium-skill employment, but they are also some of the sectors that have the highest proportion of jobs facing potential high risks of automation, especially accommodation and food services. In addition, the sector of water and waste management has suffered the negative effect of environmental reforms and climate change, which reduced water availability and intensified competition for water among users, leading to a reduction of job opportunities [
54].
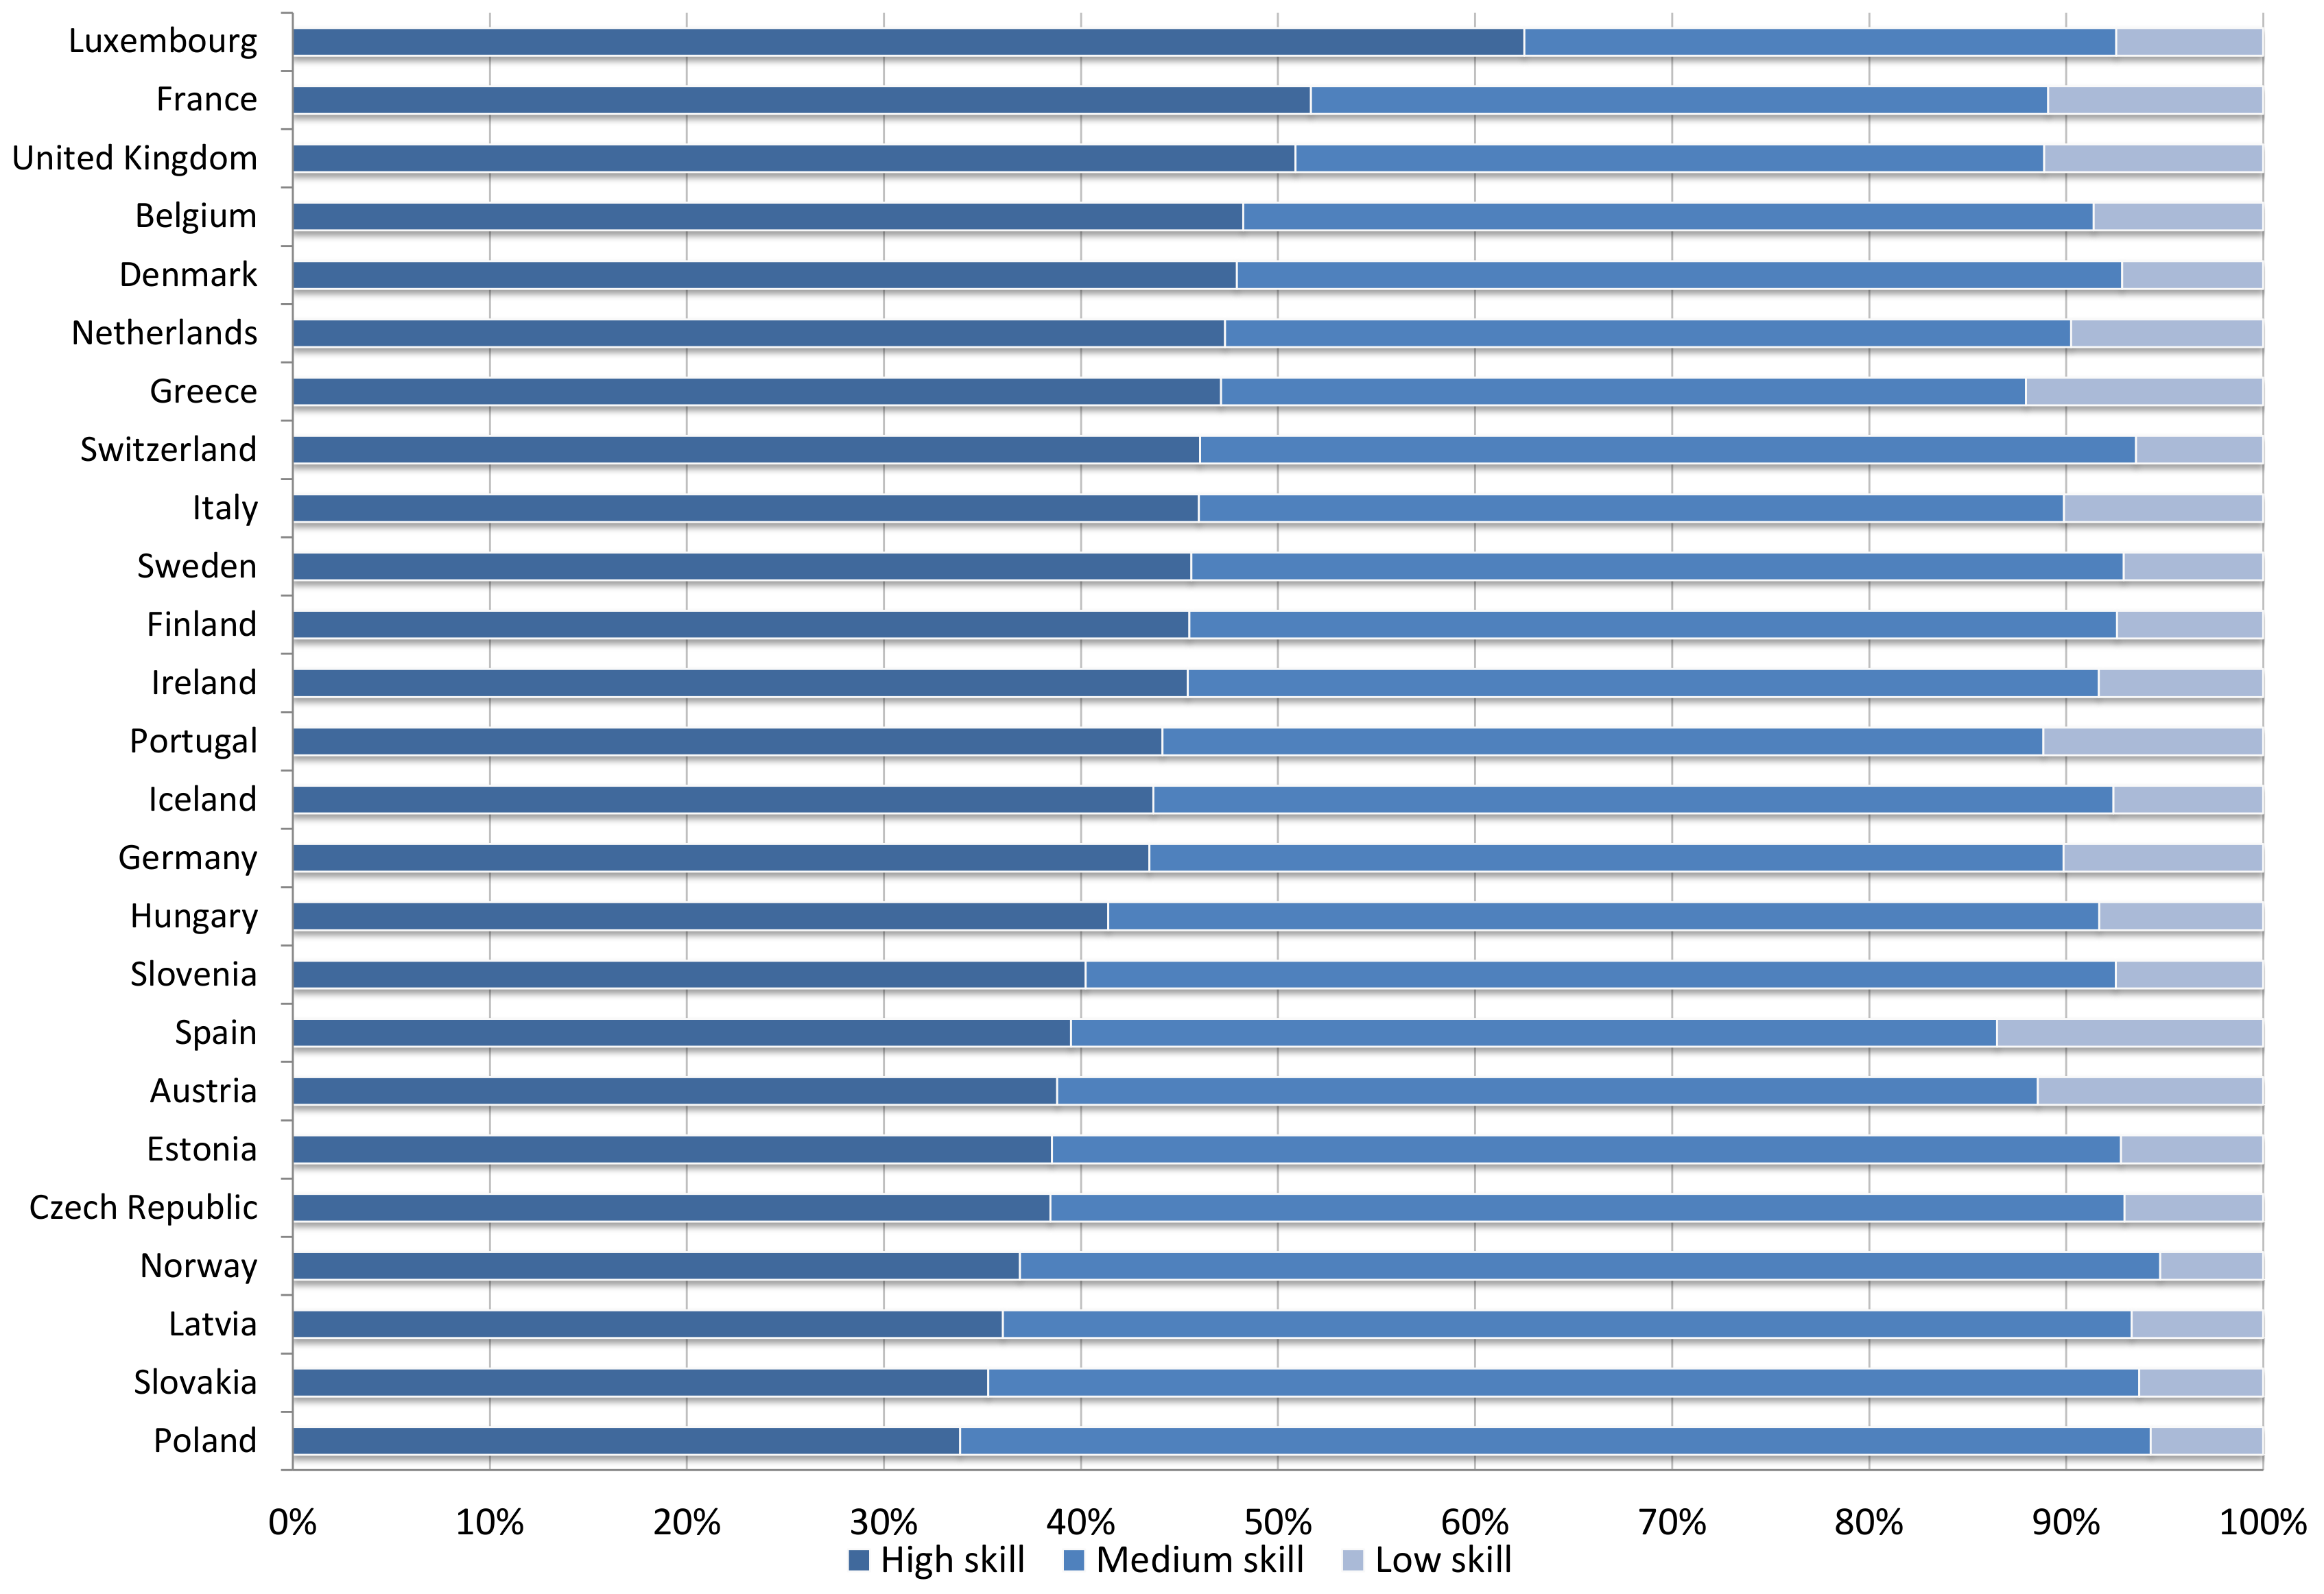
To connect the evidence on country and sectoral pattern of jobs reallocation,
Figure 2 and
Figure 3 show the shares of value added by group of sectors and country.
Figure 2 lists the countries in order of value added in sectors with the largest shares of high skill employment. (Sectors are defined “high skill” if they have at least an average of 50 percent employment in high skill occupations, “medium skill” if they have at least 50 percent employment in medium skill jobs and less than 10 percent in low skill occupations, “low skill” if they have at least 10 percent of low skill employment share.)
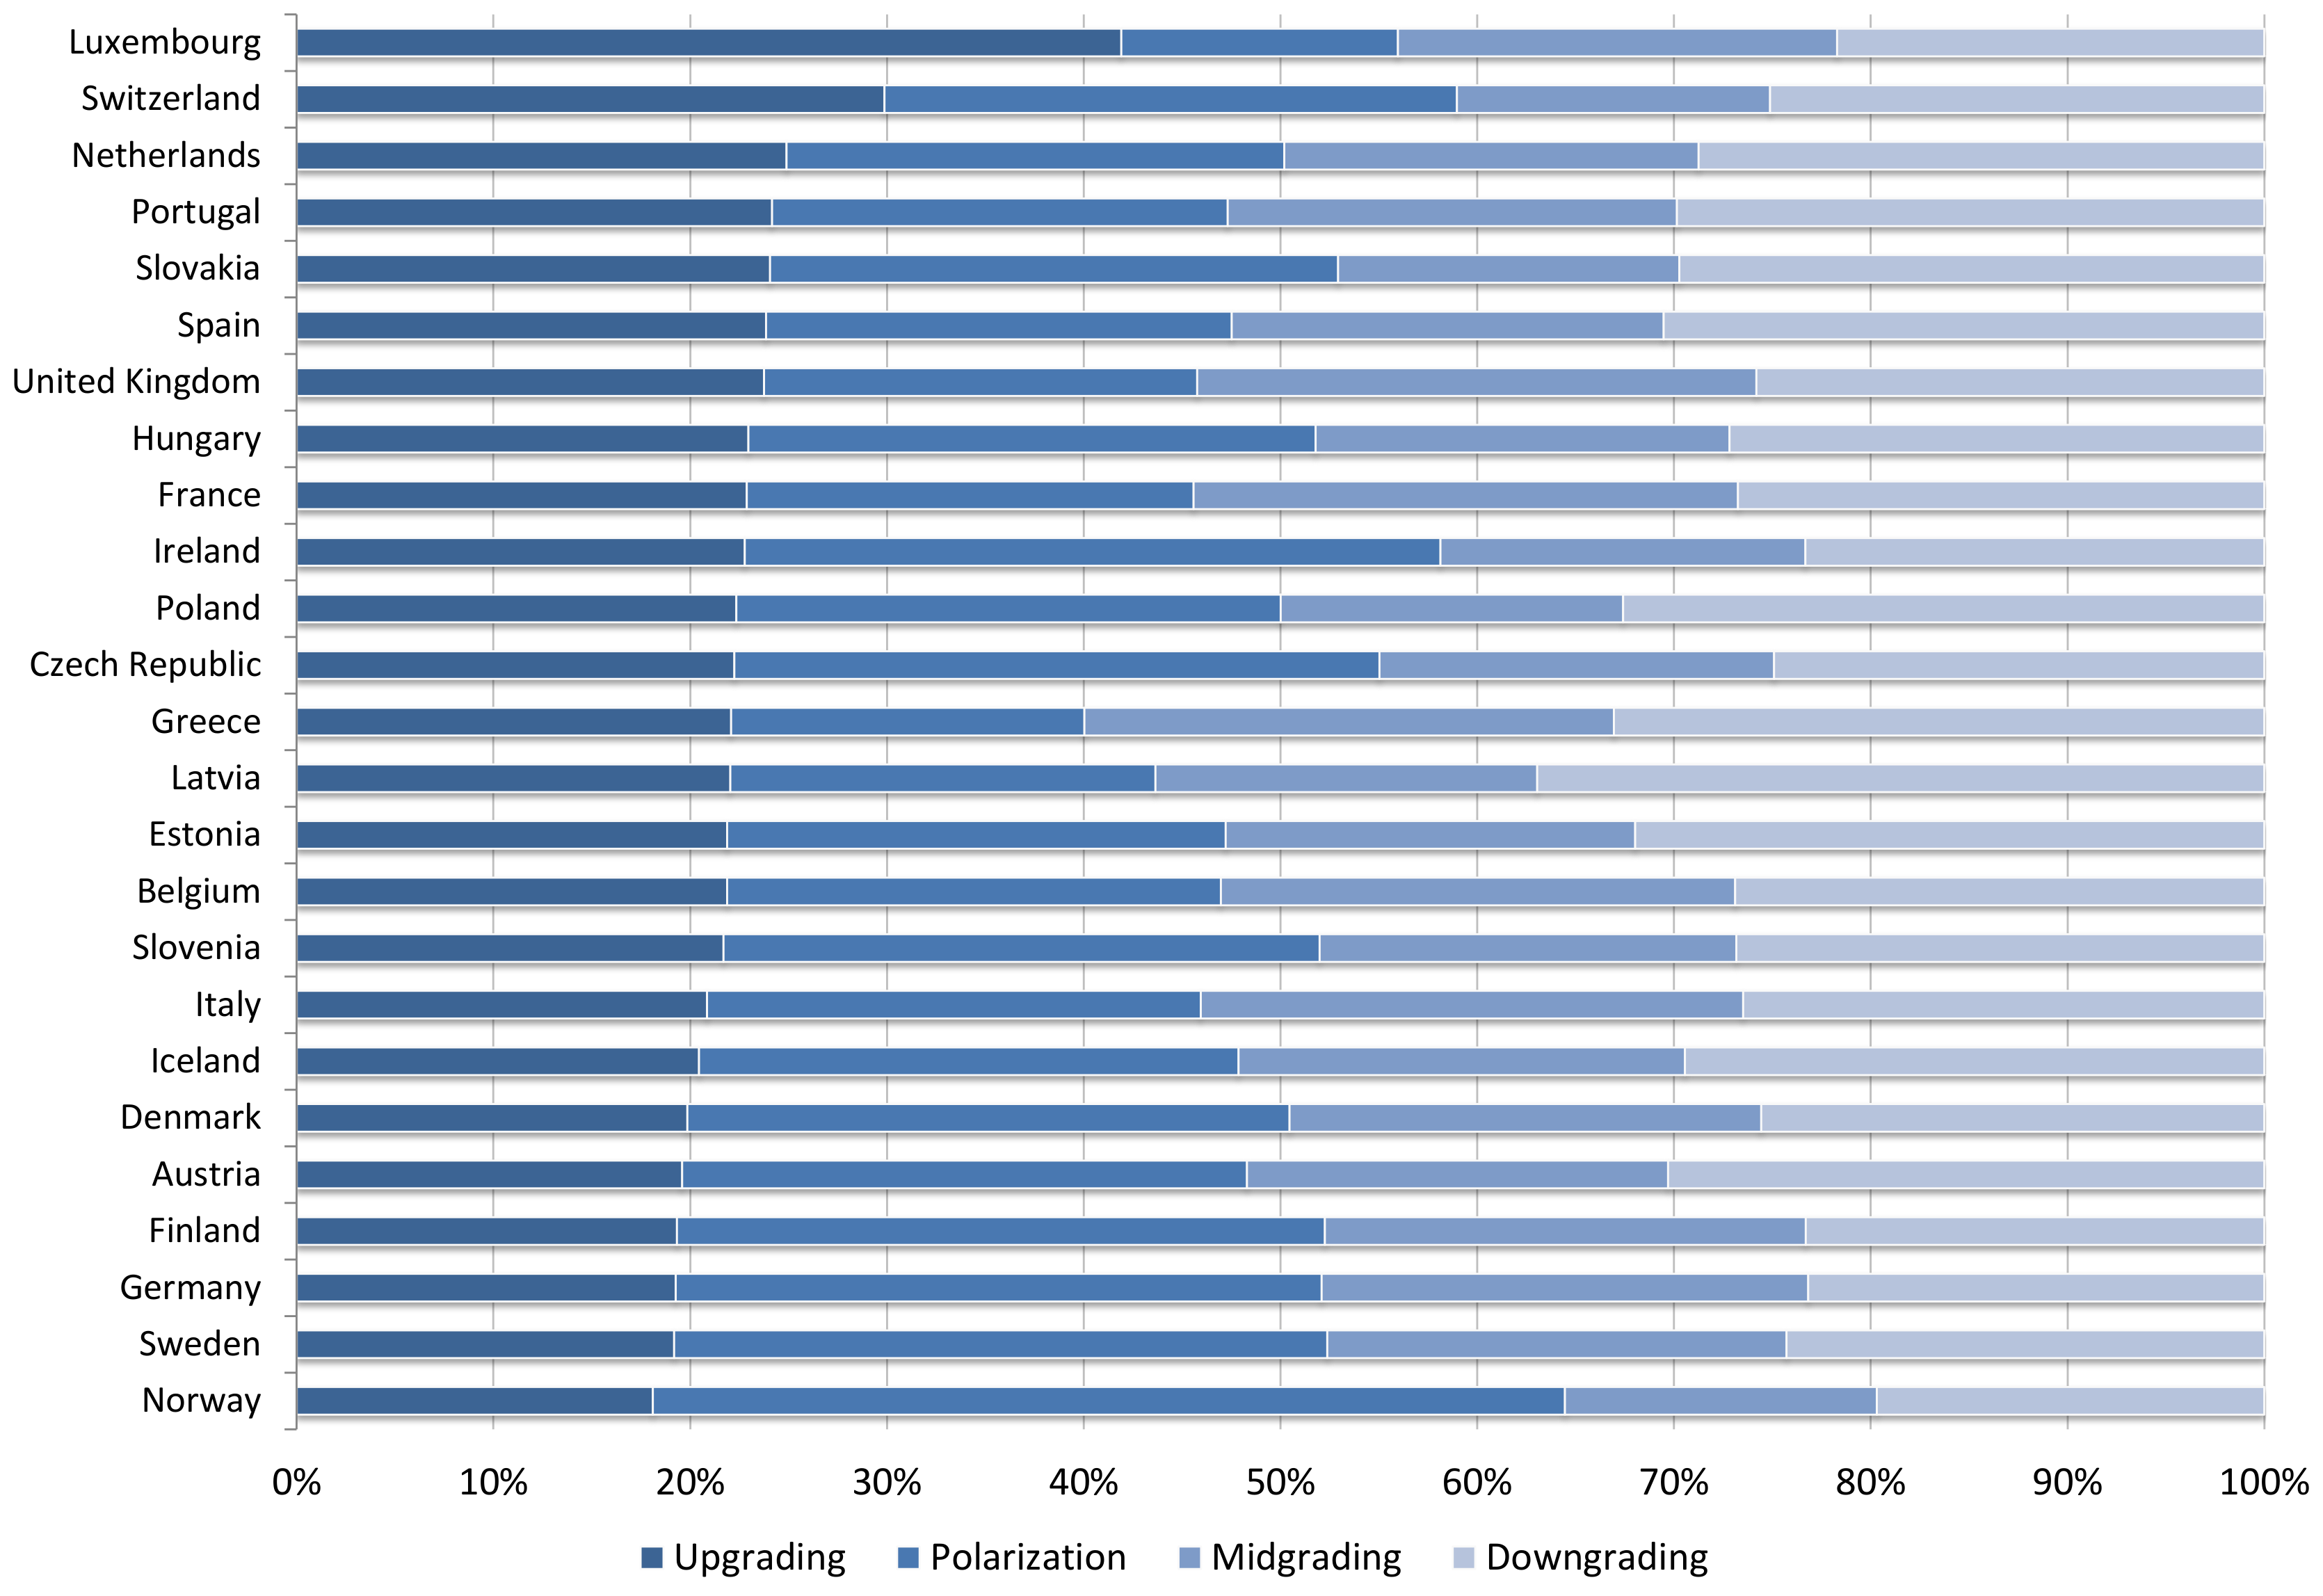
Figure 3 lists the countries by value added in skill upgrading sectors defined in
Table 3. Overall, the two sector classifications give divergent pictures. For example, while the United Kingdom has the third largest value added in sectors with high skill employment share (
Figure 2), it also has a low value added in sectors that have experienced skill upgrading and one of the largest added values in midgrading sectors.
In conclusion, we find that, rather than a unique polarizing pattern, there are several trends in the labor markets within countries and sectors. There are two patterns (skill upgrading and polarization) within countries, and four patterns within sectors. Examining the sectoral structure of each country, we were not able to detect any regularity among the job reallocation patterns, pointing to the striking evidence that, contrary to previous studies, there is no uniform trend of European employment structures.
4.2. Inward Greenfield FDI in High and Low Skill Intensive Activities
Most of the literature explains the skill upgrading and polarization phenomena with the skill-biased technological change, offshoring and/or routinization of medium skill intensive activities. Another channel through which the increased internationalization may affect the relative demand for skills is inward FDI. This is attributed to the assumption that MNEs use higher levels of technology and require relatively more skilled labor than domestic firms. However, not all FDI should be treated as equal. Labor-intensive, low-cost, low-skill manufacturing FDI may increase the demand for unskilled labor, while capital-, knowledge- and skill-intensive FDI may lead to more demand for high-skill workers.
During the period 2003–2014, countries in the Europe received nearly 10,000 greenfield investment projects—of which more than 40% in manufacturing activities—corresponding to approximately Euro 370 billion and more than 1 million jobs.
Table 4 reports the total number of greenfield FDI projects, jobs and total amount of capital expenditure, by investment activity. (
Table A1 in the Appendix reports the number of projects by investment activity and country.
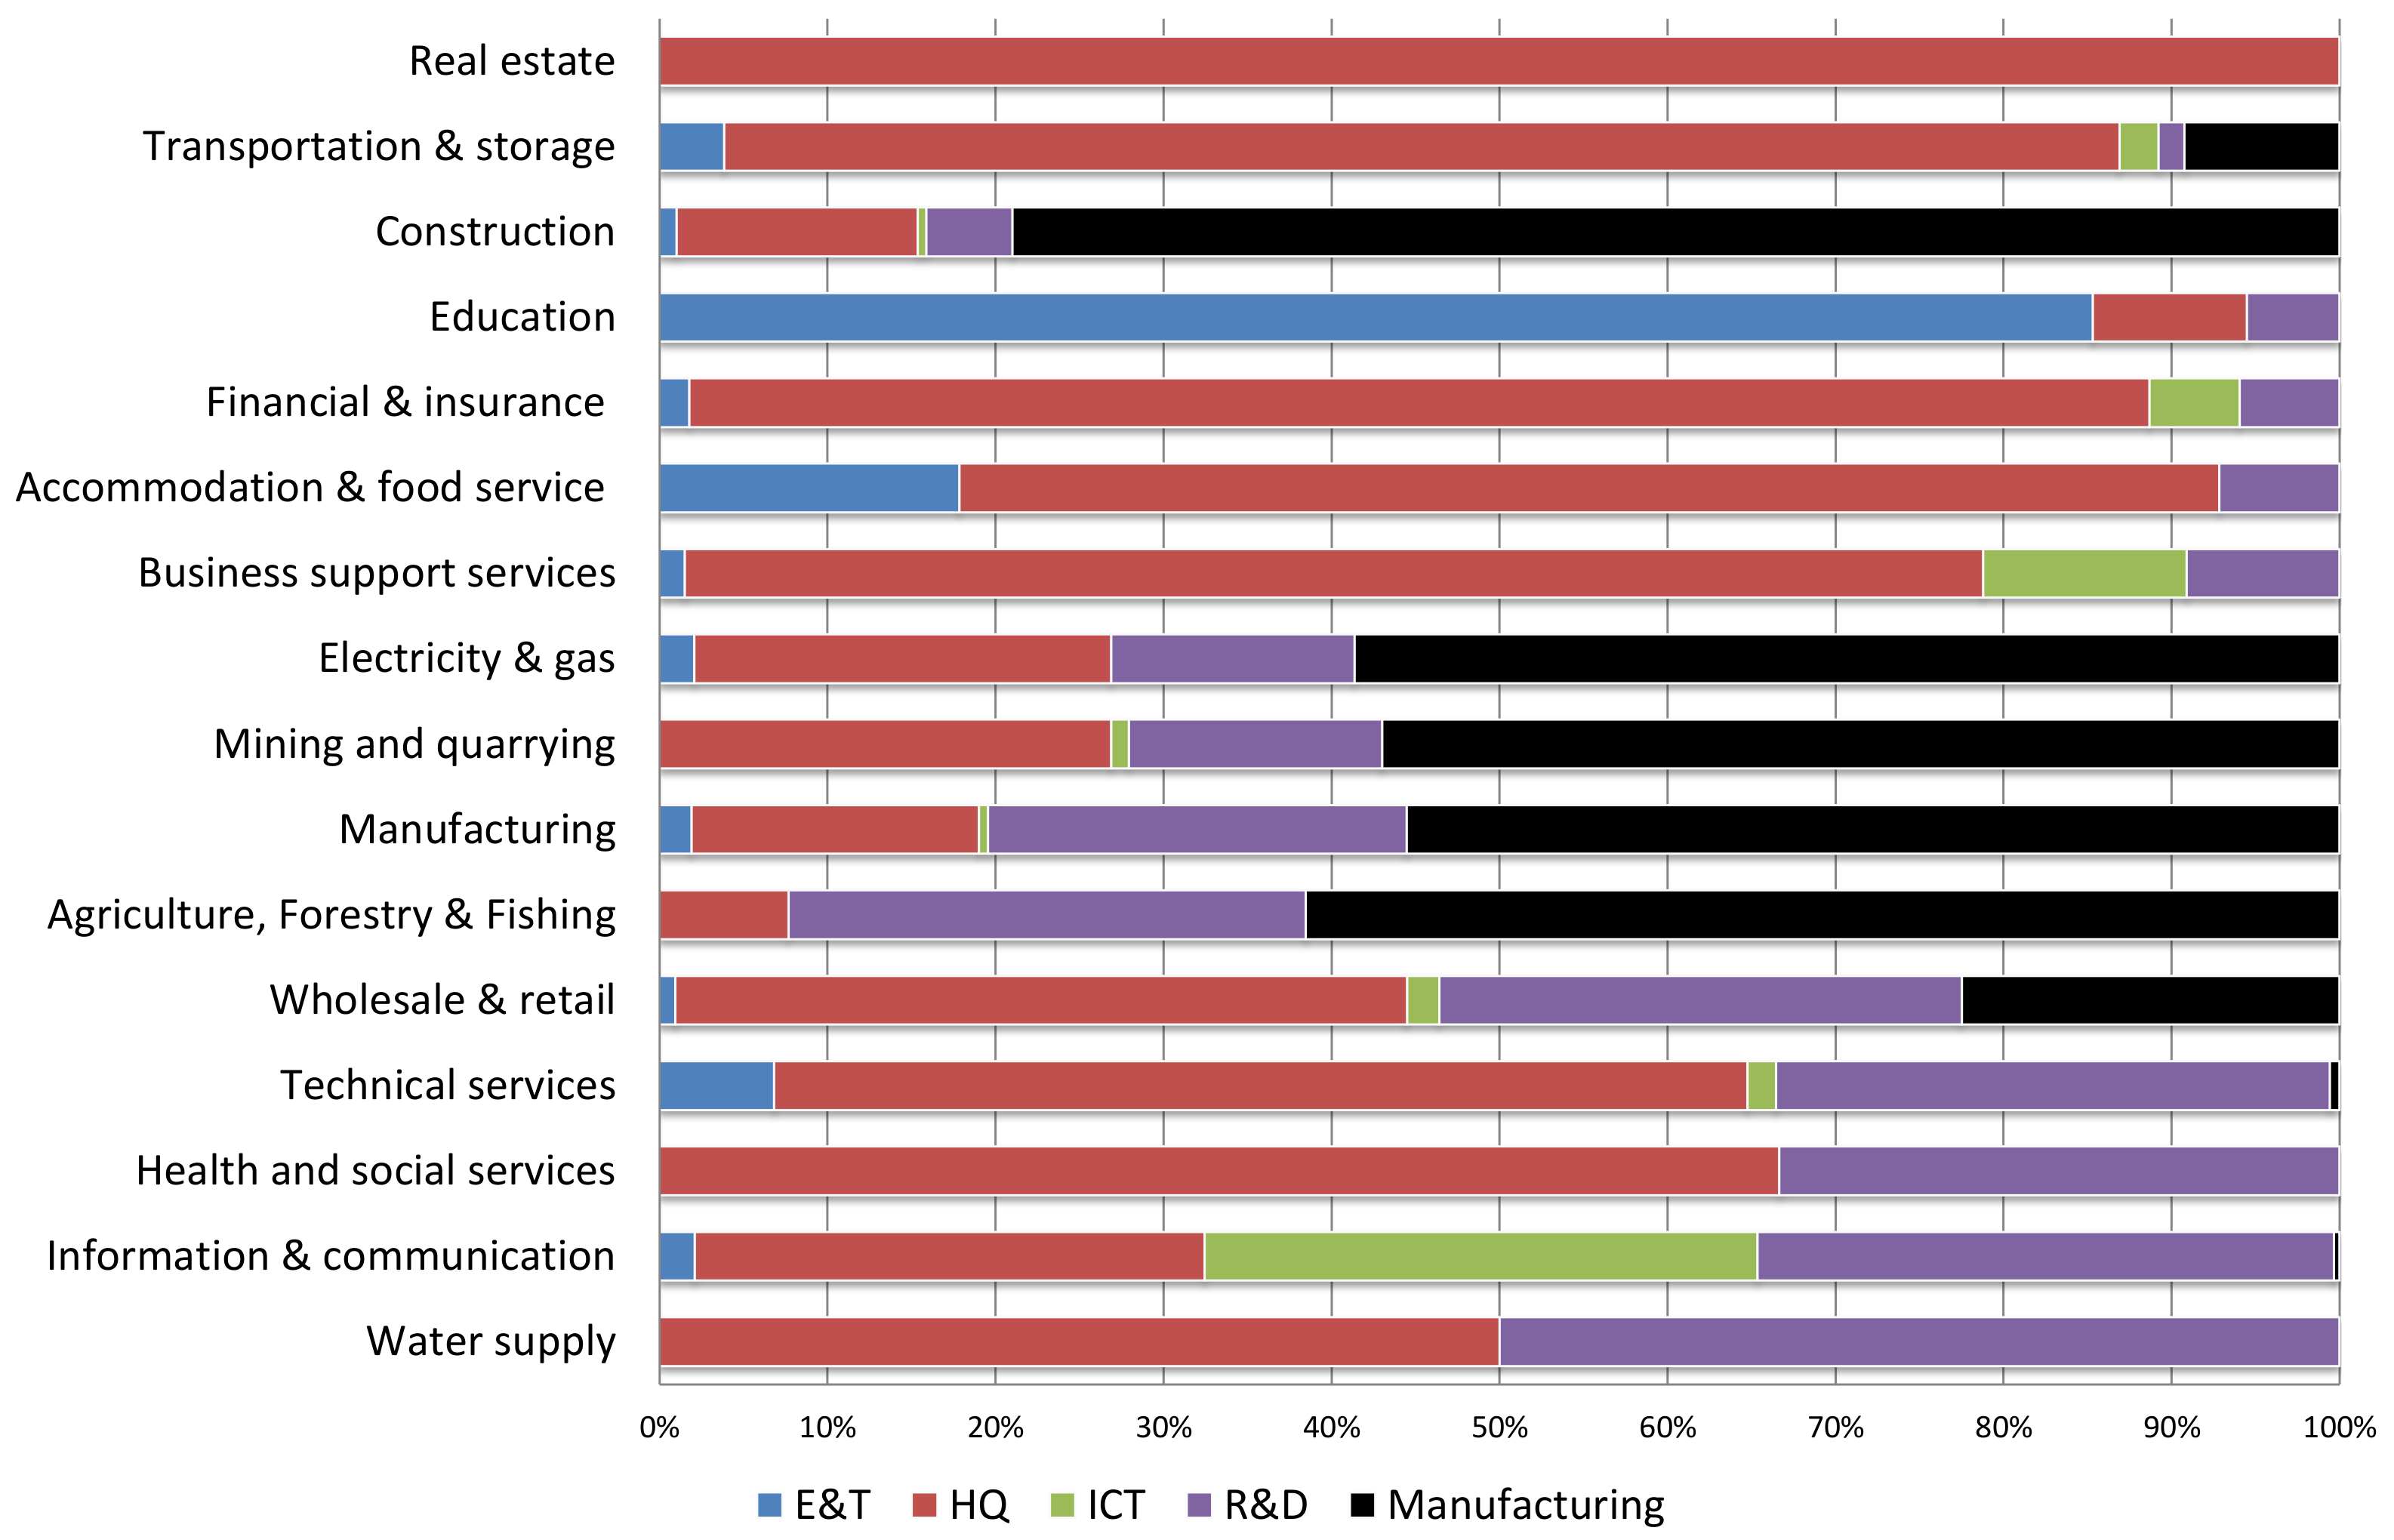
Figure A1 reports the shares of FDI projects by investment activity and destination sector.) We grouped the investment activities into
high-skill and
low-skill intensive. High-skill intensive activities are Education & Training (E&T), Headquarters (HQ), information and communication technology (ICT) and R&D activities. Low-skill activities are related to production and manufacturing processes. Despite the similar number of HQ and R&D greenfield projects, HQ activities have created a larger number of jobs with less capital invested compared to R&D activities.
Greenfield projects in ICT have the largest amount of capital per project (92 Euro millions per project), while FDI in manufacturing activities creates the highest average number of jobs per project. The last two columns compare the average number of created jobs per project and capital investment per job across FDI activities. FDI in ICT have the highest capital per job, while FDI in manufacturing creates the largest number of jobs per project.
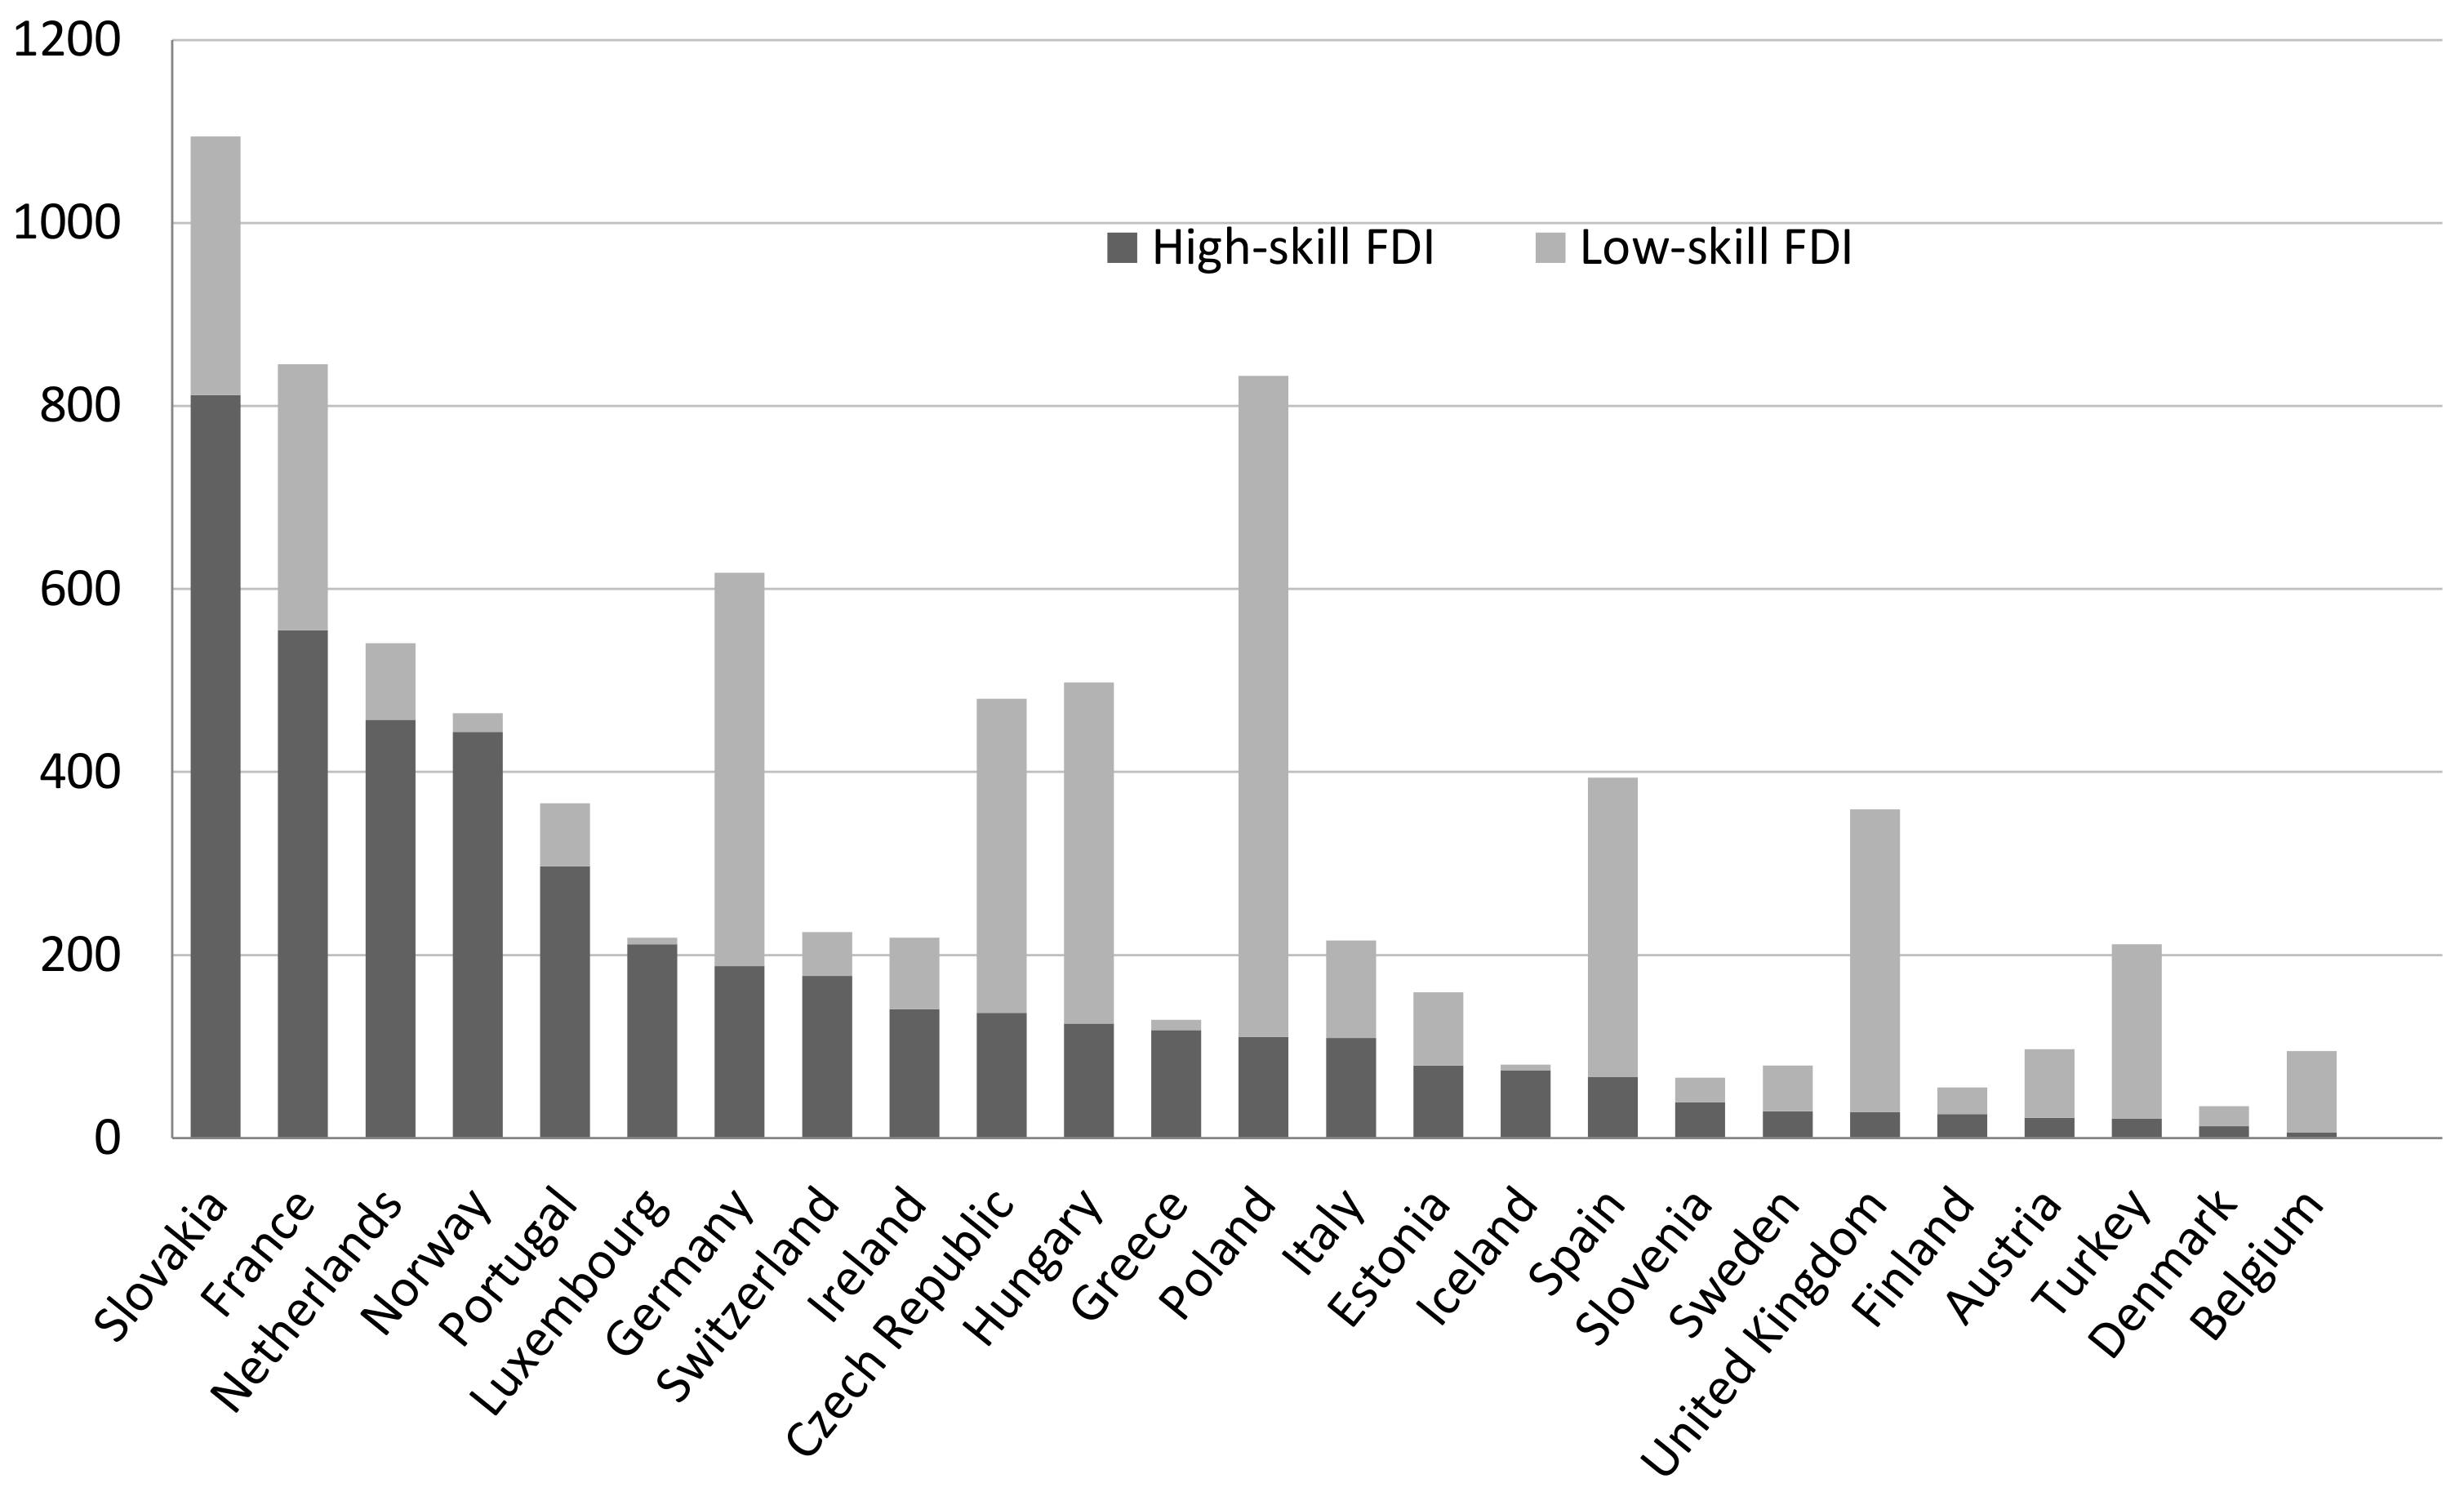
Figure 4 shows the number of inward greenfield FDI in high-skill and low-skill activities during the period 2003–2014 by destination country. The countries are ordered, from left to right, by the total number of high-skill intensive greenfield projects received. Slovakia is the country that received both the most projects overall and the most high-skill intensive greenfield projects, while Poland has received mainly FDI in low-skill activities. In the next subsection, we analyze the link between different types of inward greenfield FDI and the patterns of job polarization of the European labor markets.
4.3. The Link between High- and Low-Skill Intensive Greenfield FDI and Employment Shares
Our empirical analysis borrows the methodological framework of previous studies on SBTC. Differently from previous empirical analyses, we assume, for the purpose of this study, that inward greenfield FDI activities rather than offshoring are the factors that shift the demand for skilled or unskilled labor. For each time period
t, the representative firm operates in sector
j of country
c and produces a certain output using capital, skilled, medium skilled and unskilled labor, and a specific level of technology. Under the assumptions of short-run translog cost function, linear price homogeneity and symmetry, the employment share
of skill type
(high, medium, low) takes the following functional form:
where
w is the log of national-accounts-based total wage bill,
k and
r are respectively the logs of gross capital stock and R&D intensity (R&D expenditure over value added), which proxy the level of technology,
q is the log of value added (all variables are deflated), and
is the log number of inward greenfield FDI projects of type
. (We also use different measures of FDI inflows such as log of capital investment or log of number of jobs created by the MNEs FDI projects. These additional results are used mainly to check the robustness of the analysis and are available upon request.) The error term
includes country, sector and year fixed effects. In addition, we use lagged independent variables, not to solve the endogeneity issues, but because we believe that it may take at least a year before the local labor markets react to MNEs’ investment. Indeed, lagging independent variables would yield causal identification only if there were serial correlation in the potentially endogenous explanatory variables and no serial correlation among the unobserved sources of endogeneity. Therefore, all our results are best interpreted as associations rather than causal relationships.
Table 5 displays the results of a generalized least squares estimation of Equation (
1), which allows for heteroskedasticity among the residuals. The left part of the table reports the results of a simpler specification where greenfield FDI are regressed on the share of high-, medium- and low-skill employment. The right part displays the results from the full specification, which controls for wage, capital, value added, and technology (R&D intensity). The control variables have the expected signs. (The interpretation of the coefficients is the following: for a 1% increase in the number of FDI (wages, capital, value added, or R&D intensity), the employment share increases/decreases by
percentage points.) As in [
55], we find a positive and statistically significant relationship of R&D intensity and capital to the demand for high-skill labor. Contrary to his results for Japanese manufacturing industries, we find that the industry scale of production (
q) is positively related to demand for skilled workers, indicating that European sectors would require more skilled workers should the market expand. Differently from previous studies [
17,
18], we cannot disaggregate wages into low-, medium- and high-skill wages. In general, we find that wages are negatively related to the demand of skilled employment and positively related to the demands of medium- and low-skill employment.
Concerning the effect of FDI on the employment shares by skill group, we find that FDI in R&D increases the share of high-skill workers, while it decreases the share of medium-skill employment. Manufacturing investment corresponds to a lower share of high-skill employment, and to higher shares of medium- and low-skill employment. FDI in ICT activities seems to correspond to a larger (smaller) share of medium-skill (high-skill) employment. Finally, investment in E&T reduces the share of low-skill occupations. When including the wage, capital, value added and R&D intensity, the sample reduces to around 2200 observations (3000 observations lost) because of missing data in the OECD databases. However, the inclusion of this set of regressors does not change the statistical significance nor the sign of the effect of greenfield FDI on shares of employment.
The results from
Table 5 seem to point to a shifting effect of FDI activities. In particular, FDI in ICT decreases the share of high-skill employment and increases that of medium-skill employment (a 1% increase in the number of ICT projects corresponds to a decrease of 1.4 percentage points in the share of high-skill employment and to an increase of 1.1 percentage points in the share of medium-skill occupations). This finding is in contrast to previous empirical studies claiming that ICT investments are associated with an increase in labor demand of high-skill employees and polarization [
9,
56,
57,
58]. On the other hand, FDI in R&D have the expected upgrading effect, as they are positively related to the demand for high-skill workers, while they decrease the share of medium-skill jobs by 1.7 points.
To test polarization patterns, in
Table 6, we report the results of regressing FDI inflows on the ratio between high- and medium-skill
, between low- and medium-skill
, and between high- and low-skill employment
.
If all FDI had a polarizing effect, we would find a positive coefficients for both
and
. (The interpretation of the coefficients differs from that of
Table 5, as
,
, and
are ratios and not shares. Their mean values are 1.8, 0.27 and 12, and range from 0 to 62, 5.6 and 464, respectively. In this case, a 100% increase in the number of FDI (wages, capital, value added, or R&D intensity) generates a
change in the ratios
,
, and
.) However, we find evidence of skill upgrading due to FDI in Education & Training (E&T), which reduces low-skill employment share compared to the medium-skill one, while it increases the share of high-skill over low-skill workers. We also find that FDI in manufacturing and headquarter activities does not have a polarizing effect, rather a downgrading one (an 100% increase in the number of manufacturing or HQ projects generates a decrease in the ratio
of almost 0.9 or 0.6, respectively). The role of FDI in ICT and R&D is, on the other hand, more difficult to interpret, as these investments seem to have a midgrading and downgrading effect, respectively. However, up to now, we have considered the employment shares to be independent from each other, and we have also omitted the relevance of sectoral structural changes [
59] that we observed in
Section 4.1.
To take into account the correlation among shares of employment across the three skill groups, we estimate Equation (
1) using a simultaneous system of seemingly unrelated regression (SUR) equations. Results are reported in
Table 7 and
Table 8. Moreover, to account for differences in effects among the four sectoral job polarization patterns, we group the sectoral dummies into four dummy variables,
upgrading, polarization, midgrading (
downgrading is chosen as base dummy variable). For example,
polarization equals 1 if the sectors are mining & quarrying, electricity & gas, manufacturing, or health services; 0, otherwise (see
Table 3).
As before,
Table 7 reports the results for the individual shares of employment. Results remain fairly unchanged: foreign R&D investments increase the demand for high-skill jobs, while reducing that of middling occupations; manufacturing activities increase the shares of medium- and low-skill employment shares; E&T reduces the demand for low-skill jobs; and FDI in ICT has a negative effect on high-skill employment share and a positive effect on the medium-skill one.
However, when considering the sectoral patterns of labor market structuring, we find that E&T activities are not only decreasing the share of low-skill workers, but, at the same time, they increase the share of high-skill employment. FDI in ICT has now the same effect of R&D, which is positive on high-skill employment and negative on middling occupations. These results are more in line with the findings in the literature. In addition, FDI inflows in HQ reduce the share of low-skill occupations.
Table 8 confirms that E&T activities are skill upgrading (increase the ratio
and decrease
, shifting resources from low- to medium- to high-skill employment). Foreign investment in manufacturing continues to have a downgrading effect on labor composition. The relationship between job polarization trends and FDI in ICT depends on the inclusion of the dummies of sectoral structural changes. When omitting the employment structure characteristics, FDI in ICT shifts the employment from high- to medium- and from high- to low-skill jobs. When we include the sectoral structural change dummies, ICT activities have a polarizing effect, in line with the routinization hypothesis.


