Simulation of Regulation Policies for Fertilizer and Pesticide Reduction in Arable Land Based on Farmers’ Behavior—Using Jiangxi Province as an Example


Abstract
:1. Introduction
2. Introduction of Model Method
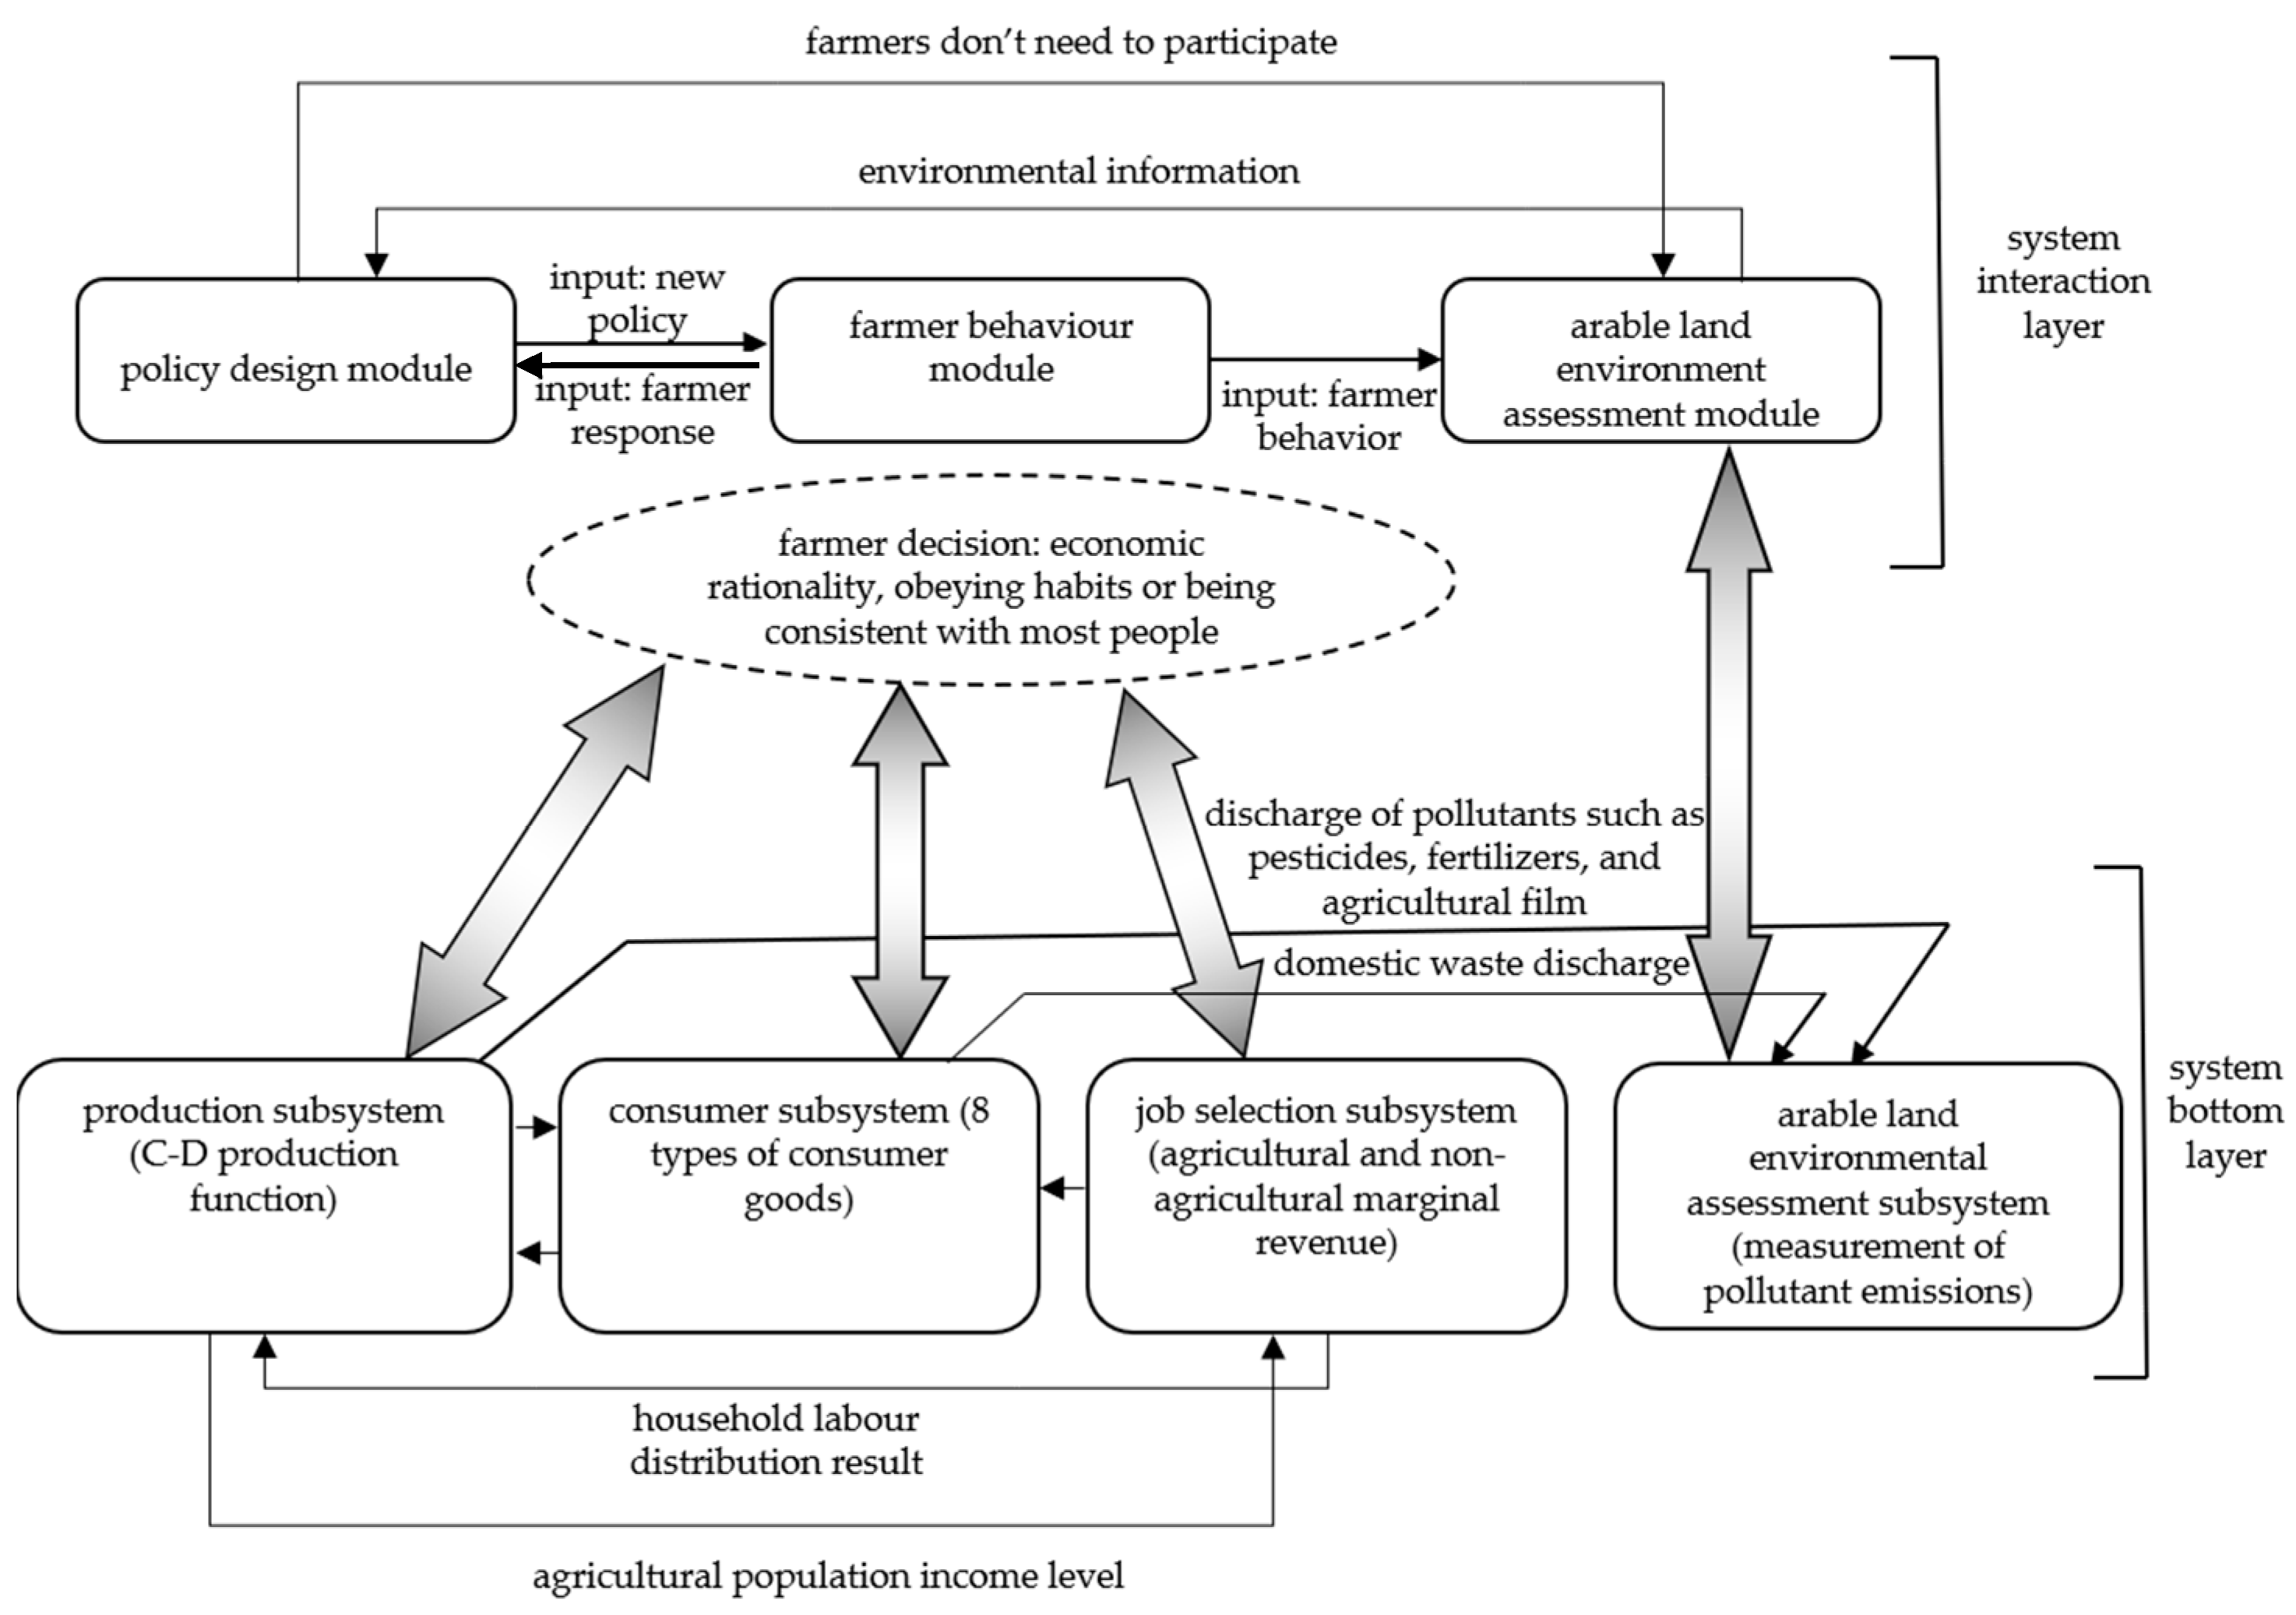
2.1. The Overall Idea of Multi-Agent Modeling
2.2. Key Formulas and Parameter Descriptions Involved in this Paper
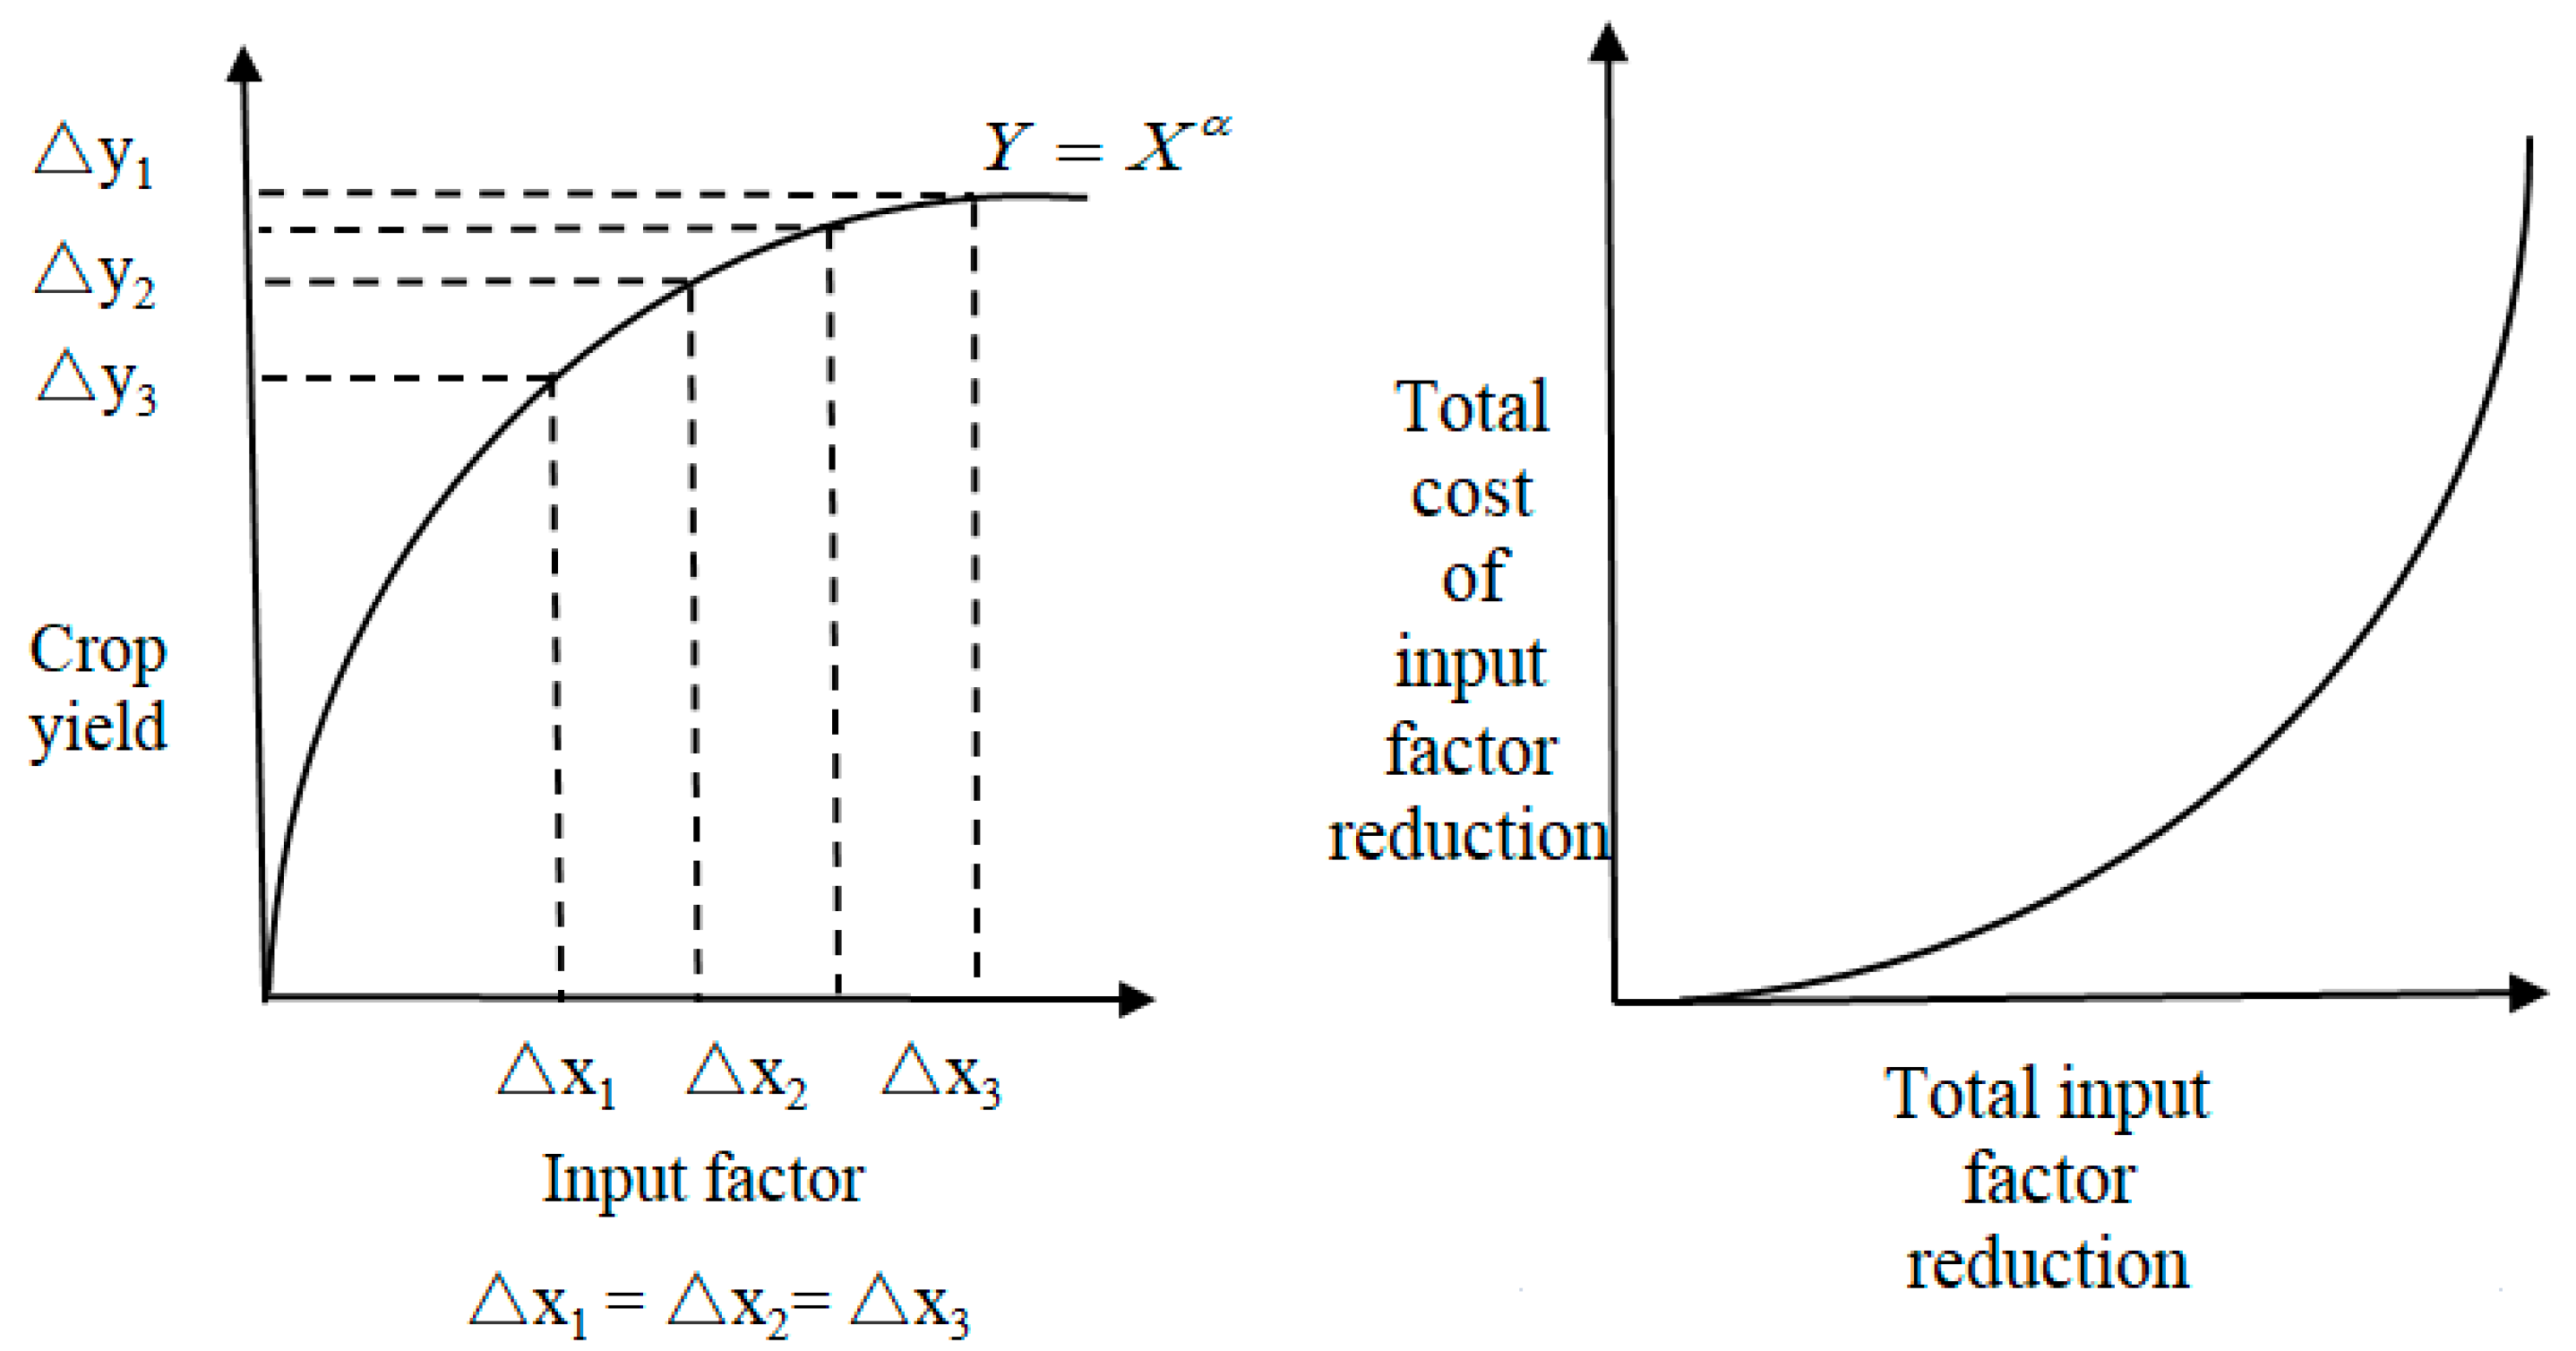
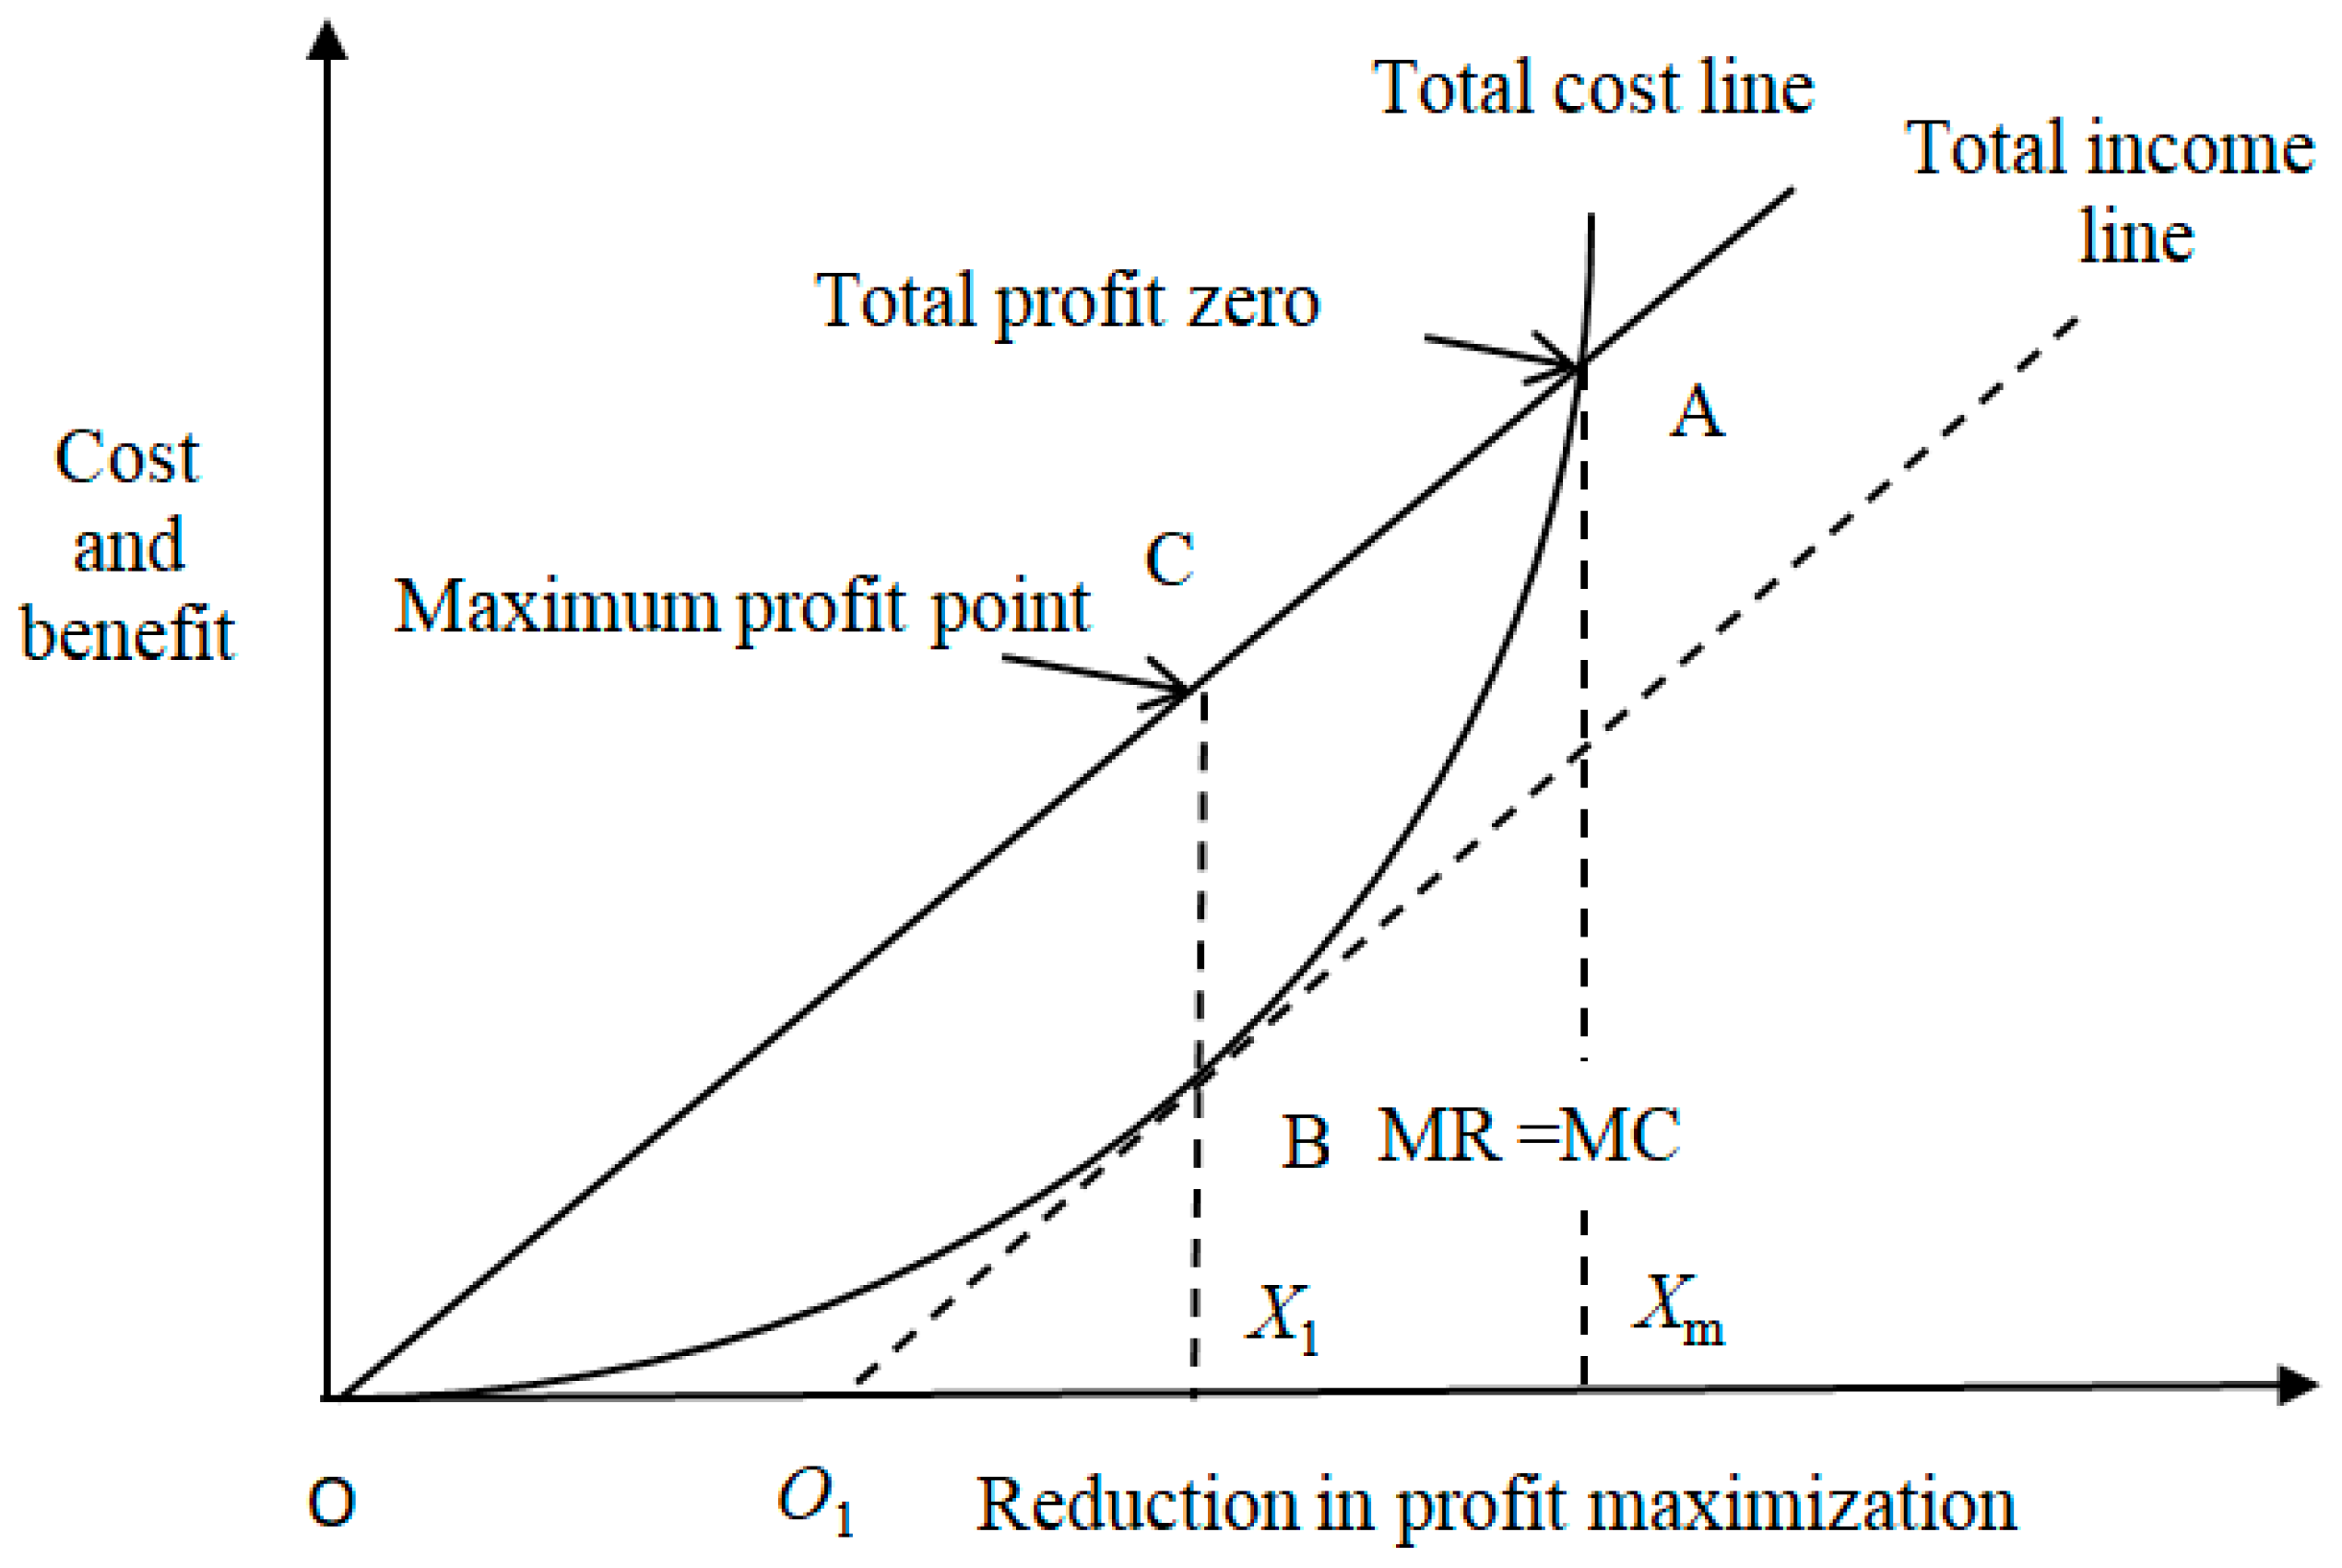
2.2.1. Production Profit Function of Farmers’ Planting Industries
2.2.2. Farmers’ Consumption Function
2.2.3. Farmers’ Employment Selection Function
2.2.4. Arable Land Pollution Function
2.3. Model Data Description
3. Scenario Design of Regulation Policy for Reducing Fertilizer and Pesticide Application on Arable Land
3.1. Scenario C: Fertilizer Taxation Scenario
3.2. Scenario D: Ecological Compensation Scenario
3.3. Two Scenarios of Farmers’ Production Decision Formula Transformation
4. Simulation Results and Analysis
4.1. Scenario C (Levy Fertilizer Tax) Simulation Results and Analysis
4.2. Scenario D (Ecological Compensation) Results and Analysis
5. Conclusions and Policy Recommendations
Author Contributions
Funding
Acknowledgments
Conflicts of Interest
Appendix A

| Serial Number | Per Capita Net Income | Total Living Consumption | Pixi | D1Y | D2Y | |||||||
|---|---|---|---|---|---|---|---|---|---|---|---|---|
| Food, Tobacco, Alcohol | Clothes | Life | Daily Necessities and Services | Traffic Communication | Education, Culture and Entertainment | Healthcare | Other Supplies and Services | |||||
| 1 | 669.90 | 576.69 | 368.68 | 35.37 | 48.14 | 53.50 | 7.50 | 42.50 | 17.50 | 3.50 | 669.90 | 0.00 |
| 2 | 693.51 | 589.34 | 372.49 | 38.21 | 44.29 | 53.33 | 11.35 | 44.92 | 18.78 | 5.97 | 693.51 | 0.00 |
| 3 | 732.90 | 618.29 | 383.41 | 38.85 | 93.80 | 27.30 | 9.95 | 42.20 | 18.00 | 4.79 | 732.90 | 0.00 |
| 4 | 737.43 | 603.68 | 370.34 | 35.83 | 80.64 | 30.20 | 14.57 | 43.89 | 20.83 | 7.38 | 737.43 | 0.00 |
| 5 | 815.15 | 689.97 | 433.04 | 39.25 | 87.18 | 32.57 | 15.45 | 51.37 | 19.65 | 11.45 | 815.15 | 0.00 |
| 6 | 879.25 | 718.37 | 443.01 | 40.19 | 95.85 | 33.10 | 18.47 | 53.46 | 22.58 | 11.70 | 879.25 | 0.00 |
| 7 | 984.60 | 817.91 | 497.93 | 45.92 | 113.55 | 38.09 | 22.16 | 63.47 | 25.14 | 11.66 | 984.60 | 0.00 |
| 8 | 1086.93 | 809.37 | 475.48 | 39.89 | 117.91 | 36.79 | 21.04 | 72.37 | 30.54 | 15.35 | 1086.93 | 0.00 |
| 9 | 1045.90 | 785.57 | 459.30 | 34.26 | 113.11 | 34.21 | 20.63 | 82.16 | 28.17 | 13.74 | 1045.90 | 0.00 |
| 10 | 1108.55 | 836.80 | 480.07 | 35.64 | 119.59 | 35.94 | 28.72 | 89.38 | 31.83 | 15.63 | 1108.55 | 0.00 |
| 11 | 1121.69 | 862.91 | 469.89 | 44.35 | 117.64 | 29.13 | 50.22 | 96.78 | 33.35 | 21.55 | 1121.69 | 0.00 |
| 12 | 1181.74 | 910.81 | 469.16 | 48.38 | 138.98 | 31.13 | 60.06 | 103.81 | 38.35 | 20.95 | 1181.74 | 0.00 |
| 13 | 1237.30 | 945.97 | 474.04 | 51.62 | 139.51 | 32.85 | 66.79 | 114.43 | 42.93 | 23.81 | 0.00 | 0.00 |
| 14 | 1294.91 | 1005.13 | 519.57 | 52.61 | 139.17 | 33.03 | 74.66 | 117.92 | 48.47 | 19.70 | 0.00 | 0.00 |
| 15 | 1503.14 | 1082.72 | 588.71 | 54.57 | 119.48 | 34.05 | 87.51 | 120.80 | 56.16 | 21.43 | 0.00 | 0.00 |
| 16 | 1626.68 | 1237.23 | 607.99 | 62.03 | 162.49 | 48.00 | 114.37 | 137.62 | 77.05 | 27.68 | 0.00 | 0.00 |
| 17 | 1757.56 | 1318.32 | 649.35 | 64.27 | 183.11 | 51.81 | 123.03 | 140.96 | 78.03 | 27.76 | 0.00 | 0.00 |
| 18 | 1898.99 | 1387.69 | 691.43 | 68.45 | 219.89 | 56.33 | 128.44 | 117.14 | 77.72 | 28.31 | 0.00 | 0.00 |
| 19 | 2047.74 | 1442.65 | 711.96 | 68.77 | 243.87 | 67.57 | 131.52 | 102.89 | 89.67 | 26.41 | 0.00 | 0.00 |
| 20 | 2230.29 | 1552.48 | 707.19 | 71.45 | 318.66 | 79.95 | 129.98 | 111.96 | 102.30 | 31.00 | 0.00 | 0.00 |
| 21 | 2462.61 | 1664.11 | 771.15 | 74.28 | 332.99 | 87.33 | 141.16 | 121.34 | 103.74 | 32.11 | 0.00 | 0.00 |
| 22 | 2776.40 | 1877.39 | 848.61 | 94.10 | 358.09 | 111.80 | 158.46 | 128.67 | 139.67 | 37.99 | 0.00 | 2776.40 |
| 23 | 3061.71 | 2006.43 | 873.42 | 103.63 | 402.96 | 108.86 | 193.41 | 134.04 | 148.81 | 41.30 | 0.00 | 3061.71 |
| 24 | 3337.92 | 2582.45 | 961.94 | 129.05 | 644.60 | 140.91 | 257.21 | 224.64 | 177.16 | 46.95 | 0.00 | 3337.92 |
| Year | Fertilizer (suffix, kg) | Pesticide (kg) | Agricultural Film (kg) | Machinery Power (kg) | Effective Irrigation Ratio (%) |
|---|---|---|---|---|---|
| 1990 | 836,000,000 | 35,879,000 | 17,505,000 | 6,677,167 | 78.2 |
| 1991 | 932,000,000 | 35,879,000 | 17,505,000 | 6,692,285 | 78.8 |
| 1992 | 941,000,000 | 34,485,000 | 16,907,000 | 6,345,786 | 79.4 |
| 1993 | 938,000,000 | 34,250,000 | 16,932,000 | 6,306,139 | 80.1 |
| 1994 | 1,048,000,000 | 37,998,000 | 20,500,000 | 6,438,156 | 80.8 |
| 1995 | 1,121,000,000 | 41,932,000 | 21,785,000 | 6,630,750 | 81.4 |
| 1996 | 1,127,000,000 | 44,482,000 | 21,105,000 | 6,913,258 | 82.1 |
| 1997 | 1,204,000,000 | 45,259,000 | 24,792,000 | 7,500,270 | 82.7 |
| 1998 | 1,131,000,000 | 48,704,000 | 27,509,000 | 7,939,078 | 83.2 |
| 1999 | 1,167,000,000 | 54,502,000 | 30,256,000 | 8,530,196 | 83.7 |
| 2000 | 1,069,000,000 | 51,406,000 | 28,599,000 | 9,023,070 | 84.5 |
| 2001 | 1,097,000,000 | 51,384,000 | 30,778,000 | 10,020,350 | 83.4 |
| 2002 | 1,124,000,000 | 57,323,000 | 35,407,000 | 11,118,200 | 88.5 |
| 2003 | 1,110,000,000 | 53,470,000 | 33,930,000 | 12,205,200 | 88.9 |
| 2004 | 1,235,000,000 | 66,273,000 | 42,828,000 | 14,652,000 | 88.8 |
| 2005 | 1,294,000,000 | 75,305,000 | 45,010,000 | 17,812,600 | 87.3 |
| 2006 | 1,326,000,000 | 75,955,000 | 40,854,000 | 21,370,850 | 86.3 |
| 2007 | 1,326,508,000 | 88,833,000 | 38,071,000 | 25,063,200 | 85.7 |
| 2008 | 1,330,000,000 | 96,662,000 | 41,645,000 | 29,464,300 | 65.1 |
| 2009 | 1,358,000,000 | 97,593,000 | 43,719,000 | 33,589,300 | 65.3 |
| 2010 | 1,376,000,000 | 107,000,000 | 45,491,000 | 38,050,000 | 65.7 |
| 2011 | 1,411,000,000 | 99,691,000 | 47,375,000 | 42,000,000 | 66.2 |
| 2012 | 1,413,000,000 | 100,000,000 | 50,275,000 | 45,996,850 | 67.6 |
| 2013 | 1,416,000,000 | 99,922,000 | 51,401,000 | 20,141,320 | 70.8 |
References
- Kuang, F. Difference analysis of farmers’ knowledge and protection behaviour of ecological environment—Taking the use of pesticide and chemical fertilizer as an example. Res. Soil Water Conserv. 2018, 25, 321–326. [Google Scholar]
- Bao, X. Fertilizer, environment and sustainable development of Chinese agriculture. Stat. Decis. 2007, 1, 73–74. [Google Scholar] [CrossRef]
- Wang, Y.; Peng, Z. Effects of excessive fertilization on soil ecological environment of protected arable land. J. Agro-Environ. Sci. 2005, 24, 81–84. [Google Scholar]
- Li, L. Study on the Impact of Utilization of Production Factors on Grain Yield and Environment—Taking Fertilizer as an Example; China Agricultural University: Beijing, China, 2015. [Google Scholar]
- Zhu, H.; Sun, M. Review of land use intensification research and future work focus. Acta Geogr. Sin. 2014, 69, 1346–1357. [Google Scholar]
- Scott, D.; Cooper, P.; Lake, S.; Sabater, S.; Melack, J.M.; Sabo, J.L. The effects of land use changes on streams and rivers in Mediterranean climates. Hydrobiologia 2013, 719, 383–425. [Google Scholar]
- Guo, J.H.; Liu, X.J.; Zhang, Y.; Shen, J.L.; Han, W.X.; Zhang, W.F.; Christie, P.; Goulding, K.W.; Vitousek, P.M.; Zhang, F.S. Significant acidification in major Chinese croplands. Science 2010, 327, 1008–1010. [Google Scholar] [CrossRef] [PubMed]
- Zhu, Z.; Sun, B.; Yang, L.; Zhang, L.X. Control policies and measures for agricultural non-point source pollution in China. Sci. Technol. Rev. 2005, 23, 47–51. [Google Scholar]
- Zhang, W.L.; Xu, A.G.; Ji, H.J.; Kolbe, H. Estimation and control countermeasures of agricultural non-point source pollution in China III—Analysis of existing problems in agricultural non-point source pollution control in China. Chin. Agric. Sci. 2004, 37, 1026–1033. [Google Scholar]
- Xie, X.; Chen, M.; Li, Z. Comparative study on arable land quality protection behaviour of different groups of farmers—Based on the perspective of pesticides and fertilizers. Rural. Econ. Technol. 2016, 27, 12–16. [Google Scholar]
- Wang, Z. China’s Agricultural Environmental Policy Research Based on the Perspective of Agricultural Support; Graduate School of the Chinese Academy of Agricultural Sciences: Beijing, China, 2013. [Google Scholar]
- Li, K.; Ma, D. Study on the fertilizer input and decision-making mechanism of farmers in ecologically fragile areas—Taking 421 households in 4 counties of Shanxi Province as an example. J. Nanjing Agric. Univ. (Soc. Sci. Ed.) 2018, 18, 138–160. [Google Scholar] [CrossRef]
- Geng, F.; Luo, L. Study on farmers’ willingness to reduce chemical fertilizer consumption and use organic fertilizer—From the perspective of non-point source pollution prevention and control in the upper reaches of Erhai river basin. Chin. J. Agric. Resour. Reg. Plan. 2018, 39, 74–82. [Google Scholar]
- Guo, Q.H.; Li, S.P.; Li, H. Adoption behaviours of farmers’ chemical fertilizer reduction measures based on the perspective of social norms. J. Arid Land Resour. Environ. 2018, 32, 50–55. [Google Scholar] [CrossRef]
- Wang, T. Research on Influencing Factors of Implementing Three Reductions by Rice Growers in Sanjiang Bureau of Agricultural Reclamation and Construction; Heilongjiang Bayi Agricultural Reclamation University: Daqing, China, 2017. [Google Scholar]
- Zeng, W. Study on Ecological Compensation for Fertilizer Reduction Based on Farmers’ Willingness; Kunming University of Technology: Kunming, China, 2014. [Google Scholar]
- Ge, J. Economic Research on Agricultural Non-Point Source Pollution and Treatment in Jiangsu Province; Nanjing Agricultural University: Nanjing, China, 2011. [Google Scholar]
- Zhang, L. Effect of vertical cooperative mode on the behaviour of chemical fertilizer application of rice farmers: Based on the survey data of 189 farmers in Jiangxi Province. Agric. Econ. Probl. 2008, 3, 50–54. [Google Scholar] [CrossRef]
- Jin, S.; Zhou, F. Zero growth of chemical fertilizer and pesticide use: China’s objectives, progress and challenges. J. Resour. Ecol. 2018, 9, 50–58. [Google Scholar]
- Lou, B. Research on Farmers’ Production Behaviour Based on Agricultural Product Quality and Safety; Chinese Academy of Agricultural Sciences: Beijing, China, 2015. [Google Scholar]
- Li, H. Building an Economic Incentive Mechanism and Service System to Solve the Problem of Agricultural Non-point Source Pollution; Fudan University: Shanghai, China, 2011. [Google Scholar]
- Statistical Bureau of Jiangxi. Jiangxi Statistical Yearbook; China Statistics Press: Beijing, China, 1991–2014.
- Herbert, A.S. Practice-based Microeconomics; Gezhi Publishing House: Shanghai, China, 2009. [Google Scholar]
- Cheng, Z. Simulation Analysis of Food Policy Effects Based on Farmers’ Subjects; Graduate School of the Chinese Academy of Social Sciences: Beijing, China, 2010. [Google Scholar]
- Yang, S.; Yan, S. Rural Environmental Management Simulation—Simulation Analysis of Farmers’ Behaviour; Science Press: Beijing, China, 2012. [Google Scholar]
- Zhang, Q. Econometric analysis of the consumption structure of agricultural village residents in China. Anhui Agric. Sci. Bull. 2007, 13, 20–21. [Google Scholar]
- Ma, L. ELES analysis of rural residents’ consumption structure in Ningxia. Inn. Mong. Sci. Technol. Econ. 2007, 23, 2–3. [Google Scholar]
- Lewis, G.J. Human Migration; Groom Helm Ltd.: London, UK, 1982. [Google Scholar]
- Lee Everett, S. A Theory of Migration. Demography 1966, 3, 47–57. [Google Scholar]
- Xin, M. Labor Market Reform in China; Cambridge University Press: Cambridge, UK, 2000. [Google Scholar]
- Xing, G.X.; Zhu, Z.L. Regional nitrogen budgets for China and its major watersheds. Bigeochemistry 2002, 57, 405–427. [Google Scholar] [CrossRef]
- Zhu, Z. Rational use of chemical fertilizers and full use of organic fertilizers to develop environmentally friendly fertilization systems. Chin. Acad. Sci. (Proc. Chin. Acad. Sci.) 2003, 2, 89–93. [Google Scholar]
- Whipple, W.; Hunter, J. Nonpoint sources and planning for water pollution control. Water Pollut. Control Fed. 1977, 49, 152. [Google Scholar]
- Ma, B.; Liu, Y.; Xue, J. Analysis of fertilizer application and nitrogen and phosphorus loss in rice-wheat rotation area in southern Hebei. J. Irrig. Drain. 2007, 26, 72–74. [Google Scholar]
- Statistical Bureau of Nanchang. Nanchang Statistical Yearbook; China Statistics Press: Beijing, China, 1991–2014.
- Statistical Bureau of Ganzhou. Ganzhou Statistical Yearbook; China Statistics Press: Beijing, China, 1991–2014.
- Liu, G.; Zhao, Z.; Li, Q. The current situation of agricultural non-point source pollution in the Three Gorges Reservoir Area and its prevention and control measures. Chin. J. Eco-Agric. 2004, 12, 172–175. [Google Scholar]
- Milder, J.C.; Scherr, S.J.; Bracer, C. Trends and future potential of payment for ecosystem services to alleviate rural poverty in developing countries. Ecol. Soc. 2010, 15, 4. [Google Scholar] [CrossRef]
- Statistical Bureau of Jiangxi. Jiangxi Statistical Yearbook; China Statistics Press: Beijing, China, 2014.
- Yang, S.; Luan, S. Simulation of non-point source pollution control in cropping based on multi-agent model: Comparison of the effect of environmental service payment by chemical fertilizer tax. Syst. Eng. Theory Pract. 2014, 34, 777–786. [Google Scholar]
- Zhu, Z.; Jin, J. Fertilizer use and food security in China. Plant Nutr. Fertil. Sci. 2013, 19, 259–273. [Google Scholar]


| Option Number | Initial | Tax Rate |
|---|---|---|
| Current 100th period value | ||
| Control plan | No fertilizer tax policy | 0% |
| Sub-scenario C1 | Tax collection starts from the 101st period | 50% |
| Sub-scenario C2 | Tax collection starts from the 101st period | 100% |
| Sub-scenario C3 | Tax collection starts from the 101st period | 150% |
| Sub-scenario C4 | Tax collection starts from the 101st period | 300% |
| Tax Rate | Fertilizer Application Intensity (kg/mu) | Pesticide Application Intensity (kg/mu) | Agricultural Film Application Intensity (kg/mu) | Fertilizer Source TN Loss (kg N/mu) | Fertilizer Source TP Loss (kg P/mu) | Number of Planting Plots (mu) | |
|---|---|---|---|---|---|---|---|
| Current 100th Period value | - | 33.403 | 2.339 | 1.208 | 3806.281 | 243.201 | - |
| Control plan | 0% | 41.264 | 2.652 | 1.616 | 4587.806 | 293.136 | 1458 |
| Sub-scenario C1 | 50% | 32.430 | 2.517 | 1.541 | 3483.124 | 222.553 | 1408 |
| Sub-scenario C2 | 100% | 29.048 | 2.473 | 1.521 | 3136.408 | 200.400 | 1416 |
| Sub-scenario C3 | 150% | 29.912 | 2.478 | 1.527 | 3056.377 | 195.286 | 1340 |
| Sub-scenario C4 | 300% | 30.797 | 2.493 | 1.509 | 2686.530 | 171.655 | 1144 |
| Option Number | Sub-Scenario Number | “Artificial Village” Fertilizer Application Intensity (Kg/Mu) | “Artificial Village” Pesticide Application Intensity (Kg/Mu) | Compensation Situation (Except for One Item in the Form Below, the Unit is Yuan.) | TN Loss of Fertilizer Sources in “Artificial Villages” (Kg) | TP Loss of Fertilizer Sources in Artificial Villages (Kg) | Number of Planting Plots/Mu | |||||
|---|---|---|---|---|---|---|---|---|---|---|---|---|
| U1 | U2 | V1 | V2 | Compensation per mu | Compensation/Income Ratio (%) | |||||||
| Current 100th Period value | - | 33.4 | 2.34 | - | - | - | - | - | - | 3806.28 | 243.2 | - |
| Option 0 | Sub-scenario D0 | 41.26 | 2.65 | 0 | 0 | 0 | 0 | 0 | 0 | 4587.81 | 293.14 | - |
| Option 1 | Sub-scenario D1 | 23.7 | 1.67 | 2.35 | 2.35 | 0.65 | 0.65 | 36.18 | 8.1 | 2135.46 | 247.46 | 1450 |
| Option 2 | Sub-scenario D1 | 15.23 | 1.05 | 4.05 | 4.05 | 1.5 | 1.5 | 112.06 | 24.3 | 1332.46 | 154.41 | 1408 |
| Option 3 | Sub-scenario D1 | 15.15 | 1.03 | 2.8 | 4.2 | 0.75 | 1.7 | 95.17 | 21.4 | 1408.48 | 163.21 | 1496 |
© 2018 by the authors. Licensee MDPI, Basel, Switzerland. This article is an open access article distributed under the terms and conditions of the Creative Commons Attribution (CC BY) license (http://creativecommons.org/licenses/by/4.0/).
Share and Cite
Liu, G.; Xie, H. Simulation of Regulation Policies for Fertilizer and Pesticide Reduction in Arable Land Based on Farmers’ Behavior—Using Jiangxi Province as an Example. Sustainability 2019, 11, 136. https://doi.org/10.3390/su11010136
Liu G, Xie H. Simulation of Regulation Policies for Fertilizer and Pesticide Reduction in Arable Land Based on Farmers’ Behavior—Using Jiangxi Province as an Example. Sustainability. 2019; 11(1):136. https://doi.org/10.3390/su11010136
Chicago/Turabian StyleLiu, Guiying, and Hualin Xie. 2019. "Simulation of Regulation Policies for Fertilizer and Pesticide Reduction in Arable Land Based on Farmers’ Behavior—Using Jiangxi Province as an Example" Sustainability 11, no. 1: 136. https://doi.org/10.3390/su11010136
APA StyleLiu, G., & Xie, H. (2019). Simulation of Regulation Policies for Fertilizer and Pesticide Reduction in Arable Land Based on Farmers’ Behavior—Using Jiangxi Province as an Example. Sustainability, 11(1), 136. https://doi.org/10.3390/su11010136