4.1. Distribution of Pollutant Emissions
The polluted regions are distributed unevenly and are highly agglomerated in just a few regions.
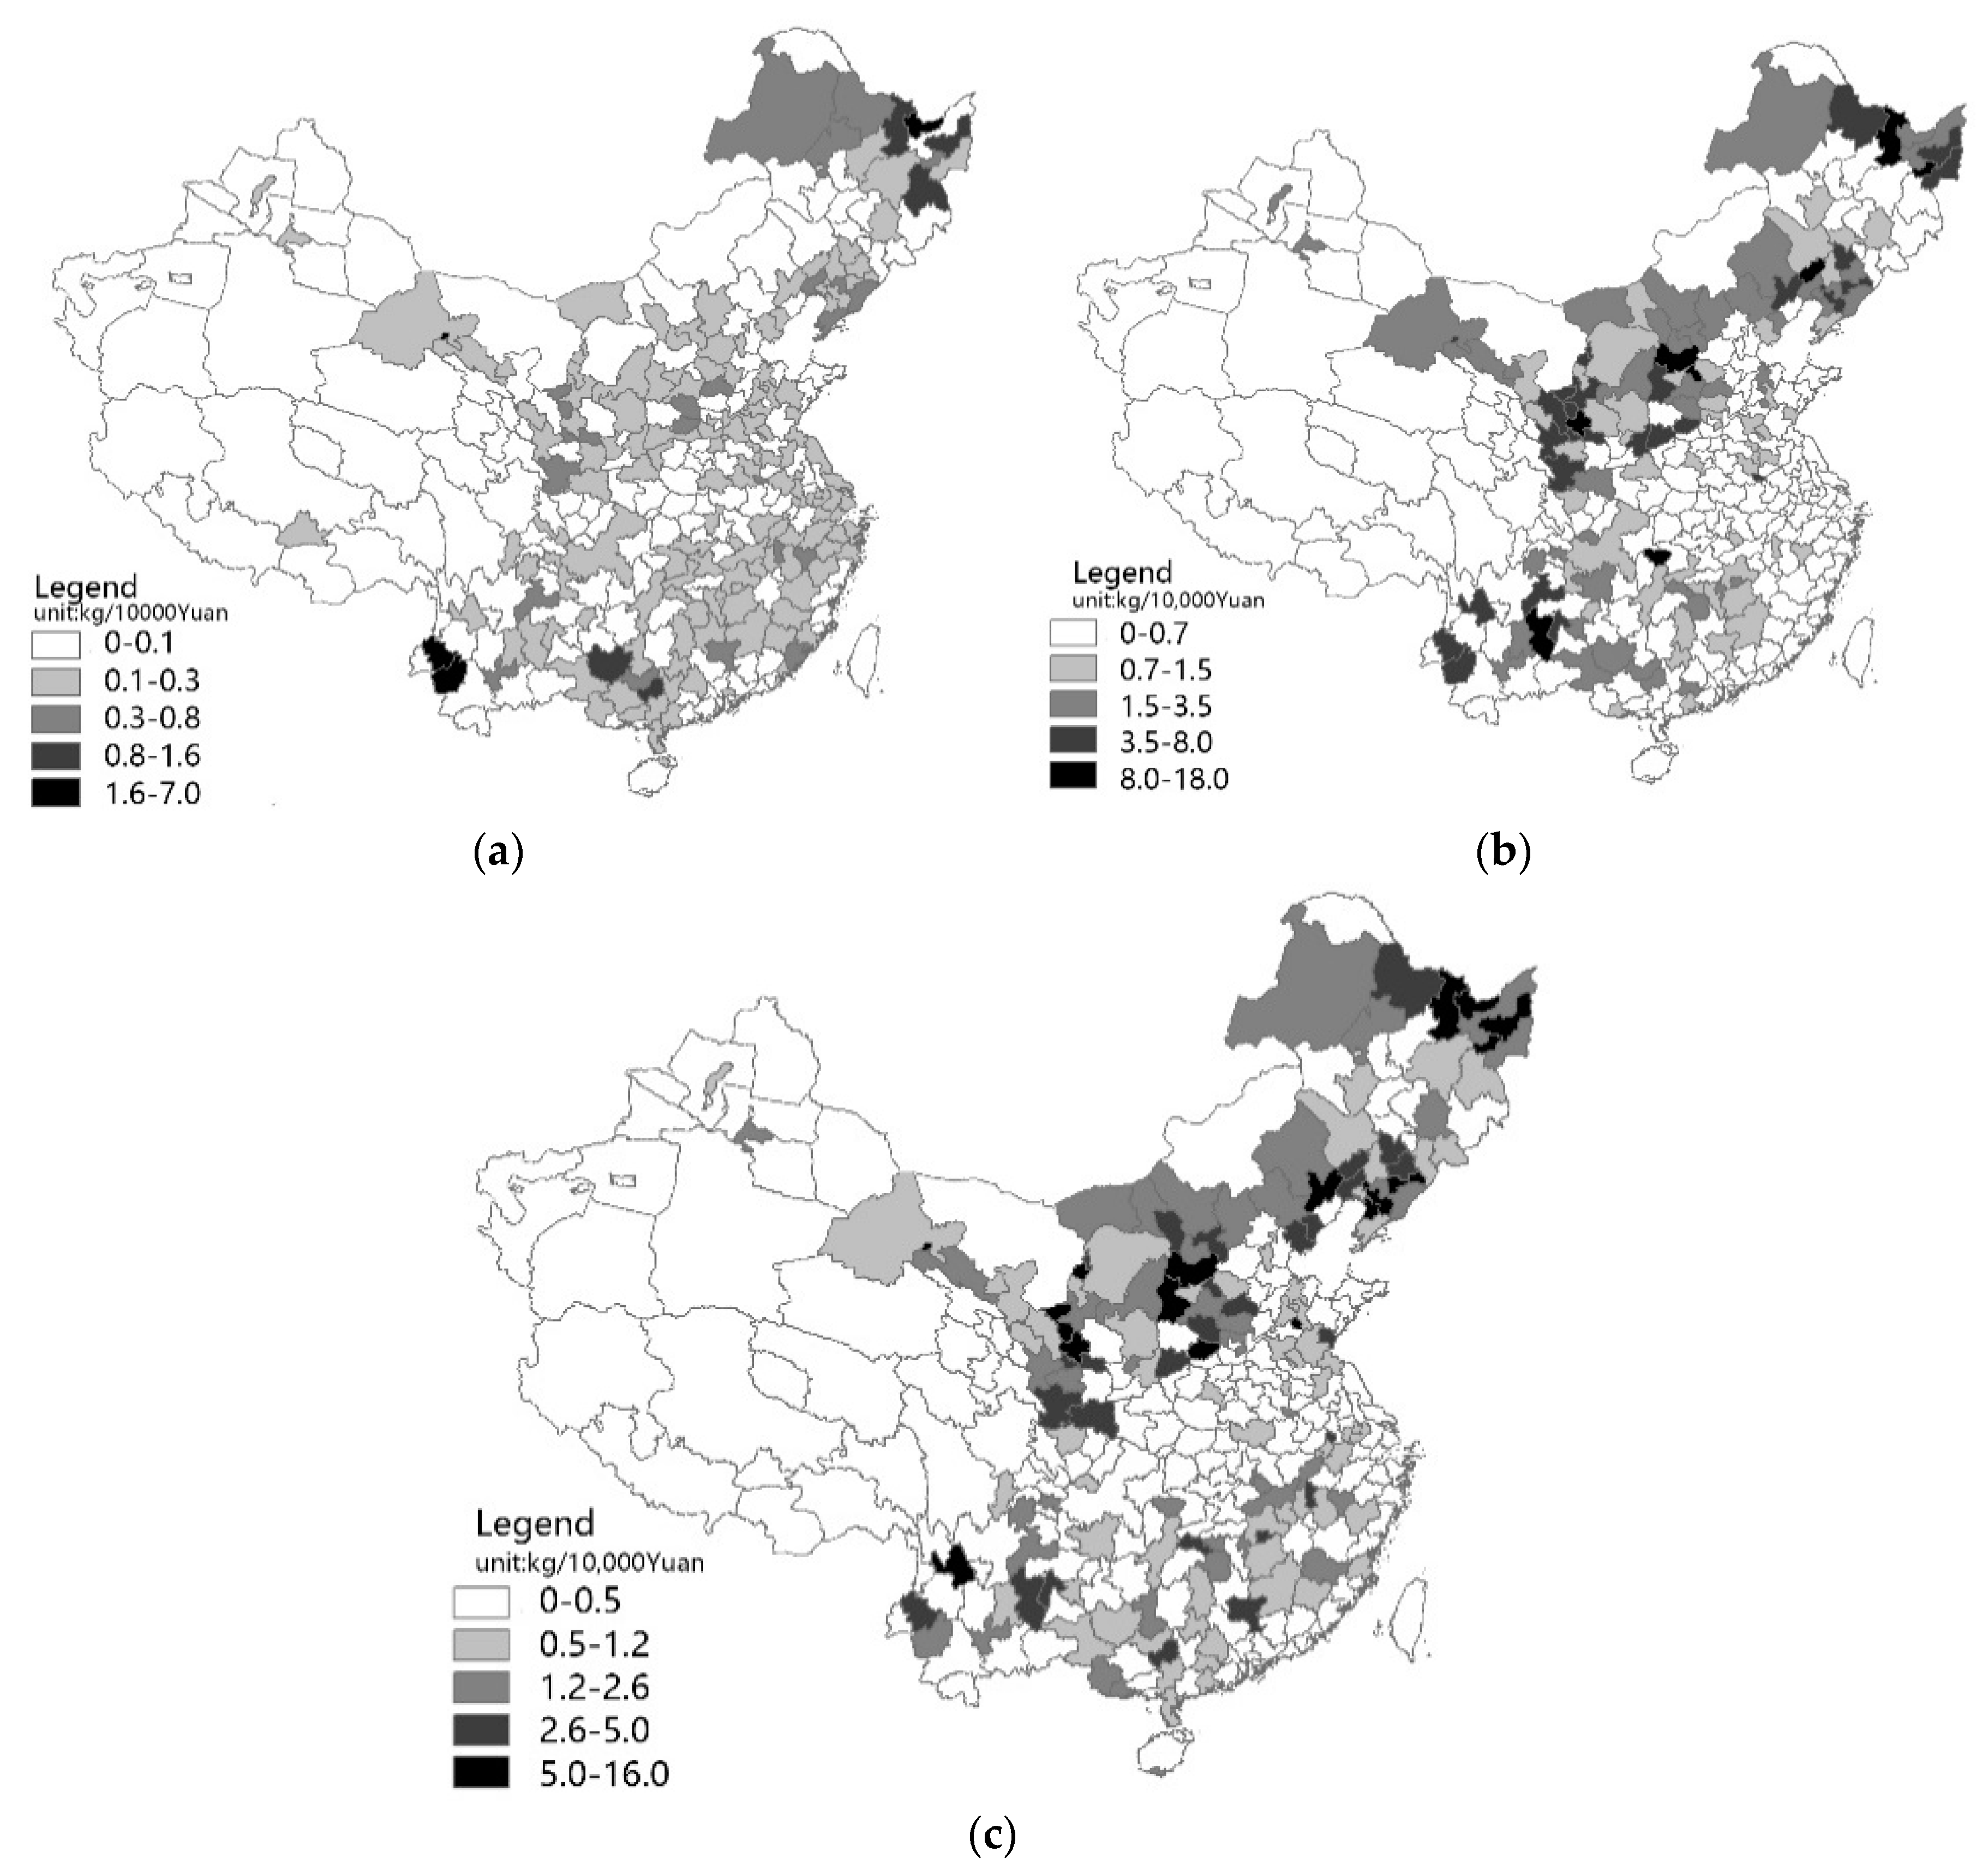
Figure 2 shows the distribution of wastewater, sulfur dioxide and soot emissions across Chinese cities in 2016. It can be seen that wastewater emissions are higher in the coastal regions than in the inland regions. The regions around the Yangtze River Delta and the Beijing-Tianjin area are more affected by wastewater pollutants than the inner regions. All of the most polluted regions have a higher population and more industrial activity than other areas. However, the distributions of sulfur dioxide and soot pollutant emissions display different patterns. Areas with high levels of sulfur dioxide and soot pollutants are mostly located in northern China, especially in Shanxi and Shaanxi provinces, where there is a lot of coal mining activity and a high incidence of heavy industry that is a source of high levels of pollutant emissions. The Chongqing municipality in southwest China is also a highly polluted region as a result of the high incidence of heavy industry in this area.
The spatial pattern of pollutant emissions intensity, which is calculated by dividing pollutant emissions by the gross value of the industrial outputs of the city, displays a slightly different picture.
Figure 3 shows the pollutant emissions intensity distribution for prefectural-level cities across China in 2016. Higher wastewater pollutant emissions intensity cities are mostly distributed in the south and northwest of China, especially in cities in Guangxi province and Shaanxi province. These regions have a greater number of pollutant industries, while the gross value added of these industries is lower than that of industries in the eastern region. The high sulfur dioxide pollutant emissions intensity areas are mostly distributed in the northeast, northwest and southwest of China. The high incidence of heavy industry and the basin-like topography are the main reasons for the high levels of sulfur dioxide pollutant emissions in Guangxi province in the southern part of China.
Since 2000, the distribution of pollutants has tended to move toward the central regions of China, following the trend of industries moving inland [
65]. It can be seen from
Table 2, that in 2003, the Gini coefficients of the three kinds of pollutant emissions were between 0.5 and 0.55, while in 2016, the Gini coefficients for wastewater and sulfur dioxide pollutants had fallen to 0.45 and 0.53, indicating that pollutant emissions are diffusing, along with the industries responsible, into the middle and western parts of China. However, the Gini coefficient for soot pollutant emissions rose a little during the same period, indicating that soot pollutant emissions tended to remain agglomerated. This might be because people have increasingly come to recognize the importance of environmental issues, and because soot pollutant emissions are a primary concern, they have been more stringently regulated in the more prosperous areas in China in recent years.
The relationships between cities can be visualized using the networks in the GIS environment. The social and economic linkages among cities as represented by the Weibo network and the economic network, respectively, are shown in
Figure 4 and
Figure 5. Only the strongest 10% of linkages are shown for the sake of clarity. These figures reflect the structures of the Weibo network and economic network among cities. The thickness of the lines indicates the strength of the linkage, while the darkness and width of line means the magnitude of links. These networks show different linkage structures to those identified through spatial locations. Regarding the social networks based on Weibo big data, the cities with the strongest linkages are Beijing, Shanghai, Shenzhen, Wuhan, Hangzhou, and Nanjing, while the most linked regions are distributed within or among the Beijing–Tianjin region, the Yangtze River Delta region, and the Pearl River Delta region. People in these regions display the greatest concern regarding environmental issues via social media. As for the economic networks, the cities with the strongest linkages are Beijing, Shanghai, Chengdu, Shenzhen, and Guangzhou. The most linked regions are located in the eastern part of China, while some of the regional centers in the western and middle parts of China, such as Chengdu, Chongqing, Xian, Zhengzhou, Wuhan, and Changsha, also have strong linkages with other cities.
4.2. Findings from Integrated Regression Models
The coefficients of
lnGDPPC,
lnVA,
IND, and
TER are all greater than 0.5 (see
Appendix A Table A1), so we dropped
lnPGDP and
TER to eliminate multicollinearity problems. The descriptions of the variables are presented in
Appendix A Table A2. The results of the estimations are shown in
Table 3,
Table 4 and
Table 5.
Table 3 shows the results of introducing the social network to test the spillover effects of agglomeration, environmental regulations and technological inputs on environmental pollution.
Table 4 shows the results of introducing the economic network to test the spillover effect of economic speculation.
Table 5 shows the results of introducing the spatial matrix based on geographic locations to explore the spatial spillovers. In each table, columns 1, 2 and 3 show wastewater emissions intensity, sulfur dioxide emissions intensity, and soot emissions intensity, respectively, as the dependent variable.
The results largely confirm our expectations, that is, industrial agglomeration can lead to a significant reduction in pollutant emissions. The results presented in
Table 3 show that the intensity of wastewater, sulfur dioxide and soot pollutant emissions decrease by 1.7%, 1.9%, and 2.9%, respectively, when industrial agglomeration increases by 10%. The coefficient for environmental regulations is significantly negative for all three kinds of pollutant emissions, indicating that environmental regulations can reduce the intensity of pollutant emissions, which is consistent with the findings of previous studies [
5,
61,
66,
67]. The estimate effects are persistent across the specifications in
Table 3,
Table 4 and
Table 5. Financial support for R&D has a significant positive effect on pollutant emissions intensity in all three cases, while the number of patents per capita has no impact on pollutant emissions. Similar results are obtained when we introduce the social and economic networks, as shown in
Table 4 and
Table 5 respectively. Technological input from the government can be used to improve emissions processing equipment, thereby quickly reducing emissions. However, patents cannot be used immediately by the local agent, and thus are more likely to be used by people in related cities.
The other coefficients show the expected signs. Foreign investment does not have a significant effect on wastewater emissions, but can significantly improve sulfur dioxide emissions, and reduced the soot emissions, as shown in
Table 3 and
Table 4. The share of secondary industry has a significant negative effect on water and soot pollutant emissions intensity in all cases, possibly because of the more efficient treatment of pollutant emissions in regions with a higher incidence of industry. Energy intensity has a positive effect on wastewater and sulfur dioxide pollutant emissions intensity, which is loosely consistent with a previous finding that higher energy intensity contributes to more pollutant emissions [
68].
Table 3,
Table 4 and
Table 5 show the regression results for the SDM under
Wweibo,
Wecon and
Wdist, respectively. The SDM recognizes the network spillover effects of agglomeration, environmental regulations and technology through the coefficients of interactions between the three matrices and the dependent variables.
Table 3,
Table 4 and
Table 5 shows the results of spillovers through social, economic, and spatial networks, respectively. The ρ values denote the spillovers of pollutant emissions in other cities in the networks on the pollutant emissions intensity of the target city. All of the ρ values in the three tables are significantly positive, indicating positive spillovers through all three kinds of networks, although the results for the spatial network, shown in
Table 5, are significantly higher than those for the other two channels. This is not surprising, given that pollutant emissions are mainly spread across geographical areas [
3,
69]. It can also be seen from
Table 4 and
Table 5 that the ρ values for sulfur dioxide and soot are higher than that for wastewater, confirming that air pollution always spreads further than wastewater pollution.
The three kinds of network channels influence spillovers in different ways. Regarding the spillover effect of industrial agglomeration on pollutant emissions intensity, we found that the coefficients of
Wweibo*lnVA are significantly negative in relation to wastewater and sulfur dioxide emissions, and those of
Wweibo*lnFirms shown in
Table 3 are significantly negative in relation to SO
2 and soot emissions. This effect is barely evident in
Table 4, which shows the results of introducing the economic network, while the coefficients of
Wdist*lnFirms in
Table 5 show a significant reduction in sulfur dioxide and soot emissions intensity. This suggests that social network-related industrial agglomeration of cities tends to reduce the local city’s pollutant emissions, but such spillovers can hardly be prompted by economic networks. Geographic location also plays a vital role in the effect of spillovers from industrial agglomeration on pollutant emissions.
Regarding environmental regulations spillover to other cities, it can be seen that the coefficients of
Wweibo*Regulation and
Wweibo*Treatrate shown in
Table 3, which integrate the social network, have a significant positive effect on pollutant emissions, while they are insignificant in the other two spillover channels. This indicates that other social related cities’ environmental regulation in the social network might worsen the environment of the local environment. It is known that environmental regulations are mostly transferred through social networks, especially among cities with similar ideas regarding environmental protection. However, the results show that such spillovers are increasing pollutant emissions in social media-linked cities. This indicates that more pollutant industries might transfer to social media-linked cities, consistent with the “not-in-my-backyard” phenomenon, whereby local governments toughen their environmental regulations to keep polluting firms from locating within their jurisdictions [
70]. Toughening their regulations will improve their own environment, but at the price of increased environmental pollution in social media-related cities. It appears that the interactions of spatial matrices and environmental regulations are significantly negative in relation to wastewater emissions, as shown in
Table 5, indicating that neighboring cities’ regulations might help to reduce a city’s wastewater emissions, but have no effect on SO
2 and soot emissions.
The technology spillover effect on pollutant emissions through networks is significantly negative under Wecon*lnPatent, although the technology input’s (W*Techinput) spillovers have no effect. These spillovers are not significant under Wweibo and Wdist, indicating that neither the existence of a social network nor spatial proximity leads to the diffusion of clean technology. An economic network is the only means by which clean technology can be diffused to other cities, thereby lowering the pollutant emissions intensity in those cities.
In summary, the results show that the spillover channels differ for different variables. For spillover effects of industrial agglomeration on pollutant emissions, social network and spatial proximity are the most important channels. Industrial agglomeration not only reduces a city’s pollutant emissions, but also reduces emissions in cities that are related through social and spatial networks. Environmental regulations have a negative spillover effect on related cities’ environments through social networks. Stringent regulations in one city can cause social media-linked cities to face increased environmental pressure, but more pollutant emissions social media-linked cities are mainly caused by pollution transfer. However, new technology can significantly reduce the pollutant emissions intensity of cities in an economic network.


