Analysis of Particulate Matter Concentration Variability and Origin in Selected Urban Areas in Poland


 and
and
Abstract
:
1. Introduction
2. Area and Methodology of the Research
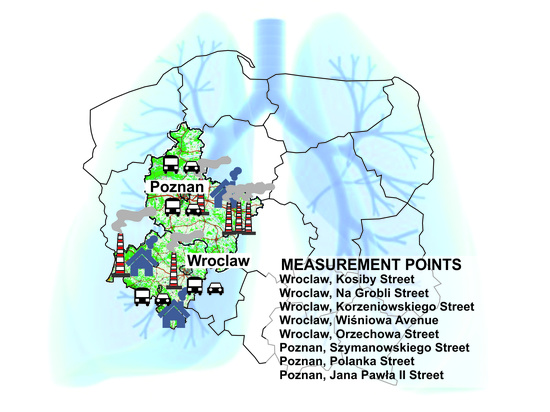
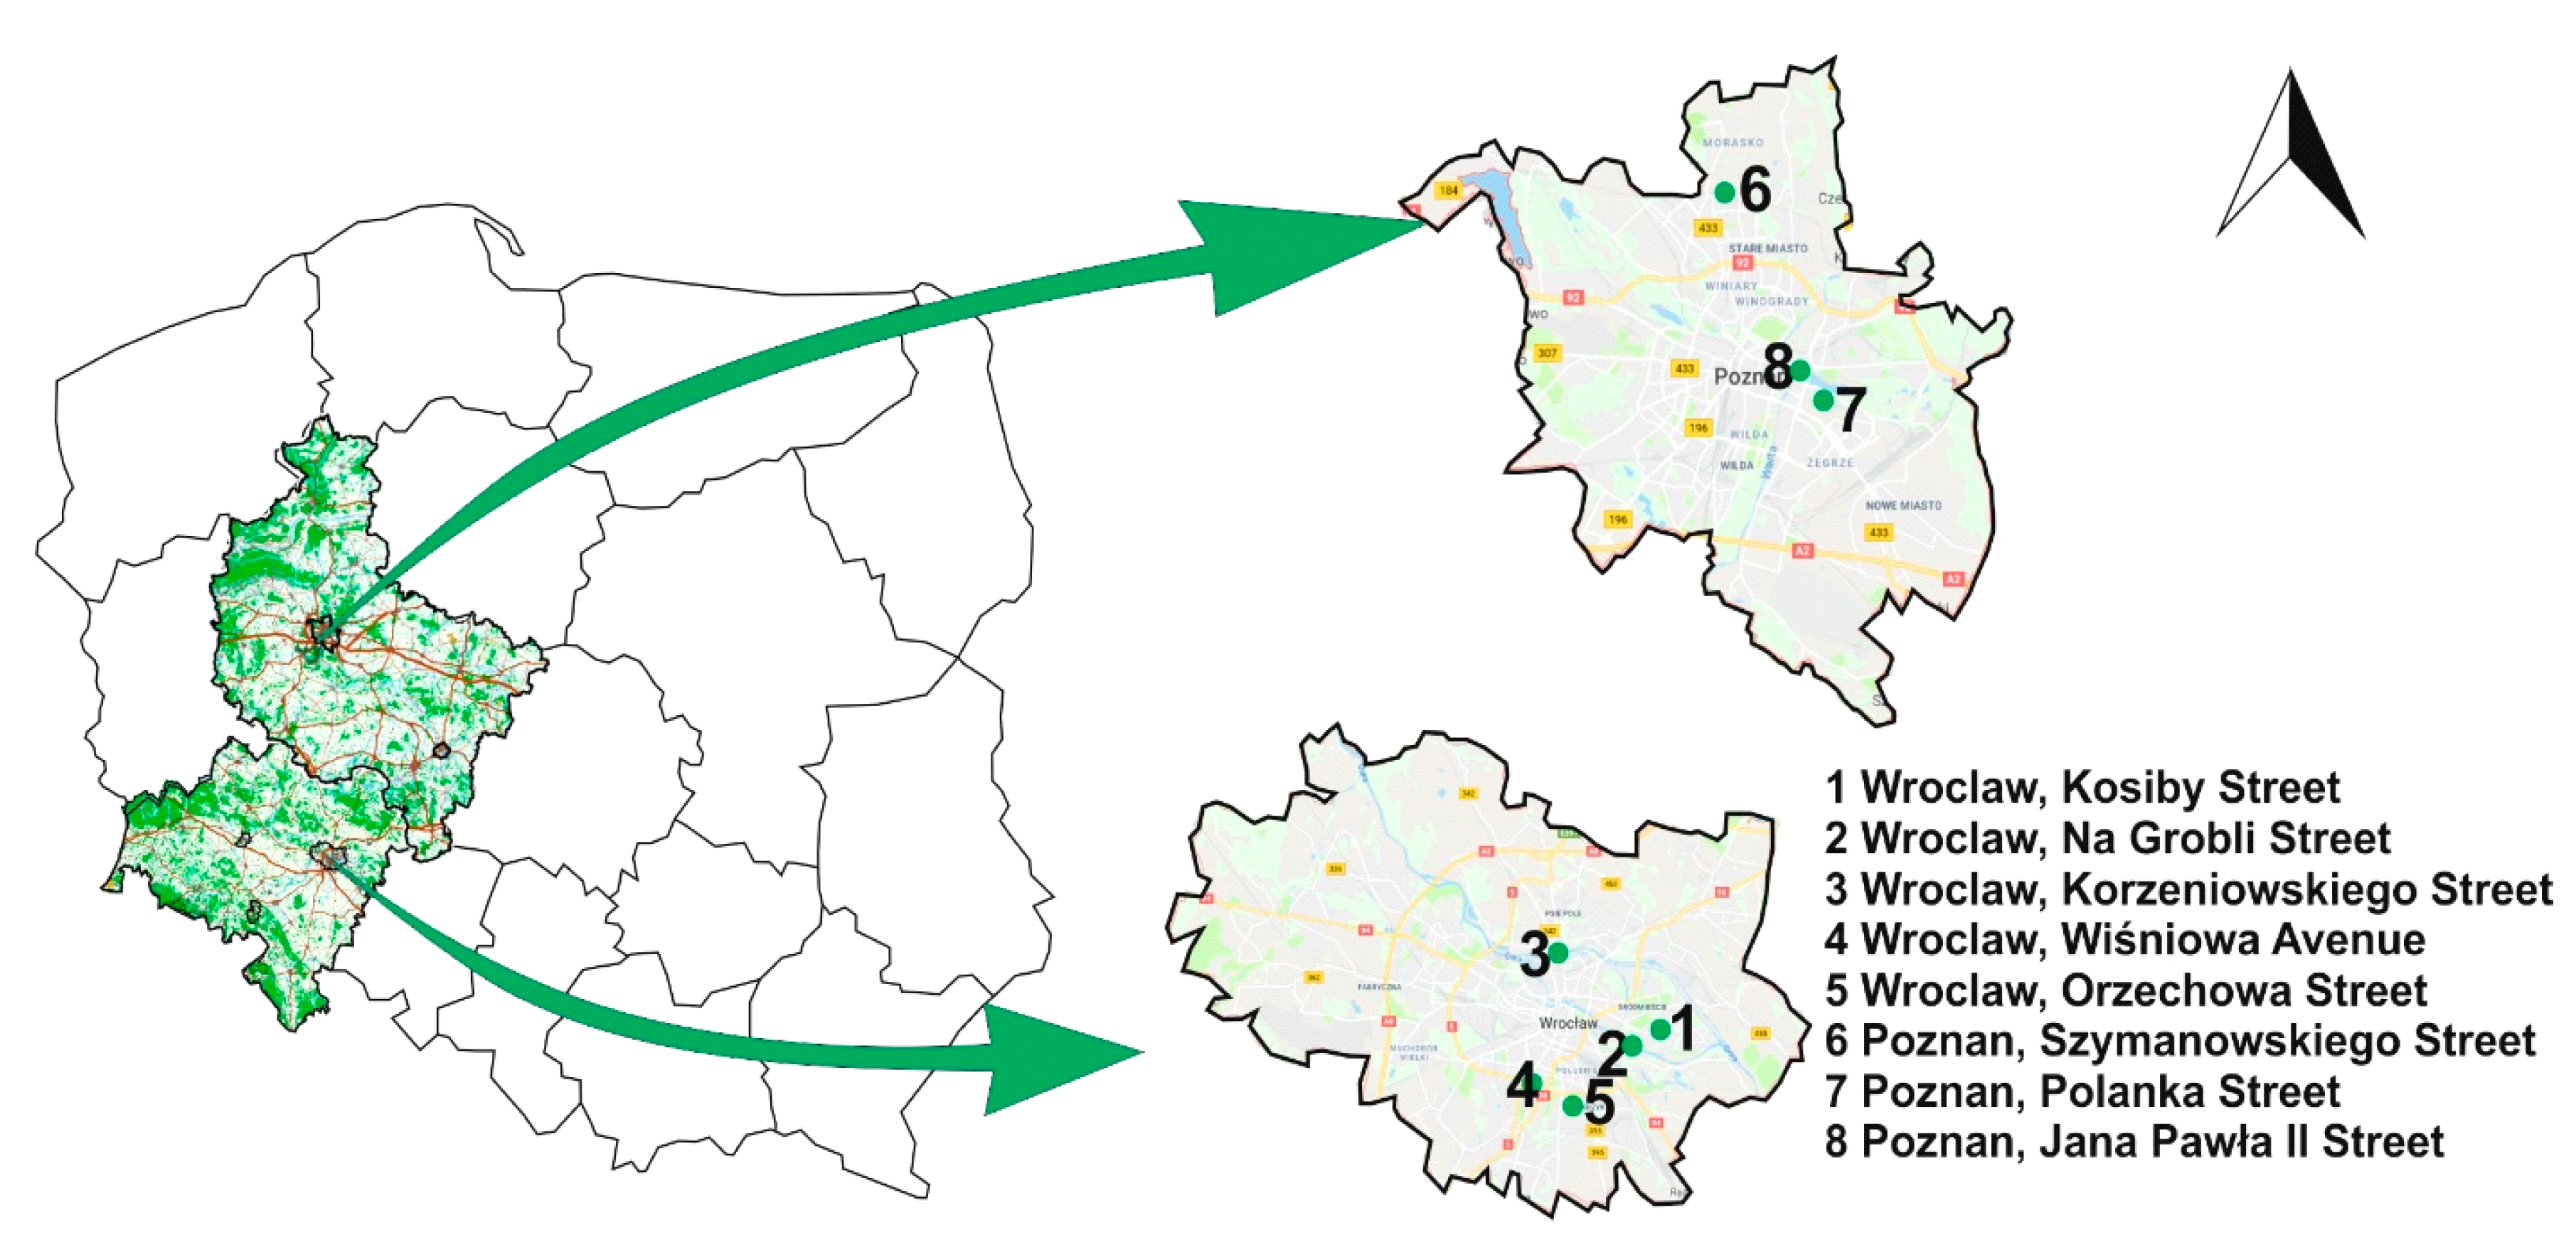
2.1. Research Time Periods and Characteristics of Measurement Points
2.2. Collection of Samples and Determination of Particulate Matter Concentration
2.3. Analysis of OC and EC Content in Particulate Matter Samples
- Total measurement uncertainty of EC in PM2.5 particulate matter: 5%;
- EC limit of detection (LOD): 0.1 μg/cm2;
- Total measurement uncertainty of OC in PM2.5 particulate matter: 5%;
- OC limit of detection (LOD): 0.47 μg/cm2.
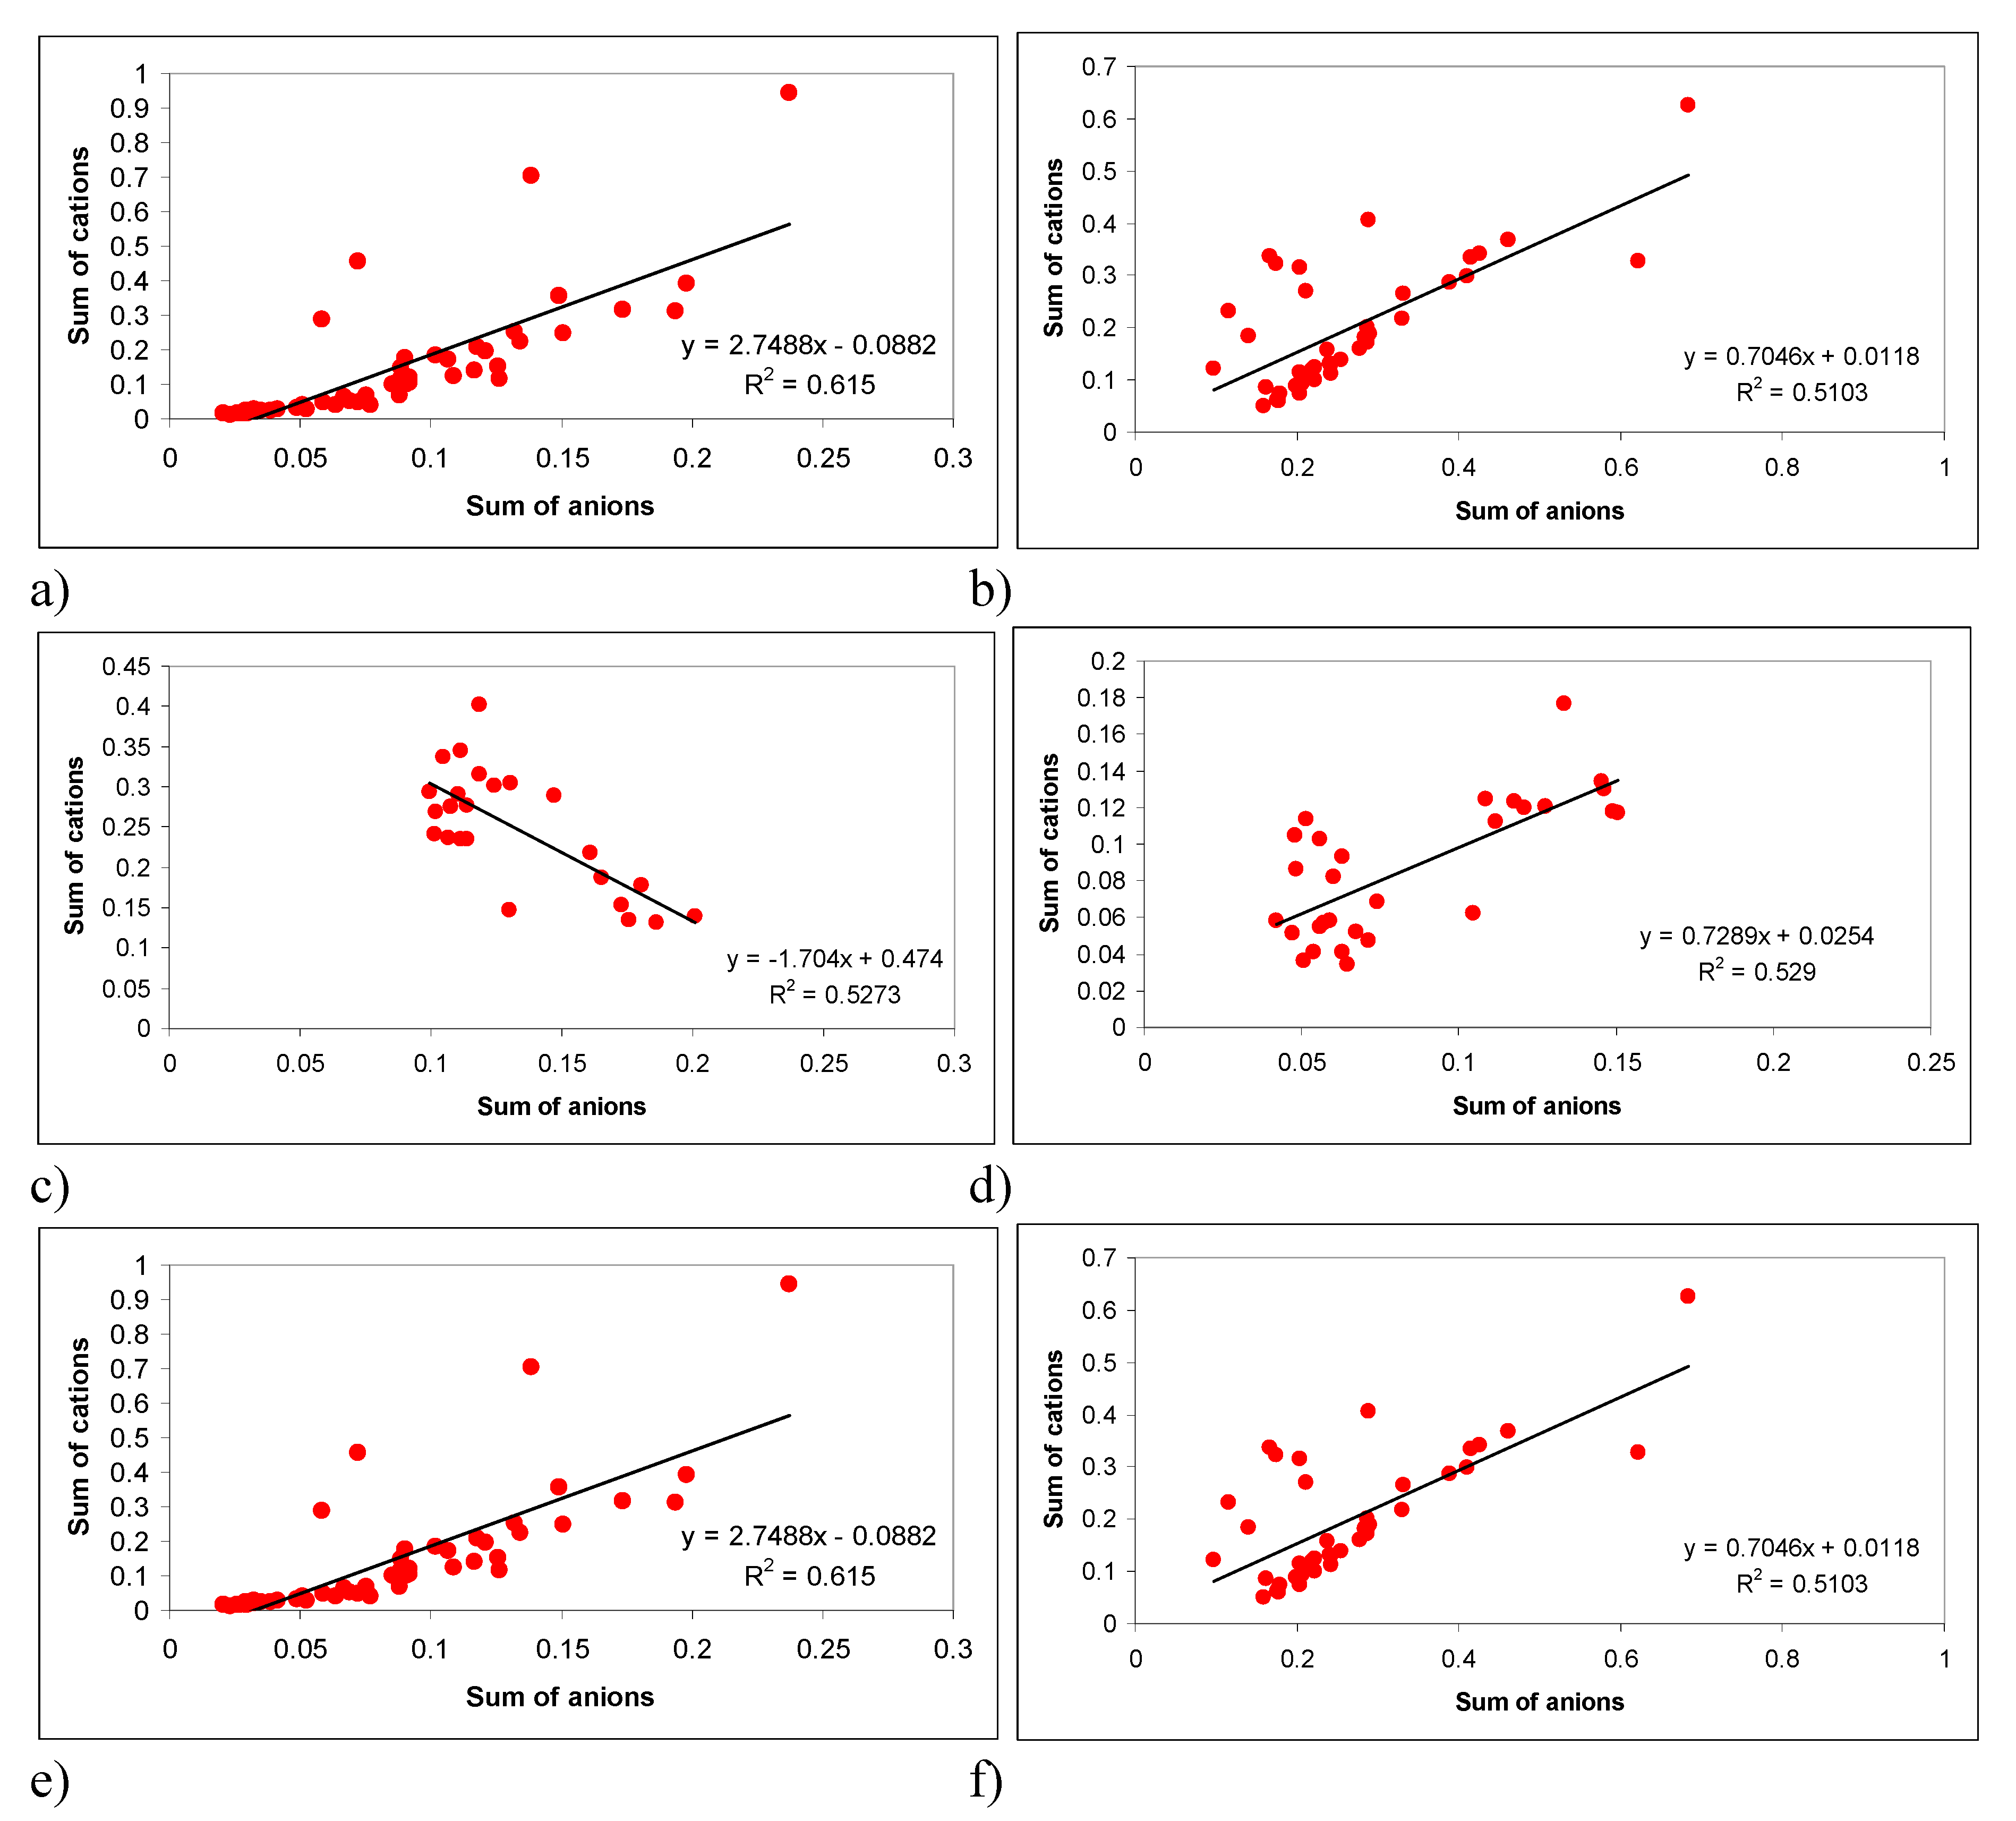
2.4. Analysis of the Content of Ions Soluble in Water in Samples of Particulate Matter
2.5. Analysis of Main Components
3. Result and Discussion
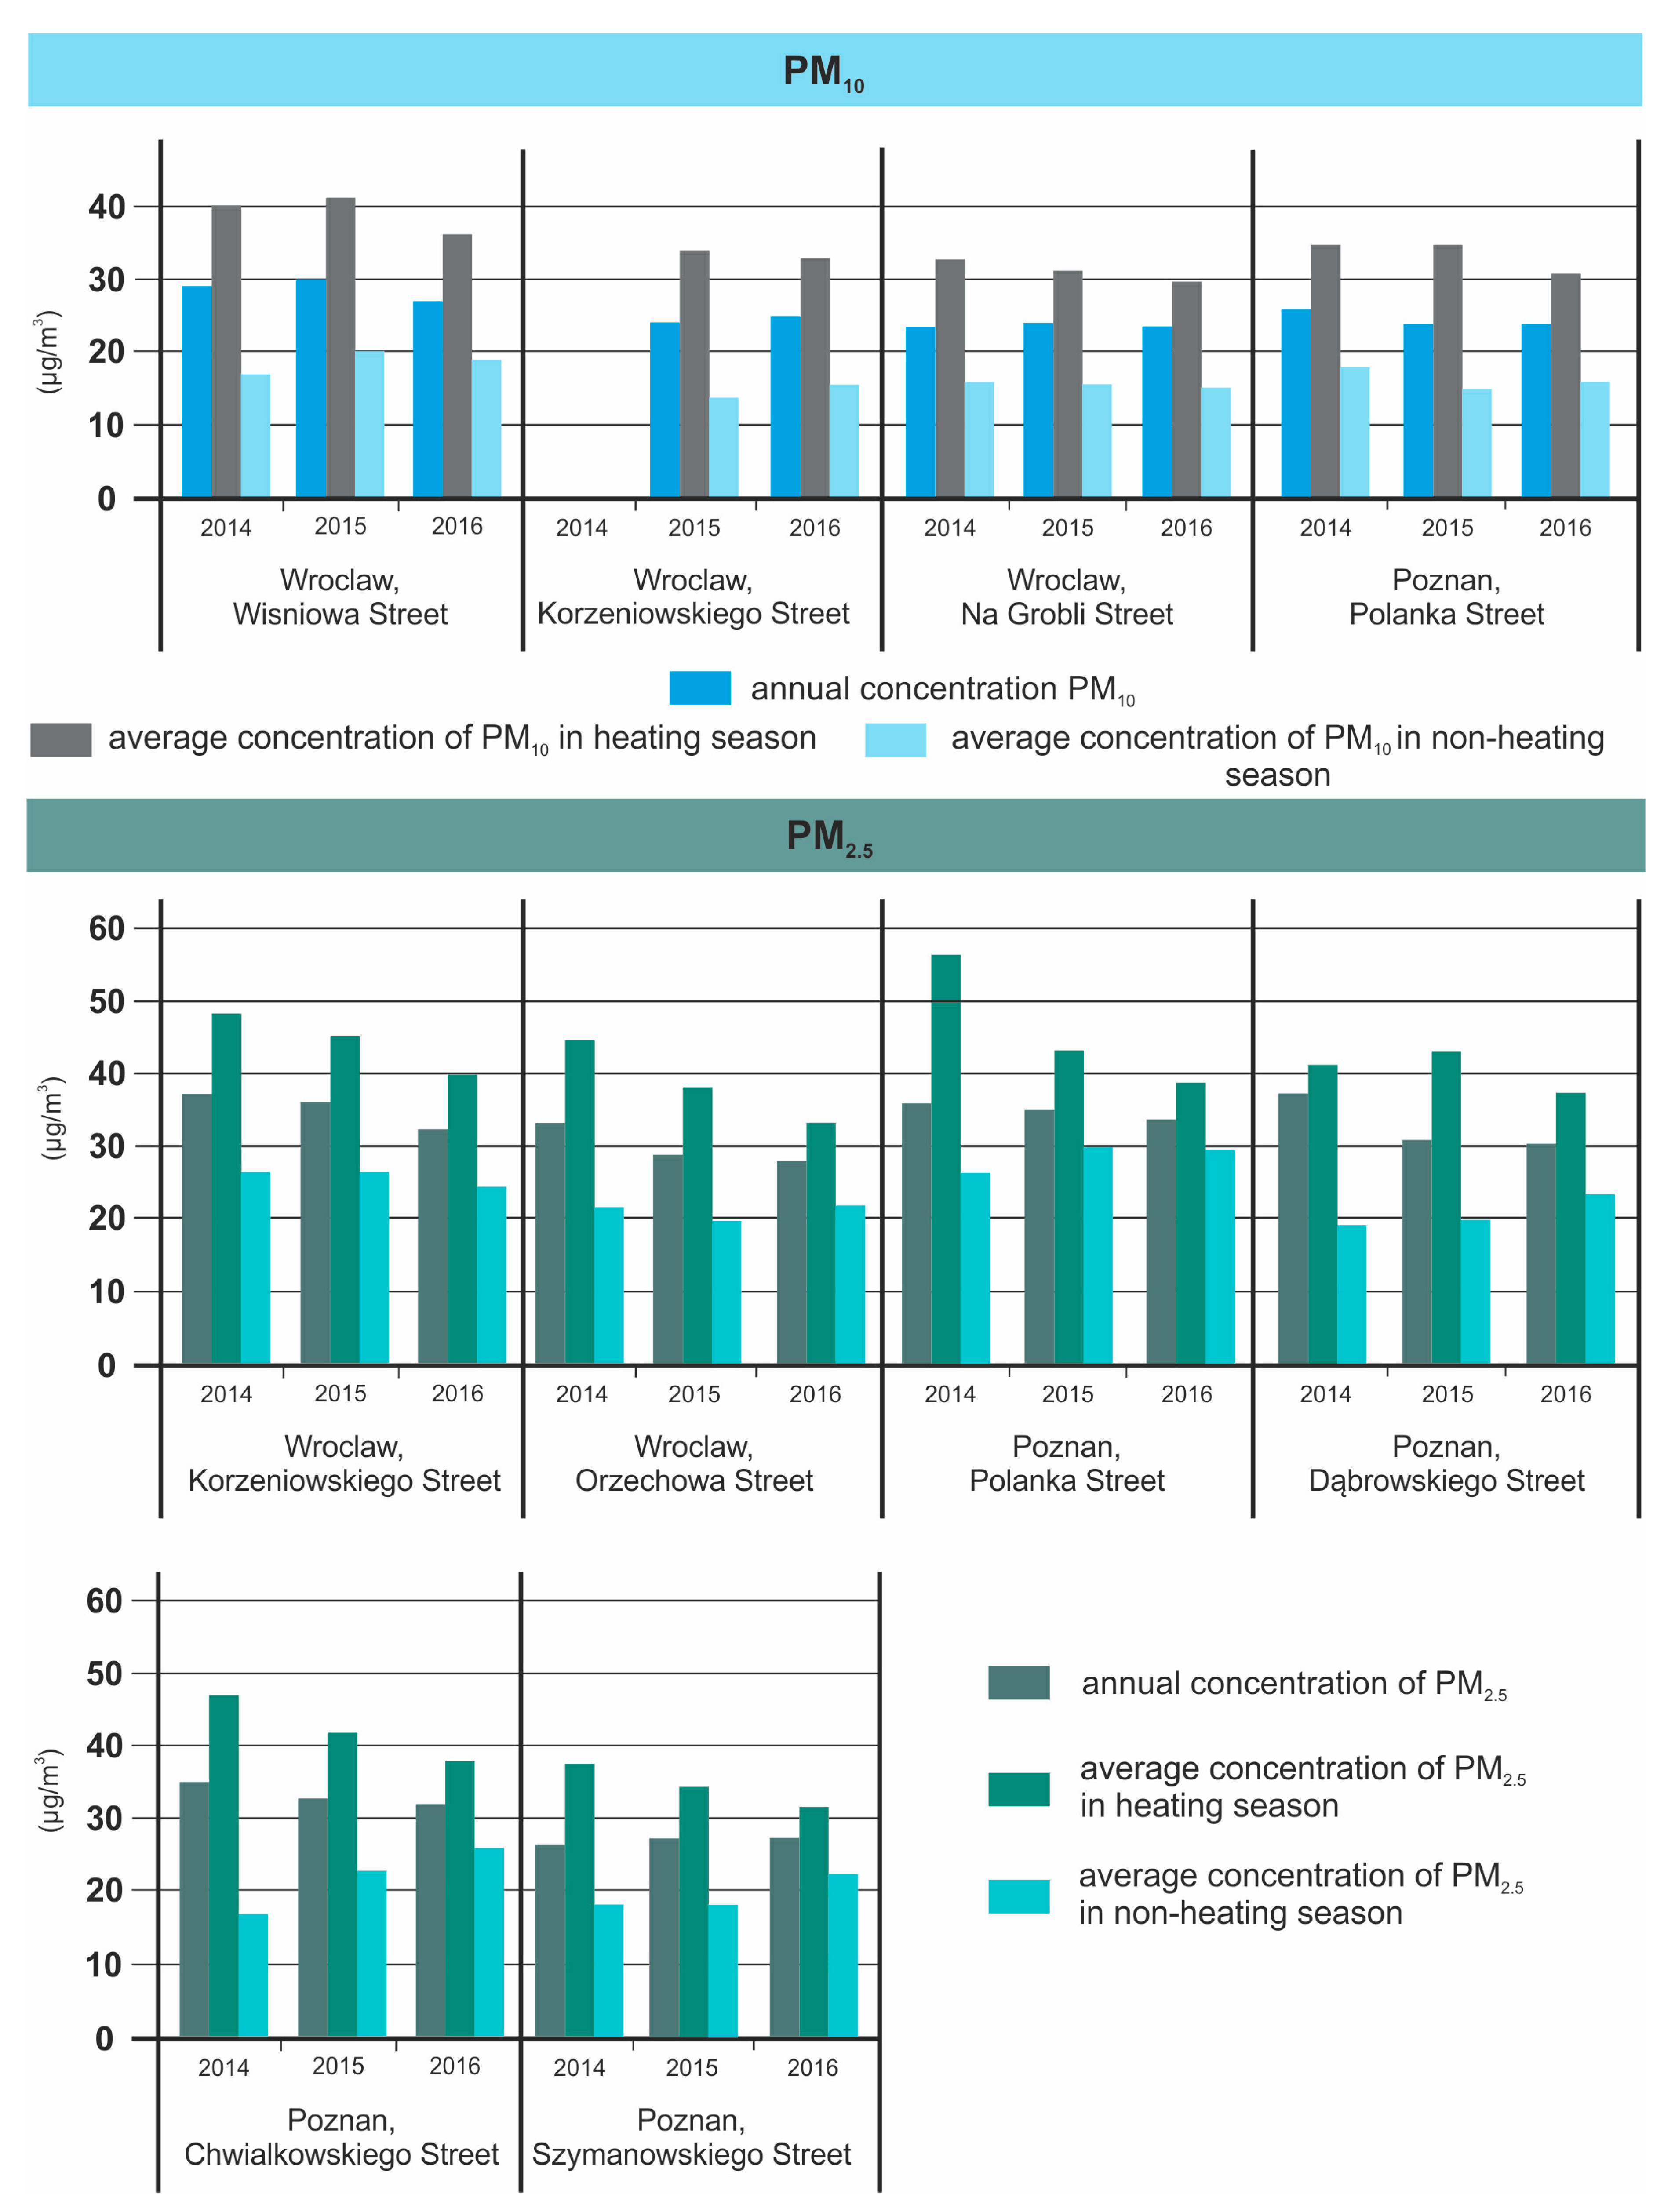
3.1. Analysis of Variability in Concentration of Particulate Matter in Wrocław and Poznań
3.2. Analysis of Variability in Concentrations of Elemental/Organic Carbon and Selected Ions
3.3. Identification of the Sources of Origin of Particulate Matter in Wrocław and Poznań
4. Summary
Author Contributions
Funding
Conflicts of Interest
References
- European Environment Agency. Air Quality in Europe—2016 Report; Publications Office of the European Union: Luxemburg, 2016. [Google Scholar]
- Oberdörster, G.; Sharp, Z.; Atudorei, V.; Elder, A.; Gelein, R.; Lunts, A.; Kreyling, W.; Cox, C. Extrapulmonary translocation of ultrafine carbon particles following whole-body inhalation exposure of rats. J. Toxicol. Environ. Health Part A 2002, 65, 1531–1543. [Google Scholar] [CrossRef] [PubMed]
- Wilson, M. Interactions between Ultrafine Particles and Transition Metals in Vivo and in Vitro. Toxicol. Appl. Pharm. 2002, 184, 172–179. [Google Scholar] [CrossRef]
- Gwinn, M.R.; Vallyathan, V. Nanoparticles. Health effects—Pros and cons. Environ. Health Perspect. 2006, 114, 1818. [Google Scholar] [CrossRef] [PubMed]
- Lu, S.; Zhang, W.; Zhang, R.; Liu, P.; Wang, Q.; Shang, Y.; Wu, M.; Donaldson, K.; Wang, Q. Comparison of cellular toxicity caused by ambient ultrafine particles and engineered metal oxide nanoparticles. Part. Fibre Toxicol. 2015, 12, 5. [Google Scholar] [CrossRef]
- Corsini, E.; Vecchi, R.; Marabini, L.; Fermo, P.; Becagli, S.; Bernardoni, V.; Caruso, D.; Corbella, L.; Dell’Acqua, M.; Galli, C.L.; et al. The chemical composition of ultrafine particles and associated biological effects at an alpine town impacted by wood burning. Sci. Total Environ. 2017, 587, 223–231. [Google Scholar] [CrossRef]
- Widziewicz, K.; Rogula-Kozłowska, W. Urban environment as a factor modulating metals deposition in the respiratory track and associated cancer risk. Atmos. Pollut. Res. 2017, 9, 399–410. [Google Scholar] [CrossRef]
- European Environment Agency. Air Quality in Europe—2018 Report; Publications Office of the European Union: Luxemburg, 2018. [Google Scholar] [CrossRef]
- Chlebowska-Styś, A.; Kobus, D.; Pachurka, Ł.; Sówka, I. Analysis of concentrations trends and origins of PM 10 in selected European cities. E3S Web Conf. 2017, 17, 13. [Google Scholar] [CrossRef] [Green Version]
- Chlebowska-Styś, A.; Sówka, I.; Pachurka, Ł. Analysis of air quality in selected polish cities. In Człowiek a Środowisko: Wzajemne Oddziaływanie = Man vs Environment: Interaction; Chmielewski, J., Żeber-Dzikowska, I., Gworek, B., Eds.; Instytut Ochrony Środowiska, Państwowy Instytut Badawczy: Warszawa, Poland, 2016; pp. 103–120. (In Polish) [Google Scholar]
- Błaszczak, B.; Rogula-Kozłowska, W.; Mathews, B.; Juda-Rezler, K.; Klejnowski, K.; Rogula-Kopiec, P. Chemical Compositions of PM2.5 at Two Non-Urban Sites from the Polluted Region in Europe. Aerosol Air Qual. Res. 2016, 16, 2333–2348. [Google Scholar] [CrossRef] [Green Version]
- Rogula-Kozłowska, W.; Majewski, G.; Czechowski, P.O.; Rogula-Kopiec, P. Analysis of the data set from a two-year observation of the ambient water-soluble ions bound to four particulate matter fractions in an urban background site in southern Poland. Environ. Prot. Eng. 2017, 43, 137–149. [Google Scholar] [CrossRef]
- Czarnecka, M.; Kalbarczyk, R. Weather conditions determining variability of suspended particulate matter concentration in Pomerania. Acta Agroph 2008, 11, 357–368. [Google Scholar]
- Juda-Rezler, K.; Reizer, M.; Oudinet, J.-P. Determination and analysis of PM10 source apportionment during episodes of air pollution in Central Eastern European urban areas: The case of wintertime 2006. Atmos. Environ. 2011, 45, 6557–6566. [Google Scholar] [CrossRef]
- Chlebowska-Styś, A.; Kobus, D.; Zathey, M.; Sówka, I. The impact of road transport on air quality in selected Polish cities. E3S Web Conf. 2017, 22, 1–8. [Google Scholar]
- Rogula-Kozłowska, W. Size-segregated urban particulate matter: Mass closure, chemical composition, and primary and secondary matter content. Air Qual. Atmos. Health 2016, 9, 533–550. [Google Scholar] [CrossRef]
- Cembrzyńka, J.; Krakowiak, E.; Brewczyński, P.Z. Zanieczyszczenie powietrza pyłem zawieszonym PM10 oraz PM2,5 w warunkach silnej antropopresji na przykładzie miasta Sosnowiec. Med. Środowiskowa Environ. Med. 2012, 15, 31–38. [Google Scholar]
- Chlebowska-Styś, A.; Sówka, I.; Pachurka, Ł. Analiza składu pyłu zawieszonego PM10 na stacji tła miejskiego w Pile. In Interdyscyplinarne Zagadnienia w Inżynierii i Ochronie Środowiska; Kaźmierczak, B., Kotowski, A., Piekarska, K., Eds.; Oficyna Wydawnicza Politechniki Wrocławskiej: Wrocław, Poland, 2016; pp. 36–53. (In Polish) [Google Scholar]
- Jeong, C.H.J.; Jon, M.; Wang, J.M.; Greg, J.; Evans, G.J. Source apportionment of particulate matter in Europe: A review of methods and results. J. Aerosol Sci. 2008, 39, 827–849. [Google Scholar] [CrossRef]
- Kozielska, B.; Kozłowska, W.R.; Pastuszka, J.S. Traffic emission effects on ambient air pollution by PM2.5-related PAH in Upper Silesia, Poland. Int. J. Environ. Pollut. 2013, 53, 245. [Google Scholar] [CrossRef]
- Rogula-Kozłowska, W.; Kuskowska, K.; Ogrodnik, P.; Penkała, M. Traffic-generated changes in the elemental profile of urban coarse dust at a highway and crossroads. E3S Web Conf. 2018, 45, 00074. [Google Scholar] [CrossRef] [Green Version]
- Polish Journal of Laws 2012, item 1031: Regulation of the Minister of the Environment of 24 August 2012 on the Levels of Certain Substances in the Air. Available online: http://prawo.sejm.gov.pl/isap.nsf/DocDetails.xsp?id=WDU20120001031 (accessed on 10 September 2019).
- Almeida, S.M.; Pio, C.; Freitas, M.; Reis, M.; Trancoso, M.; Pio, C.; Reis, M. Approaching PM2.5 and PM2.5−10 source apportionment by mass balance analysis, principal component analysis and particle size distribution. Sci. Total Environ. 2006, 368, 663–674. [Google Scholar] [CrossRef]
- Almeida, S.M.; Pio, C.; Freitas, M.; Reis, M.A.; Trancoso, M. Source apportionment of fine and coarse particulate matter in a sub-urban area at the Western European Coast. Atmos. Environ. 2005, 39, 3127–3138. [Google Scholar] [CrossRef]
- Masiol, M.; Squizzato, S.; Ceccato, D.; Rampazzo, G.; Pavoni, B. A chemometric approach to determine local and regional sources of PM10 and its geochemical composition in a coastal area. Atmos. Environ. 2012, 54, 127–133. [Google Scholar] [CrossRef] [Green Version]
- Samek, L.; Zwoździak, A.; Sówka, I. Chemical characterization and source identification of particulate matter PM10 in rural and urban site in Poland. Environ. Prot. Eng. 2013, 4, 91–103. [Google Scholar] [CrossRef]
- Vianaab, M.; Querolb, X.; Alastueyb, A.; Gilc, J.I.; Menéndezc, M. Identification of PM sources by principal component analysis (PCA) coupled with wind direction data. Chemosphere 2006, 65, 2411–2418. [Google Scholar] [CrossRef]
- Majewski, G.; Rogula-Kozłowska, W.; Czechowski, P.O.; Badyda, A.; Brandyk, A. The Impact of Selected Parameters on Visibility: First Results from a Long-Term Campaign in Warsaw, Poland. Atmosphere 2015, 6, 1154–1174. [Google Scholar] [CrossRef] [Green Version]
- Rogula-Kozłowska, W.; Majewski, G.; Czechowski, P.O. The size distribution and origin of elements bound to ambient particles: A case study of a Polish urban area. Environ. Monit. Assess. 2015, 187, 240. [Google Scholar] [CrossRef]
- Majewski, G.; Rogula-Kozłowska, W. The elemental composition and origin of fine ambient particles in the largest Polish conurbation: First results from the short-term winter campaign. Theor. Appl. Climatol. 2016, 125, 79–92. [Google Scholar] [CrossRef]
- Dragon, K.; Jażdzewska, J. Analiza czynnikowa jako metoda identyfikacji procesów kształtujących skład chemiczny wód podziemnych. Przegląd Geol. 2015, 63, 688–693. (In Polish) [Google Scholar]
- Chlebowska-Styś, A.; Sówka, I. Trendy zmian stężeń pyłów (PM10 i PM2.5) oraz benzo(a)pirenu na przykładzie wybranych miast Wielkopolski. In Interdyscyplinarne Zagadnienia w Inżynierii i Ochronie Środowiska; Kotowski, A., Piekarska, K., Kaźmierczak, B., Eds.; Oficyna Wydawnicza Politechniki Wrocławskiej: Wrocław, Poland, 2015; pp. 40–53. (In Polish) [Google Scholar]
- Rogula-Kozłowska, W.; Pastuszka, J.S.; Talik, E. Influence of Vehicular Traffic on Concentration and Particle Surface Composition of PM10 and PM2.5 in Zabrze, Poland. Pol. J. Environ. Stud. 2008, 17, 539–548. [Google Scholar]
- Pachurka, Ł.; Sówka, I.; Rogula-Kozłowska, W.; Mathews, B.; Chlebowska-Styś, A.; Zwoździak, A. Analiza składu chemicznego i pochodzenia pyłu zawieszonego na wybranym obszarze miasta Wrocławia wraz z określeniem potencjalnego wpływu na zdrowie mieszkańców. In Determinanty Zdrowia = Health Determinants; Chmielewski, J., Florek-Łuszczki, M., Szpringer, M., Eds.; Instytut Ochrony Środowiska, Państwowy Instytut Badawczy: Warszawa, Poland, 2016; pp. 133–141. (In Polish) [Google Scholar]
- World Health Organization. Health Risk Assessment of Air Pollution—General Principles; WHO Regional Office for Europe: Copenhagen, Denmark, 2016. [Google Scholar]
- Chłopek, Z. Identyfikacja Modeli Imisji Cząstek Stałych PM2.5 i PM1; Zeszyty Naukowe Instytutu Pojazdów: Warsaw, Poland, 2012; pp. 157–164. [Google Scholar]
- Rogula-Kozłowska, W.; Klejnowski, K. Submicrometer Aerosol in Rural and Urban Backgrounds in Southern Poland: Primary and Secondary Components of PM1. Bull. Environ. Contam. Toxicol. 2013, 90, 103. [Google Scholar] [CrossRef]
- Allen, A.; Nemitz, E.; Shi, J.; Harrison, R.; Greenwood, J. Size distributions of trace metals in atmospheric aerosols in the United Kingdom. Atmos. Environ. 2001, 35, 4581–4591. [Google Scholar] [CrossRef]
- Rogula-Kozłowska, W.; Klejnowski, K.; Rogula-Kopiec, P.; Ośródka, L.; Krajny, E.; Błaszczak, E.; Mathews, B. Spatial and seasonal variability of the mass concentration and chemical composition of PM2.5 in Poland. Air Qual. Atmos. Health 2014, 7, 41–58. [Google Scholar] [CrossRef]
- Rogula-Kozłowska, W.; Majewski, G.; Błaszczak, B.; Klejnowski, K.; Rogula-Kopiec, P. Origin-Oriented Elemental Profile of Fine Ambient Particulate Matter in Central European Suburban Conditions. Int. J. Environ. Res. Public Health 2016, 13, 715. [Google Scholar] [CrossRef] [PubMed]
- Pachurka, Ł.; Sówka, I.; Rogula-Kozłowska, W.; Chlebowska-Styś, A.; Zwoździak, A. Assessment of the health risks associated with inhalation exposure to cadmium, arsenic and nickel in selected cities of Lower Silesia. In Proceedings of the Ukrainian-Polish Conference: The Problems of Air Pollution and Purification: Control, Monitoring, Catalytic, Photocatalytic and Sorption Methods of Treatment, Kyiv, Ukraine, 6–8 November 2016. [Google Scholar]
- Pachurka, Ł.; Rogula-Kozłowska, W.; Chlebowska-Styś, A.; Nych, A.; Zwoździak, A. Exposure of urban agglomeration population to the selected components of PM1emitted from low emission sources. E3S Web Conf. 2017, 17, 71. [Google Scholar] [CrossRef] [Green Version]
- Pachurka, Ł.; Sówka, I. Wpływ zanieczyszczeń powietrza pyłem zawieszonym na ryzyko potencjalnej utraty zdrowia mieszkańców Wrocławia. In Środowiskowe i Zawodowe Zagrożenia Zdrowia—Wiedza i Praktyka = Environmental and Occupational Health Hazards—Knowledge and Practice; Chmielewski, J., Pawlas, N., Szpringer, M., Eds.; Zakład Poligraficzno-Wydawniczy “Magraf”: Kielce, Poland, 2016; pp. 43–56. (In Polish) [Google Scholar]
- Majewski, G.; Rogula-Kozłowska, W.; Rozbicka, K.; Rogula-Kopiec, P.; Mathews, B.; Brandyk, A. Concentration, Chemical Composition and Origin of PM1: Results from the First Long-term Measurement Campaign in Warsaw (Poland). Aerosol Air Qual. Res. 2018, 18, 636–654. [Google Scholar] [CrossRef]
- Rogula-Kozłowska, W.; Kozielska, B.; Klejnowski, K. Hazardous Compounds in Urban Pm in the Central Part of Upper Silesia (Poland) in Winter. Arch. Environ. Prot. 2013, 39, 53–65. [Google Scholar] [CrossRef]
- Institute of Environmental Engineering of the Polish Academy of Sciences; Institute of Ecology of Industrial Areas; Institute of Meteorology and Water Management PIB; Institute of Environmental Protection PIB. Analysis of the State of Air Pollution with Dust PM10 and PM2.5 Taking into Account the Chemical Composition of Dust and the Impact of Natural Sources—A Synthetic Report; Inspection for Environmental Protection; Institute of Environmental Protection PIB: Zabrze, Poland, 2011. (In Polish) [Google Scholar]
- Lewandowska, A.; Falkowska, L.; Jóźwik, J. Factors determining the fluctuation of fluoride concentrations in PM10 aerosols in the urbanized coastal area of the Baltic Sea (Gdynia, Poland). Environ. Sci. Pollut. Res. 2013, 20, 6109–6118. [Google Scholar] [CrossRef] [Green Version]
- AirBase Official Website. Available online: https://www.eea.europa.eu/data-and-maps/data/airbase-theeuropean-air-quality-database-7 (accessed on 25 August 2017).
- Schwarz, J.; Cusack, M.; Karban, J.; Chalupníˇcková, E.; Havránek, V.; Smolík, J.; Ždímal, V. PM2.5 chemical composition at a rural background site in Central Europe, including correlation and air mass back trajectory analysis. Atmos. Res. 2016, 176–177, 108–120. [Google Scholar] [CrossRef]
- EBAS Database. Available online: http://ebas.nilu.no (accessed on 25 February 2014).
- Rogula-Kozłowska, W.; Klejnowski, K.; Rogula-Kopiec, P.; Mathews, B.; Szopa, S. A Study on the Seasonal Mass Closure of Ambient Fine and Coarse Dusts in Zabrze, Poland. Bull. Environ. Contam. Toxicol. 2012, 88, 722–729. [Google Scholar] [CrossRef]
- Makkonen, U.; Virkkula, A.; Mäntykenttä, J.; Hakola, H.; Keronen, P.; Vakkari, V.; Aalto, P.P. Semi-continuous gas and inorganic aerosol measurements at a Finnish urban site: Comparisons with filters, nitrogen in aerosol and gas phases, and aerosol acidity. Atmos. Chem. Phys. Discuss. 2012, 12, 5617–5631. [Google Scholar] [CrossRef]
- Ravindra, K.; Stranger, M.; Van Grieken, R.; Grieken, R. Chemical characterization and multivariate analysis of atmospheric PM2.5 particles. J. Atmos. Chem. 2008, 59, 199–218. [Google Scholar] [CrossRef] [Green Version]
- Kfoury, A.; LeDoux, F.; Roche, C.; Delmaire, G.; Roussel, G.; Courcot, D. PM2.5 source apportionment in a French urban coastal site under steelworks emission influences using constrained non-negative matrix factorization receptor model. J. Environ. Sci. 2016, 40, 114–128. [Google Scholar] [CrossRef]
- Szigeti, T.; Óvári, M.; Dunster, C.; Kelly, F.J.; Lucarelli, F.; Záray, G. Changes in chemical composition and oxidative potential of urban PM2.5 between 2010 and 2013 in Hungary. Sci. Total Environ. 2015, 518, 534–544. [Google Scholar] [CrossRef] [PubMed]
- Tolis, E.I.; Saraga, D.E.; Lytra, M.K.; Papathanasiou, A.C.; Bougaidis, P.N.; Prekas-Patronakis, O.E.; Ioannidis, I.I.; Bartzis, J.G. Concentration and chemical composition of PM2.5 for a one-year period at Thessaloniki, Greece: A comparison between city and port area. Atmos. Environ. 2015, 113, 197–207. [Google Scholar] [CrossRef]
- Mirante, F.; Salvador, P.; Pio, C.; Alves, C.; Artíñano, B.; Caseiro, A.; Revuelta, M.A. Size fractionated aerosol composition at roadside and background environments in the Madrid urban atmosphere. Atmos. Res. 2014, 138, 278–292. [Google Scholar] [CrossRef]
- Rogula-Kozłowska, W.; Rogula-Kopiec, P.; Mathews, B.; Klejnowski, K. Effects of road traffic on the ambient concentrations of three PM fractions and their main components in a large Upper Silesian city. Annals of Warsaw University of Life Sciences-SGGW. Land Reclam. 2013, 45, 243–253. [Google Scholar]
- Klejnowski, K.; Rogula-Kopiec, P.; Rogula-Kozłowska, W. Ocena zawartości wtórnego węgla organicznego w drobnym pyle zawieszonym w wybranych obszarach województwa śląskiego. Przegląd Nauk. Inżynieria Kształtowanie Środowiska Sci. Rev. Eng. Environ. Sci. 2014, 66, 347–359. [Google Scholar]
- Degórska, A. Sources of air pollution with dust. In Fine dust in the atmosphere. In Compendium of Knowledge about Air Pollution in Particulate Matter in Poland; Juda-Rezler, K., Toczko, B., Eds.; Chief Inspectorate for Environmental Protection: Warsaw, Poland, 2016; pp. 22–30. (In Polish) [Google Scholar]
- Engelbrecht, J.P.; Moosmüller, H.; Pincock, S.; Jayanty, R.K.M.; Lersch, T.; Casuccio, G. Technical note: Mineralogical, chemical, morphological, and optical. Atmos. Chem. Phys. 2016, 16, 10809–10830. [Google Scholar] [CrossRef]
- Karydis, V.A.; Tsimpidi, A.P.; Pozzer, A.; Astitha, M.; Lelieveld, J. Effects of mineral dust on global atmospheric nitrate concentrations. Atmos. Chem. Phys. Discuss. 2016, 16, 1491–1509. [Google Scholar] [CrossRef] [Green Version]


| Year | 2014 | 2015 | 2016 | ||||||
|---|---|---|---|---|---|---|---|---|---|
| PM1.0 | PM2.5 | PM10 | PM1.0 | PM2.5 | PM10 | PM1.0 | PM2.5 | PM10 | |
| Descriptive Statistics | Heating Season (Winter) | ||||||||
| Minimum | - | - | - | 3.58 | 4.58 | - | 2.84 | 2.09 | 11.58 |
| Maximum | - | - | - | 19.52 | 44.45 | - | 38.20 | 70.12 | 97.81 |
| Mean | - | - | - | 9.76 | 17.93 | - | 18.16 | 30.88 | 41.08 |
| Median | - | - | - | 9.76 | 14.85 | - | 15.51 | 31.13 | 37.50 |
| Standard deviation | - | - | - | 4.38 | 10.80 | - | 10.66 | 14.65 | 22.98 |
| Descriptive Statistics | Non-Heating Season (Spring/Summer) | ||||||||
| Minimum | 2.81 | 6.18 | - | 0.73 | 4.10 | 4.71 | 3.44 | 2.41 | 5.97 |
| Maximum | 14.07 | 19.75 | - | 11.96 | 22.10 | 24.51 | 11.53 | 14.25 | 32.32 |
| Mean | 7.66 | 10.79 | - | 7.34 | 13.26 | 13.77 | 8.05 | 6.46 | 16.72 |
| Median | 7.55 | 9.90 | - | 12.54 | 12.53 | 14.87 | 8.36 | 5.19 | 16.77 |
| Standard deviation | 2.92 | 3.75 | - | 7.34 | 5.73 | 5.67 | 2.88 | 3.53 | 6.72 |
| Heating Season (25 October–22 November 2016) | Non-Heating Season (05 June–02 July 2017) | |||
|---|---|---|---|---|
| PM10 | ||||
| Descriptive Statistics | Jana Pawła II St. | Szymanowskiego St. | Jana Pawła II St. | Szymanowskiego St. |
| Minimum | 9.4 | 8.7 | 5.2 | 1.0 |
| Maximum | 68.6 | 69.6 | 42.8 | 22.6 |
| Mean | 25.4 | 32.9 | 16.6 | 14.7 |
| Median | 21.5 | 34.5 | 15.1 | 15.7 |
| Standard deviation | 14.6 | 15.5 | 8.5 | 5.2 |
| PM2.5 | ||||
| Descriptive Statistics | Jana Pawła II St. | Szymanowskiego St. | Jana Pawła II St. | Szymanowskiego St. |
| Minimum | 2.2 | 7.2 | 1.2 | 7.2 |
| Maximum | 39.9 | 88.5 | 40.3 | 17.1 |
| Mean | 15.2 | 30.8 | 10.4 | 11.0 |
| Median | 12.9 | 27.2 | 8.7 | 10.9 |
| Standard deviation | 10.0 | 19.1 | 9.1 | 2.5 |
| PM1.0 | ||||
| Descriptive Statistics | Jana Pawła II St. | - | Jana Pawła II St. | - |
| Minimum | 2.47 | - | 2.72 | - |
| Maximum | 22.87 | - | 10.35 | - |
| Mean | 8.50 | - | 5.72 | - |
| Median | 7.65 | - | 5.36 | - |
| Standard deviation | 5.27 | - | 1.95 | - |
| F− | Cl− | NO3− | PO43− | SO42− | Na+ | NH4+ | K+ | Mg2+ | Ca2+ | OC | EC | |
|---|---|---|---|---|---|---|---|---|---|---|---|---|
| Wrocław, Kosiby St. Series 1 (26 June–26 July 2014; Summer 2014) | ||||||||||||
| No. of samples | 27 | 27 | 27 | 27 | 27 | 27 | 27 | 27 | 27 | 27 | 27 | 27 |
| Mean | 0.06 | 0.13 | 0.32 | 0.04 | 1.42 | 0.18 | 0.35 | 0.07 | 0.00 | 0.04 | 3.23 | 0.63 |
| Minimum | <dl | 0.08 | 0.13 | <dl | 0.66 | 0.05 | 0.15 | <dl | <dl | <dl | 2.12 | <dl |
| Maximum | 0.19 | 0.449 | 2.47 | 0.35 | 3.08 | 0.86 | 0.80 | 0.66 | 0.00 | 0.21 | 4.97 | 1.64 |
| Median | 0.05 | 0.10 | 0.17 | 0.00 | 1.24 | 0.08 | 0.34 | 0.00 | 0.00 | 0.00 | 3.07 | 0.59 |
| Standard deviation | 0.04 | 0.08 | 0.45 | 0.11 | 0.65 | 0.21 | 0.17 | 0.18 | 0.00 | 0.19 | 0.74 | 0.34 |
| Wrocław, Kosiby St. Series 2 (7 January–7 February 2015; Winter 2015) | ||||||||||||
| No. of samples | 32 | 32 | 32 | 32 | 32 | 32 | 32 | 32 | 32 | 32 | 32 | 32 |
| Mean | 0.13 | 1.76 | 4.20 | 0.07 | 7.77 | 1.14 | 2.20 | 0.19 | 0.06 | 0.02 | 5.79 | 1.42 |
| Minimum | 0.05 | 0.57 | 1.14 | <dl | 4.75 | 0.64 | 0.30 | <dl | <dl | <dl | 1.22 | 0.45 |
| Maximum | 1.36 | 10.51 | 8.56 | 1.48 | 11.34 | 8.12 | 5.29 | 0.43 | 2.00 | 0.37 | 16.48 | 2.77 |
| Median | 0.09 | 1.34 | 3.87 | 0.00 | 6.91 | 0.80 | 1.66 | 0.09 | 0.00 | 0.00 | 4.73 | 1.19 |
| Standard deviation | 0.23 | 1.84 | 2.46 | 0.27 | 2.06 | 1.31 | 1.62 | 0.41 | 0.07 | 0.35 | 3.69 | 0.67 |
| Wrocław, Kosiby St. Series 3 (31 July–13 August 2015; Summer 2015) | ||||||||||||
| No. of samples | 14 | 14 | 14 | 14 | 14 | 14 | 14 | 14 | 14 | 14 | 14 | 14 |
| Mean | 0.08 | 0.39 | 0.69 | 0.03 | 5.28 | 0.39 | 2.44 | 0.36 | 0.15 | 2.25 | 4.26 | 0.62 |
| Minimum | 0.05 | 0.10 | 0.30 | 0.02 | 1.76 | 0.13 | 0.59 | 0.16 | 0.09 | 0.50 | 2.76 | <dl |
| Maximum | 0.17 | 1.56 | 1.30 | 0.05 | 9.42 | 1.32 | 4.54 | 0.78 | 0.38 | 7.93 | 6.47 | 1.12 |
| Median | 0.08 | 0.26 | 0.63 | 0.03 | 5.30 | 0.28 | 2.51 | 0.30 | 0.12 | 1.08 | 4.33 | 0.62 |
| Standard deviation | 0.03 | 0.39 | 0.24 | 0.01 | 2.17 | 0.31 | 1.04 | 0.17 | 0.09 | 2.37 | 0.97 | 0.25 |
| Wrocław, Kosiby St. Series 4 (9–26 January 2016; Winter 2016) | ||||||||||||
| No. of samples | 18 | 18 | 18 | 18 | 18 | 18 | 18 | 18 | 18 | 18 | 18 | 18 |
| Mean | 0.05 | 2.97 | 1.01 | 0.07 | 4.07 | 0.74 | 4.16 | 0.56 | 0.16 | 1.02 | 7.96 | 1.83 |
| Minimum | 0.02 | 1.52 | 0.03 | <dl | 2.24 | 0.31 | 0.02 | 0.28 | 0.09 | 0.51 | 2.00 | 0.46 |
| Maximum | 0.18 | 5.80 | 2.00 | 0.51 | 6.33 | 2.20 | 9.40 | 1.24 | 0.35 | 3.13 | 17.13 | 4.06 |
| Median | 0.08 | 0.48 | 1.08 | 0.00 | 4.09 | 0.50 | 4.84 | 0.44 | 0.14 | 0.76 | 7.97 | 1.61 |
| Standard deviation | 0.04 | 1.13 | 0.48 | 0.16 | 1.13 | 0.57 | 2.81 | 0.30 | 0.07 | 0.63 | 3.69 | 0.82 |
| Wrocław, Kosiby St. Series 5 (9–23 May 2016; Spring 2016) | ||||||||||||
| No. of samples | 15 | 15 | 15 | 15 | 15 | 15 | 15 | 15 | 15 | 15 | 15 | 15 |
| Mean | 0.03 | 1.27 | 0.15 | 0.19 | 2.67 | 0.55 | 1.08 | 0.15 | 0.05 | 0.88 | 2.70 | 0.36 |
| Minimum | 0.02 | 1.16 | 0.02 | <dl | 1.76 | 0.20 | <dl | 0.07 | 0.03 | 0.23 | 1.41 | 0.12 |
| Maximum | 0.05 | 1.51 | 0.58 | 0.54 | 4.04 | 1.06 | 3.11 | 0.21 | 0.13 | 7.45 | 3.98 | 0.80 |
| Median | 0.03 | 1.25 | 0.08 | 0.04 | 2.56 | 0.47 | 0.96 | 0.15 | 0.04 | 0.33 | 2.75 | 0.35 |
| Standard deviation | 0.01 | 0.10 | 0.18 | 0.21 | 0.67 | 0.23 | 0.91 | 0.04 | 0.02 | 1.83 | 0.73 | 0.18 |
| Poznań, Jana Pawła II St. (25 October–22 November 2016; Autumn 2016) | ||||||||||||
| No. of samples | 28 | 28 | 28 | 28 | 28 | 28 | 28 | 28 | 28 | 28 | 28 | 28 |
| Mean | 1.988 | 0.689 | 0.638 | 0.630 | 0.889 | 0.619 | 0.047 | 0.077 | 0.044 | 0.236 | 8.36 | 2.53 |
| Minimum | 10.508 | 4.201 | 8.607 | 1.092 | 6.043 | 2.896 | 1.809 | 0.586 | 0.289 | 6.485 | 2.35 | 0.83 |
| Maximum | 3.088 | 1.160 | 2.632 | 0.784 | 2.107 | 0.886 | 0.553 | 0.159 | 0.068 | 0.730 | 26.66 | 6.64 |
| Median | 2.741 | 0.929 | 2.162 | 0.752 | 1.832 | 0.768 | 0.465 | 0.131 | 0.056 | 0.416 | 7.14 | 2.32 |
| Standard deviation | 1.657 | 0.683 | 1.893 | 0.105 | 1.098 | 0.418 | 0.453 | 0.097 | 0.046 | 1.177 | 5.16 | 1.39 |
| Polanka St. (25 October–22 November 2016; Autumn 2016) | ||||||||||||
| No. of samples | 28 | 28 | 28 | 28 | 28 | 28 | 28 | 28 | 28 | 28 | 28 | 28 |
| Mean | 0.757 | 0.383 | 0.870 | 0.378 | 0.940 | 0.451 | 0.050 | 0.049 | 0.025 | 0.122 | 14.77 | 3.26 |
| Minimum | 6.317 | 3.858 | 21.816 | 0.951 | 7.939 | 1.053 | 2.540 | 0.528 | 0.439 | 0.384 | 2.91 | 1.14 |
| Maximum | 2.287 | 1.154 | 5.801 | 0.533 | 3.506 | 0.612 | 1.102 | 0.215 | 0.049 | 0.197 | 43.21 | 6.22 |
| Median | 1.882 | 0.753 | 4.802 | 0.430 | 3.314 | 0.562 | 1.107 | 0.188 | 0.033 | 0.172 | 12.07 | 2.84 |
| Standard deviation | 1.172 | 0.859 | 4.701 | 0.209 | 1.822 | 0.130 | 0.637 | 0.126 | 0.074 | 0.070 | 10.59 | 1.46 |
| Jana Pawła II St. (5 June–2 July 2017; Summer 2017) | ||||||||||||
| No. of samples | 28 | 28 | 28 | 28 | 28 | 28 | 28 | 28 | 28 | 28 | 28 | 28 |
| Mean | 0.010 | 0.123 | 0.150 | 0.328 | 0.290 | 0.465 | 0.008 | 0.020 | 0.052 | 0.076 | 3.61 | 0.63 |
| Minimum | 0.155 | 0.563 | 1.384 | 4.592 | 2.202 | 2.370 | 0.046 | 0.082 | 0.477 | 5.325 | 0.82 | 0.12 |
| Maximum | 0.048 | 0.442 | 0.713 | 2.348 | 1.353 | 2.029 | 0.016 | 0.048 | 0.242 | 2.524 | 5.07 | 1.22 |
| Median | 0.029 | 0.453 | 0.693 | 1.791 | 1.400 | 2.078 | 0.011 | 0.048 | 0.257 | 2.611 | 3.58 | 0.57 |
| Standard deviation | 0.041 | 0.098 | 0.232 | 1.122 | 0.406 | 0.333 | 0.011 | 0.014 | 0.105 | 1.492 | 0.83 | 0.34 |
| Polanka St. (5 June–2 July 2017; Summer 2017) | ||||||||||||
| No. of samples | 28 | 28 | 28 | 28 | 28 | 28 | 28 | 28 | 28 | 28 | 28 | 28 |
| Mean | 0.004 | 0.133 | 0.228 | 0.363 | 0.86 | 0.465 | 0.008 | 0.020 | 0.052 | 0.076 | 3.88 | 0.81 |
| Minimum | 0.130 | 0.382 | 1.845 | 2.668 | 3.704 | 2.221 | 0.093 | 0.069 | 0.108 | 1.709 | 2.60 | 0.45 |
| Maximum | 0.045 | 0.199 | 0.618 | 0.992 | 1.679 | 1.098 | 0.036 | 0.040 | 0.081 | 0.611 | 5.75 | 1.60 |
| Median | 0.046 | 0.177 | 0.389 | 0.506 | 1.652 | 0.622 | 0.034 | 0.039 | 0.081 | 0.413 | 3.86 | 0.71 |
| Standard deviation | 0.033 | 0.063 | 0.431 | 0.797 | 0.551 | 0.758 | 0.017 | 0.011 | 0.015 | 0.476 | 0.85 | 0.28 |
| Location | Period | Concentration | ||||||||||||
|---|---|---|---|---|---|---|---|---|---|---|---|---|---|---|
| PM2.5 | F− | Cl− | NO3− | PO43− | SO42− | Na+ | NH4+ | K+ | Mg2+ | Ca2+ | OC | EC | ||
| Wroclaw (PL), Kosiby Street, B | NH 26 June–26 July 2014 | 10.79 | 0.06 | 0.13 | 0.32 | 0.04 | 1.42 | 0.18 | 0.35 | 0.07 | 0.00 | 0.04 | 3.23 | 0.63 |
| H 7 January–7 February 2015 | 17.93 | 0.13 | 1.76 | 4.20 | 0.07 | 7.77 | 1.14 | 2.20 | 0.19 | 0.06 | 0.02 | 5.79 | 1.42 | |
| NH 31 July–13 August 2015 | 13.26 | 0.08 | 0.39 | 0.69 | 0.03 | 5.28 | 0.39 | 2.44 | 0.36 | 0.15 | 2.25 | 4.26 | 0.62 | |
| H 9–26 January 2016 | 41.08 | 0.05 | 2.97 | 1.01 | 0.07 | 4.07 | 0.74 | 4.16 | 0.56 | 0.16 | 1.02 | 7.96 | 1.83 | |
| NH 9–23 May 2016 | 6.46 | 0.03 | 1.27 | 0.15 | 0.19 | 2.67 | 0.55 | 1.08 | 0.15 | 0.05 | 0.88 | 2.70 | 0.36 | |
| Poznan (PL), Polanka Street, B | H 25 October–22 November 2016 | 30.80 | 0.757 | 0.383 | 0.870 | 0.378 | 0.940 | 0.451 | 0.050 | 0.049 | 0.025 | 0.122 | 14.77 | 3.26 |
| NH 5 June–2 July 2017 | 11.00 | 0.004 | 0.133 | 0.228 | 0.363 | 0.86 | 0.465 | 0.008 | 0.020 | 0.052 | 0.076 | 3.88 | 0.81 | |
| Racibórz (PL), C [39] | 2011, 2012 | 31.56 | - | 1.35 | 3.06 | - | 3.64 | 0.28 | 1.66 | 1.35 | 0.03 | 0.04 | 12.08 | 1.96 |
| H 2011, 2012 | 55.36 | - | 3.01 | 5.50 | - | 5.36 | 0.49 | 3.31 | 0.25 | 0.03 | 0.05 | 22.54 | 3.59 | |
| NH 2011, 2012 | 14.76 | - | 0.18 | 1.34 | - | 2.43 | 0.12 | 0.50 | 0.02 | 0.03 | 0.04 | 4.70 | 0.80 | |
| Puszcza Borecka (PL), B [48] | 2011 | 12.79 | - | 0.14 | 1.43 | - | 2.11 | 0.30 | 0.78 | 0.11 | 0.02 | 0.08 | 3.42 | 0.58 |
| H 2011 | 16.49 | - | 0.15 | 2.89 | - | 2.69 | 0.56 | 1.16 | 0.18 | 0.02 | 0.08 | 4.41 | 0.84 | |
| NH 2011 | 9.79 | - | 0.04 | 0.37 | - | 1.69 | 0.10 | 0.50 | 0.06 | 0.02 | 0.08 | 2.62 | 0.36 | |
| Zielonka (PL), A [48] | 2011 | 16.07 | - | 0.14 | 1.46 | - | 1.78 | 0.12 | 1.08 | 0.10 | 0.01 | 0.10 | 4.25 | 0.88 |
| H 2011 | 20.49 | - | 0.23 | 2.47 | - | 2.15 | 0.13 | 1.66 | 0.15 | 0.01 | 0.08 | 5.59 | 1.25 | |
| NH 2011 | 11.97 | - | 0.05 | 0.54 | - | 1.44 | 0.11 | 0.54 | 0.06 | 0.01 | 0.12 | 3.02 | 0.53 | |
| Košetice (CZ), B [49] | February 2009–April 2010 | 15.7 | - | 0.04 | 2.20 | - | 2.85 | 0.04 | 1.52 | 0.09 | <0.01 | - | 4.07 | 0.61 |
| February 2009–April 2010 | 22.5 | - | 0.05 | 2.83 | - | 3.86 | 0.04 | 1.92 | 0.15 | <0.01 | - | 6.00 | 0.80 | |
| February 2009–April 2010 | 9.7 | - | 0.01 | 0.55 | - | 2.30 | 0.03 | 0.96 | 0.03 | <0.01 | - | 2.12 | 0.36 | |
| Üto (FI), B [50] | 2011 | 6.55 | - | 0.05 | 0.28 | - | 0.33 | 0.28 | 0.24 | 0.23 | 0.22 | 0.02 | - | - |
| H 2011 | 6.58 | - | 0.05 | 0.12 | - | 0.37 | 0.35 | 0.29 | 0.05 | 0.04 | 0.02 | - | - | |
| NH 2011 | 6.53 | - | 0.06 | 0.44 | - | 0.30 | 0.20 | 0.19 | 0.41 | 0.41 | 0.02 | - | - | |
| Neuglobsow (DE), B [48] | 2012 | 10.31 | - | 0.13 | 2.06 | - | 1.95 | 0.17 | 1.24 | 0.09 | 0.02 | 0.03 | 2.52 | 0.32 |
| H 2012 | 13.14 | - | 0.21 | 3.59 | - | 2.11 | 0.22 | 1.71 | 0.12 | 0.02 | 0.03 | 3.02 | 0.45 | |
| NH 2012 | 7.47 | - | 0.06 | 0.53 | - | 1.79 | 0.12 | 0.76 | 0.05 | 0.01 | 0.02 | 2.05 | 0.20 | |
| Cabauw-Zijdeweg (NL), A [48] | 2011 | 15.25 | - | 0.20 | 3.93 | - | 2.27 | 0.25 | 1.69 | 0.10 | 0.04 | 0.06 | 2.30 | 0.56 |
| H 2011 | 18.56 | - | 0.31 | 4.91 | - | 2.59 | 0.26 | 2.07 | 0.14 | 0.04 | 0.06 | 2.83 | 0.72 | |
| NH 2011 | 11.97 | - | 0.08 | 2.88 | - | 1.92 | 0.25 | 1.28 | 0.07 | 0.04 | 0.06 | 1.75 | 0.39 | |
| Iskrba (Sl), B [50] | 2010 | 11.61 | - | 0.04 | 0.08 | - | 0.88 | 0.04 | 0.82 | 0.12 | 0.02 | 0.07 | 3.38 | 0.38 |
| H 2010 | 13.22 | - | 0.05 | 0.12 | - | 0.91 | 0.05 | 0.85 | 0.17 | 0.02 | 0.08 | 3.77 | 0.53 | |
| NH 2010 | 10.07 | - | 0.03 | 0.04 | - | 0.85 | 0.04 | 0.79 | 0.08 | 0.02 | 0.06 | 2.99 | 0.23 | |
| Ispra (IT), B [48] | 2010 | 17.92 | - | 0.55 | 0.83 | - | 0.75 | 0.11 | 1.39 | 0.33 | 0.002 | 0.06 | 5.88 | 1.27 |
| H 2010 | 26.52 | - | 0.32 | 1.41 | - | 0.71 | 0.10 | 1.96 | 0.59 | 0.02 | 0.01 | 9.03 | 1.91 | |
| NH 2010 | 9.02 | - | 0.79 | 0.17 | - | 0.78 | 0.11 | 0.84 | 0.07 | 0.03 | 0.10 | 2.71 | 0.65 | |
| Katowice (PL), U [39] | H 2010 | 63.04 | - | 2.63 | 4.06 | - | 5.38 | 0.92 | 3.27 | 0.27 | 0.06 | 0.27 | 7.91 | 13.57 |
| NH 2010 | 22.73 | - | 0.81 | 1.13 | - | 3.78 | 1.46 | 1.59 | 0.20 | 0.12 | 0.45 | 3.32 | 4.47 | |
| Poznan (PL), Jana Pawla II Street, U | H 25 October–22 November 2016 | 15.20 | 1.988 | 0.689 | 0.638 | 0.630 | 0.889 | 0.619 | 0.047 | 0.077 | 0.044 | 0.236 | 8.36 | 2.53 |
| NH 5 June–2 July 2017 | 10.40 | 0.010 | 0.123 | 0.150 | 0.328 | 0.290 | 0.465 | 0.008 | 0.020 | 0.052 | 0.076 | 3.61 | 0.63 | |
| Zabrze (PL), U [51] | January–March 2009 | 66.85 | - | 1.53 | 3.12 | - | 5.38 | 0.45 | 2.01 | 0.4 | 0.14 | 0.47 | 9.9 | 19.34 |
| July–November 2009 | 18.44 | - | 0.04 | 0.51 | - | 3.78 | 0.24 | 0.53 | 0.14 | - | - | 4.21 | 4.12 | |
| Helsinki (FI), U [52] | November 2009–February 2010 | - | - | 0.1 | 2.27 | - | 3.18 | 0.05 | 0.74 | 0.04 | 0.04 | 0.26 | - | - |
| March–May 2013 | - | - | 0.04 | 1.14 | - | 1.64 | 0.04 | 0.46 | 0.01 | 0.05 | 0.18 | - | - | |
| Menen (BE), U [53] | Winter 2003 | 17 | - | 0.89 | 5.28 | - | 4.99 | - | 1.88 | 0.25 | 0.03 | 0.07 | - | - |
| Summer 2003 | - | 0.25 | 4.17 | - | 3.23 | - | 1.92 | 0.13 | 0.02 | 0.06 | - | - | ||
| Dunkerque (FR), U [54] | November–December 2010 | 24.9 | - | 0.58 | 5.71 | - | 2.52 | - | 1.91 | - | - | - | - | 6.2 |
| March–April 2011 | 33.2 | - | 0.54 | 11.06 | - | 2.85 | - | 2.31 | - | - | - | - | 4.73 | |
| Budapest (HU), U [55] | June 2010–March 2013 | 21 | - | 0.11 | 2.14 | - | 2.84 | 0.22 | 1.33 | 0.18 | 0.05 | 0.16 | 5.42 | 2.02 |
| Winter: June 2010–March 2013 | 28.7 | - | 0.2 | 3.9 | - | 2.54 | 0.3 | 1.8 | 0.3 | 0.04 | 0.12 | 8.23 | 2 | |
| Summer: June 2010–March 2013 | 14 | - | 0.03 | 0.26 | - | 3 | 0.13 | 0.9 | 0.09 | 0.04 | 0.1 | 2.87 | 1.88 | |
| Thessaloniki (GR), U [56] | April 2011–May 2012 | 37.7 | - | 0.39 | 2.4 | - | 3.96 | 0.29 | 3.8 | 0.14 | 0.07 | 1.43 | 6.62 | 1.29 |
| H: April 2011–May 2012 | 41.9 | - | 0.37 | 3.07 | - | 3.96 | 0.14 | 4.85 | 0.12 | 0.05 | 1.6 | 8.84 | 1.5 | |
| NH: April 2011–May 2012 | 32.9 | - | 0.4 | 1.61 | - | 3.96 | 0.47 | 2.58 | 0.16 | 0.09 | 1.25 | 4.06 | 1.05 | |
| Madrid (ES), U [57] | January–February 2011 | 13.8 | - | 0.15 | 1.16 | - | 0.61 | 0.17 | 0.48 | 0.05 | 0.01 | 0.1 | 1.2 | 1.53 |
| June 2009 | 16.6 | - | 0.16 | 0.69 | - | 1.02 | 0.2 | 0.27 | 0.05 | 0.03 | 0.21 | 2.71 | 0.94 | |
| Measurement Point | Season/Date | Factor 1 | Factor 2 | Factor 3 | Factor 4 |
|---|---|---|---|---|---|
| Wroclaw, Kosiby Street | Spring–Summer 26 June–26 July 2014 31 July–13 August 2015 9–23 May 2016 | SO42− (0.93) NH4+ (0.92) Mg2+ (0.83) | Cl− (0.82) Na+ (0.85) | F− (0.86) NO3− (0.80) | - |
| Wroclaw, Kosiby Street | Winter 7 January–7 February 2015 9–26. January 2016 | F− (0.95) Cl− (0.83) Na+ (0.97) Mg2+ (0.97) | NO3− (0.91) SO42− (0.93) Ca2+ (−0.77) | NH4+ (0.83) OC (0.91) EC (0.85) | PO43− (0.95) |
| Poznan, Polanka Street | Winter 25 October–22 November 2016 | F− (0.85) Cl− (0.84) OC (0.91) EC (0.90) | PO43− (0.96) Ca2+ (0.82) | Mg2+ (0.87) | NO3− (0.88) SO42− (0.81) NH4+ (0.89) |
| Poznan, Jana Pawla II Street | Winter 25 October–22 November 2016 | F− (0.89) Cl− (0.92) SO42− (0.72) Na+ (0.98) K+ (0.92) Mg2+ (0.95) Ca2+ (0.95) | OC (0.95) EC (0.98) | NO3− (0.94) NH4+ (0.87) | - |
| Poznan, Polanka Street | Summer 5 June–2 July 2017 | Cl− (0.88) NO3− (0.91) PO43− (0.93) Na+ (0.93) | SO42− (0.93) NH4+ (0.91) OC (0.80) | Ca2+ (0.84) | F− (0.72) Mg2+ (0.88) |
| Poznan, Jana Pawla II Street | Summer 5 June–2 July 2017 | SO42− (0.85) NH4+ (0.96) | PO43− (0.88) Mg2+ (0.81) Ca2+ (0.83) | F− (0.95) | Cl− (0.73) Na+ (0.93) |
© 2019 by the authors. Licensee MDPI, Basel, Switzerland. This article is an open access article distributed under the terms and conditions of the Creative Commons Attribution (CC BY) license (http://creativecommons.org/licenses/by/4.0/).
Share and Cite
Sówka, I.; Chlebowska-Styś, A.; Pachurka, Ł.; Rogula-Kozłowska, W.; Mathews, B. Analysis of Particulate Matter Concentration Variability and Origin in Selected Urban Areas in Poland. Sustainability 2019, 11, 5735. https://doi.org/10.3390/su11205735
Sówka I, Chlebowska-Styś A, Pachurka Ł, Rogula-Kozłowska W, Mathews B. Analysis of Particulate Matter Concentration Variability and Origin in Selected Urban Areas in Poland. Sustainability. 2019; 11(20):5735. https://doi.org/10.3390/su11205735
Chicago/Turabian StyleSówka, Izabela, Anna Chlebowska-Styś, Łukasz Pachurka, Wioletta Rogula-Kozłowska, and Barbara Mathews. 2019. "Analysis of Particulate Matter Concentration Variability and Origin in Selected Urban Areas in Poland" Sustainability 11, no. 20: 5735. https://doi.org/10.3390/su11205735
APA StyleSówka, I., Chlebowska-Styś, A., Pachurka, Ł., Rogula-Kozłowska, W., & Mathews, B. (2019). Analysis of Particulate Matter Concentration Variability and Origin in Selected Urban Areas in Poland. Sustainability, 11(20), 5735. https://doi.org/10.3390/su11205735