The Interplay between Working Capital Management and a Firm’s Financial Performance across the Corporate Life Cycle


Abstract
:1. Introduction
1.1. Corporate Financial Sustainability
1.2. Working Capital Management and Corporate Life Cycle
1.3. Working Capital Strategy and Corporate Life Cycle
1.4. Why Pakistan
2. Literature Review and Hypothesis Development
3. Data and Methodology
3.1. Sample and Data Collection
3.2. Measurement of Variables
3.2.1. Firm Financial Performance
3.2.2. Corporate Life Cycle
3.2.3. Working Capital management
3.2.4. Working Capital Strategy
3.3. Modes and Methodology
3.4. Empirical Model
4. Results and Discussion
4.1. Descriptive Statistics
4.2. Regression Results and Discussion
5. Conclusions and Policy Implications
Author Contributions
Funding
Acknowledgments
Conflicts of Interest
Appendix A

| Variable | Label | Calculation |
|---|---|---|
| Dependent variable: Return on assets | ROA | Net profit before tax scaled by total assets at the end of fiscal year |
| Firm level Control variables: Firm size | FSIZE | Natural log of firms’ market value of equity |
| Leverage | LEVG | (Current liabilities + non-current liabilities)/Share holders’ equity |
| Market to book ratio | MTB | Market value of equity/book value of equity |
| Sales growth | SGROW | Sales growth is measured by the ratio of current year sales to lagged sales |
| Capital assets growth rate | CAG | current years’ fixed assets scaled by lagged fixed assets |
| Industry level Control variables: Industry competition | INDCOM | Industry competition is measured by using Herfindahl index. It is calculated as sum of squares of the market share of firms within an industry. Higher value of index suggests high market concentration while low level of competition. |
| Country level Control variables: Industrial growth rate | INDGR | Annual percentage increase in industrial production of Pakistan |
| Growth in Gross domestic product | GGDP | Annual GDP growth rate |
| Inflation rate | INF | Annual rate of inflation |
Appendix B
| Life Cycle Stage | Number of Firm-Year Observations | Percentage |
|---|---|---|
| Introduction | 414 | 17.46% |
| Growth | 411 | 17.33% |
| Mature | 1025 | 43.23% |
| Shake-out | 389 | 16.40% |
| Decline | 132 | 5.56% |
| Total | 2371 | 100% |
References
- Lourenço, I.C.; Branco, M.C.; Curto, J.D.; Eugénio, T. How does the market value corporate sustainability performance? J. Bus. Ethics 2012, 108, 417–428. [Google Scholar] [CrossRef]
- IMF. IMF Survey: Sharp Rise in Unemployment from Global Recession; International Monetary Fund: Oslo, Norway, 2010. [Google Scholar]
- Anbumozh, V.; Bauer, A. Impact of Global Recession on Sustainable Development and Poverty Linkages; ADBI Working Paper 227; ADBI: Chiyoda, Tokyo, 2010. [Google Scholar]
- Soppe, A. Sustainable corporate finance. J. Bus. Ethics 2004, 53, 213–224. [Google Scholar] [CrossRef]
- Opler, T.; Pinkowitz, L.; Stulz, R.; Williamson, R. The determinants and implications of corporate cash holdings. J. Financ. Econ. 1999, 52, 3–46. [Google Scholar] [CrossRef] [Green Version]
- Peel, M.J.; Wilson, N. Working capital and financial management practices in the small firm sector. Int. Small Bus. J. 1996, 14, 52–68. [Google Scholar] [CrossRef]
- Petersen, M.A.; Rajan, R.G. Trade credit: Theories and evidence. Rev. Financ. Stud. 1997, 10, 661–691. [Google Scholar] [CrossRef]
- Kim, Y.H.; Chung, K.H. An integrated evaluation of investment in inventory and credit: A cash flow approach. J. Bus. Finan. Acc. 1990, 17, 381–389. [Google Scholar] [CrossRef]
- Lee, Y.W.; Stowe, J.D. Product risk, asymmetric information, and trade credit. J. Financ. Quant. Anal. 1993, 28, 285–300. [Google Scholar] [CrossRef]
- Knauer, T.; Wöhrmann, A. Working capital management and firm profitability. J. Manag. Contr. 2013, 24, 77–87. [Google Scholar] [CrossRef]
- Appuhami, B.R. The impact of firms’ capital expenditure on working capital management: An empirical study across industries in Thailand. Int. Manag. Rev. 2008, 4, 8. [Google Scholar]
- Smith, K. Profitability versus liquidity tradeoffs in working capital management. In Readings on the Management of Working Capital; West Pub. Co.: Eagan, MN, USA, 1980; pp. 549–562. [Google Scholar]
- Kieschnick, R.; Laplante, M.; Moussawi, R. Working capital management and shareholders’ wealth. Rev. Financ. 2013, 17, 1827–1852. [Google Scholar] [CrossRef]
- Wang, Y.-J. Liquidity management, operating performance, and corporate value: Evidence from Japan and Taiwan. J. Multinatl. Financ. Manag. 2002, 12, 159–169. [Google Scholar] [CrossRef]
- Chittenden, F.; Poutziouris, P.; Michaelas, N. Financial Management and Working Capital Practices in UK SMEs; Manchester Business School: Manchester, UK, 1998. [Google Scholar]
- Chandler, A.D. Strategy and Structure; MIT Press: Cambridge, MA, USA, 1962. [Google Scholar]
- Warusawitharana, M. Profitability and the Lifecycle of Firms. BE J. Macroecon. 2018, 18. [Google Scholar] [CrossRef] [Green Version]
- Berger, A.N.; Udell, G.F. The economics of small business finance: The roles of private equity and debt markets in the financial growth cycle. J. Bank. Financ. 1998, 22, 613–673. [Google Scholar] [CrossRef] [Green Version]
- Richardson, S. Over-investment of free cash flow. Rev. Acc. Stud. 2006, 11, 159–189. [Google Scholar] [CrossRef]
- Akbar, A.; Akbar, M.; Tang, W.; Qureshi, M.A. Is Bankruptcy Risk Tied to Corporate Life-Cycle? Evidence from Pakistan. Sustainability 2019, 11, 678. [Google Scholar] [CrossRef] [Green Version]
- Deloof, M. Does working capital management affect profitability of Belgian firms? J. Bus. Financ. Account. 2003, 304, 573–588. [Google Scholar] [CrossRef]
- Pais, M.A.; Gama, P.M. Working capital management and SMEs profitability: Portuguese evidence. Int. J. Manag. Financ. 2015, 11, 341–358. [Google Scholar] [CrossRef]
- Nazir, M.S.; Afza, T. Impact of aggressive working capital management policy on firms’ profitability. Iup J. Appl. Financ. 2009, 15, 19. [Google Scholar]
- Bulan, L.; Yan, Z. The pecking order of financing in the firm’s life cycle. Bank. Financ. Lett. 2009, 1, 129–140. [Google Scholar]
- Faff, R.; Kwok, W.C.; Podolski, E.J.; Wong, G.J. Do corporate policies follow a life-cycle? J. Bank. Financ. 2016, 69, 95–107. [Google Scholar] [CrossRef]
- Habib, A.; Hasan, M.M. Corporate life cycle research in accounting, finance and corporate governance: A survey, and directions for future research. Int. Rev. Financ. Anal. 2019, 61, 188–201. [Google Scholar] [CrossRef]
- Chen, C.; Kieschnick, R. Bank credit and corporate working capital management. J. Corp. Financ. 2018, 48, 579–596. [Google Scholar] [CrossRef]
- World Bank. World Development Indicators; World Bank: Washington, DC, USA, 2016. [Google Scholar]
- World Bank Enterprise Survey. Available online: https://data.worldbank.org/indicator/IC.FRM.BKWC.ZS?end=2018&start=2011&view=chart (accessed on 7 October 2019).
- Baños-Caballero, S.; García-Teruel, P.J.; Martínez-Solano, P. Working capital management, corporate performance, and financial constraints. J. Bus. Res. 2014, 67, 332–338. [Google Scholar] [CrossRef]
- Sial, M.; Chaudhry, A. Relationship between Working Capital Management and Firm Profitability: Manufacturing Sector of Pakistan. 2012. Available online: https://papers.ssrn.com/sol3/papers.cfm?abstract_id=2105638 (accessed on 27 December 2019).
- Arshad, Z.; Gondal, M.Y. Impact of working capital management on profitability a case of the Pakistan cement industry. Interd. J. Contemp. Res. Bus. 2013, 5, 384–390. [Google Scholar]
- Iqbal, A.; Zhuquan, W. Working Capital Management and its Impact on Firm’s Performance. Int. J. Bus. Soc. Sci. 2014, 5, 123–130. [Google Scholar]
- Tahir, M.; Anuar, M.B.A. The determinants of working capital management and firm’s performance of textile sector in Pakistan. Qual. Quant. 2016, 50, 605–618. [Google Scholar] [CrossRef]
- Enqvist, J.; Graham, M.; Nikkinen, J.J.R. The impact of working capital management on firm profitability in different business cycles: Evidence from Finland. Res. Int. Bus. Financ. 2014, 32, 36–49. [Google Scholar] [CrossRef]
- Tsuruta, D.J.J.; Economy, T.W. Working capital management during the global financial crisis: Evidence from Japan. Jpn. World Econ. 2019, 49, 206–219. [Google Scholar] [CrossRef] [Green Version]
- Bogan, V.; Johnson, W.; Mhlanga, N. Does Capital Structure affect the financial sustainability of Microfinance Institutions? 2007. Available online: https://pdfs.semanticscholar.org/67d8/3ce37b962edcbfa40469e435c8093f0f90c3.pdf (accessed on 17 February 2019).
- Bonazzi, G.; Iotti, M. Interest coverage ratios (ICRs) and financial sustainability: Application to firms with bovine dairy livestock. Am. J. Agric. Biol. Sci. 2014, 9, 482. [Google Scholar] [CrossRef] [Green Version]
- Njeri, W.R.; Namusonge, G.; Mugambi, F. Effect of working capital management on financial sustainability of government owned entities in the ministry of agriculture, livestock and fisheries (MOALF), Kenya. Strateg. J. Bus. Chang. Manag. 2017, 4, 3. [Google Scholar]
- Miller, D.; Friesen, P.H. A longitudinal study of the corporate life cycle. Manag. Sci. 1984, 30, 1161–1183. [Google Scholar] [CrossRef]
- Spence, A.M. Entry, capacity, investment and oligopolistic pricing. Bell J. Econ. 1977, 8, 534–544. [Google Scholar] [CrossRef]
- Frielinghaus, A.; Moster, B.; Firer, C. Capital Structure and firm’s life stage. S. Afr. J. Bus. Manag. 2005, 36, 10. [Google Scholar] [CrossRef]
- Marshall, J.; Heffes, E.M. Business continuity: Smaller firms most vulnerable to problems. Financ. Exec. 2004, 20, 11–12. [Google Scholar]
- Carpenter, R.E.; Petersen, B.C. Is the growth of small firms constrained by internal finance? Rev. Econ. Stat. 2002, 84, 298–309. [Google Scholar] [CrossRef]
- Liao, Y. The effect of fit between organizational life cycle and human resource management control on firm performance. J. Am. Acad. Bus. 2006, 8, 192–196. [Google Scholar]
- Petersen, M.A.; Rajan, R.G. The effect of credit market competition on lending relationships. Q. J. Econ. 1995, 407–443. [Google Scholar] [CrossRef]
- Lemmon, M.L.; Zender, J.F. Debt capacity and tests of capital structure theories. J. Financ. Quant. Anal. 2010, 45, 1161–1187. [Google Scholar] [CrossRef] [Green Version]
- Hasan, M.M.; Hossain, M.; Habib, A. Corporate life cycle and cost of equity capital. J. Contemp. Acc. Econ. 2015, 11, 46–60. [Google Scholar] [CrossRef]
- Tian, L.; Han, L.; Zhang, S. Business life cycle and capital structure: Evidence from Chinese manufacturing firms. China World Econ. 2015, 23, 22–39. [Google Scholar] [CrossRef]
- Primc, K.; Čater, T. Environmental strategies in different stages of organisational evolution: Theoretical foundations. Australas. J. Environ. Manag. 2016, 23, 100–117. [Google Scholar] [CrossRef]
- Habib, A.; Hasan, M.M. Firm life cycle, corporate risk-taking and investor sentiment. Account. Financ. 2015. [Google Scholar] [CrossRef]
- Dickinson, V. Cash flow patterns as a proxy for firm life cycle. Acc. Rev. 2011, 86, 1969–1994. [Google Scholar] [CrossRef]
- Ronda-Pupo, G.A.; Guerras-Martin, L.Á. Dynamics of the evolution of the strategy concept 1962–2008: A co-word analysis. Strat. Manag. J. 2012, 33, 162–188. [Google Scholar] [CrossRef]
- Talonpoika, A.-M.; Kärri, T.; Pirttilä, M.; Monto, S.; Michayluk, D. Defined strategies for financial working capital management. Int. J. Manag. Financ. 2016, 12. [Google Scholar] [CrossRef]
- Baños-Caballero, S.; García-Teruel, P.J.; Martínez-Solano, P. How does working capital management affect the profitability of Spanish SMEs? Small Bus. Econ. 2012, 39, 517–529. [Google Scholar] [CrossRef]
- Blinder, A.S.; Maccini, L.J. The resurgence of inventory research: What have we learned? J. Econ. Surv. 1991, 5, 291–328. [Google Scholar] [CrossRef]
- Soenen, L.A. Cash conversion cycle and corporate profitability. J. Cash Manag. 1993, 13, 53. [Google Scholar]
- Afrifa, G.A. Working Capital Management and AIM Listed SME Companies Profitability: A Mixed Research Method Approach; Bournemouth University: Poole, UK, 2013. [Google Scholar]
- Autukaite, R.; Molay, E. In Cash Holdings, Working Capital and Firm Value: Evidence from France. In Proceedings of the International Conference of the French Finance Association (AFFI), Montpellier, France, 11–13 May 2011. [Google Scholar]
- Shin, H.-H.; Soenen, L. Efficiency of working capital management and corporate profitability. Financ. Pr. Educ. 1998, 8, 37–45. [Google Scholar]
- Hassani, M.; Bagherian, J.M. An investigation the role of Life Cycle on the relationship between. Acad. J. Res. Bus. Account. 2014, 4, 35–47. [Google Scholar]
- Garson, G.D. Hierarchical Linear Modeling: Guide and Applications; Sage: Thousand Oaks, CA, USA, 2012. [Google Scholar]
- Goldstein, H. Multilevel Statistical Models; John Wiley & Sons: Hoboken, NJ, USA, 2011; Volume 922. [Google Scholar]
- Hsiao, C. Benefits and limitations of panel data. Econ. Rev. 1985, 4, 121–174. [Google Scholar] [CrossRef]
- Kennedy, P. Guide to Econometrics, 6th ed.; Wiley-Blackwell: Oxford, UK, 2008. [Google Scholar]
- Ahsan, T.; Wang, M.; Qureshi, M.A. How do they adjust their capital structure along their life cycle? An empirical study about capital structure over life cycle of Pakistani firms. J. Asia Bus. Stud. 2016, 10, 276–302. [Google Scholar] [CrossRef]


| Variables | N | Mean | S.D | 5th Percentile | 95th Percentile | Intro | Growth | Mature | Shake -Out | Decline |
|---|---|---|---|---|---|---|---|---|---|---|
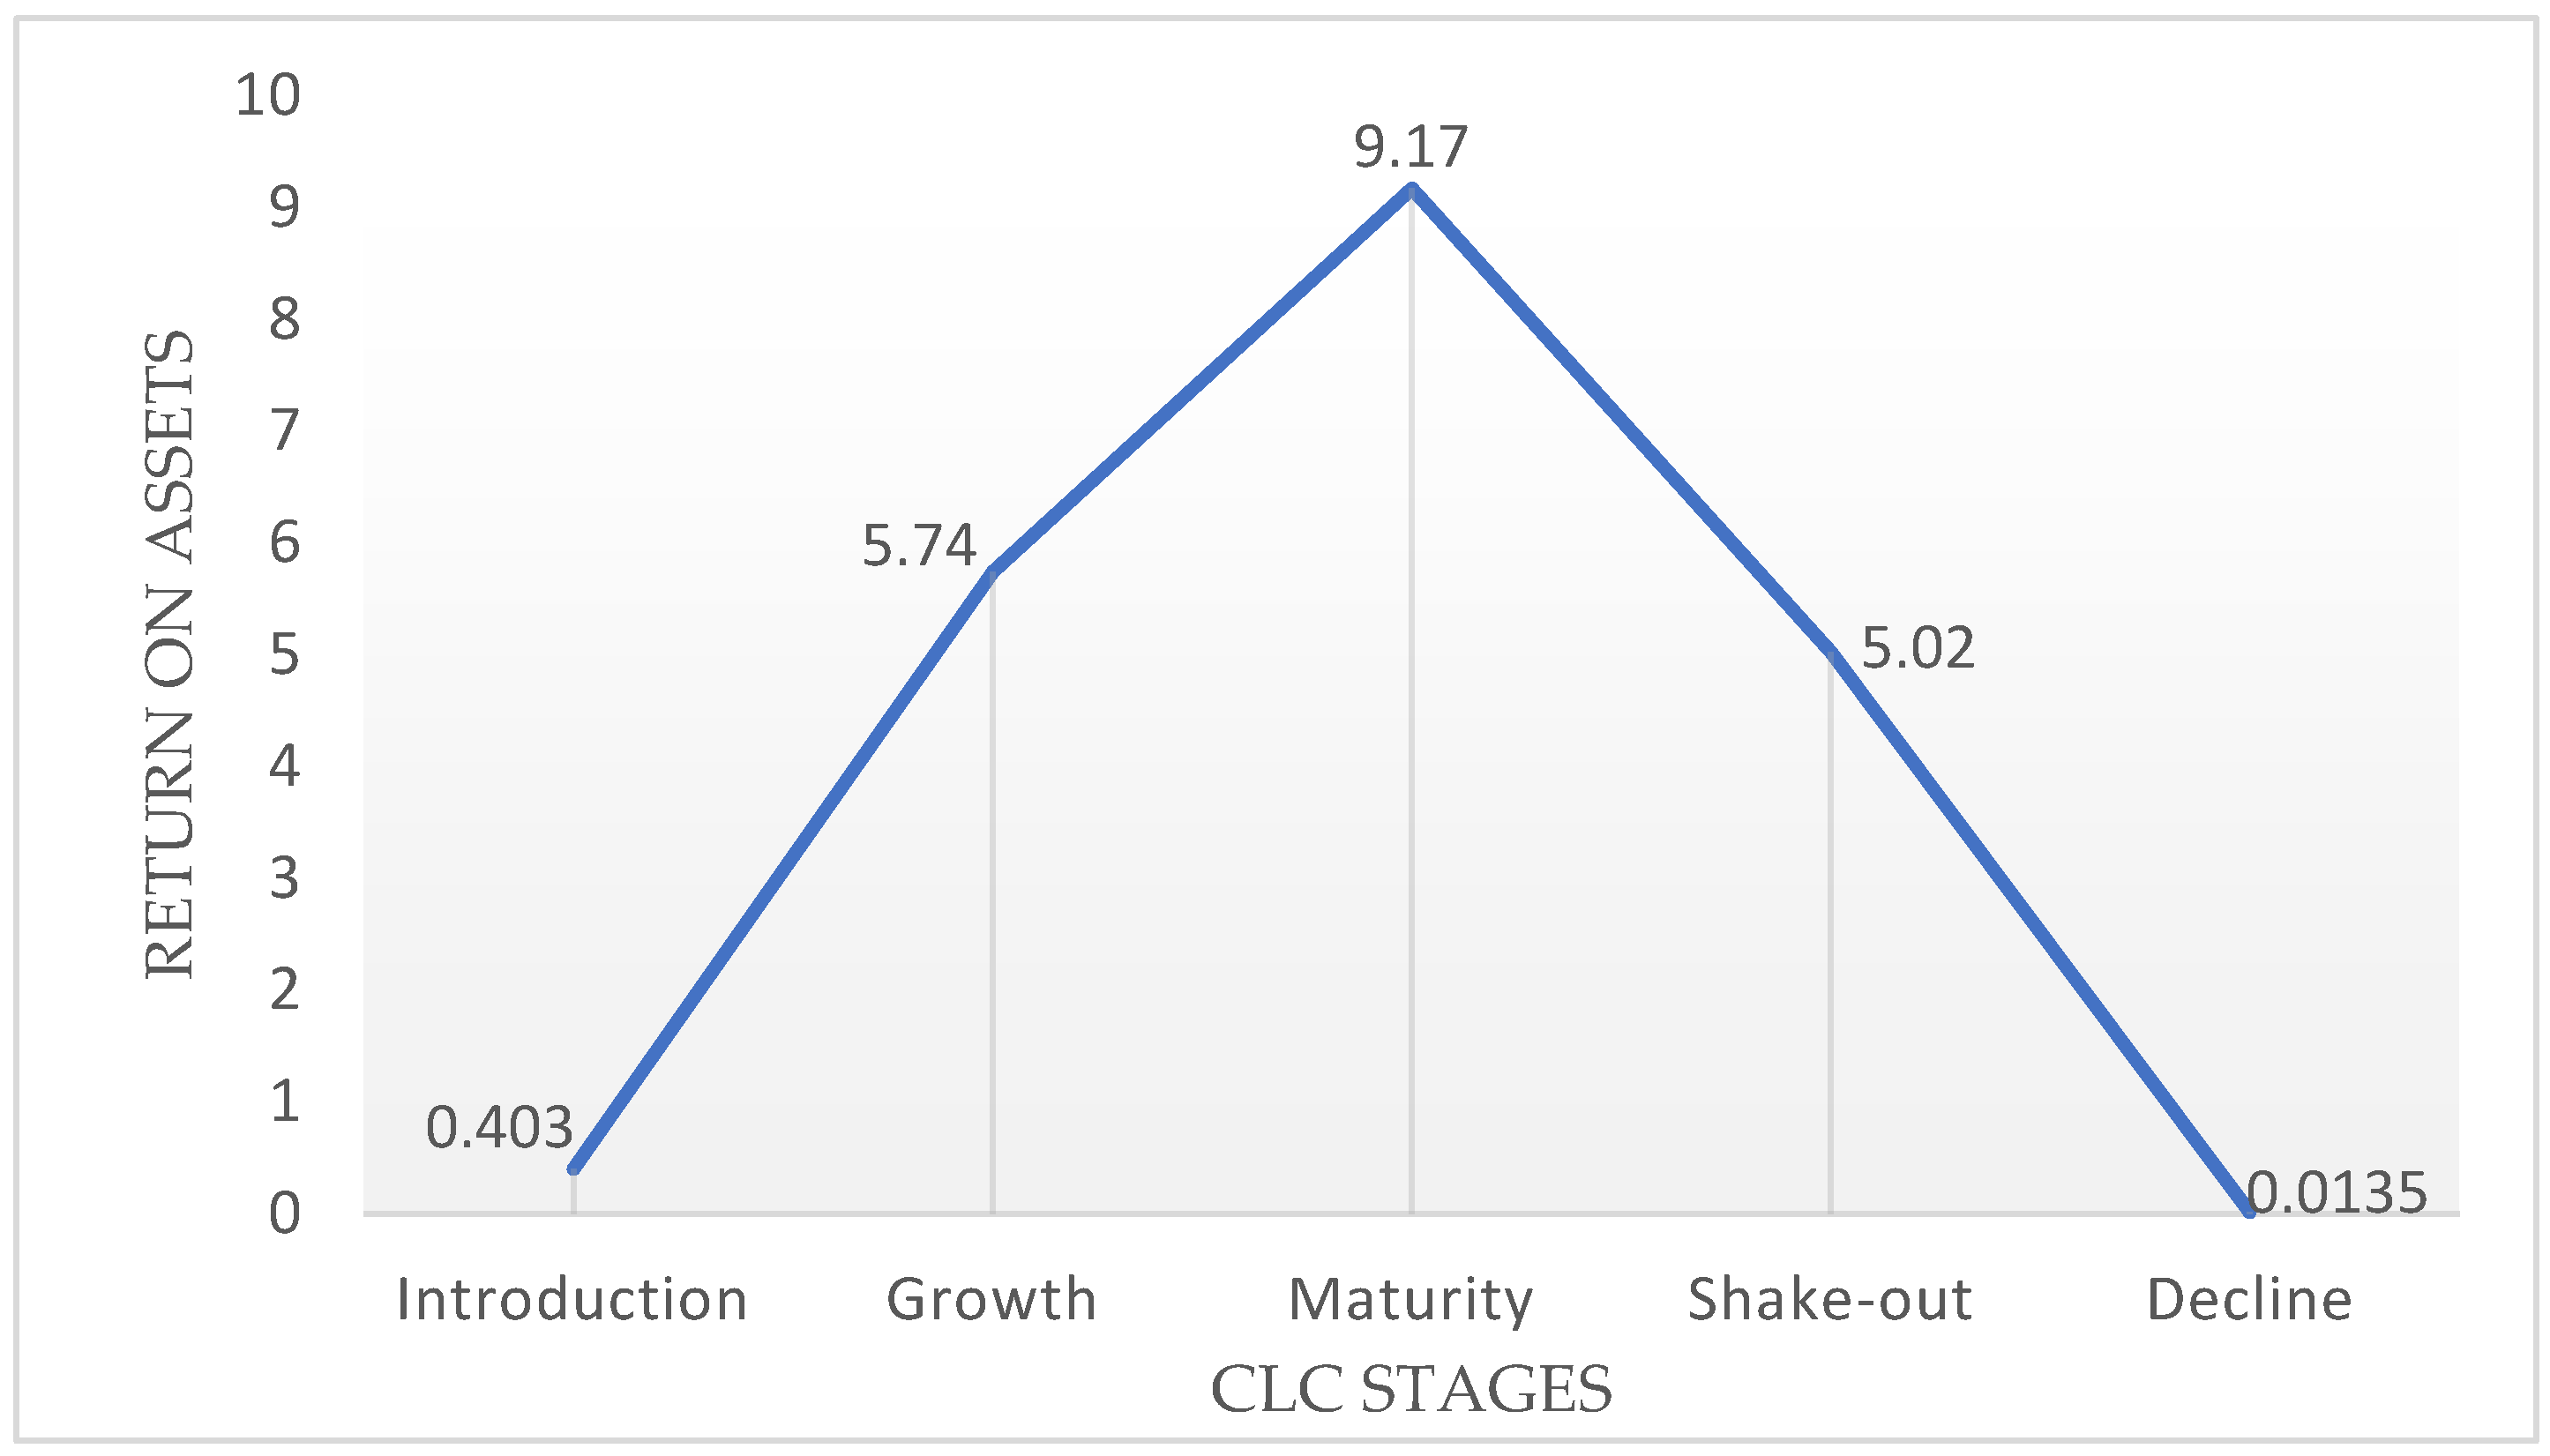
| ROA | 2662 | 5.87 | 11.19 | −13.4 | 30.41 | 0.403 | 5.74 | 9.17 | 5.02 | 0.0135 |
| NTC | 2371 | 85.66 | 70.95 | 2.19 | 251.1 | 90.27 | 77.63 | 80.04 | 95.6 | 113.03 |
| FSIZE | 2371 | 13.38 | 2.09 | 10.0 | 17.25 | 12.95 | 13.57 | 13.62 | 13.3 | 12.45 |
| LEVG | 2371 | 1.73 | 1.96 | −1.58 | 6.31 | 2.14 | 1.69 | 1.71 | 1.49 | 1.38 |
| MTB | 2371 | 0.978 | 1.07 | −0.077 | 3.65 | 0.852 | 0.912 | 1.08 | 0.995 | 0.695 |
| SGROW | 2371 | 0.149 | 0.310 | −0.408 | 0.804 | 0.160 | 0.182 | 0.173 | 0.091 | −0.012 |
| FAGR | 2371 | 0.153 | 0.303 | −0.105 | 1.01 | 0.215 | 0.218 | 0.124 | 0.117 | 0.104 |
| INDCOM | 2662 | 1192 | 1147 | 232 | 3980 | 986.7 | 1163 | 1209 | 1417 | 1220 |
| INDGR | 2662 | 4.38 | 3.09 | −1.90 | 10.7 | 4.67 | 4.91 | 4.13 | 4.42 | 3.70 |
| GGDP | 2662 | 3.87 | 1.78 | 1.6 | 7.7 | 3.81 | 4.36 | 3.79 | 3.80 | 3.42 |
| INF | 2662 | 11.01 | 3.93 | 7.2 | 20.3 | 11.6 | 10.2 | 10.9 | 11.1 | 11.3 |
| Variables | ROA | NTC | SIZE | LEV | MTB | GROW | CAG | INDCOM | INDGR | GGDP | INF |
|---|---|---|---|---|---|---|---|---|---|---|---|
| ROA | 1 | ||||||||||
| NTC | −0.17 | 1 | |||||||||
| SIZE | 0.34 * | −0.20 * | 1 | ||||||||
| LEVG | −0.17 * | −0.00 | −0.08 * | 1 | |||||||
| MTB | 0.32 * | −0.19 * | 0.55 * | 0.16 * | 1 | ||||||
| GROW | 0.11 * | −0.20 * | 0.07 * | 0.05 * | 0.09 * | 1 | |||||
| CAG | 0.04 * | −0.01 | 0.13 * | −0.00 | 0.09 * | 0.08 * | 1 | ||||
| INDCOM | 0.12 * | −0.03 | 0.35 * | −0.13 * | 0.22 * | 0.00 | 0.08 * | 1 | |||
| INDGR | 0.08 * | −0.02 | 0.01 | −0.03 | 0.03 | 0.06 * | 0.12 * | 0.01 | 1 | ||
| GGDP | 0.07 * | 0.00 | 0.07 * | −0.07 * | 0.03 | 0.06 * | 0.01 | 0.02 | 0.32 * | 1 | |
| INF | −0.06 * | −0.00 | −0.02 | 0.08 * | 0.08 * | −0.06 * | 0.02 | −0.02 | −0.23 * | −0.84 * | 1 |
| Variables | Expected Sign | Model | Model |
|---|---|---|---|
| (1) | (2) | ||
| NTC | − | −0.0179 *** | |
| (−5.14) | |||
| NTC × Birth | − | −0.0130 *** | |
| (−4.82) | |||
| NTC × Growth | − | −0.0114 ** | |
| (−2.49) | |||
| NTC × Mature | + | 0.00158 | |
| (0.63) | |||
| NTC × Decline | − | −0.00688 *** | |
| (−3.40) | |||
| LEVG | − | −0.582 *** | −0.612 *** |
| (−5.24) | (−5.53) | ||
| MTB | + | 1.473 *** | 1.630 *** |
| (6.03) | (6.80) | ||
| SGROW | + | 1.147 ** | 1.455 *** |
| (2.08) | (2.68) | ||
| CAG | − | −1.461 *** | −1.121 ** |
| (−2.62) | (−1.99) | ||
| INDCOM | + | 0.00104 *** | 0.00108 *** |
| (2.66) | (3.14) | ||
| INDGR | + | 0.236 *** | 0.231 *** |
| (3.56) | (3.47) | ||
| INF | − | −0.141 *** | −0.145 *** |
| (−3.44) | (−3.54) | ||
| Constant | 6.076 *** | 4.866 *** | |
| (5.77) | (5.71) | ||
| N | 2371 | 2371 |
| Variables | Expected Sign | Model | Model |
|---|---|---|---|
| (1) | (2) | ||
| WCS | − | −1.945 *** | |
| (−4.20) | |||
| WCS × Birth | − | −3.146 *** | |
| (−4.63) | |||
| WCS × Growth | − | −1.840 ** | |
| (−2.28) | |||
| WCS × Mature | + | 0.109 | |
| (0.19) | |||
| WCS × Decline | − | −2.840 ** | |
| (−2.56) | |||
| LEVG | − | −0.587 *** | −0.593 *** |
| (−5.28) | (−5.35) | ||
| MTB | + | 1.555 *** | 1.619 *** |
| (6.40) | (6.75) | ||
| SGROWTH | + | 1.436 *** | 1.497 *** |
| (2.64) | (2.76) | ||
| CAG | − | −1.426 ** | −1.188 ** |
| (−2.55) | (−2.11) | ||
| INDCOM | + | 0.000999 *** | 0.00104 *** |
| (2.65) | (3.00) | ||
| INDGR | + | 0.242 *** | 0.218 *** |
| (3.64) | (3.27) | ||
| INF | − | −0.140 *** | −0.145 *** |
| (−3.42) | (−3.53) | ||
| Constant | 5.154 *** | 4.915 *** | |
| (5.34) | (5.78) | ||
| N | 2371 | 2371 |
© 2020 by the authors. Licensee MDPI, Basel, Switzerland. This article is an open access article distributed under the terms and conditions of the Creative Commons Attribution (CC BY) license (http://creativecommons.org/licenses/by/4.0/).
Share and Cite
Wang, Z.; Akbar, M.; Akbar, A. The Interplay between Working Capital Management and a Firm’s Financial Performance across the Corporate Life Cycle. Sustainability 2020, 12, 1661. https://doi.org/10.3390/su12041661
Wang Z, Akbar M, Akbar A. The Interplay between Working Capital Management and a Firm’s Financial Performance across the Corporate Life Cycle. Sustainability. 2020; 12(4):1661. https://doi.org/10.3390/su12041661
Chicago/Turabian StyleWang, Zanxin, Minhas Akbar, and Ahsan Akbar. 2020. "The Interplay between Working Capital Management and a Firm’s Financial Performance across the Corporate Life Cycle" Sustainability 12, no. 4: 1661. https://doi.org/10.3390/su12041661
APA StyleWang, Z., Akbar, M., & Akbar, A. (2020). The Interplay between Working Capital Management and a Firm’s Financial Performance across the Corporate Life Cycle. Sustainability, 12(4), 1661. https://doi.org/10.3390/su12041661