1. Introduction
The principle of responsible investment (PRI) paves the way for organizations to incorporate environmental, social, and governance (ESG) criteria into their investment strategies [
1,
2,
3]. As a result of investor interest, ESG activity has increased in the last decade with global assets incorporating ESG strategies reaching USD 60 trillion in 2016 [
4,
5]. The concept of a socially responsible investing (SRI) considers investments in terms of ethical impact, as well as financial gains [
2,
6,
7]. The burgeoning acceptability of ESG investing has generated the need for ESG indices and rating agencies. Such indices provide benchmark measures for investors to track the performance of their investments [
4]. These indices help boost ESG investing, as well as the implementation of responsible investment policies [
3,
4,
8]. The 100 plus ESG rating and index providing agencies [
3] are signs of growing investor and portfolio manager interest in ESG index funds. Currently, there are about 121 ESG indices. Morgan Stanley Capital International (MSCI), a renowned index and ratings agency provider, runs more than 700 ESG indices [
4]. Some other important socially responsible investment indices are the Dow Jones Sustainability indices (DJSI), the FTSE4Good indices, the FTSE Russell index, the Thomson Reuters indices, and the S&P Dow Jones and RobeccoSAM indices [
4,
8]. These track the stock prices of companies that fulfill ESG requirements. As such, these indices play a major role in the global development of responsible practices [
9] and the inclusion of sustainable practices within organizations [
10]. In addition, the indices are used as a source of investment and performance tracking by individual investors, as well as portfolio/fund managers whose core objective is financial return [
11].
Thus, these ESG indices help investors monitor a firm’s sustainability performance, as only companies that outperform their peers in an in-depth analysis of economic, environmental, and social criteria are included on these sustainability indices. Hence, these are different from conventional indices. The firms included on these indices are generally known as sustainability leaders [
12]. Many studies have examined the risk and return linkage between conventional equity indices and sustainability indices [
2,
6,
13,
14,
15,
16,
17,
18], as investors face greater diversification risk in SRI compared with conventional investing. The indices are compared by evaluating the firms on the basis of financial ratios and overall business performance [
19,
20,
21,
22]. These studies have generally been conducted in developed markets, with few examining emerging markets [
2,
23,
24].
Further, although various studies focus on ESG and SRI indices, no study has explored the strength of ESG index integration with conventional composite equity indices. As globalization increases, the integration of financial markets represents an advancement in the securities markets. This has caught the attention of international investors, as well as academic scholars, in terms of returns and the exploration of the relationships within world stock markets [
25]. There is a general belief that SRI indices are not as globally integrated as general equity indices. Less integrated indices carry the risk of mispricing from market to market [
2]. A more integrated environment increases the efficient allocation of resources, which generates productive investment opportunities, and barriers to this environment impact efficiency [
26]. However, integration also negatively impacts diversification opportunities, and a well-integrated market allows the free flow of capital, which can limit such advantages [
27]. Thus, it is vital to understand the strength of the integration of ESG indices compared to conventional indices in the emerging economy context to improve our understanding from a regional perspective.
Our study aims to examine the integration of ESG equity indices and conventional indices in emerging markets, specifically among Brazil, Russia, India, China, and South Africa (BRICS). Our research question is: are ESG equity indices integrated with their conventional counterparts (the general belief being no)? To answer this, we choose the BRICS countries motivated by their unique dynamics compared with other emerging markets since this economic bloc comprises one country from South America (Brazil), one country from Africa (South Africa), and three from top emerging economies (Russia, China, and India). The unique BRICS composition of distant and neighboring countries could help us test the co-movement of financial markets, as scholars suggest [
28] that co-movement is greater in neighboring countries or those located in the same geographical area than in those farther away. Exploring the integration strength between conventional equity and ESG indices also helps us assess the significance of the BRICS bloc and its financial and economic harmony.
To that end, we measure the integration of ESG equity indices with conventional equity indices in each individual BRICS country, as well as cross-country integration to understand regional economic and financial cooperation [
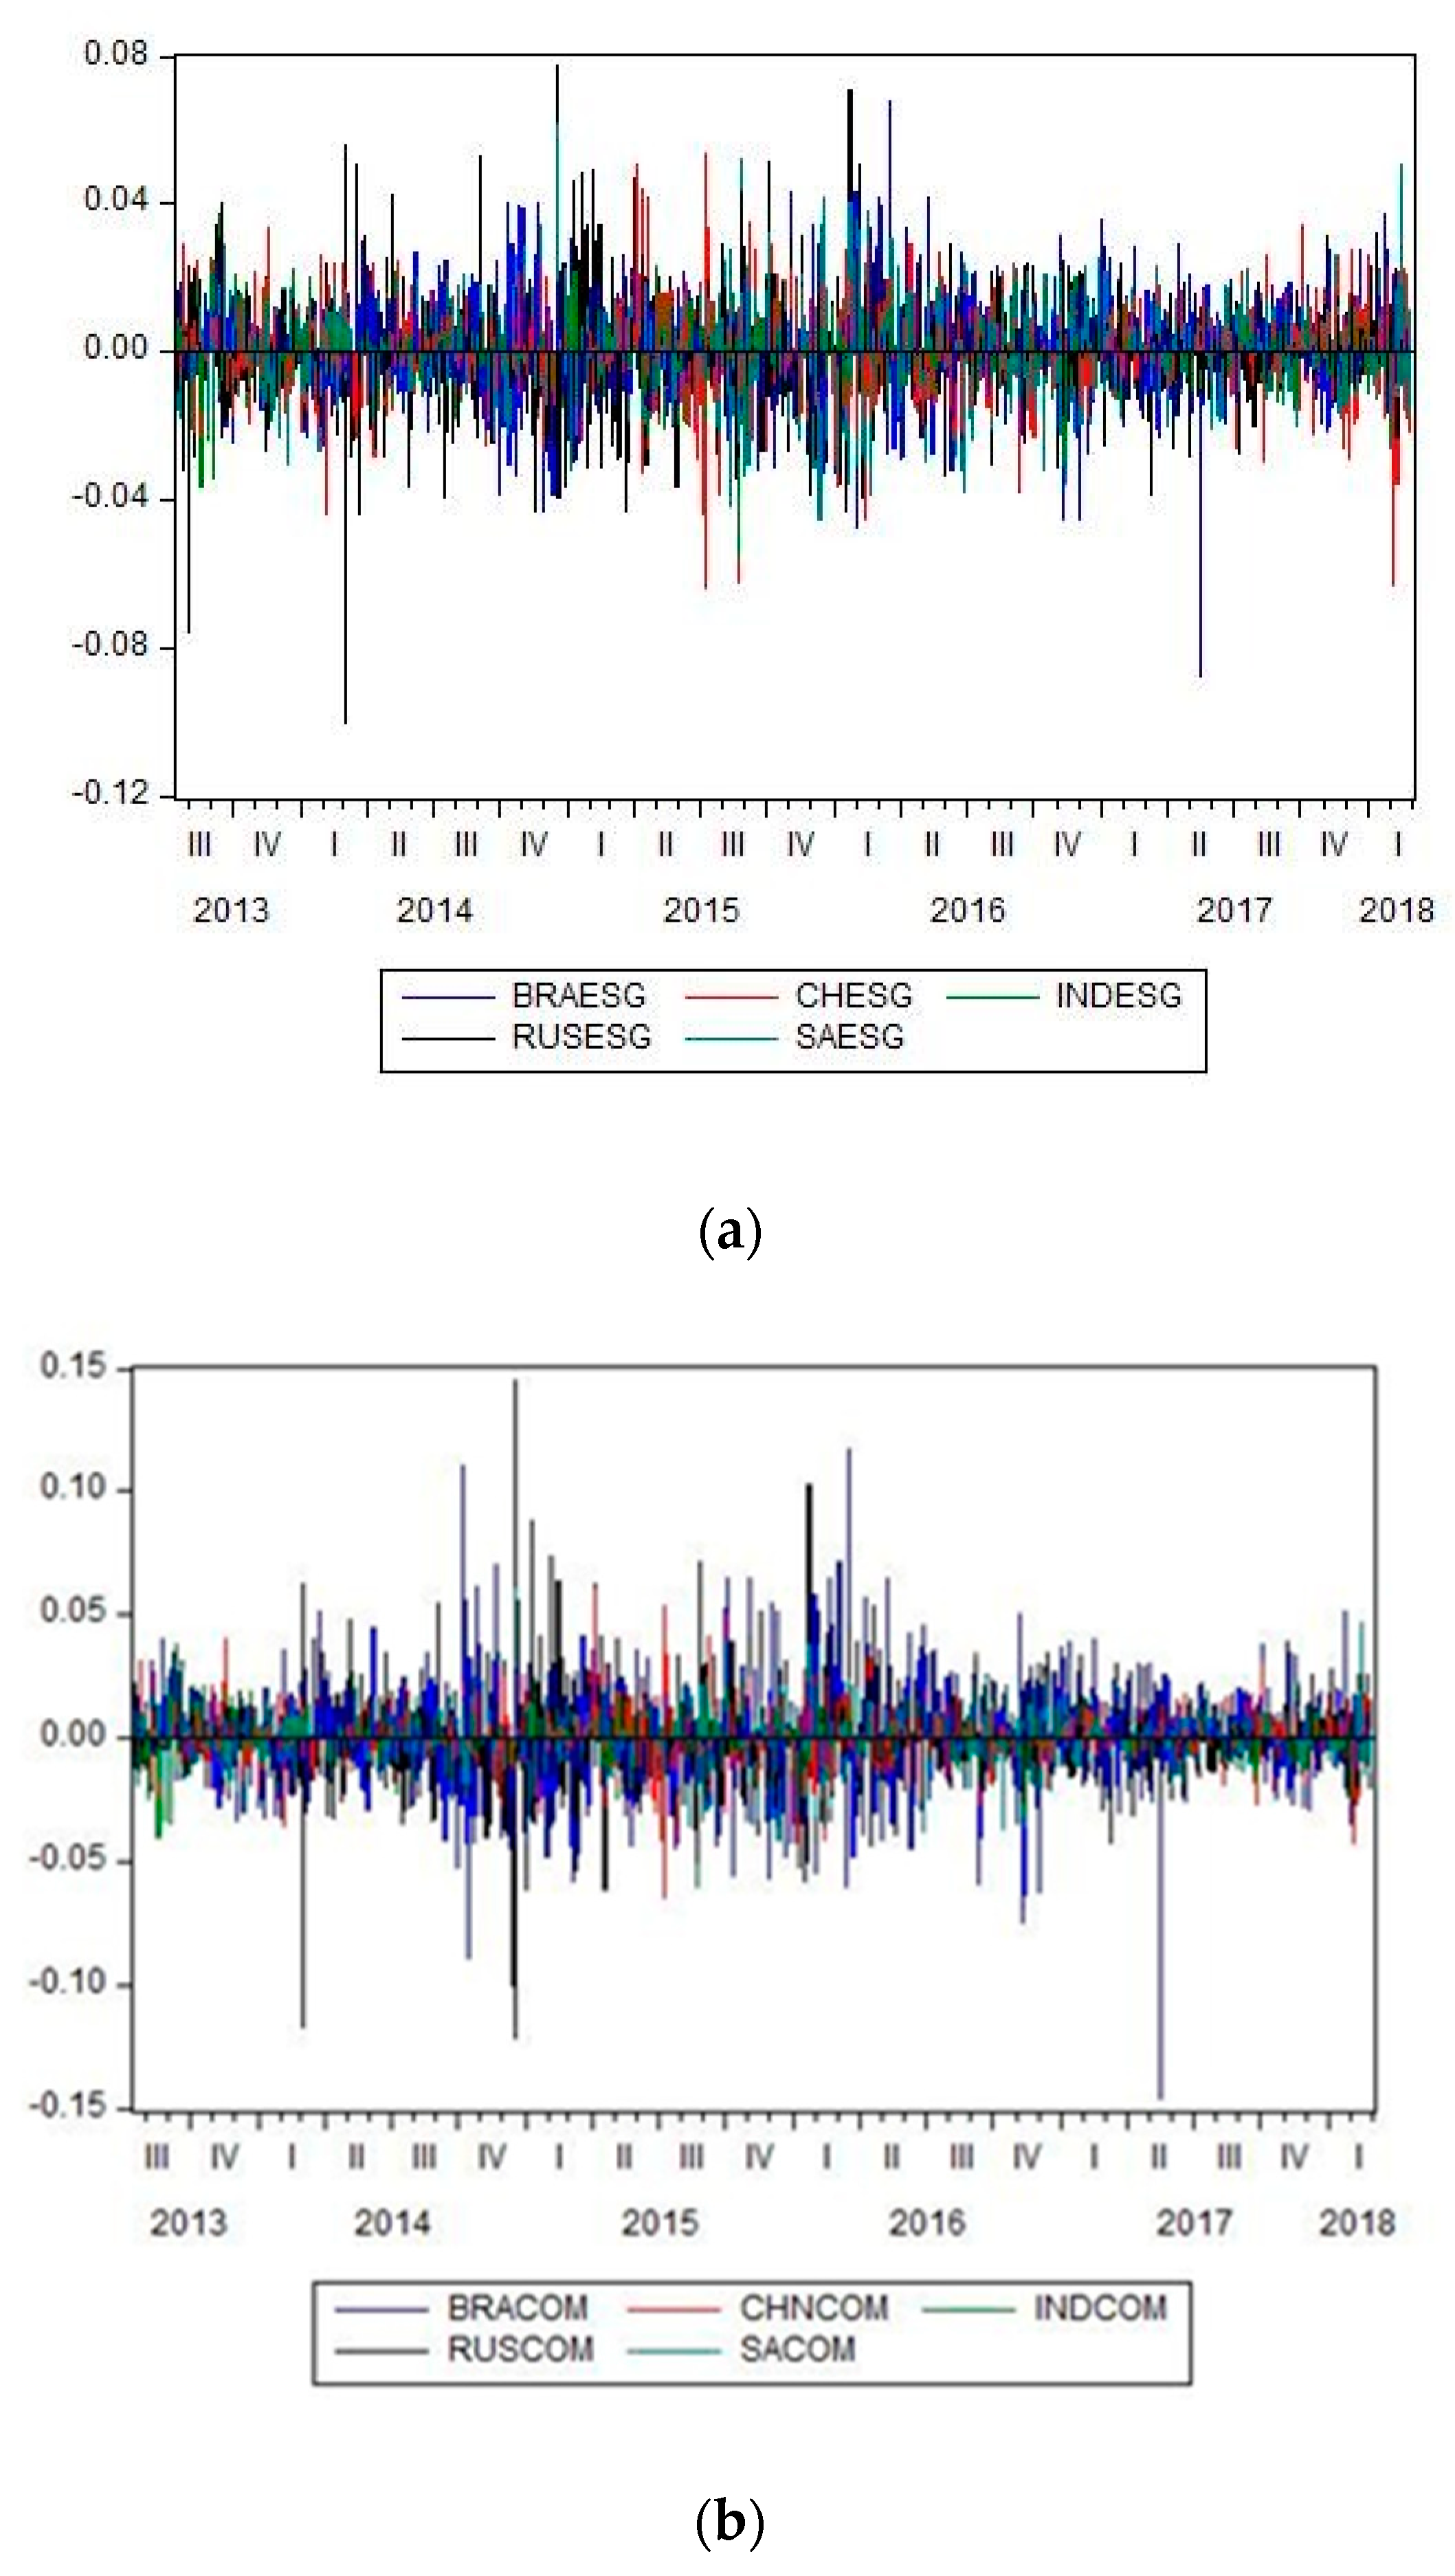
29]. We use data from the MSCI ESG indices and MSCI composite indices launched in 2010. We collect daily return data from 13 July 2013 to 28 February 2018 of the selected indices, as the timing of the movements shows a significant relationship in the period of one day. We also explore the short- and long-run dynamics of this relation, as this is key to understanding the potential of emerging markets for portfolio diversification. This will help us find evidence regarding the general belief that SRI indices are not globally integrated compared with general equity indices [
2]. Thus, our study contributes to the literature by providing empirical evidence on the integration in emerging markets previously believed to have unintegrated composite indices [
30,
31]. Our study also contributes by exploring the regional and cross-continental impact of the integration of ESG indices and their conventional index counterparts.
The rest of the paper is organized as follows. The next section briefly discusses the literature review.
Section 3 explains the methodology.
Section 4 presents the empirical findings of the paper.
Section 5 discusses the results, while the final section concludes.
2. Literature Review
As stated above, investors and researchers have shown recent interest in sustainable or ESG equity indices. Several studies explore the return and volatility linkages and comparisons among conventional and sustainability indices [
13,
15,
17,
18,
32,
33,
34,
35,
36,
37,
38]. Some believe that sustainable or responsible investment has the potential to be part of the solution to social and ecological issues by transforming equity markets to increase accountability among firms; hence, more research in this field is required to develop it as an applied field of investment [
39].
Scholars have employed different methods to compare the risk and return in sustainable and conventional indices in their analyses. These include basic and simple methods, such as calculating correlations and exponential smoothening to more complex and advanced econometric techniques, such as auto-regressive conditional heteroskedasticity (ARCH) and the vector auto-regressive (VAR) model [
35,
40,
41,
42,
43,
44,
45,
46]. Sadorsky [
44] uses a multivariate generalized ARCH (GARCH) model to examine the volatilities and conditional correlation among a stock price index comprising socially responsible companies, oil prices, and gold prices and finds similar results to investing in the S&P 500. However, Tse [
46] finds a significant bi-directional flow of information between the Dow Jones Industrial Average (DJIA) index and the index future using a bivariate exponential GARCH (EGARCH) model.
Some recent literature compares the performance of firms included on sustainable indices with those on conventional indices. Of these studies, 78% find that firms listed on sustainable indices reflect better financial performance than those listed on conventional indices [
17,
20,
47,
48,
49,
50]. Tularam et al. [
18] study the relationship between the Australian SRI market and 14 other markets in Europe and the U.S. They estimate SRI’s growth globally at around USD 6.5 trillion, with USD 55 billion invested in Australia, using a dynamic conditional correlation (DCC)-GARCH model. Charlo et al. [
13] find that socially responsible firms listed on the Spanish sustainability index, the FTSE4Good IBEX (a sustainable market index partnership between the Financial Times Stock Exchange (FTSE) group and the Spanish stock exchange), reveal higher profits for the same level of systemic risk and are highly sensitive to market information. Additionally, Fowler and Hope [
34] indicate that after the inclusion of sustainably responsible indices in financial markets, the fund managers use funds under the management of sustainable indices. Batista and Francisco [
51] find environment, human resource, and organization management as the baseline for implementing sustainable practices among firms listed on the Corporate Sustainable Index concerning the Brazilian stock market. Ortas et al. [
42] argue that, in a post-crisis scenario (2008), social and responsible investment strategies are less risky than a conventional investment when markets are unstable. Other studies analyzing periods of market crisis include [
15,
21,
35,
36,
38,
52,
53].
Table 1 presents a summary of the systematic literature review.
Many studies have been conducted on U.S. sustainability indices [
35,
38,
52,
55], Europe’s sustainability indices [
12,
13,
20,
33,
42,
56] and on Australian markets [
18,
54]. However, few studies have looked at the economies of developing countries [
2,
39]. Indeed, Alshehhi et al. [
47] comment that emerging and developing countries lag behind developed countries in comparisons to sustainable and conventional indices. Our study attempts to fill this gap.
Although several studies evaluate different sustainable indices around the world, such as the Dow Jones Sustainability Index [
12,
22,
52,
55,
57,
58], the FTSE4Good-IBEX [
13,
33,
59], the IPC Sustainability (IPCS) index [
38], and Corporate Environmental Sustainability Reporting (CESR) index [
42], no study compares between the Thomson Reuters Sustainable Indices and their conventional alternatives, namely the MSCI stock market indices worldwide. Moreover, the extant literature does not examine the integration between the sustainable indices and conventional market indices [
44].
Thus, there is a need to understand better the integration of ESG equity indices and conventional indices in emerging markets. Hence, our study is unique in that it examines this largely ignored area in the literature in terms of sustainability investment and investigates the cointegration of ESG equity indices with conventional equity indices within each BRICS country and across these countries.
5. Discussion
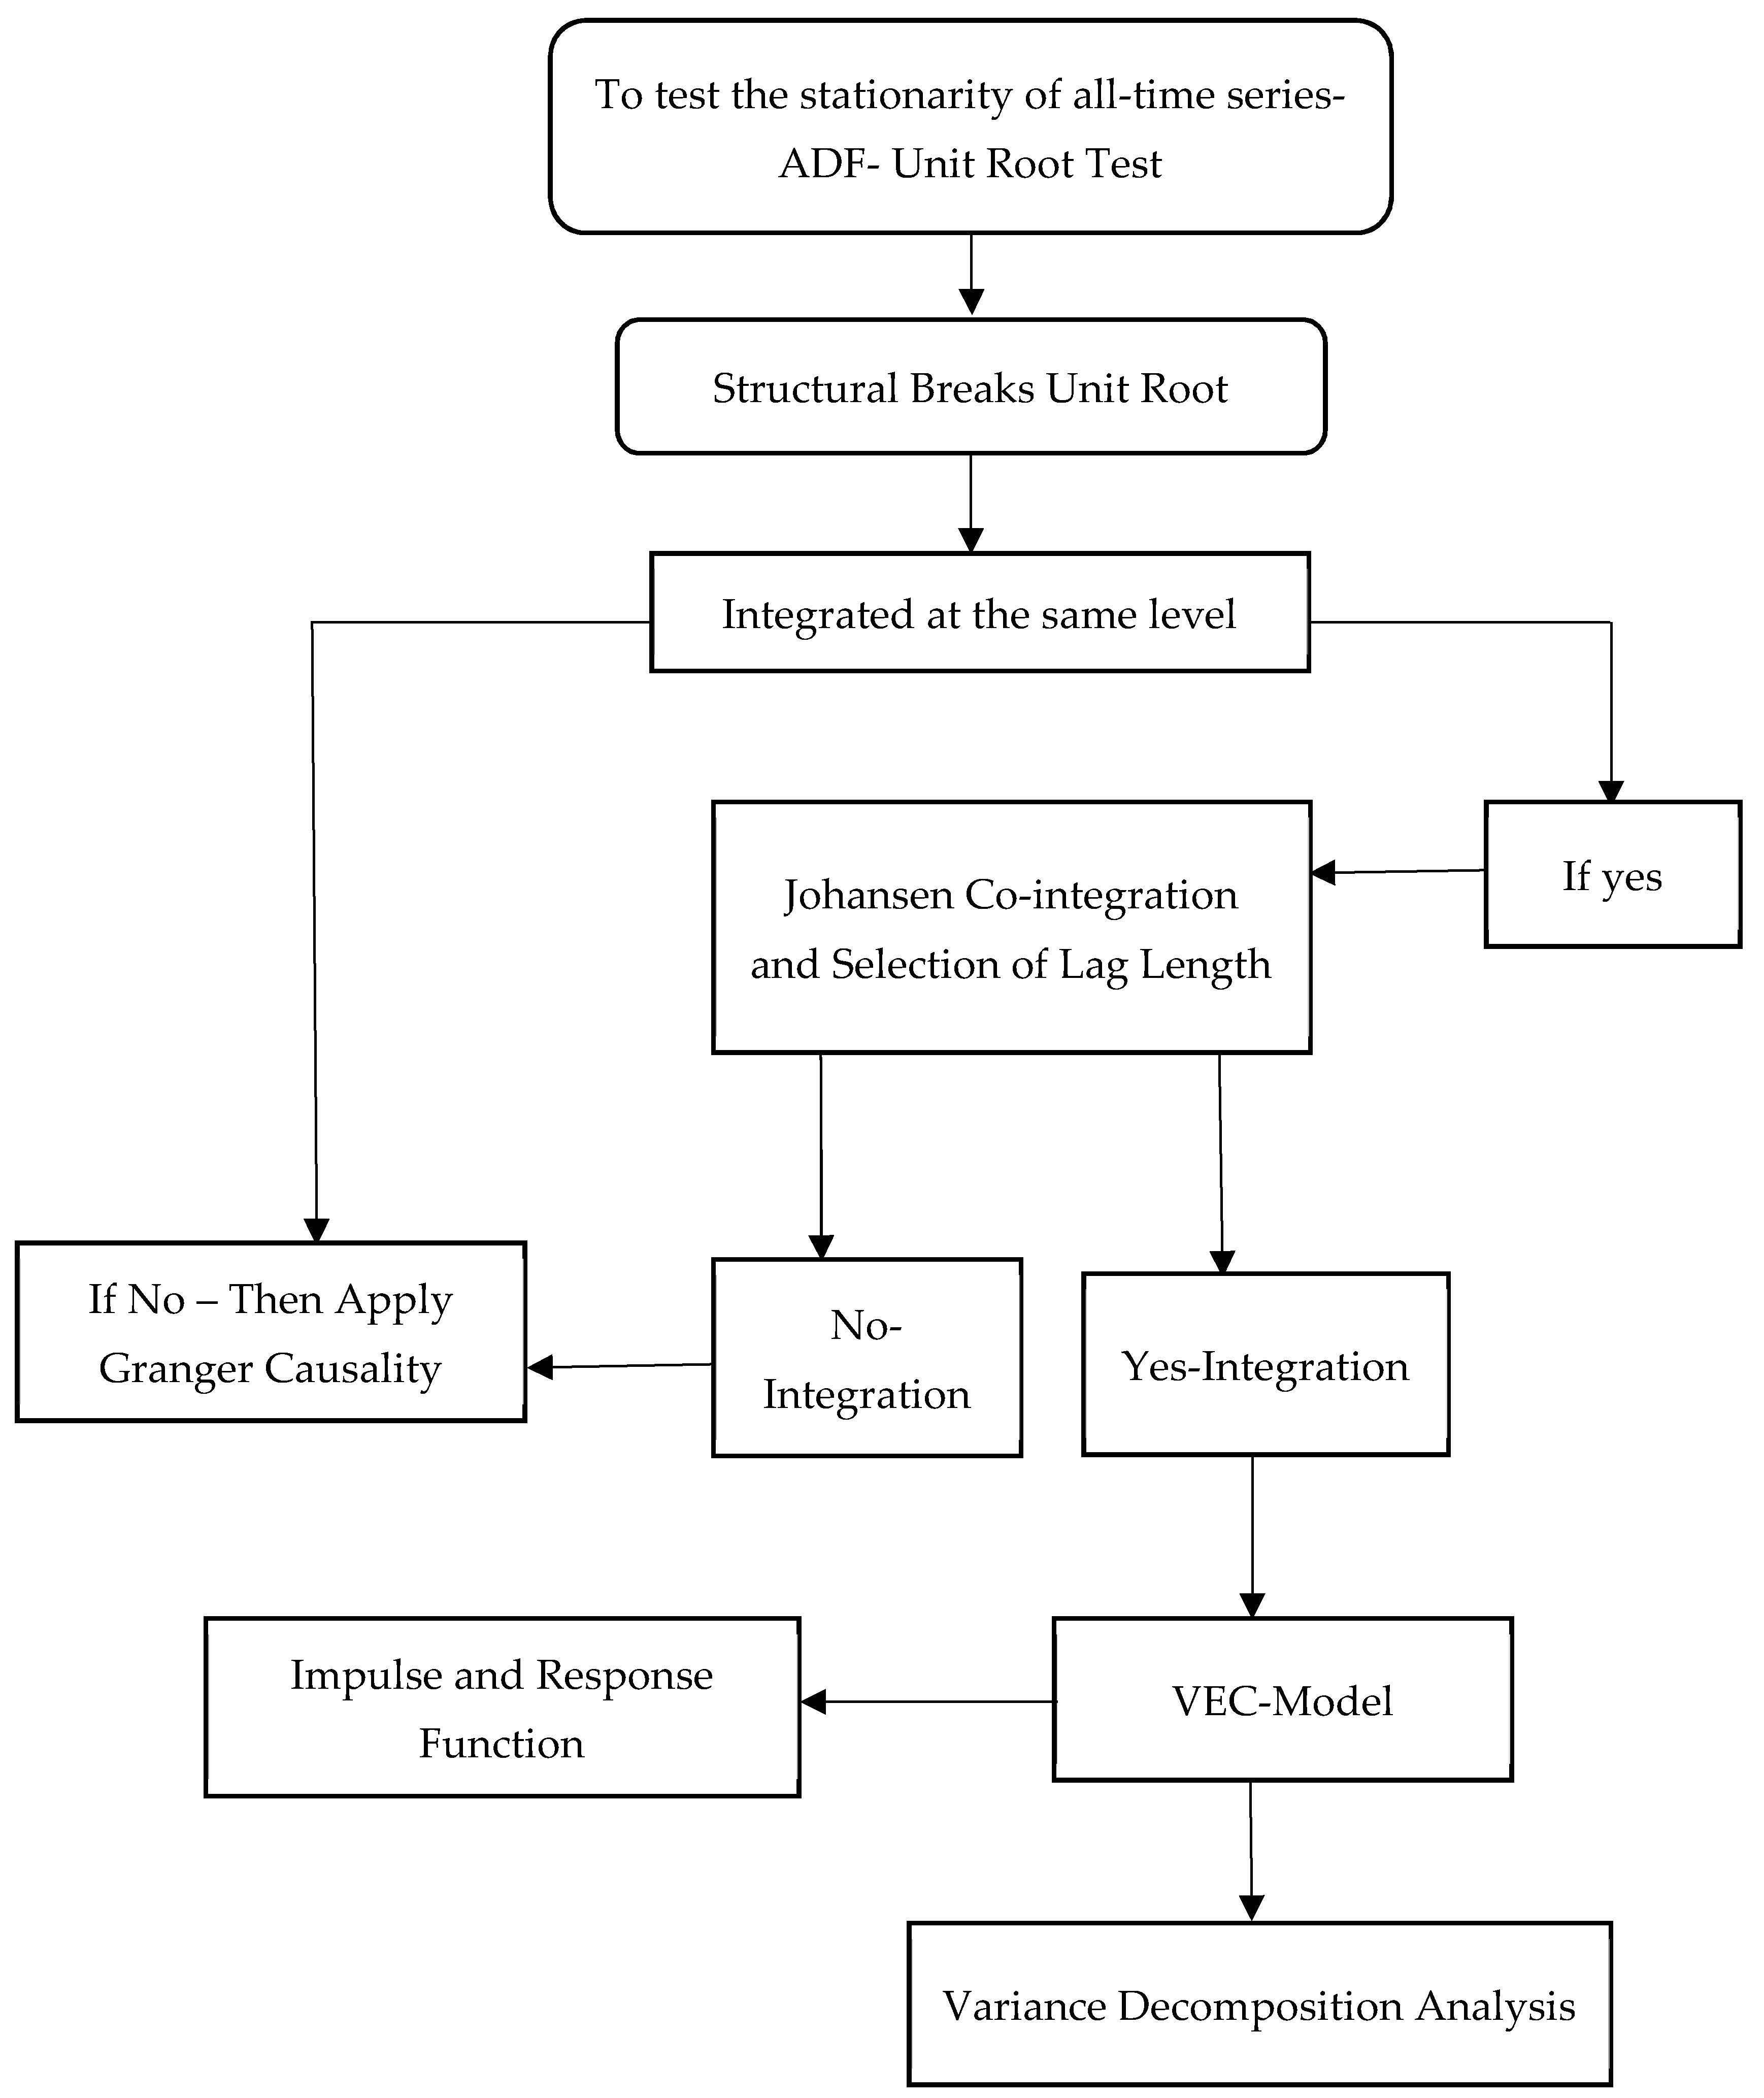
The environmental, social, and governance equity indices are increasingly popular among investors concerned with sustainable and responsible investment [
2]. Firms included on environmental social and governance (ESG) equity indices have to reflect superior sustainability performance and outperform their peers in an in-depth analysis of economics, environment, and social criteria. Based on this, these firms are considered sustainability leaders [
12]. Here, we study the newly developed MSCI ESG equity indices in the BRICS countries and examine their integration with their counterpart MSCI composite equity indices in the same countries and across these countries. The unit root diagnostic tests of ADF and PP suggest that all the times-series are stationary at level and at three lags. Further, the Johansen cointegration test confirms long-run integration between the two equity indices in the same country, as well across countries. Moreover, our findings suggest that there is a bi-directional spillover between the MSCI ESG equity indices and the MSCI composite equity indices in the same country, namely the returns of the MSCI ESG indices influence their counterpart composite indices, and vice versa. However, our findings reveal there is no long-run causality between conventional and non-conventional equity indices in the BRICS countries Brazil and Russia, although there is evidence of this in the remaining BRICS countries. Further, there is evidence of short-run causality between MSCI ESG and MSCI composite indices in all BRICS countries. This shows that the non-conventional markets in the BRICS countries are drawing investors, as well as their conventional markets. The short-run and long-run integration of these two indices may also suggest that investors are using the information of one index to predict the behavior of the other.
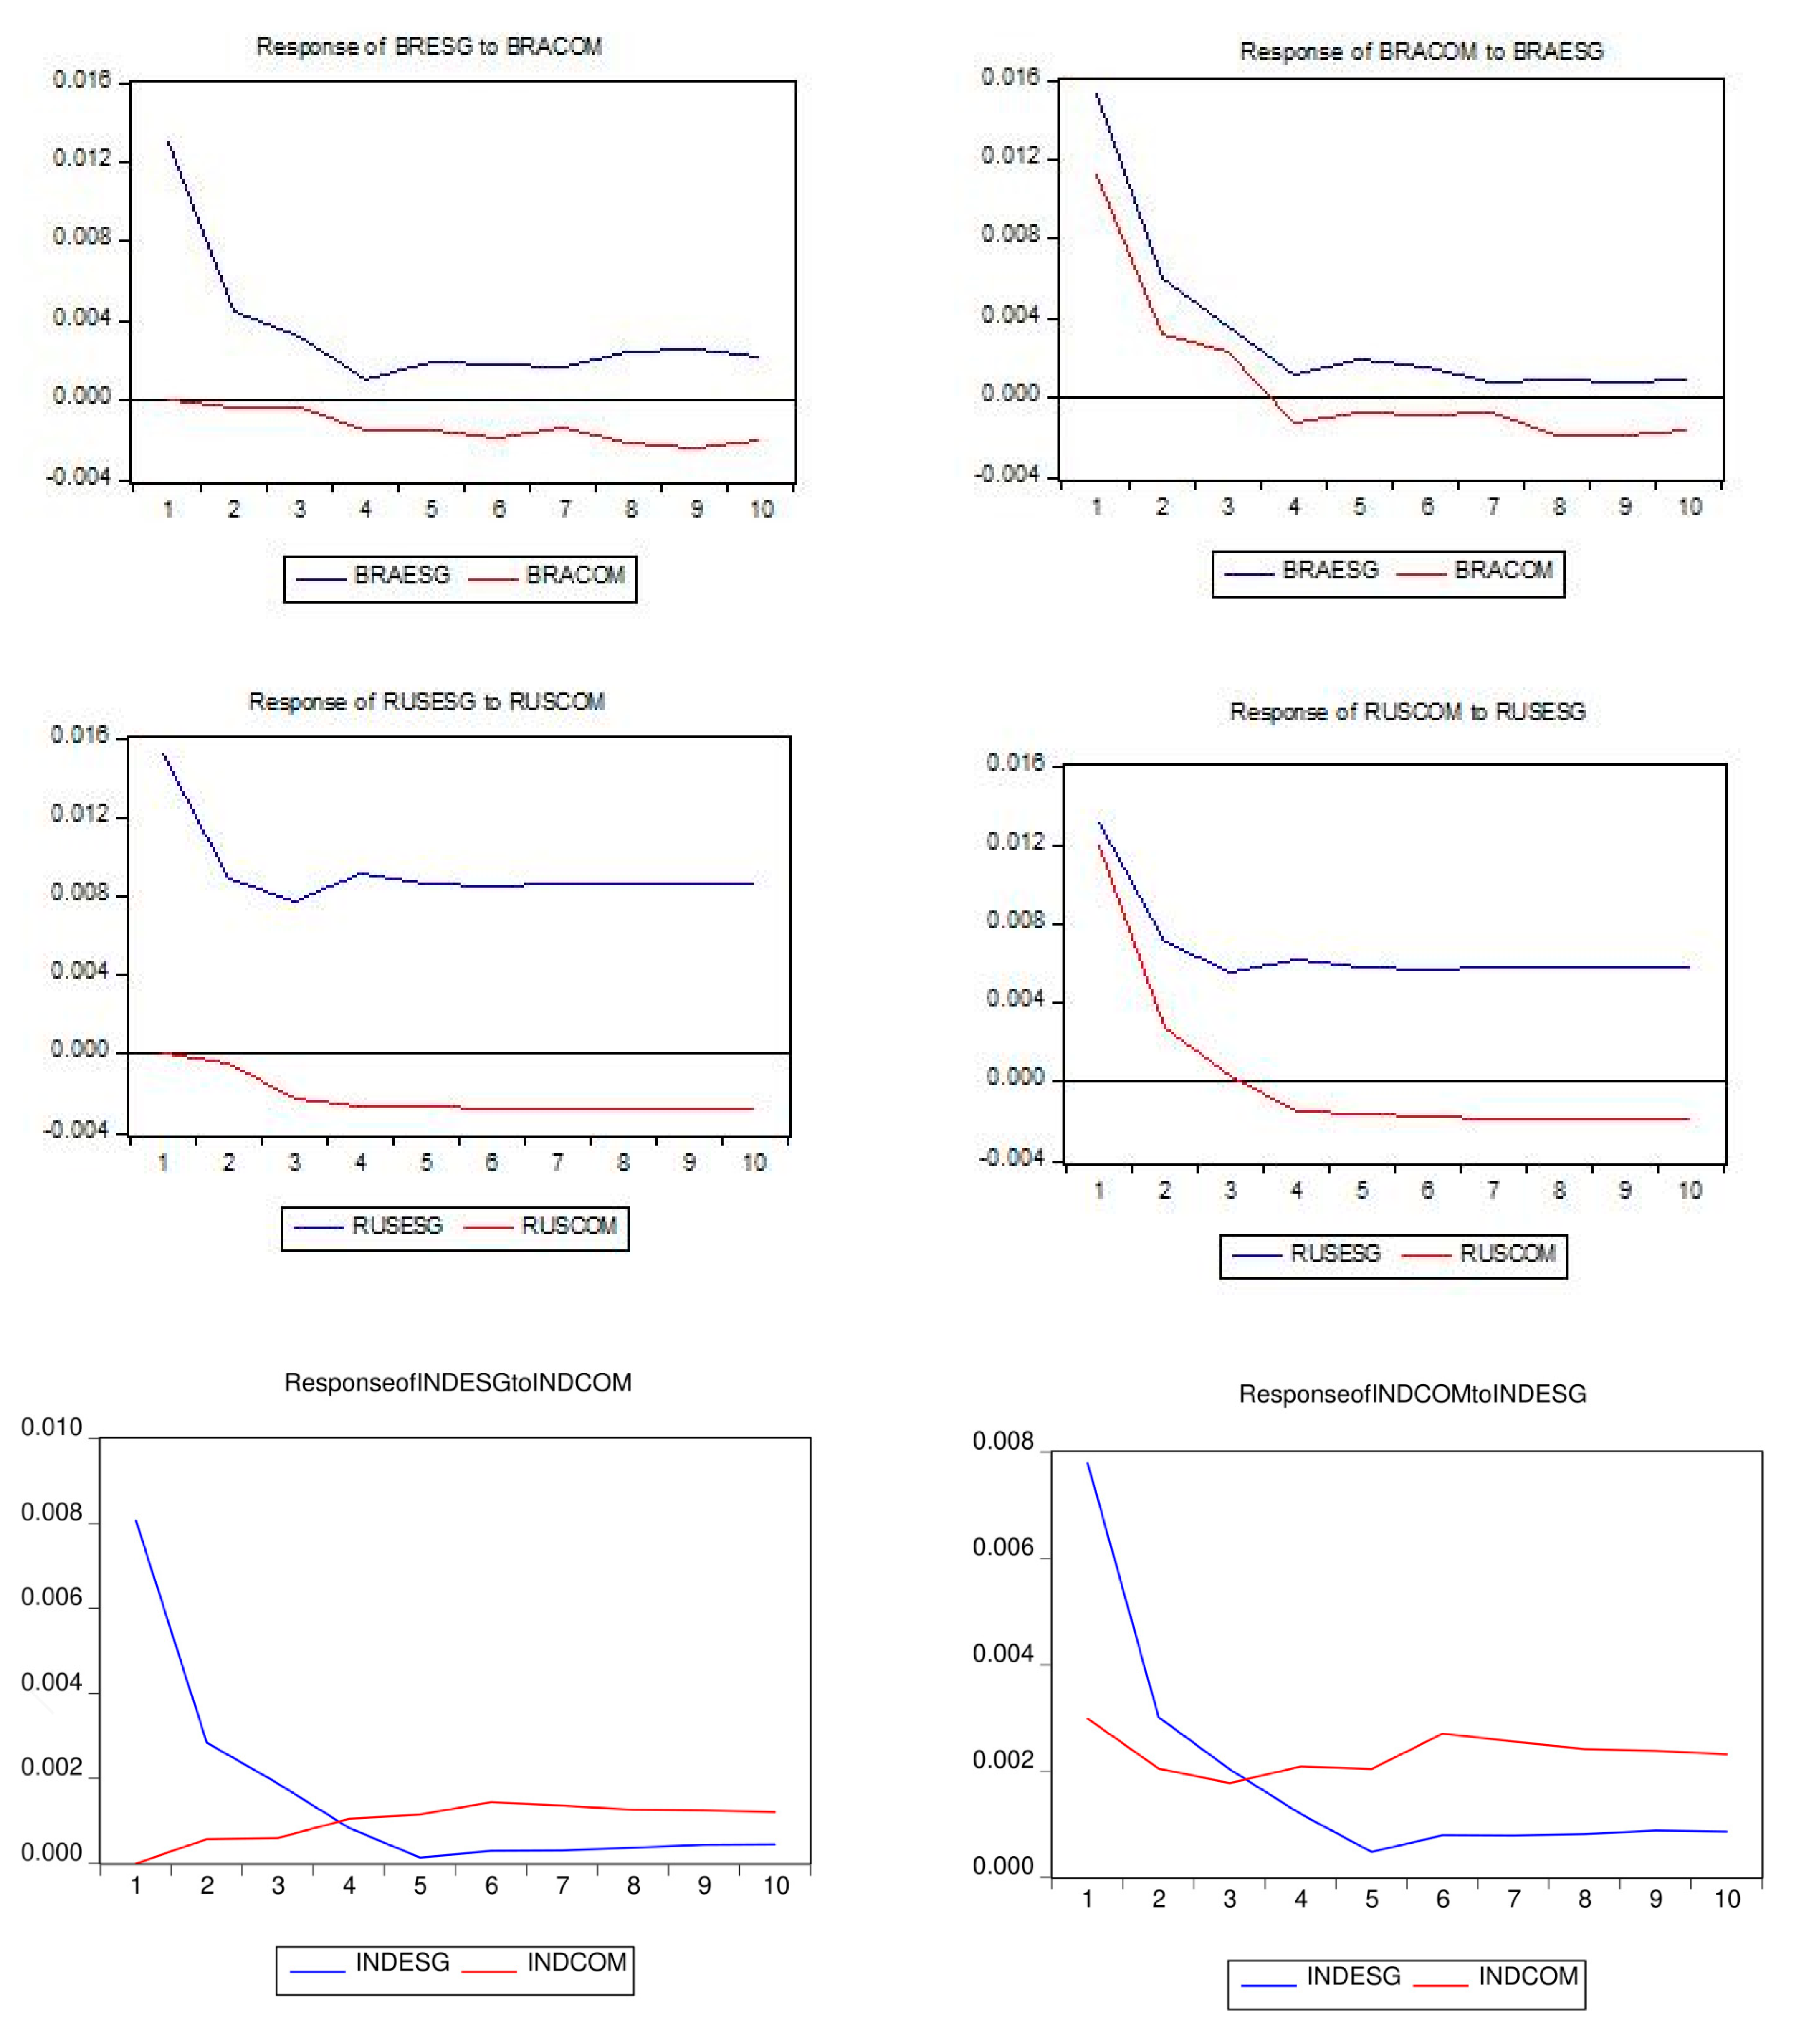
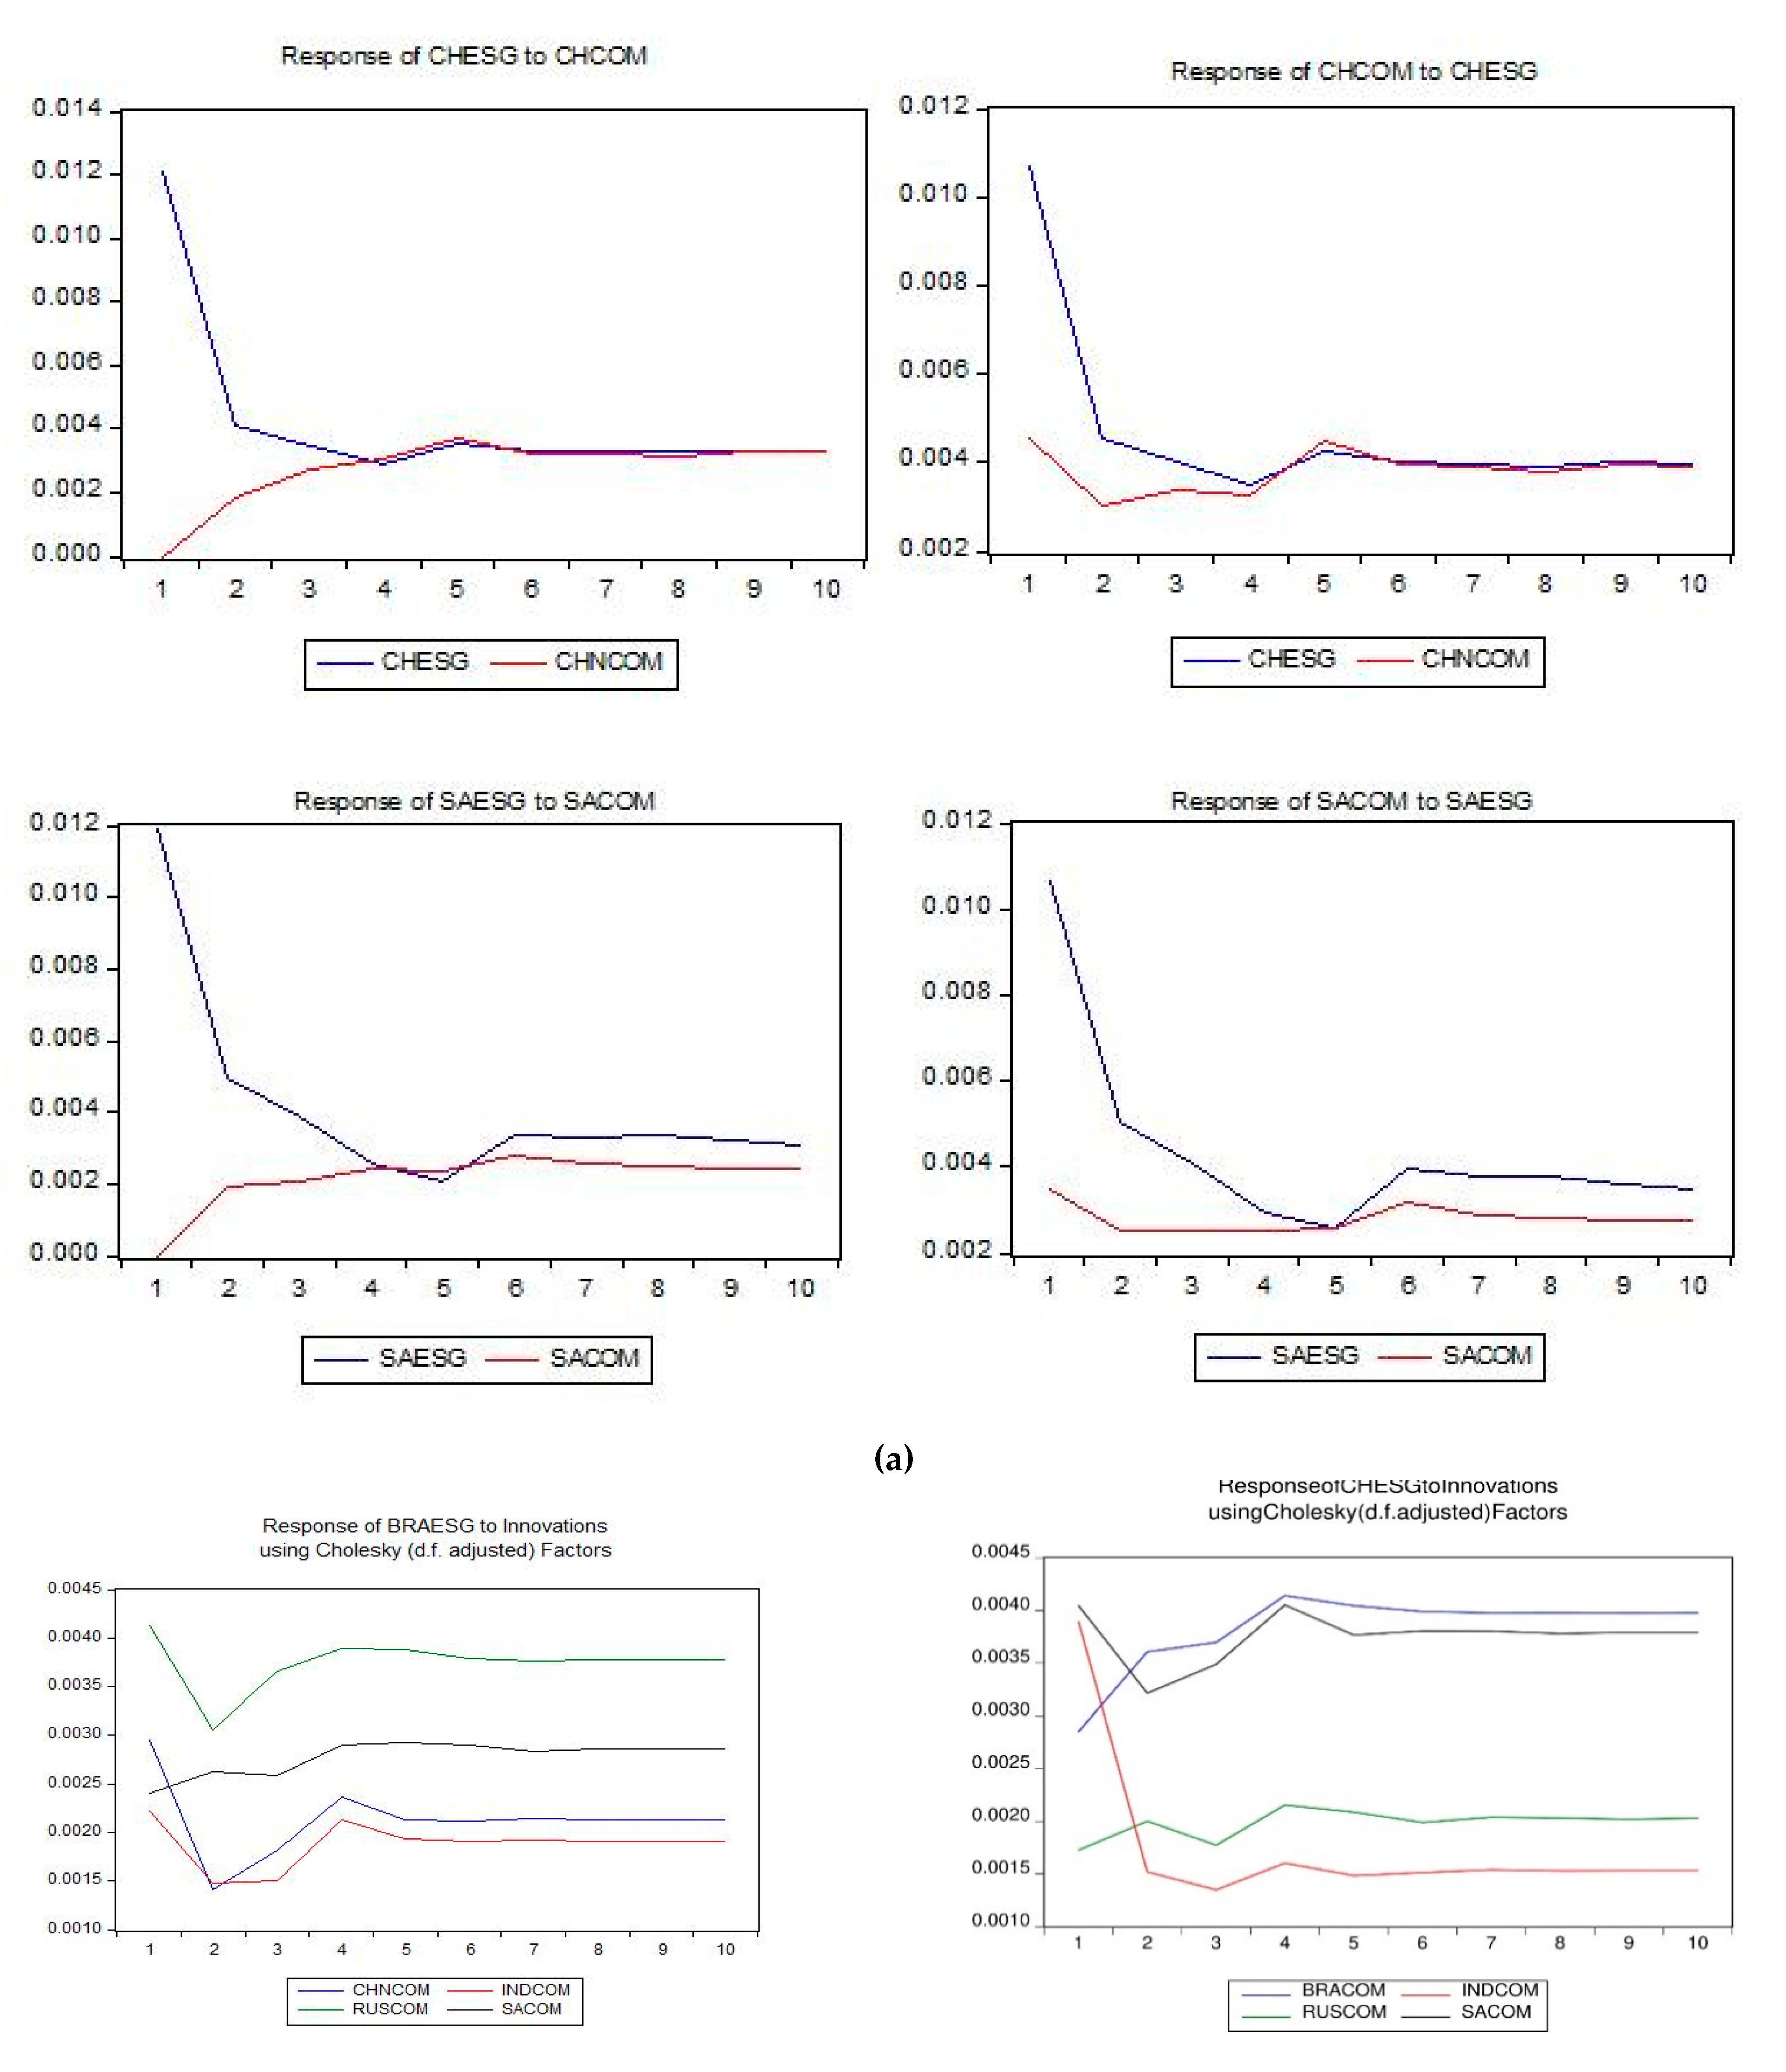
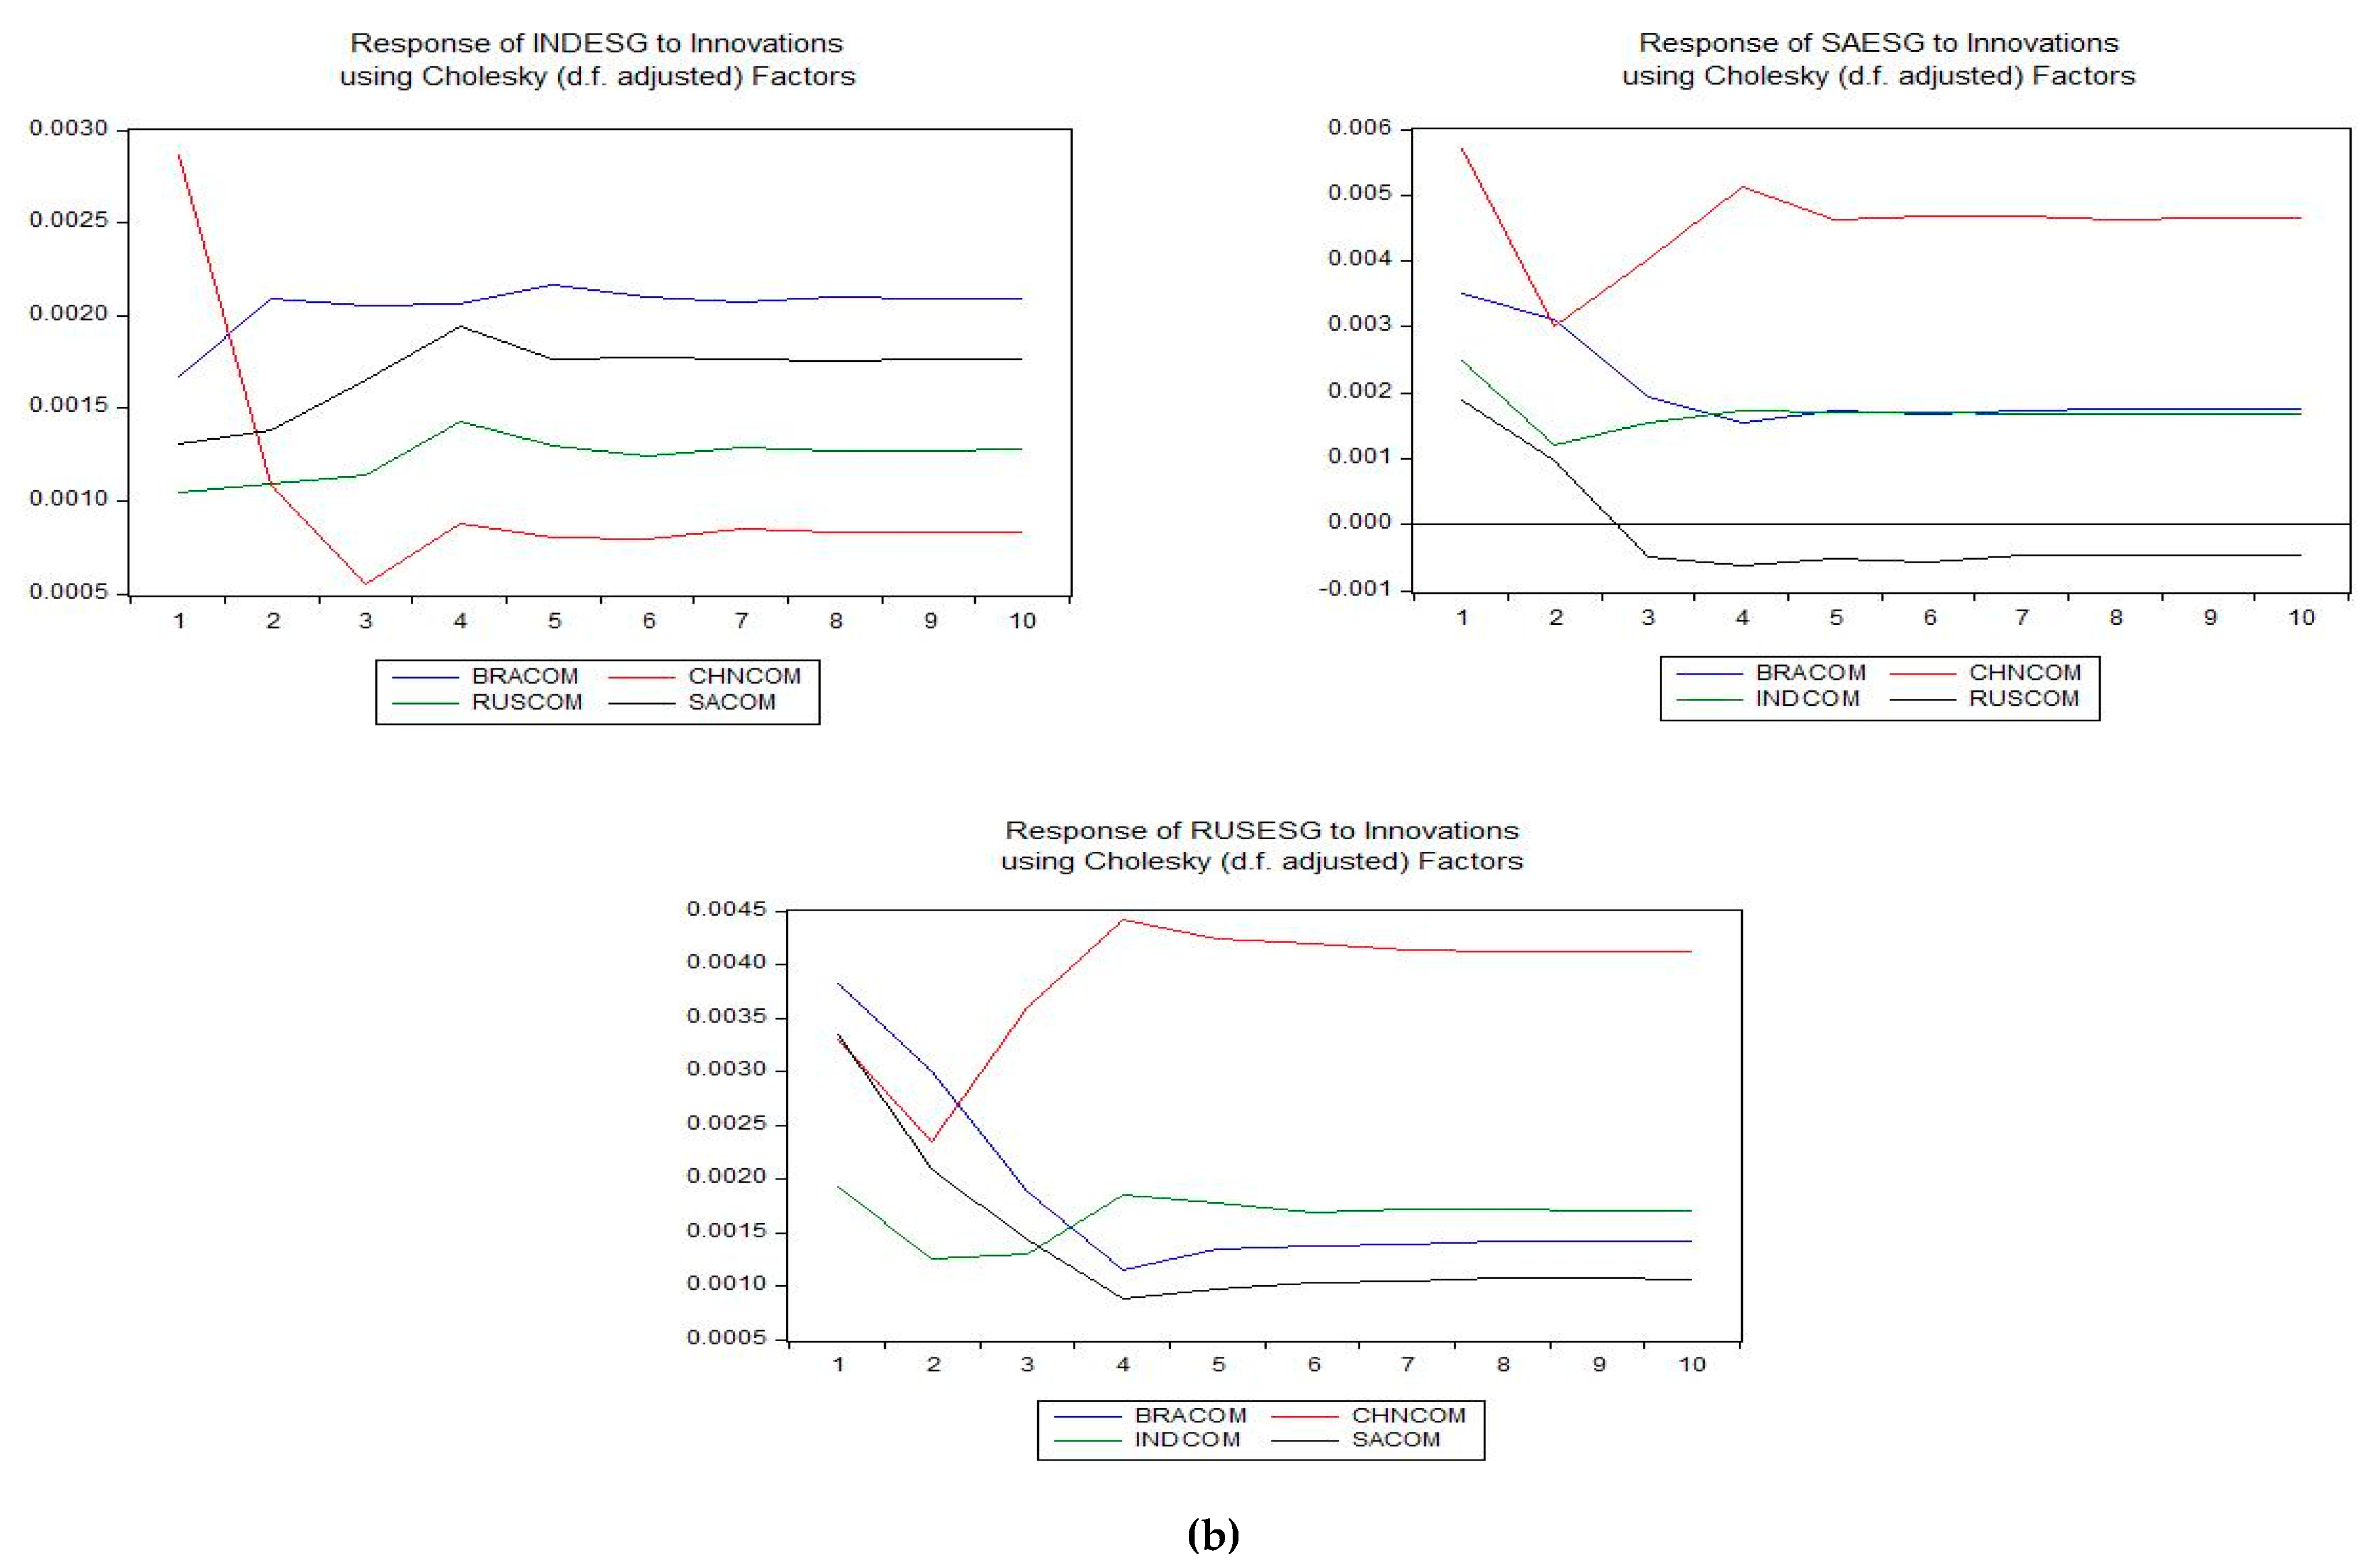
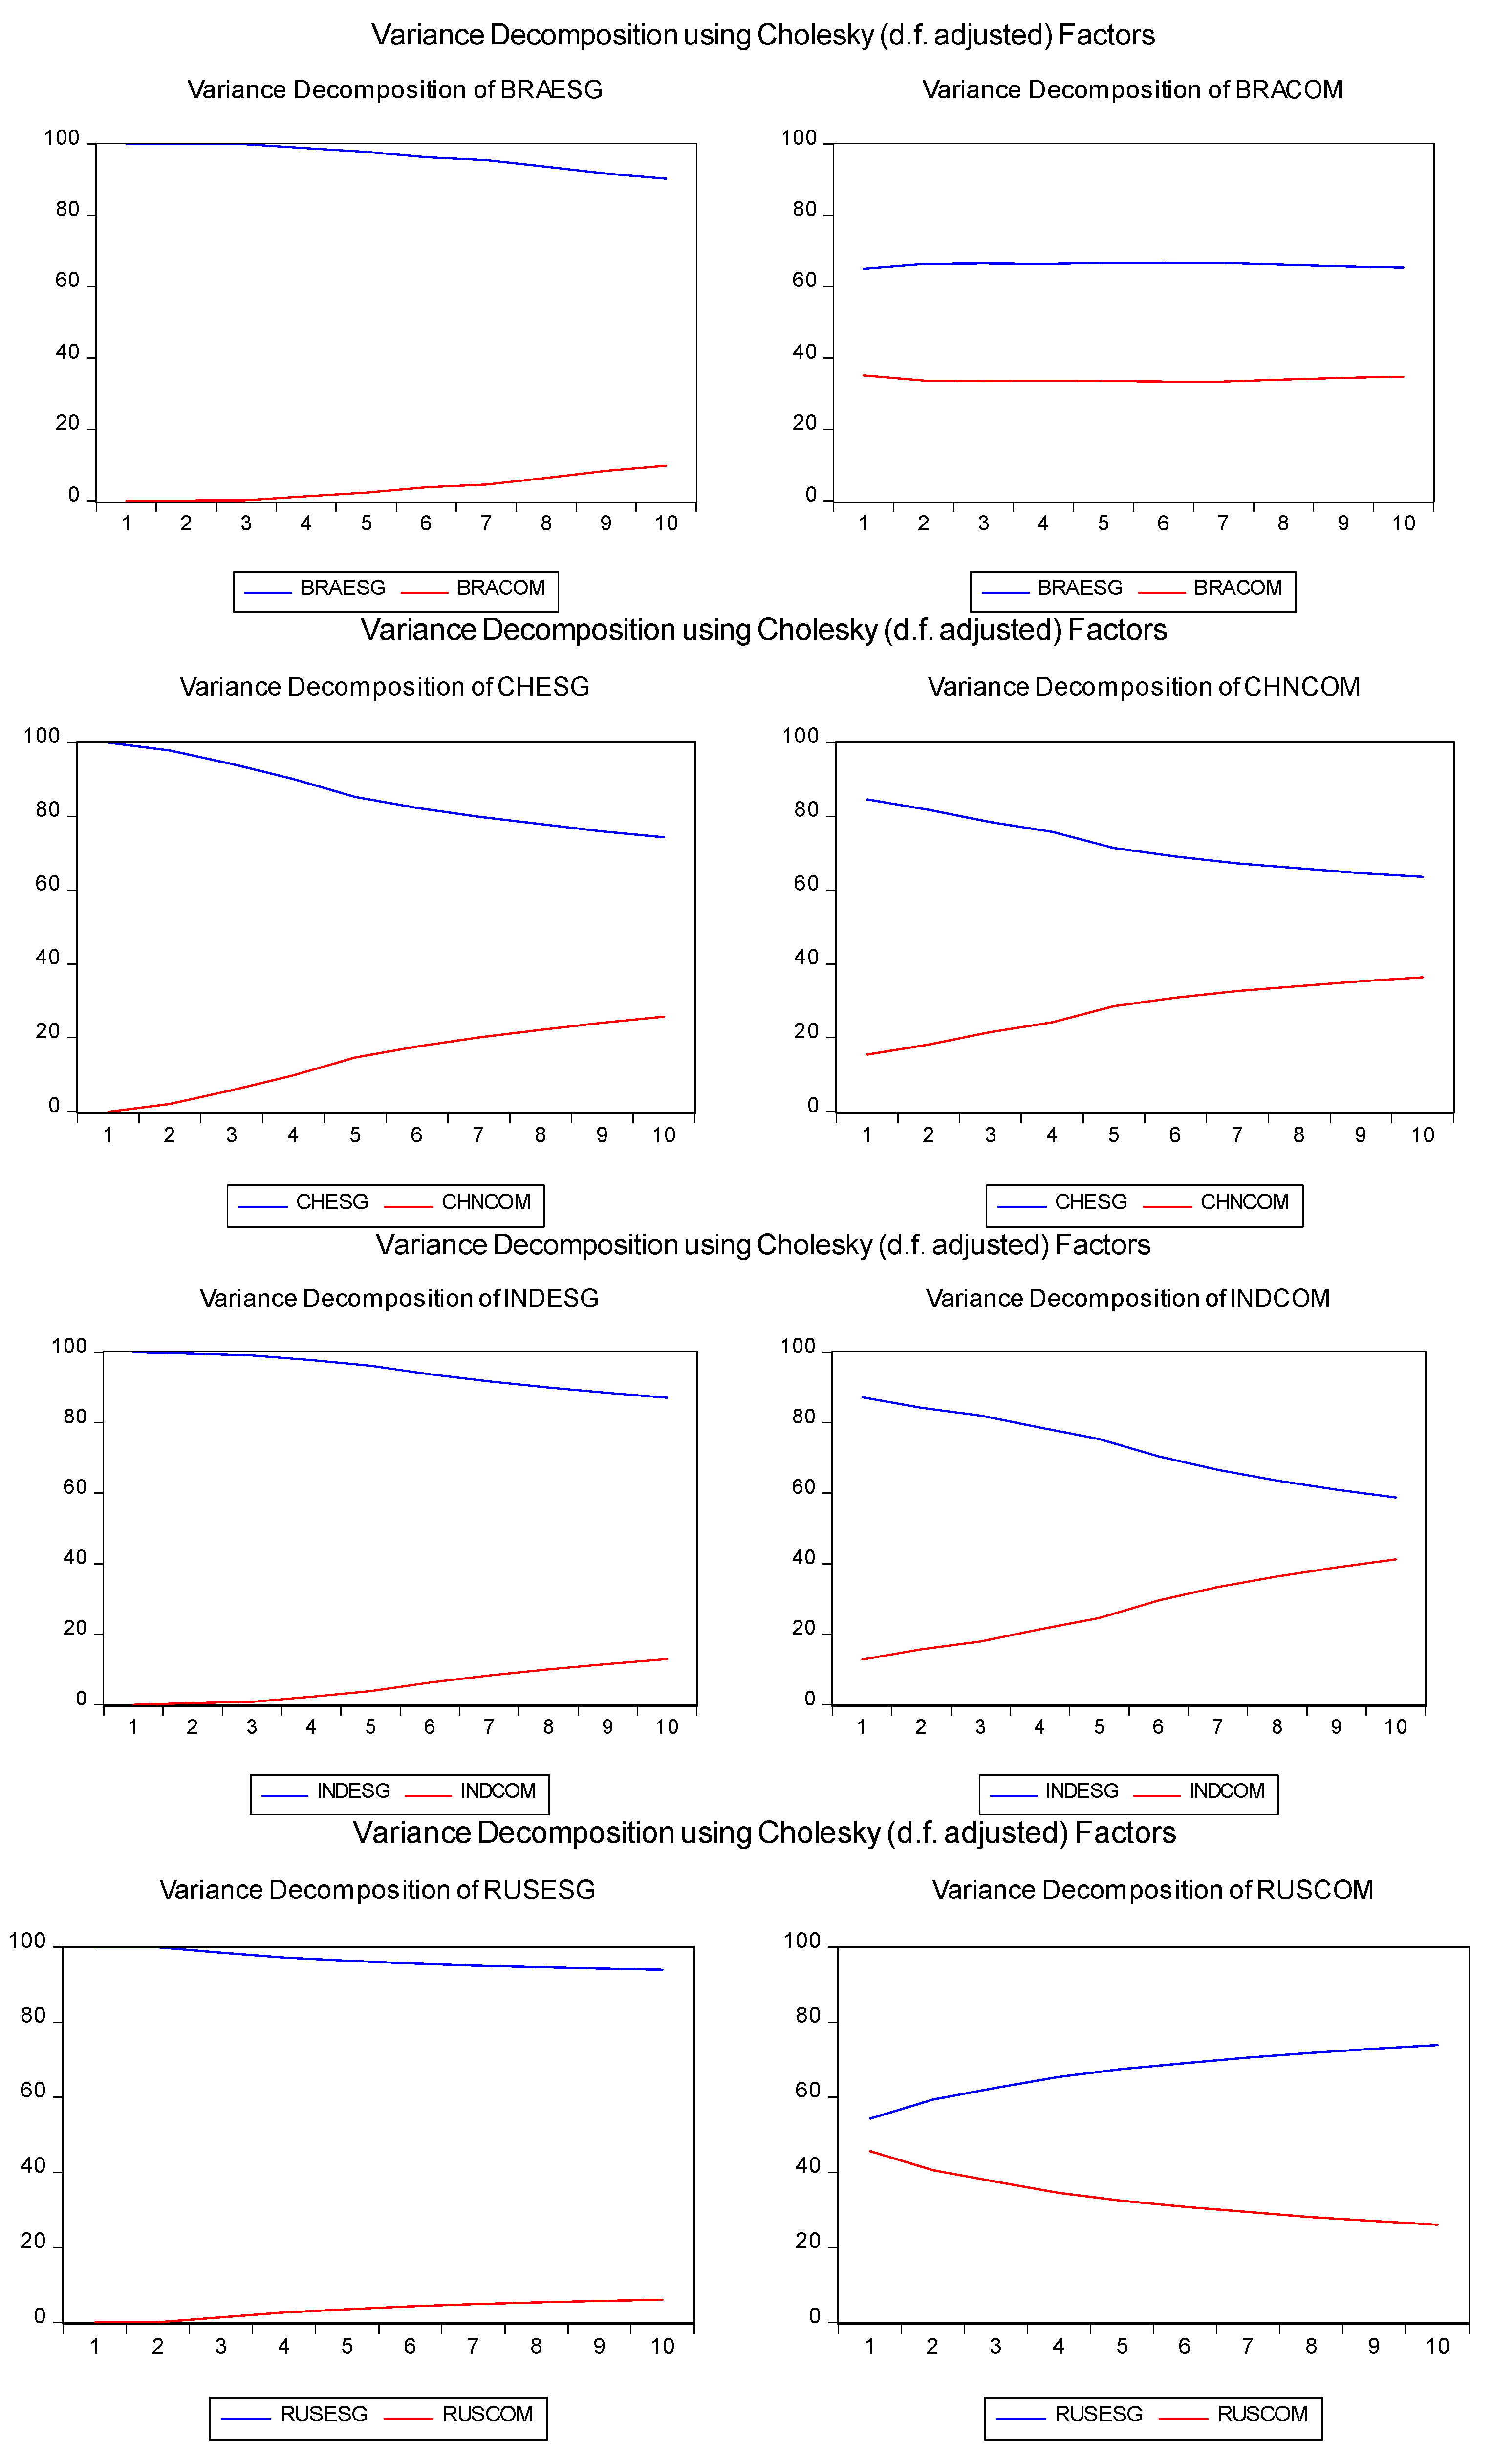
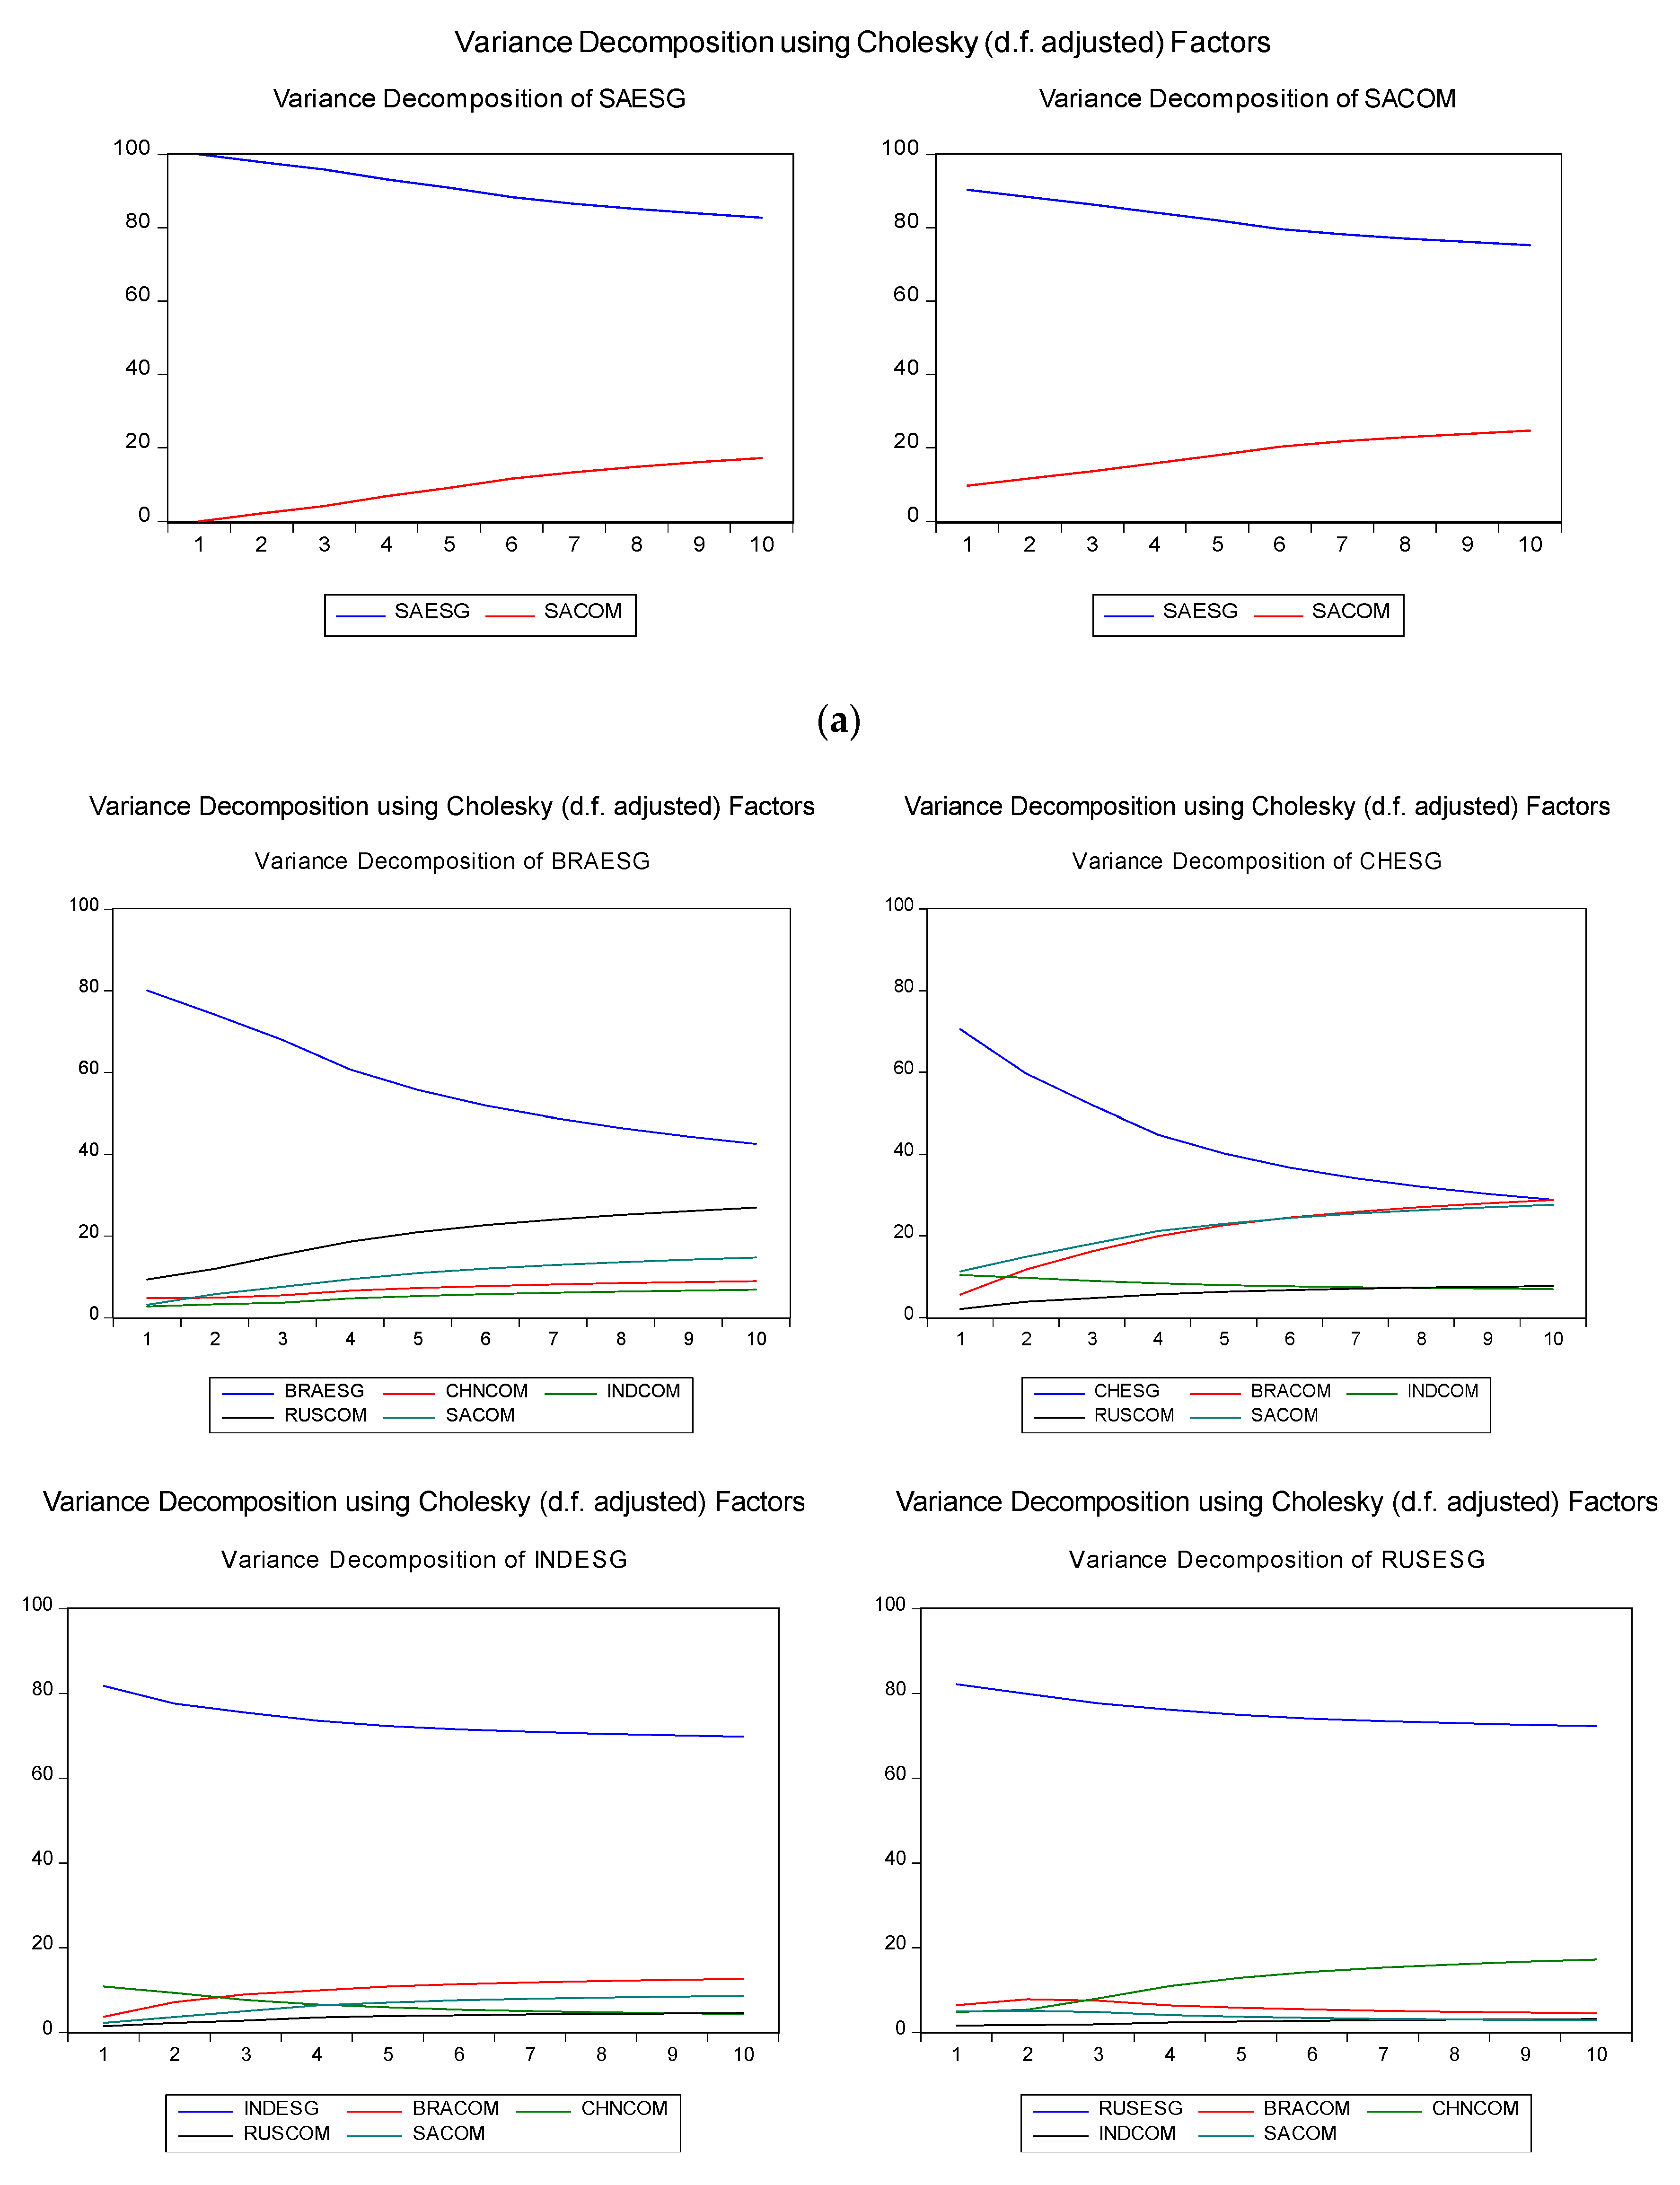
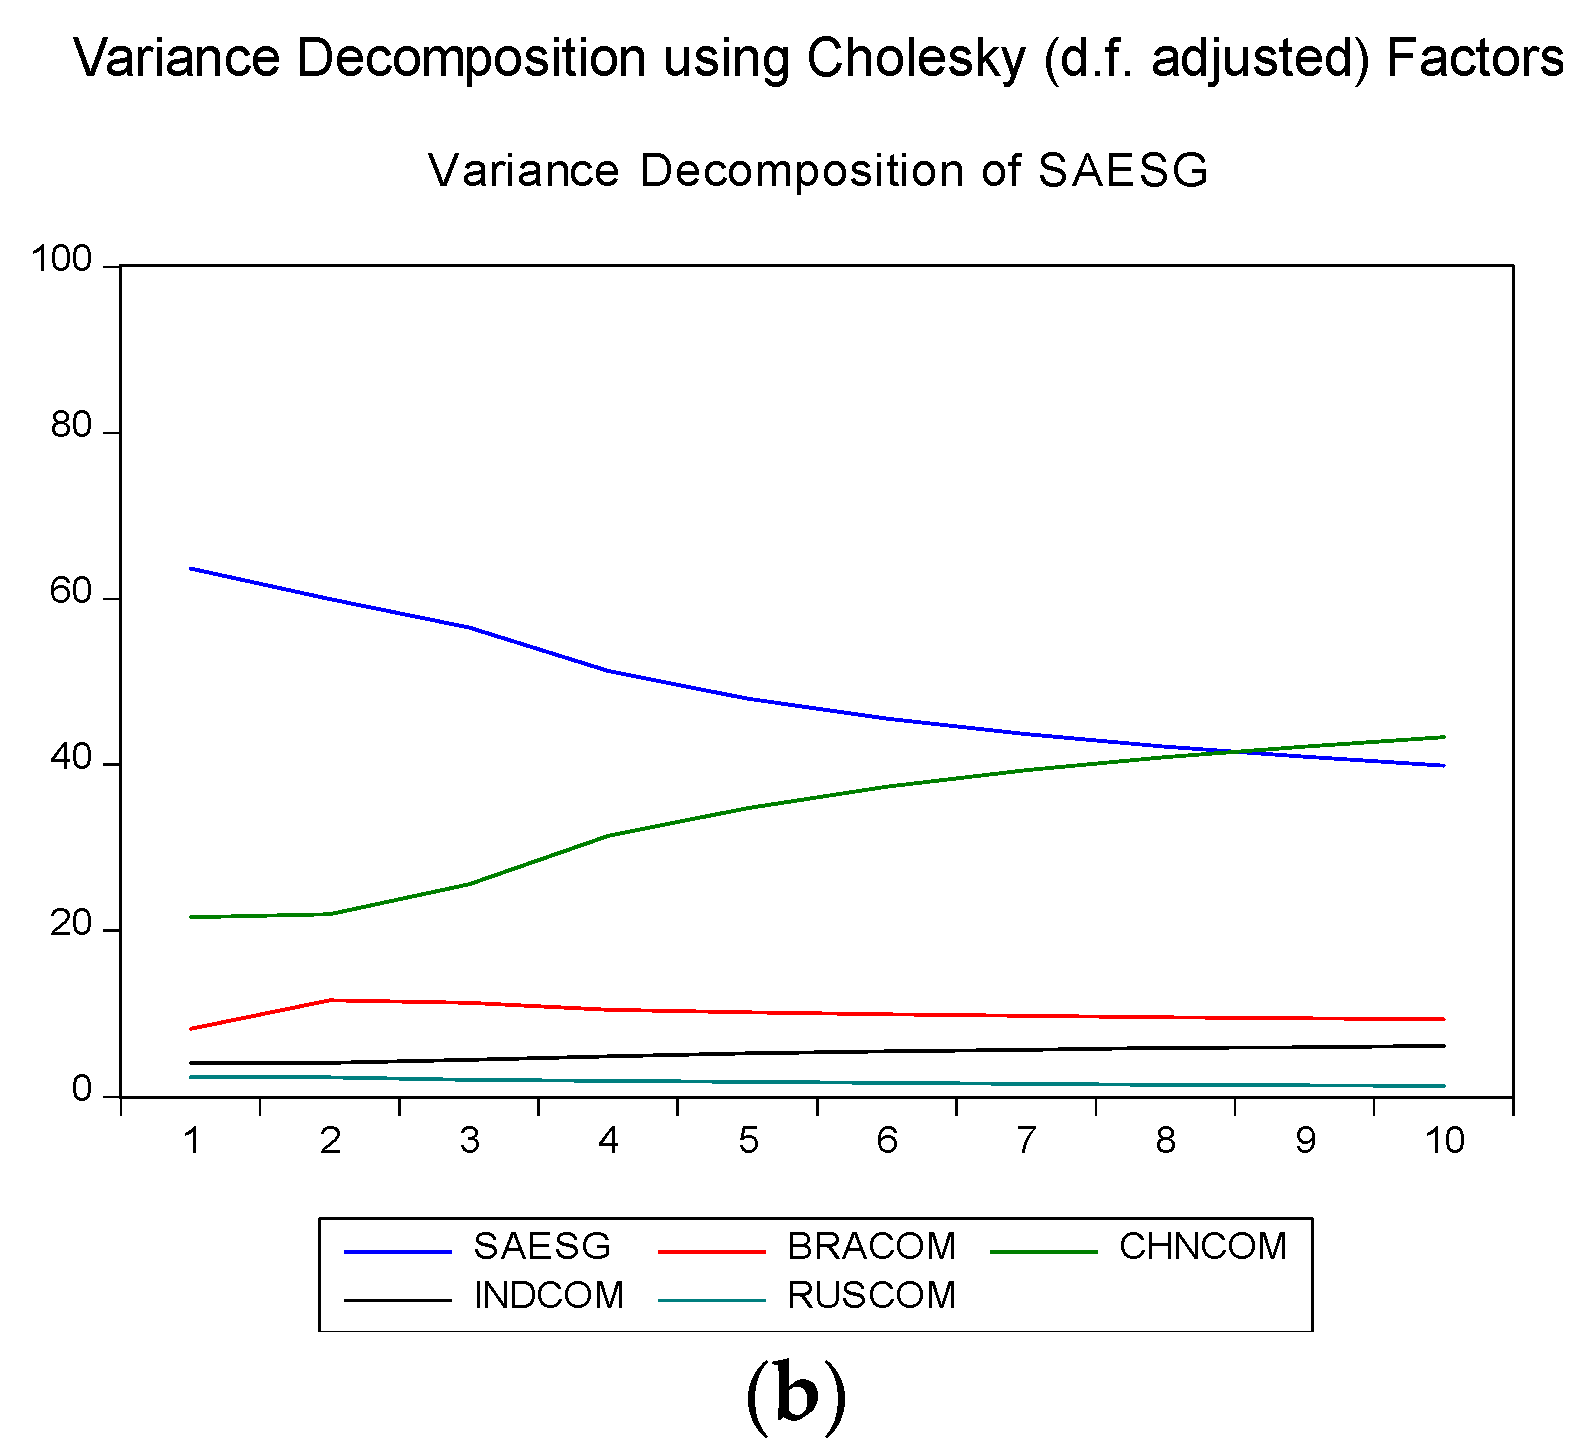
It is important to investigate the cross-border financial market integration in the case of the BRICS countries, in particular, due to their economic and financial cooperation. Our study finds that there is long-run causality between MSCI ESG equity indices in one country and the MSCI composite indices of all other BRICS countries. This implies that one country’s conventional market flows to the other countries’ non-conventional markets. The impulse response analysis also shows that the Brazil and Russia MSCI ESG equity returns respond negatively to one standard deviation shock in their counterpart composite returns for a prolonged period and then stabilize. However, the China, India, and South Africa MSCI ESG returns respond positively to the shock from the variations in their counterpart composite returns. Moreover, all the individual country’s MSCI ESG returns respond positively to one standard deviation shock from innovations in other countries’ composite returns for the first three to four periods and then stabilize. The variance decomposition analysis assesses the role of each of the BRICS conventional and non-conventional markets on the other’s movement. The results show that all ESG equity markets in the BRICS countries are affected by the ESG markets, as well as their counterpart composite markets. Moreover, these non-conventional markets are also influenced with other country’s conventional markets.
Our findings suggest that the Brazil and Russia conventional and non-conventional markets are comparatively independent with in the same country in long-run; however, across regions there is a long-run causality between their non-conventional and other regions conventional markets. This then provides an opportunity for Brazil and Russia’s local investors to diversify their investments by investing in different markets. Further, there is evidence of integration among all BRICS conventional and non-conventional markets. Our findings align with those of Naidu et al. [
69] and Nashier [
70], who conclude that the BRICS countries’ stock markets are integrated. However, our study is unique in that is differs from the perspective of conventional and non-conventional markets. Moreover, our study uniquely uses most cointegration models, the Johansen cointegration test, the vector error correction model, the impulse response function, and the variance decomposition analysis to test integration level. Using such multiple measures increased the reliability of our study.
Our findings imply that the importance of socially responsible practices has been increasing in emerging economies, along with investor interest, namely socially responsible equities are as attractive to investors as other equities today. At the same time, our results suggest that investors using ESG indices for diversification will no longer enjoy such benefits based on the stronger integration of the two indices. The BRICS ESG indices show the same stochastic trend as of the composite indices. The integration of Asian ESG indices with regional and cross-continental composite indices implies close economic cooperation and a regional flow of investment without barriers. This also validates the formation of BRICS to further enhance economic cooperation, from a globalization perspective, and the use of ESG criteria in investment and the construction of portfolios. Further, the findings suggest a flow of information between the two different equity indices within and across countries due to market integration.
For investors, it will be easy to adjust their investment strategies by predicting the behavior of one equity index by using information from the other. Financial managers and professionals can obtain more insights regarding their investment decisions and make adjustments in their investment portfolios by considering both types of equity indices from diversification of risk and hedging [
40,
44]. Additionally, for policymakers, our findings are relevant in responding to increasing financial interactions across borders. Governments can use this information while drafting public policies related to non-conventional financial markets. Further, our findings are valuable in the context of economic and political changes occurring in China and India and how these will affect conventional and non-conventional markets within or across borders both.
6. Conclusions
Our study examines the integration between ESG and composite indices in the BRICS countries. The BRICS composition is unique in that it comprises the three largest emerging economies, as well as one in South America and one in Africa. Further, we widen our scope so that each BRICS country’s ESG indices is examined against counterpart composite indices in that country and against all other BRICS countries. Our results confirm that the ESG indices in the BRICS countries are cointegrated with their composite counterparts and this integration is not limited to country-level composite indices but is also integrated with the other BRICS countries’ composite indices. This implication is that the socially responsible indices of the emerging economies are well integrated with each other’s composite indices. This integration is most substantial in India, China, and South Africa.
The results also depict that the Brazil and Russian conventional and non-conventional markets have no long-run causality between them. However, there is evidence of short-run causality between conventional and non-conventional markets in these countries. Further, the economic and financial cooperation between BRICS countries makes a stronger case to investigate the cross-border financial market integration. The findings show a long-run causality between MSCI ESG equity indices of one country with MSCI composite equity indices of all other BRICS countries. These results suggest that there is a flow of information between conventional and non-conventional markets across countries. Moreover, mixed results are found in case of impulse response analysis, where Brazil and Russia MSCI ESG equity returns respond negatively, and China, India, and South Africa MSCI ESG equity return respond positively to one standard deviation shock in their counterpart composite returns for a prolonged period and then stabilize. However, the results of impulse response analysis across countries show consistent results. All individual country’s MSCI ESG returns respond positively to one standard deviation shock from all other countries’ counterpart indices.
Our results imply that non-conventional equity indices have not been fully developed to the extent that they show sustainable integration with conventional equity indices in the BRICS countries. Therefore, these sustainable or non-conventional equity indices need to be promoted further to become fully integrated in the financial systems in these countries However, as in all studies, ours has some limitations. First, our scope is limited to BRICS countries and the post-crisis period. Further studies should consider other countries and other time periods and the integration of ESG indices with composite indices, as well as the impact of structural breaks on integration. Second, individual behavioral preferences depend on the social and cultural context, so further studies should incorporate the impact of ESG considering the investment context. Future research can investigate investment portfolios based on the traditional index and its ESG counterpart using the 1/N rule, mean-variance framework, and Black-Litterman model, among others. Comparison can be made between these portfolios and a conventional index to gauge the value of ESG in terms of diversification. Measures, such as value-at-risk and the expected shortfall, can be employed to evaluate investment performance.

 ,
, 


