
Analyzing Extreme Temperature Patterns in Subtropical Highlands Climates: Implications for Disaster Risk Reduction Strategies

 , , , , and
Abstract
:1. Introduction
2. Materials and Methods
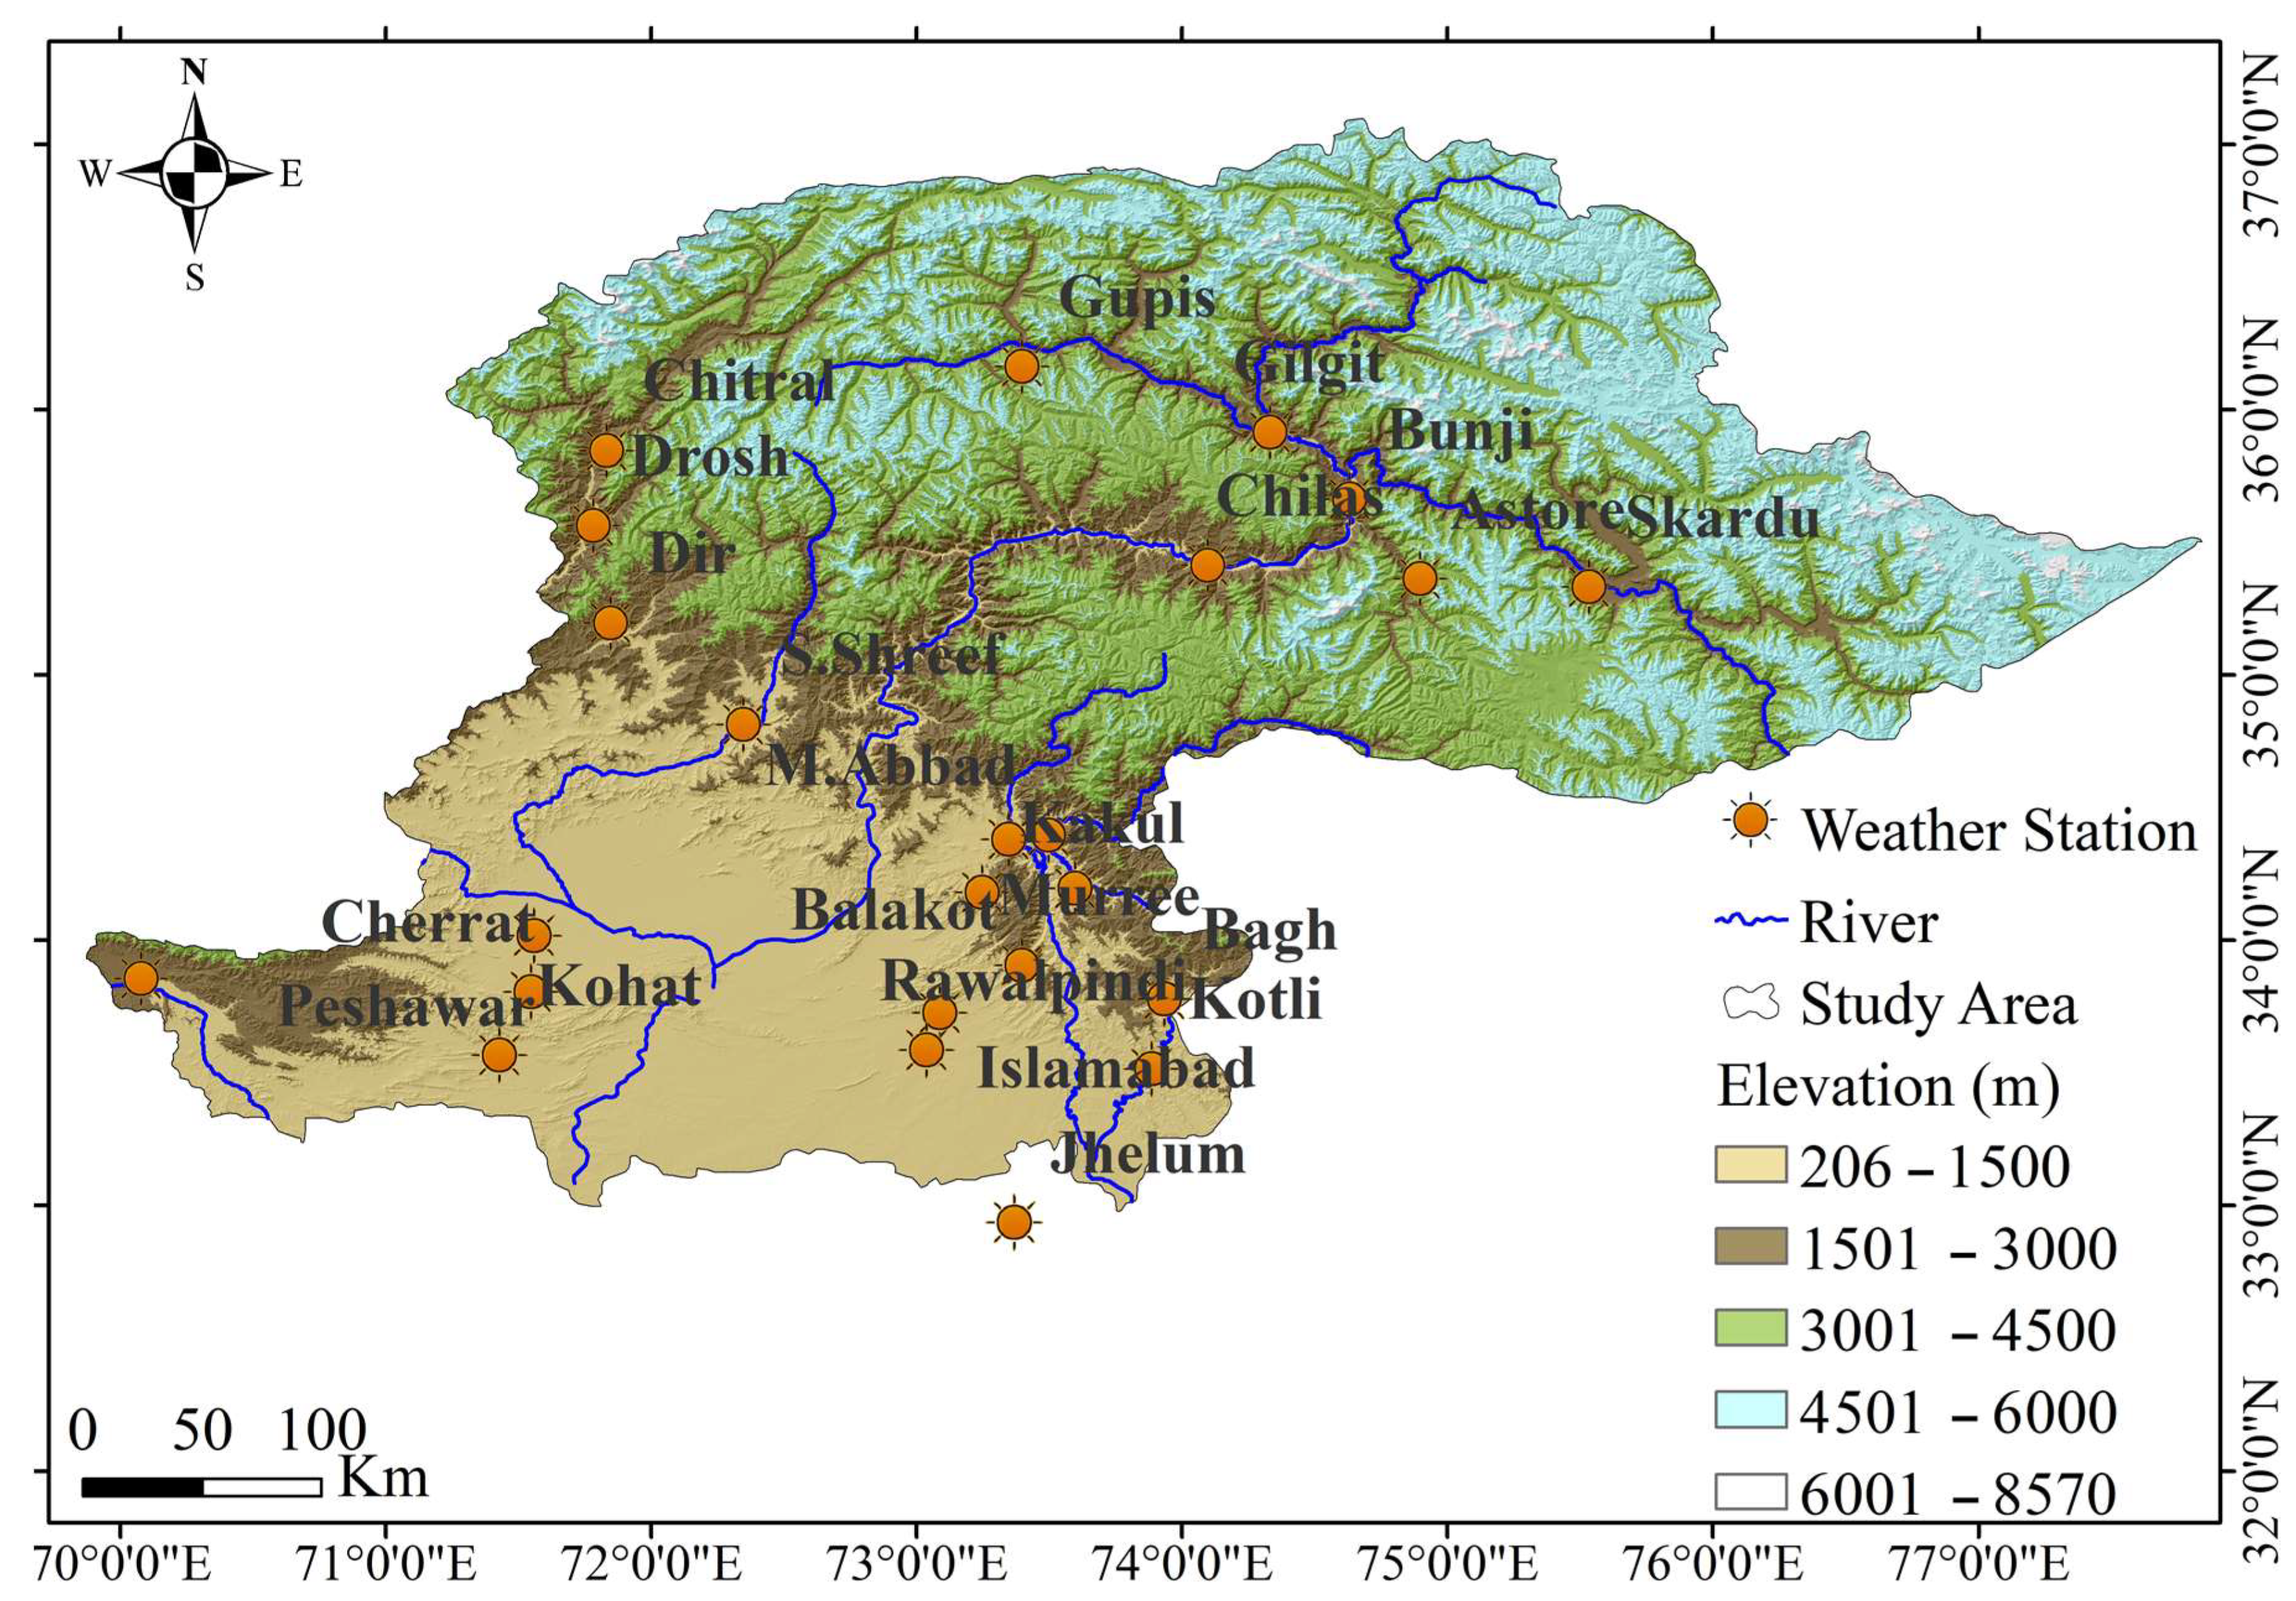
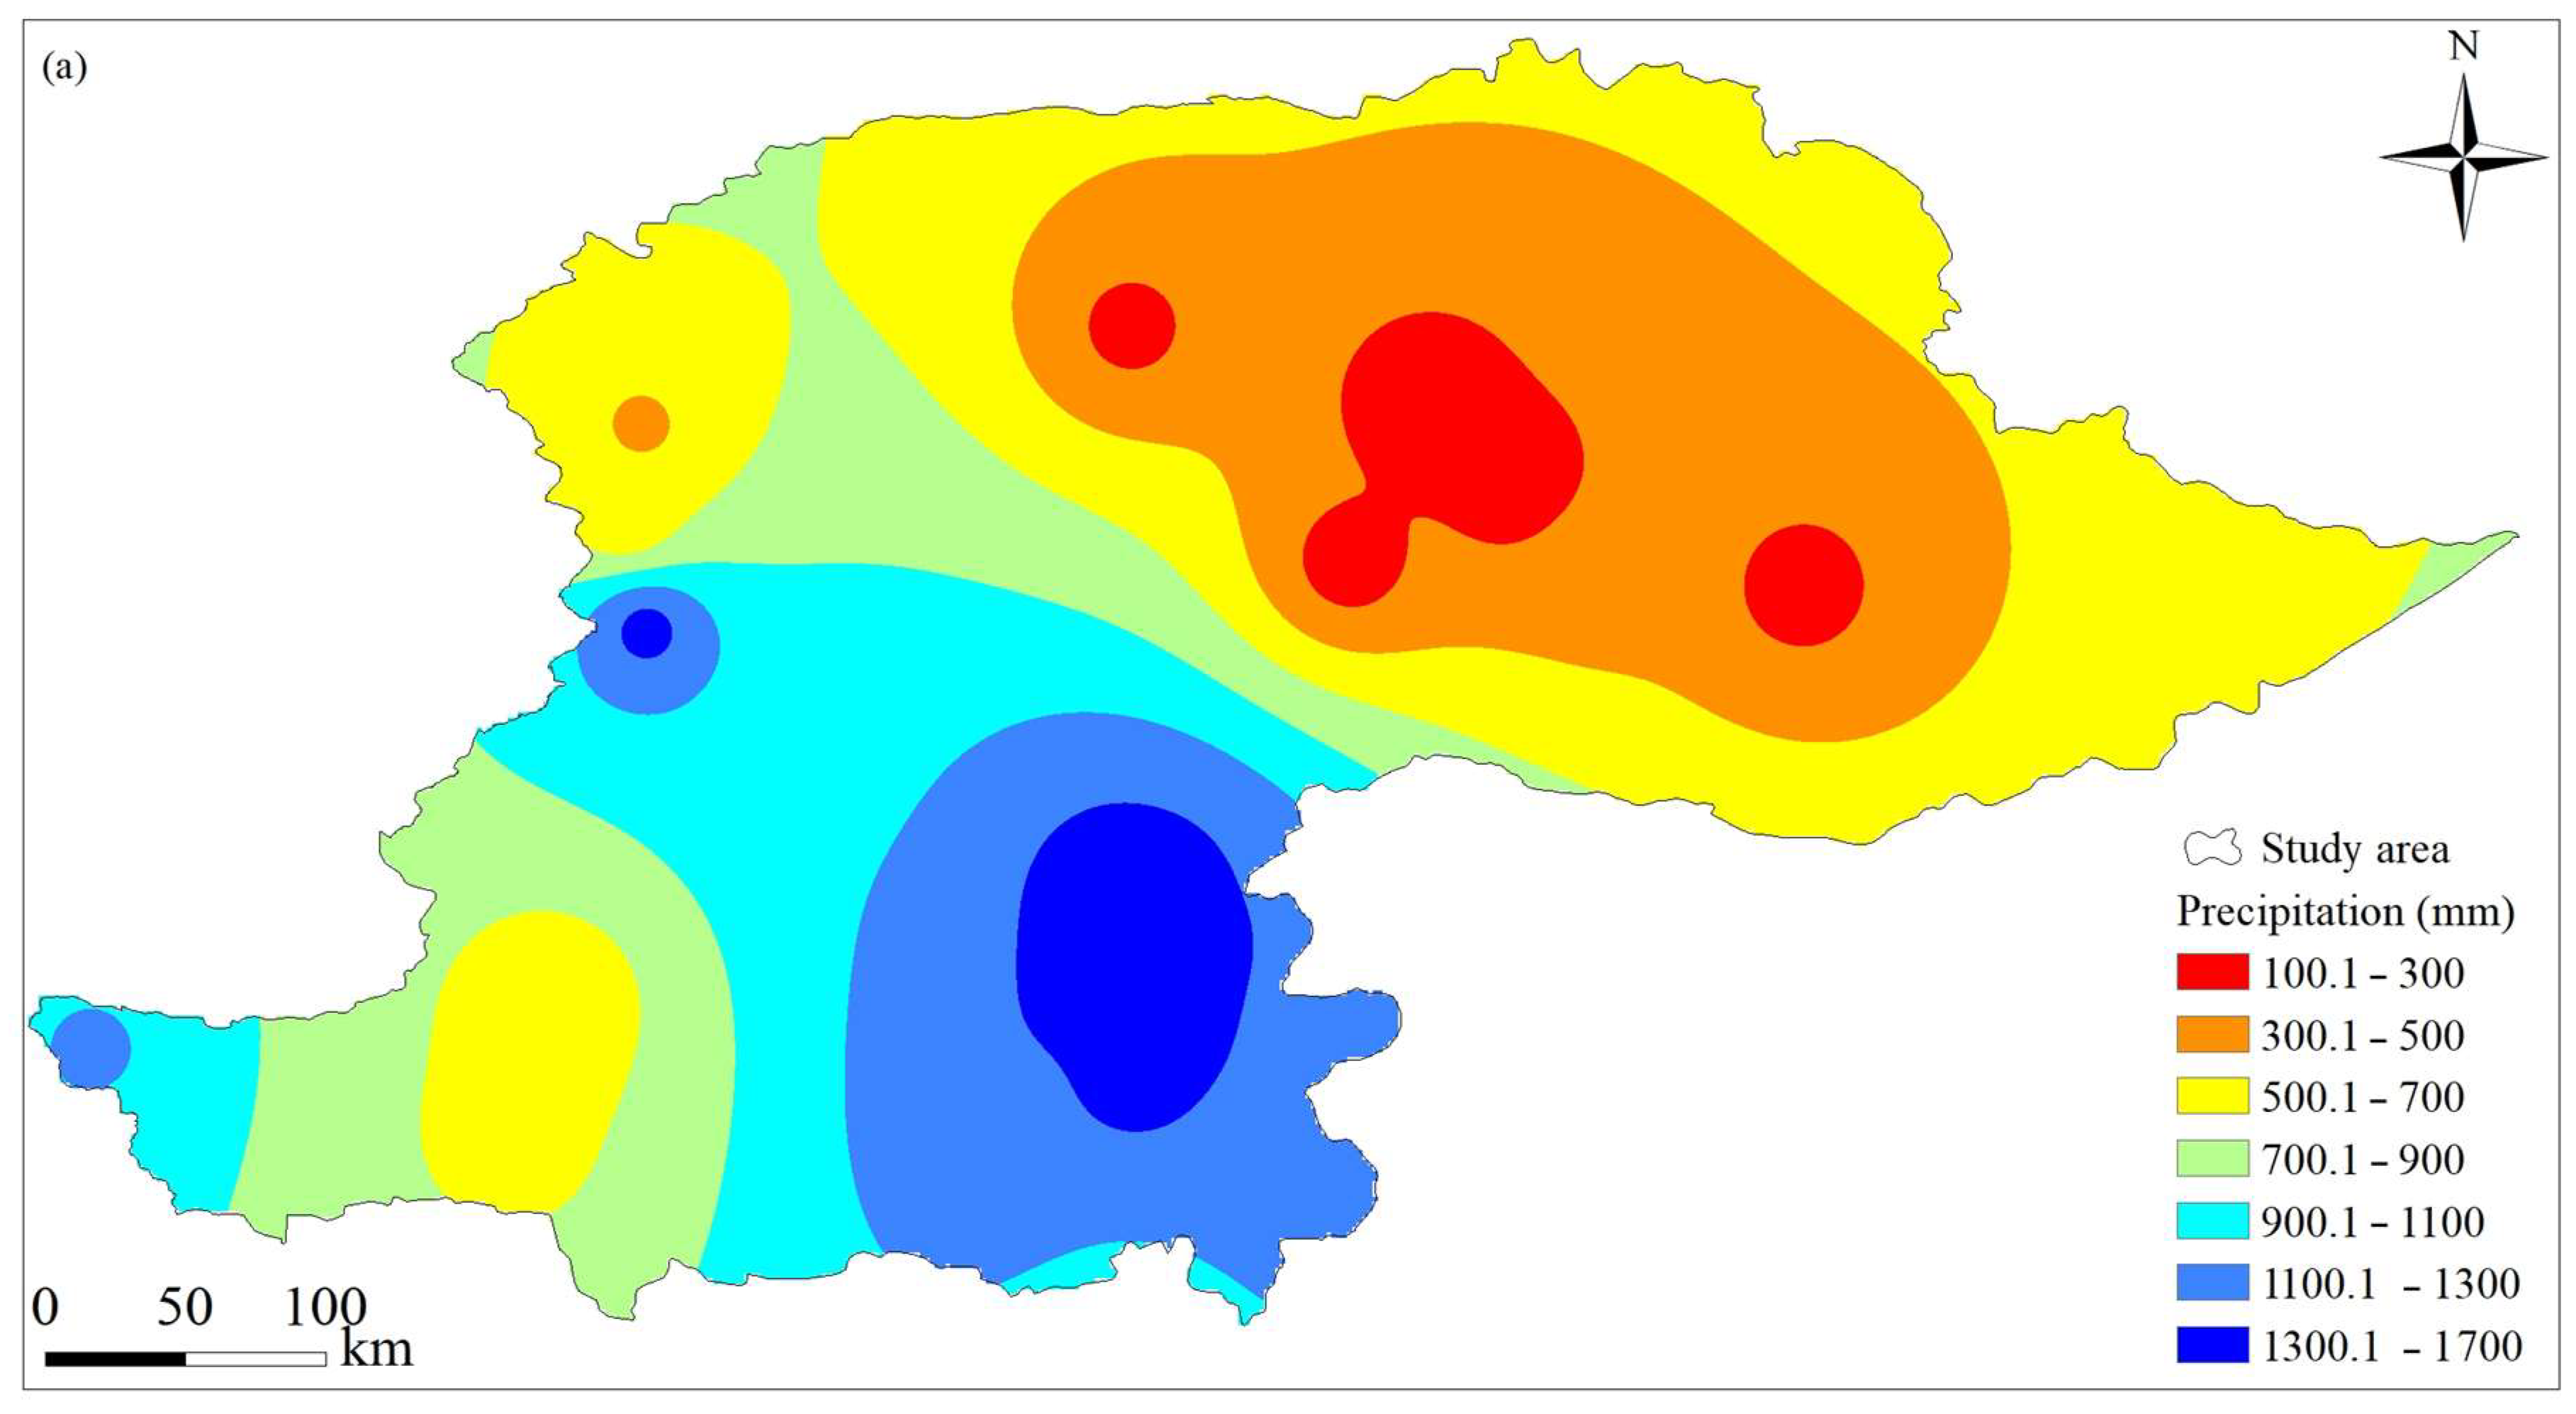
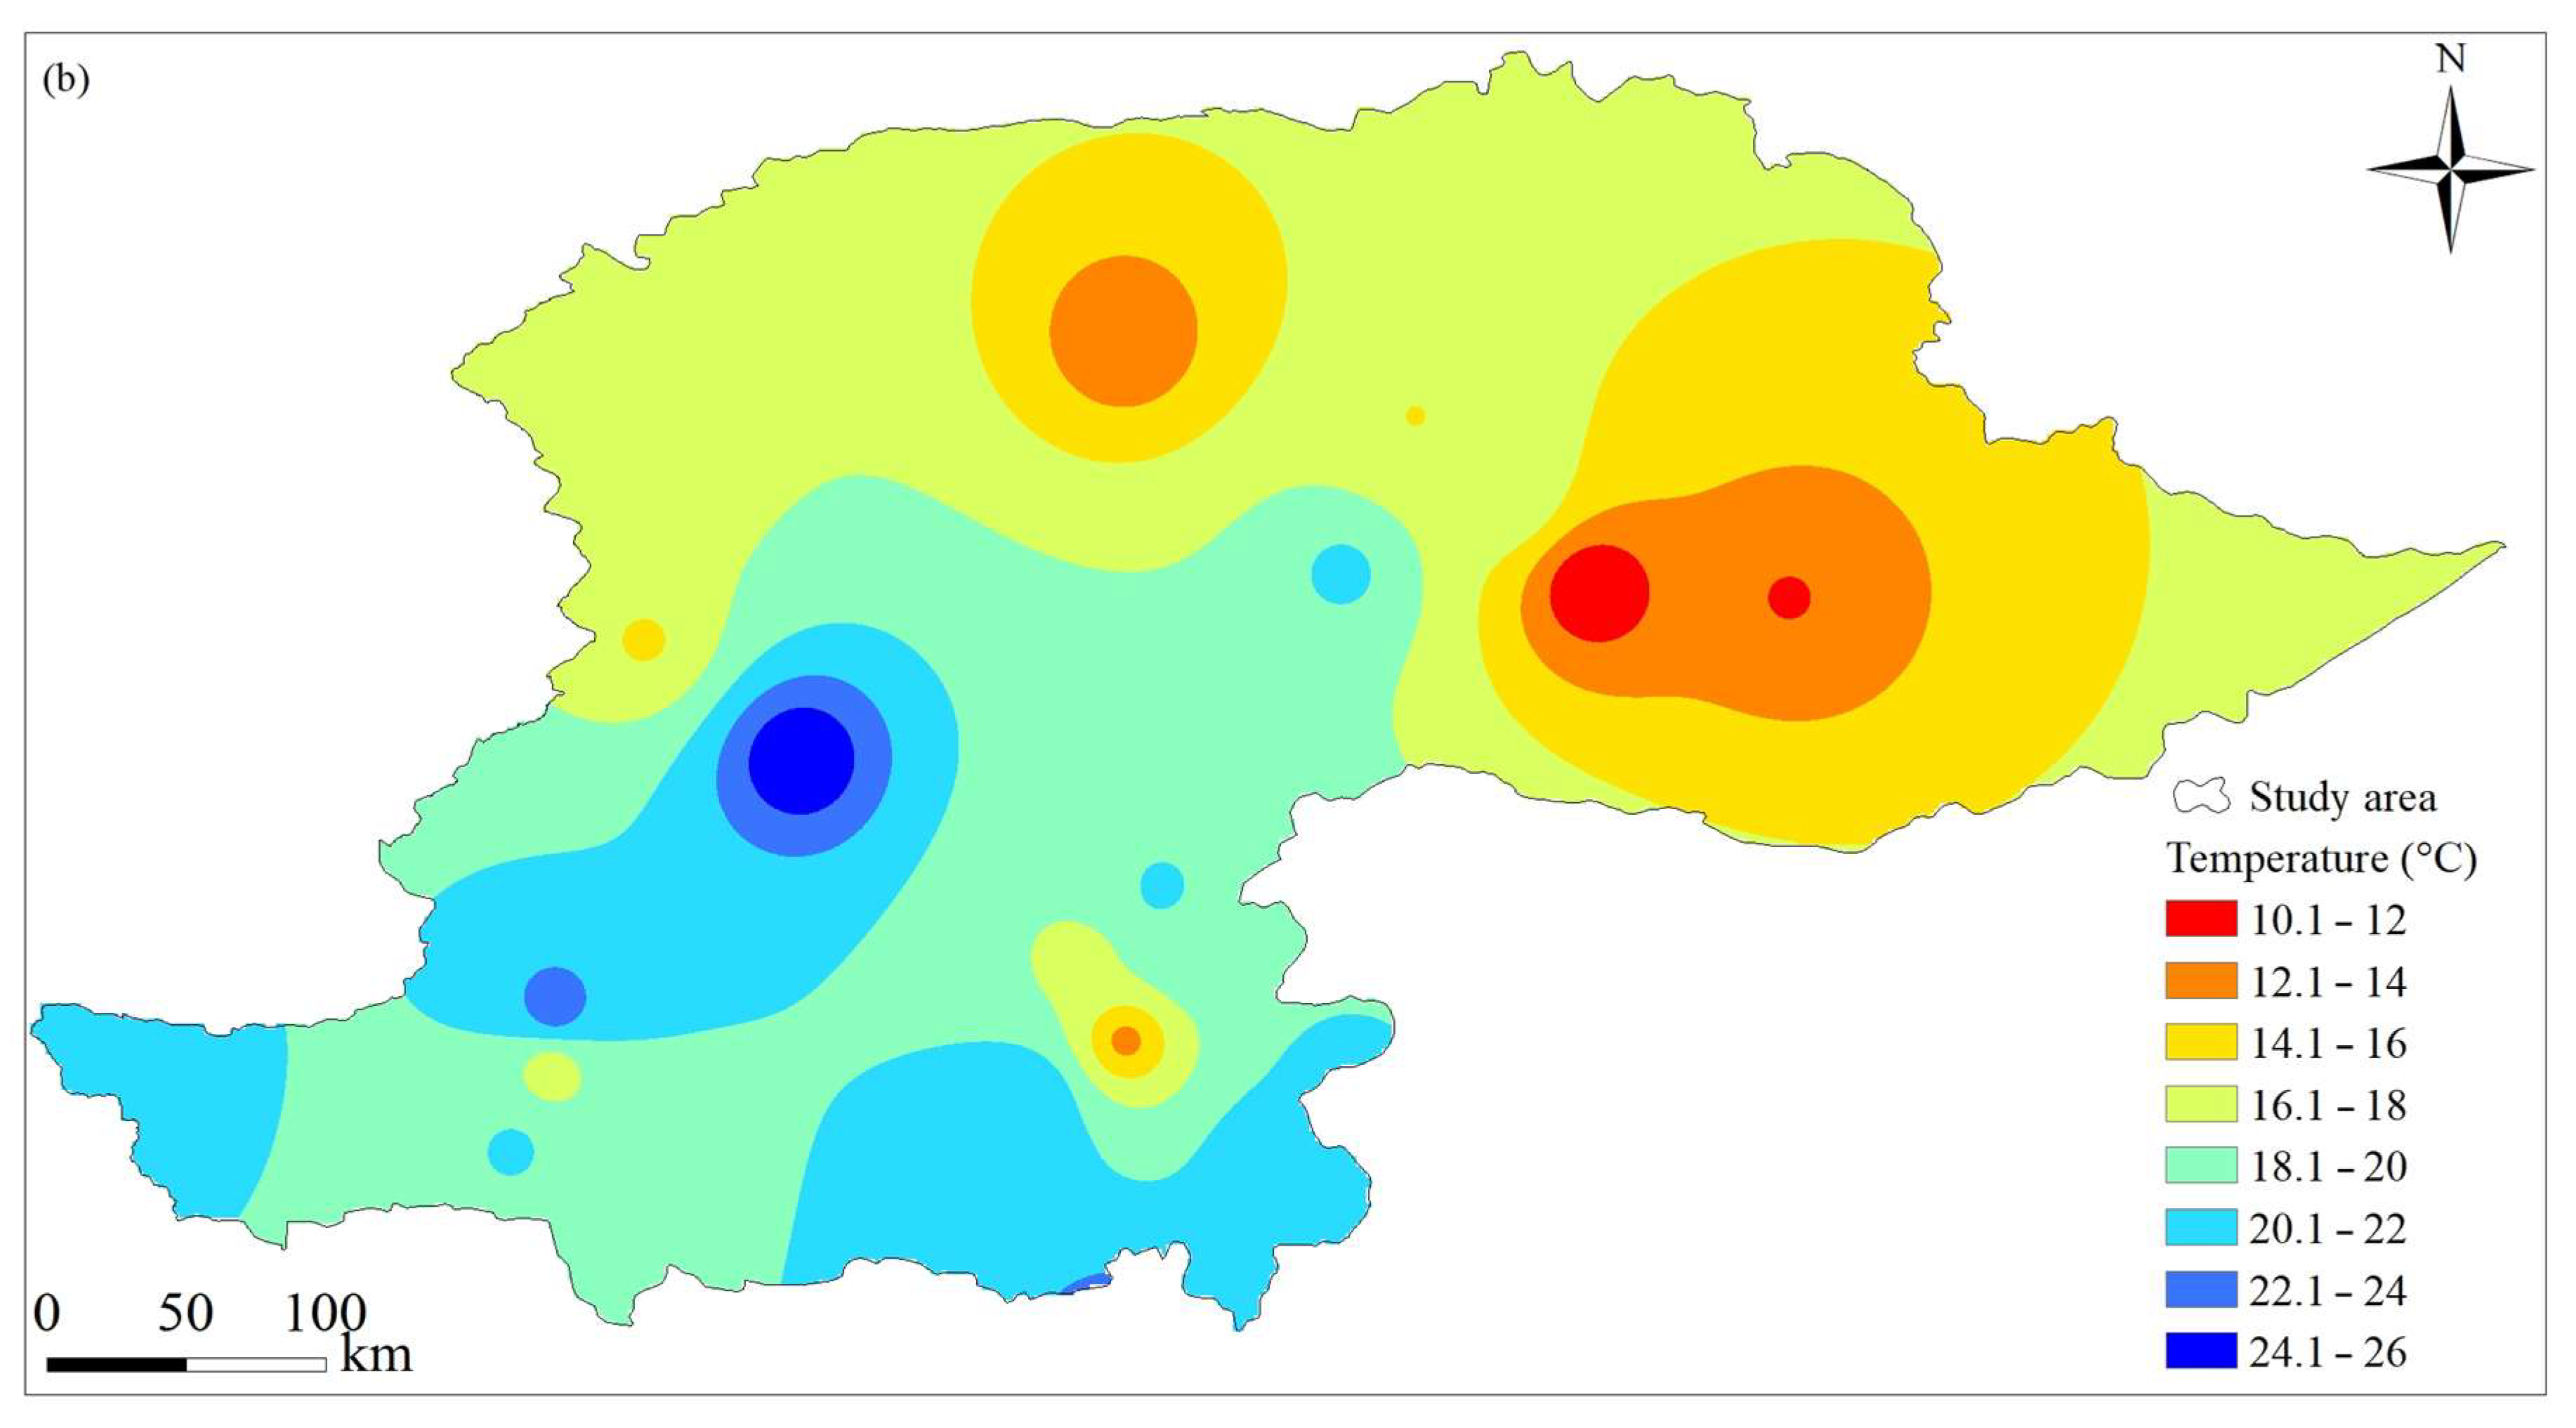
2.1. Study Area
2.2. Datasets
2.3. Trends Analysis of Extreme Temperature Indices
2.4. Extreme Temperature Indices
3. Results
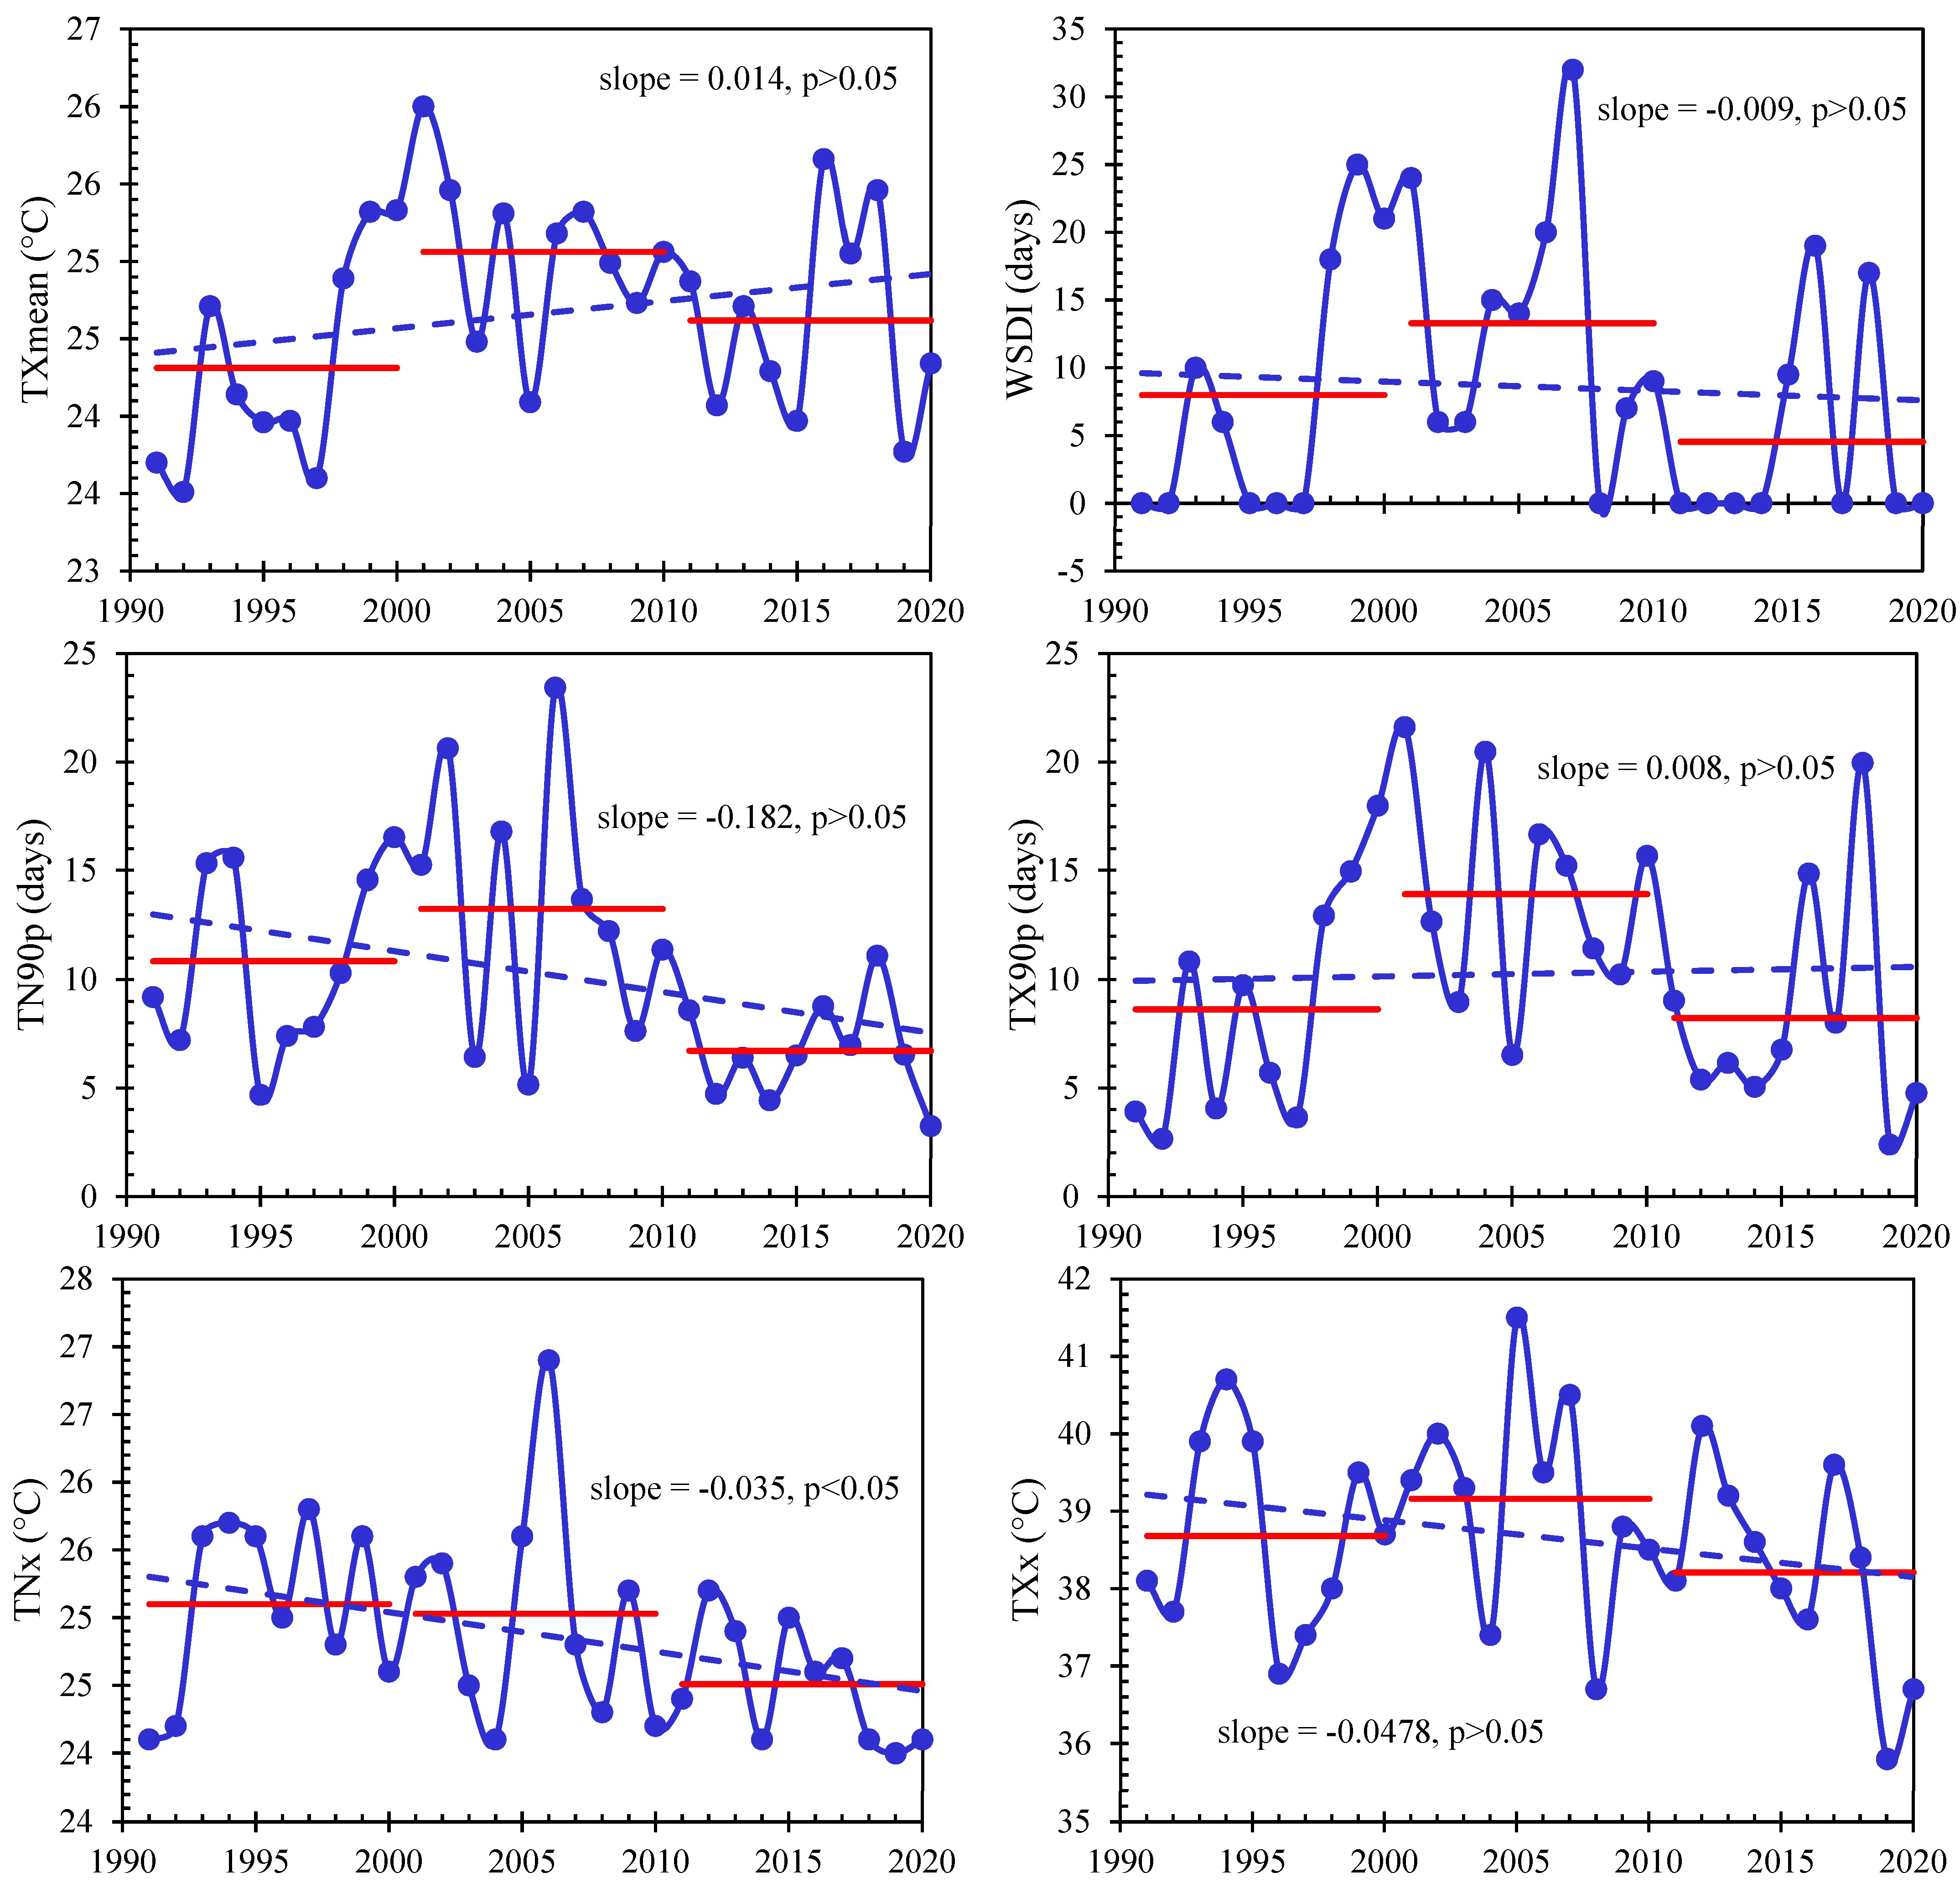
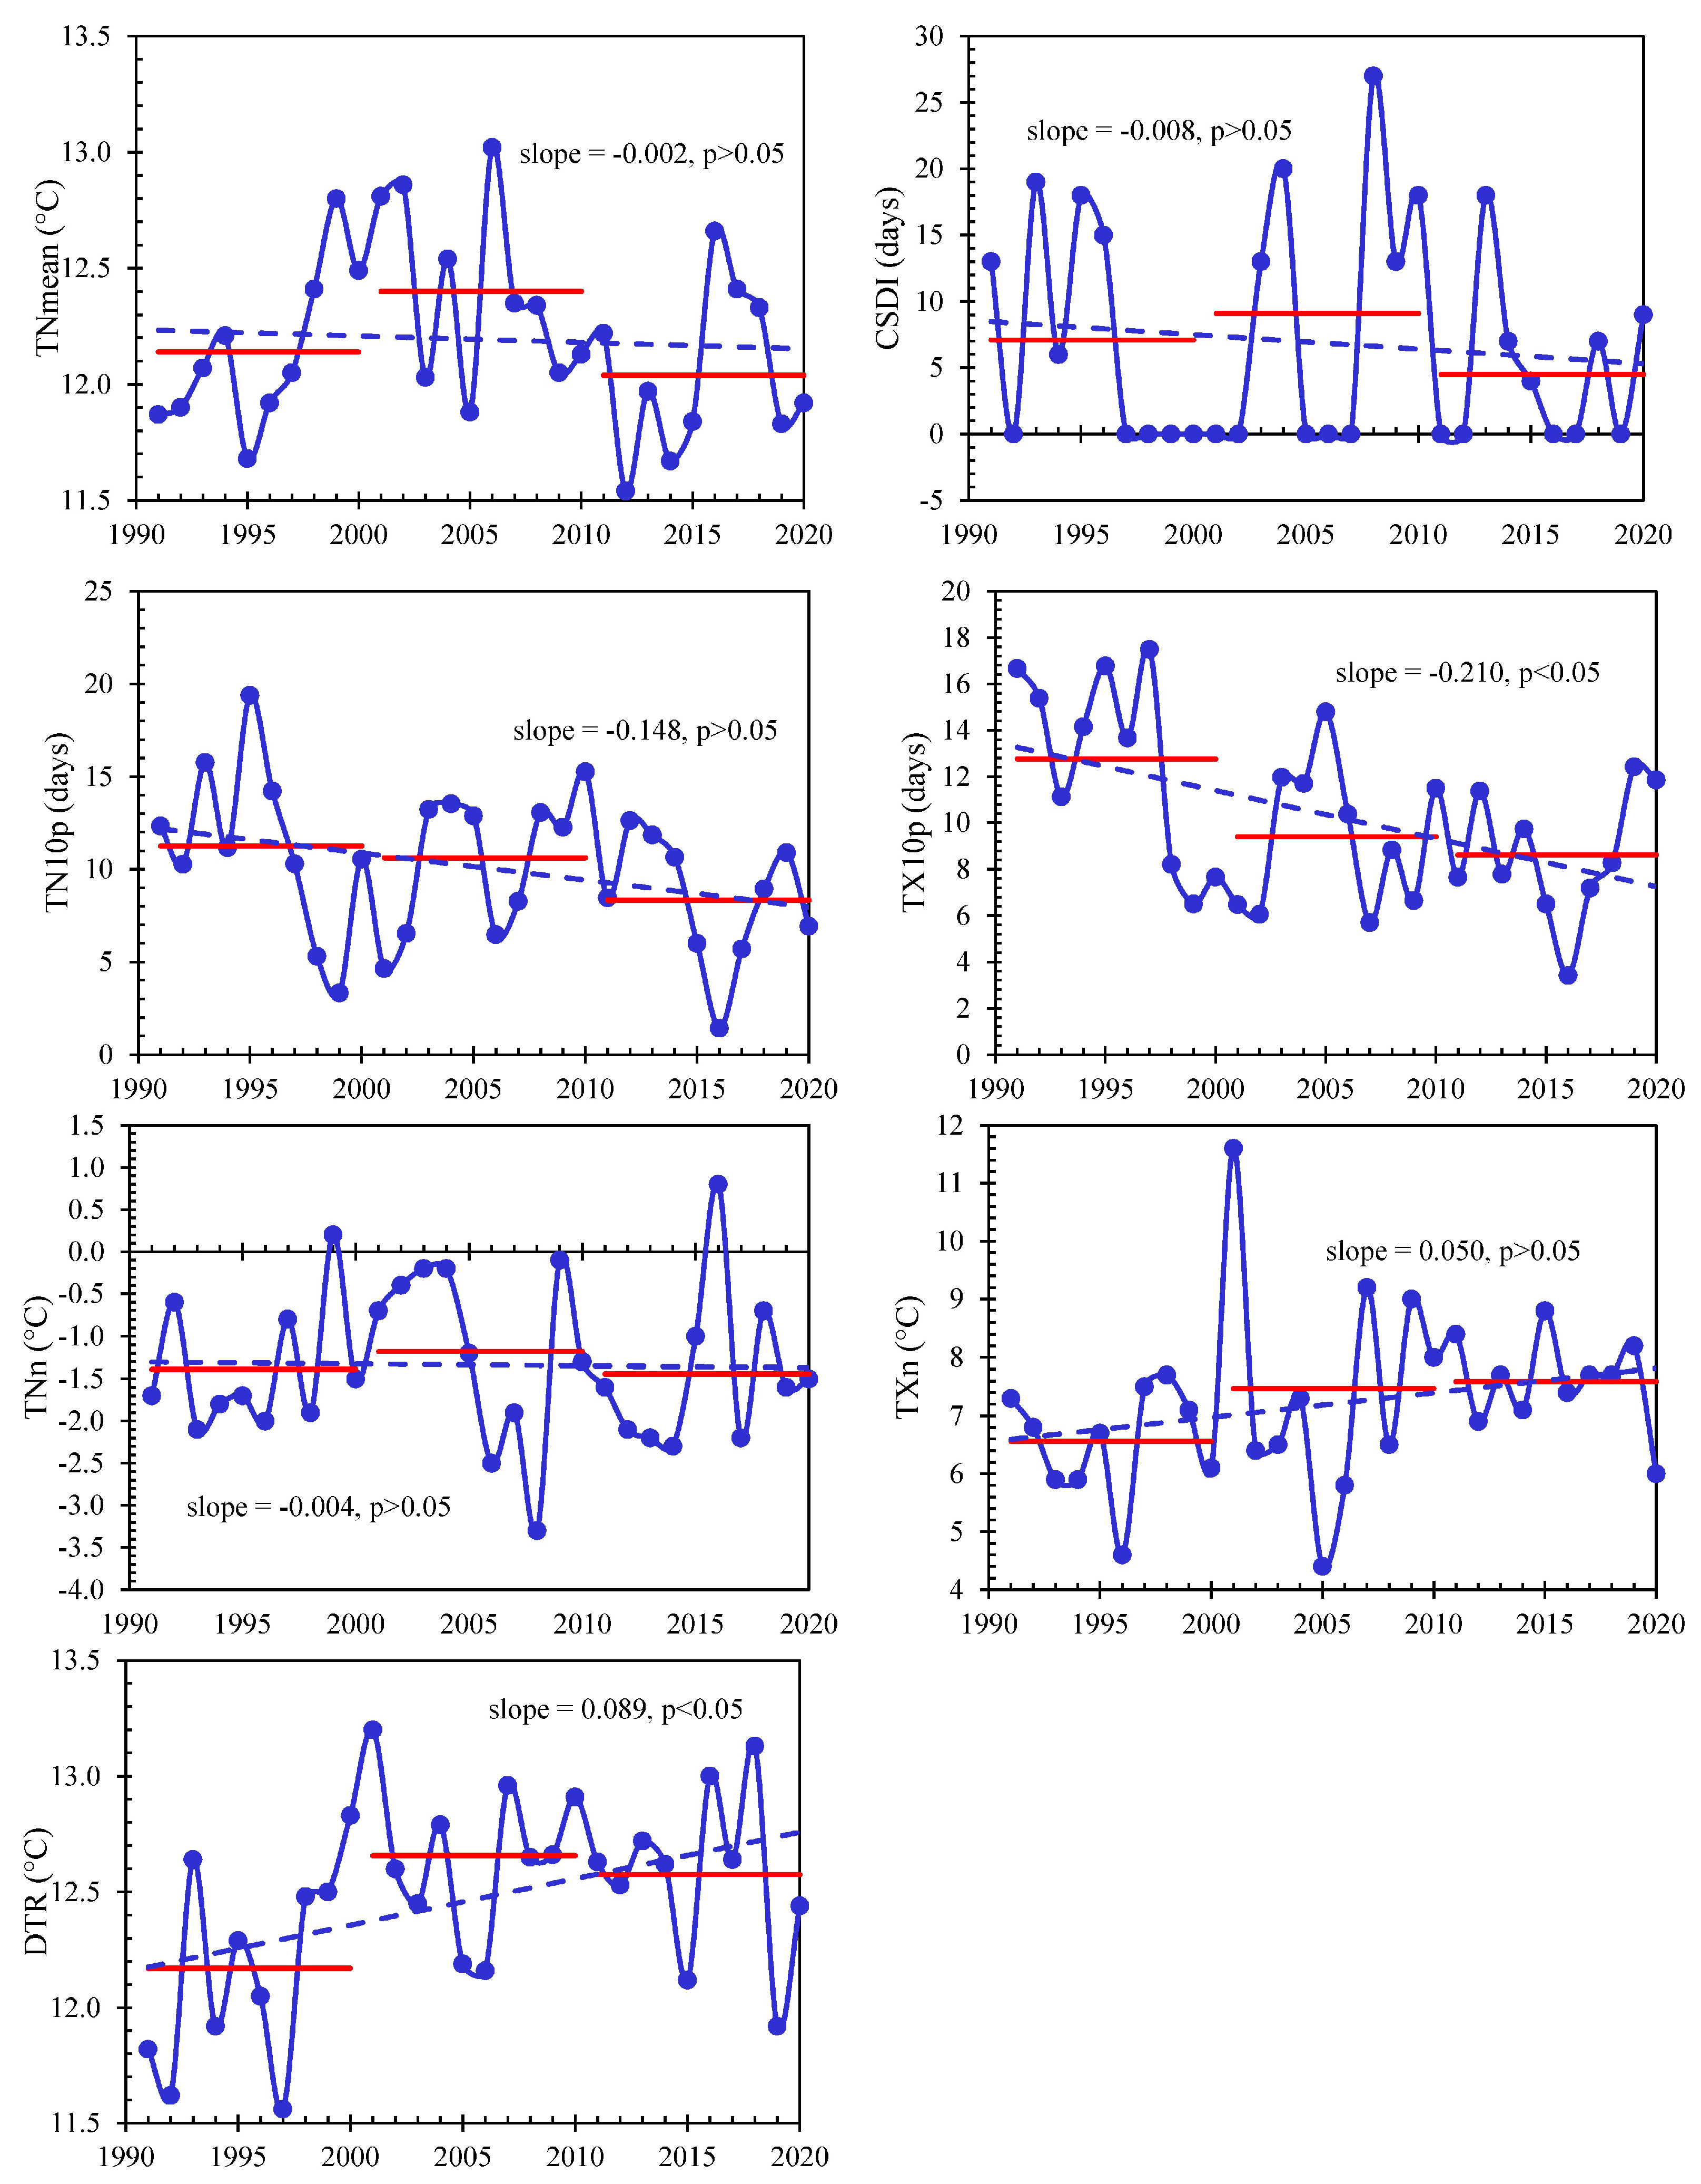
3.1. Temporal Variations in Extreme Temperature Indices
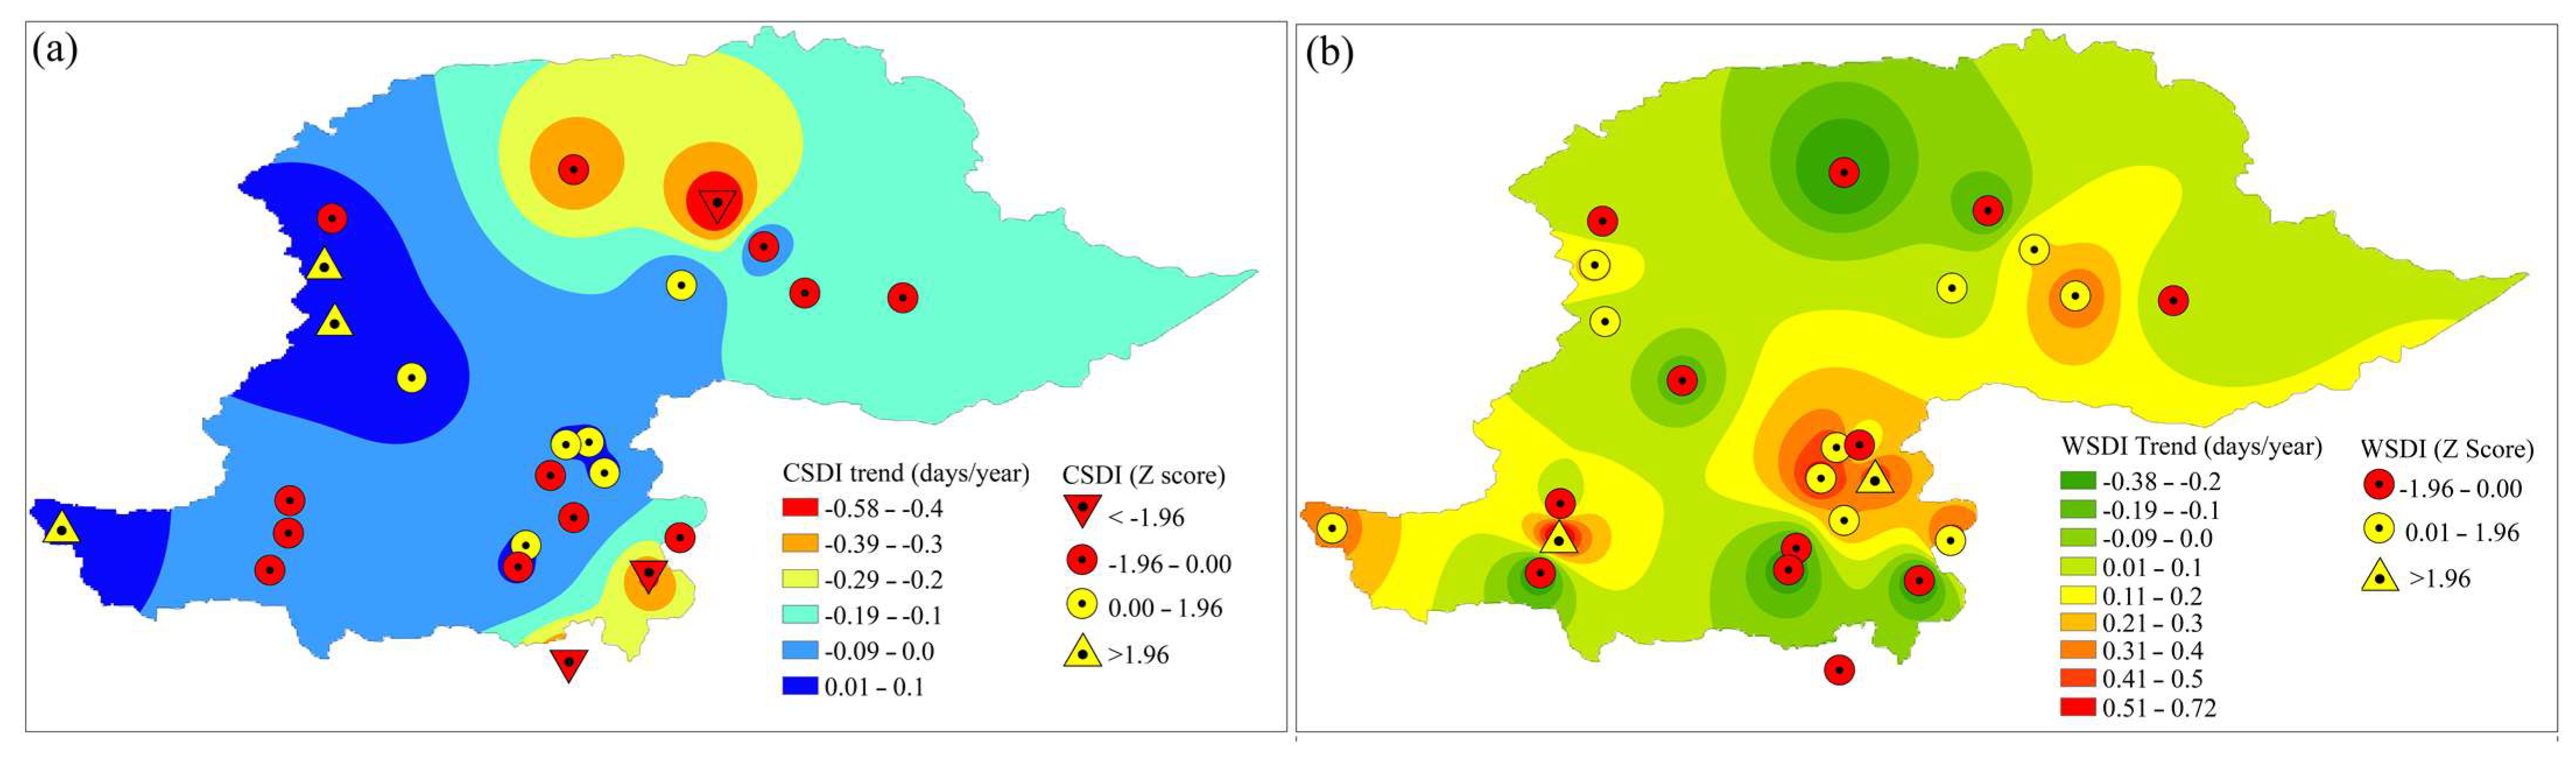
3.2. Spatial Changes in Duration-Based Extreme Temperature Indices
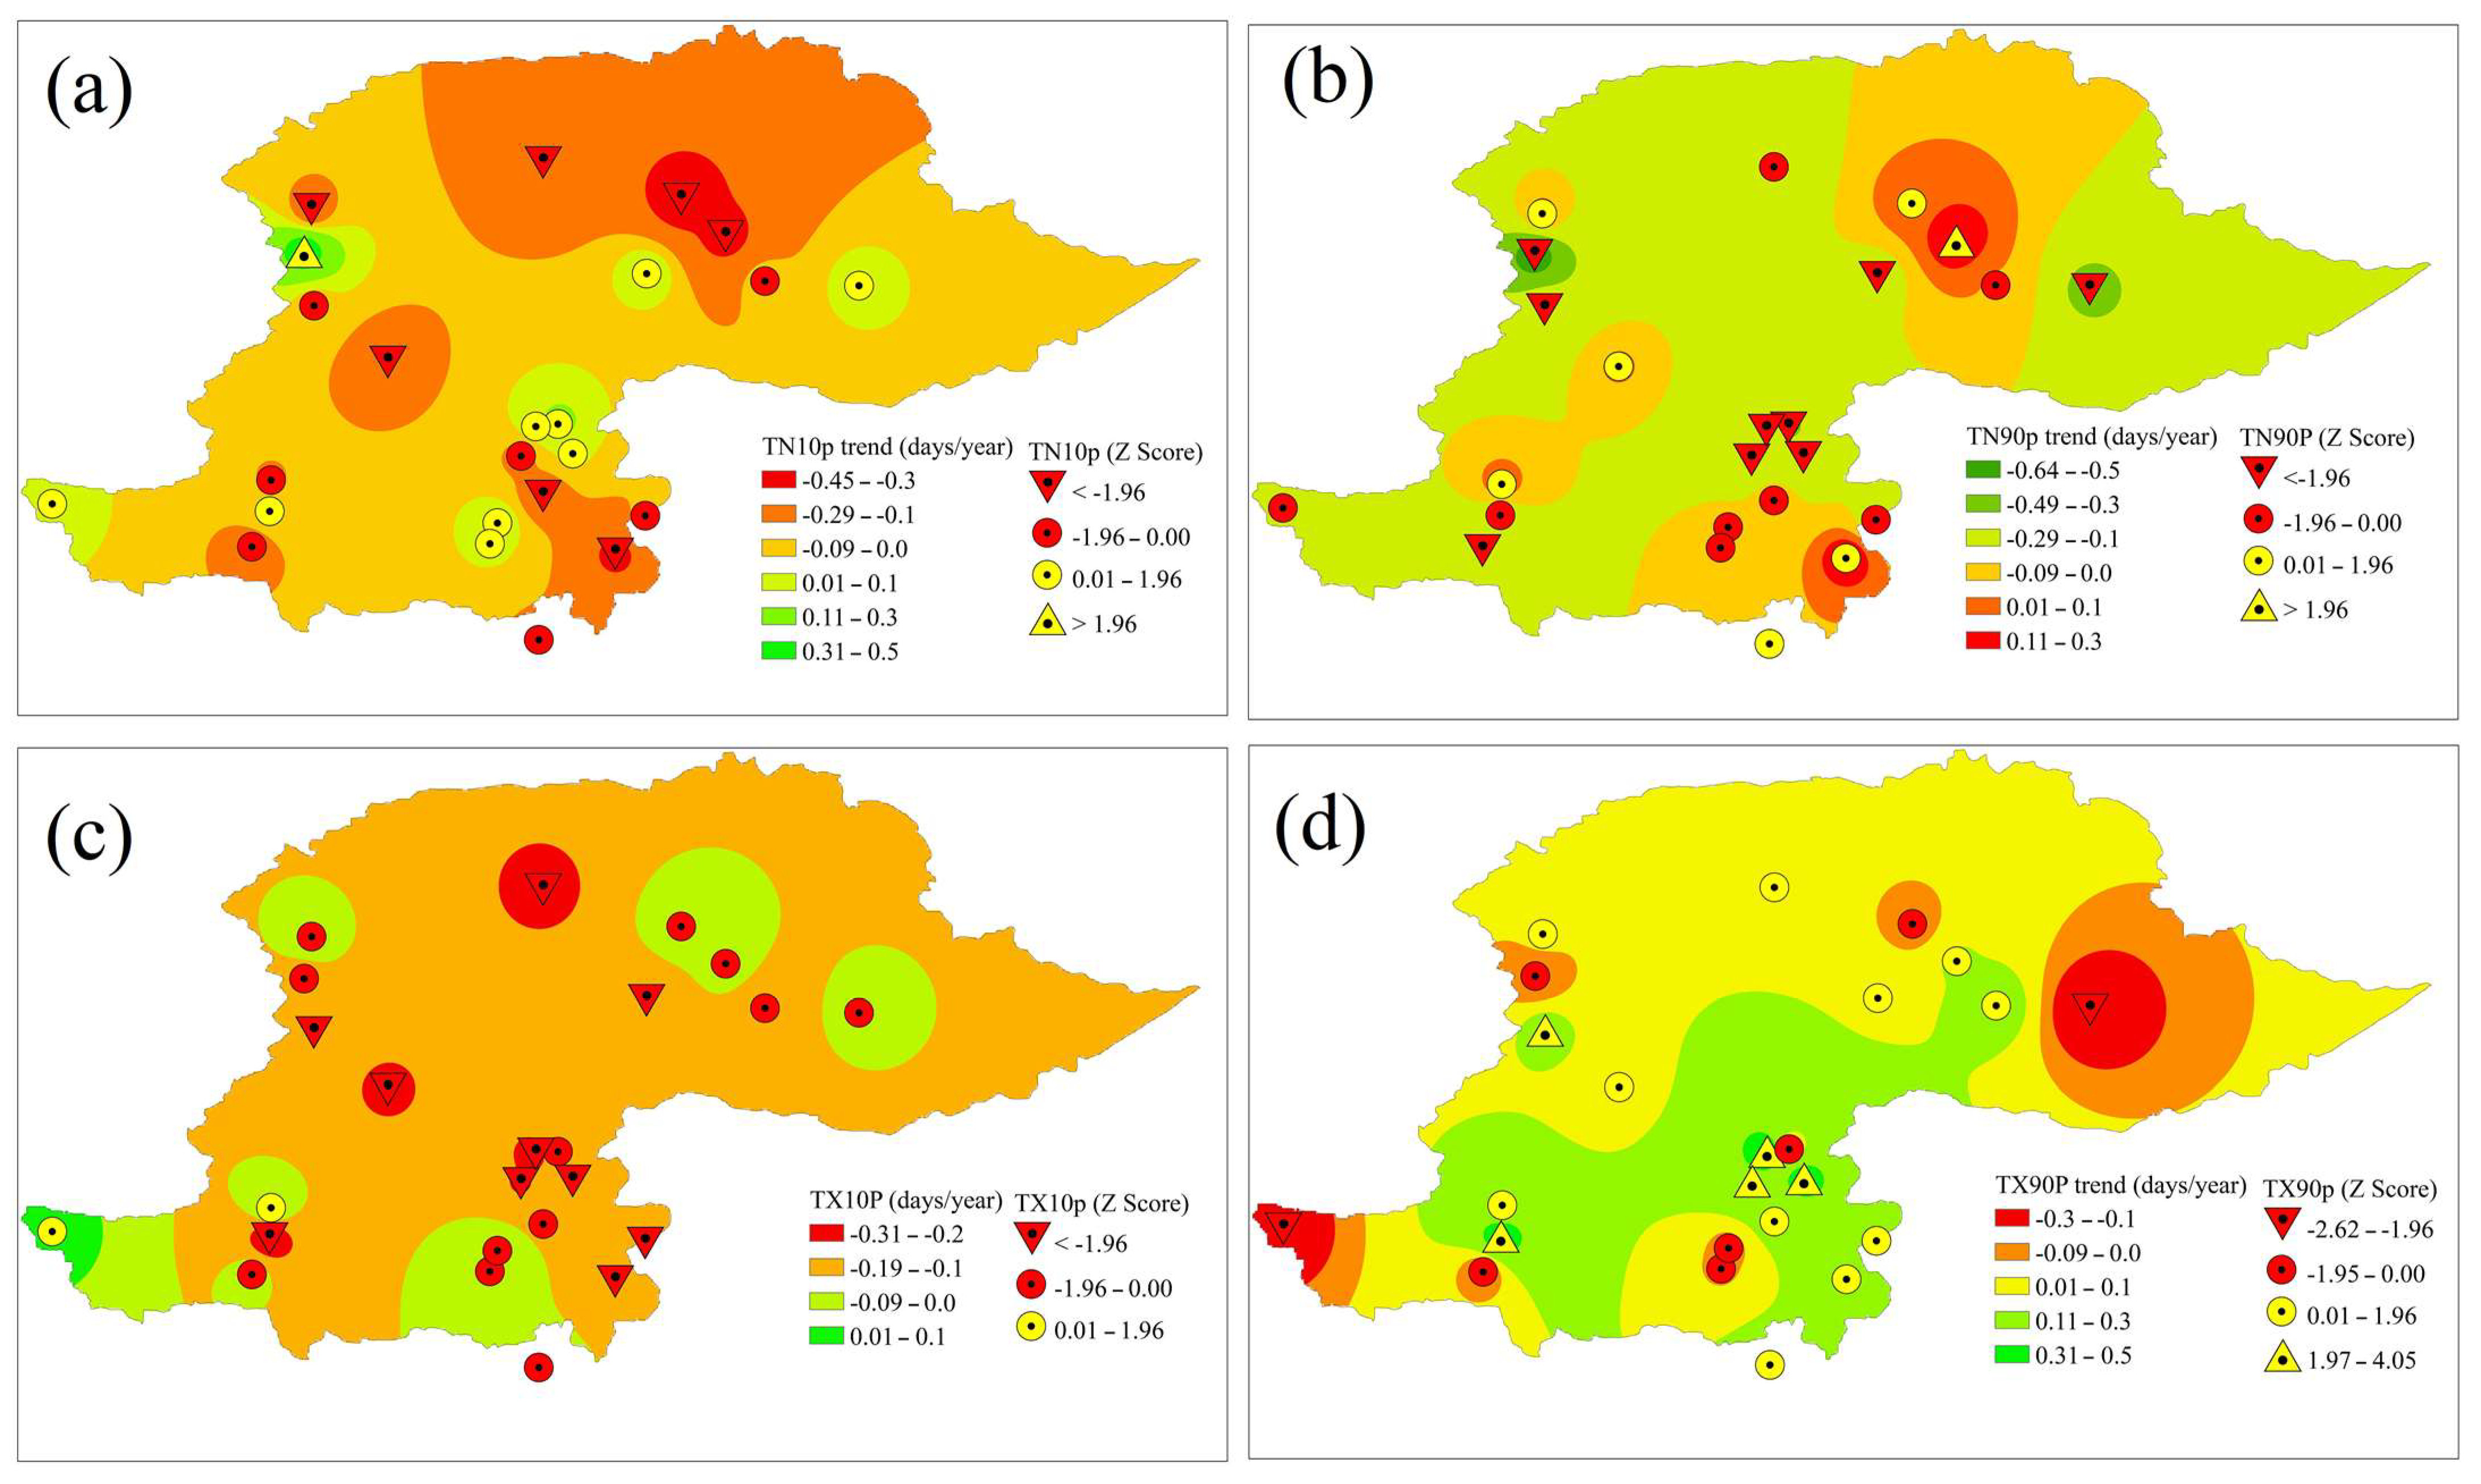
3.3. Spatial Changes in Percentile-Based Extreme Temperature Indices
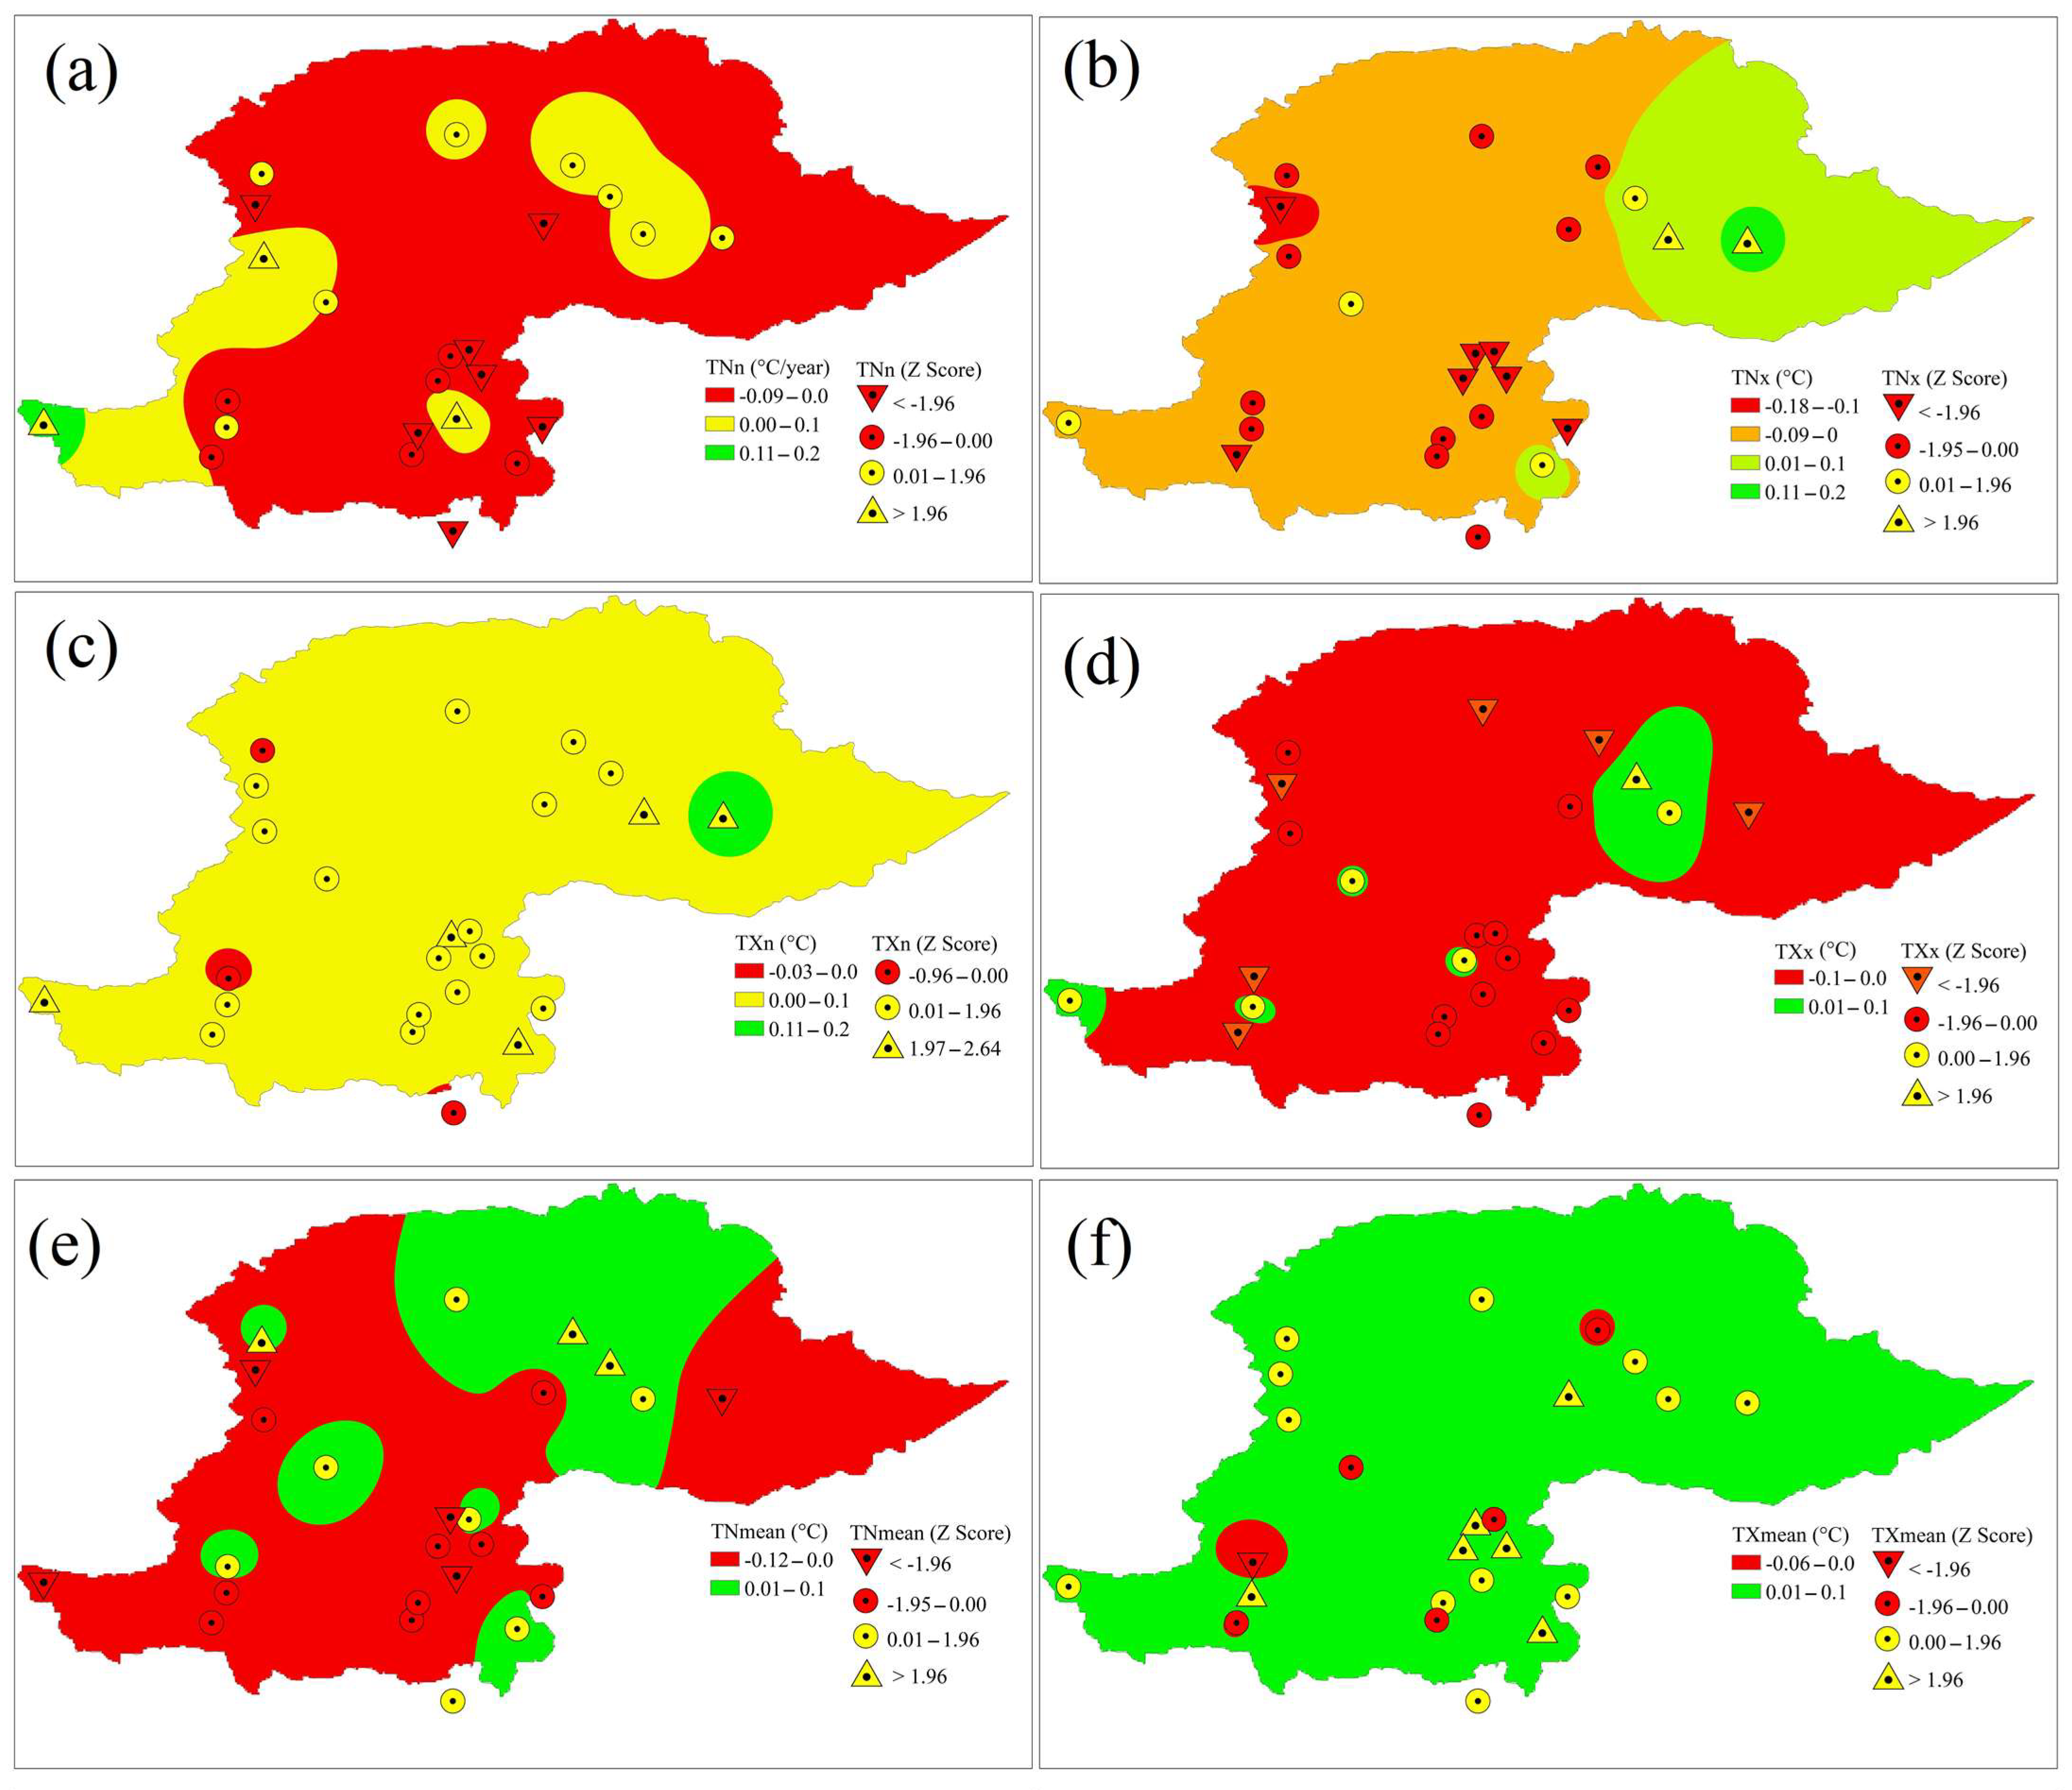
3.4. Spatial Changes in Absolute Extreme Temperature Indices
4. Discussion
5. Conclusions
- The number of hot days significantly increased in the study domain. Therefore, it was deduced that the hot weather events in northern Pakistan have become more frequent and severe in the past 30 years.
- The annual maximum value of minimum temperature was significantly decreased in the study area during the past three decades.
- The difference between the maximum temperature and minimum temperature was significantly increased in the northern highlands of Pakistan during 1991–2020.
- Overall, a decreasing trend in the annual average number of cold days and cold nights was detected in the NHP.
- Only two hot indices (TXmean and TX90p) showed increasing tendencies, although their trends were not statistically significant.
- The decadal averages of all the hot indices, except for TNx, were highest in the second decade (2001–2010) and consistently lowest in the last decade (2011–2020).
- Most of the stations installed in the study domain demonstrated a decreasing trend in the level of heatwave intensity, which is reflected by the TXx index.
- The duration and frequency of cold spells increased at the Dir, Drosh, and Para Chinar locations but decreased in the central and southern parts of the study domain. These changes might be attributed to changes in large-scale atmospheric circulation patterns.
- Most of the locations in the NHP indicated an increase in the number of days with below-average temperatures. Nevertheless, there were indications of a decrease in cold weather in some areas.
Author Contributions
Funding
Institutional Review Board Statement
Informed Consent Statement
Data Availability Statement
Acknowledgments
Conflicts of Interest
References
- Intergovernmental Panel on Climate Change. Climate Change 2021: The Physical Science Basis: Summary for Policymakers Working Group I Contribution to the Sixth Assessment Report of the Intergovernmental Panel on Climate Change; IPCC: Geneva, Switzerland, 2021; ISBN 9789291691586. [Google Scholar]
- Ghanim, A.A.J.; Anjum, M.N.; Rasool, G.; Saifullah; Irfan, M.; Rahman, S.; Mursal, S.N.F.; Niazi, U.M. Assessing Spatiotemporal Trends of Total and Extreme Precipitation in a Subtropical Highland Region: A Climate Perspective. PLoS ONE 2023, 18, e0289570. [Google Scholar] [CrossRef] [PubMed]
- Abbas, S.; Kousar, S.; Khan, M.S. The Role of Climate Change in Food Security; Empirical Evidence over Punjab Regions, Pakistan. Environ. Sci. Pollut. Res. 2022, 29, 53718–53736. [Google Scholar] [CrossRef] [PubMed]
- Goddard, L.; Gershunov, A. Guidelines on Analysis of Extremes in a Changing Climate in Support of Informed Decisions for Adaptation; World Meteorological Organization: Geneva, Switzerland, 2009; WMO-TD No. 1–55; Available online: https://library.wmo.int/index.php?lvl=notice_display&id=138 (accessed on 2 January 2023).
- Anjum, M.N.; Ghanim, A.A.J.; Farid, H.U.; Zaman, M.; Niazi, U.M.; Rahman, S.; Alsaiari, M.A.; Irfan, M. Assessment of Climate Change and Its Impacts on the Flows of a Subtropical River Basin in the Hindu-Kush Mountain, South Asia. Pure Appl. Geophys. 2022, 179, 3841–3857. [Google Scholar] [CrossRef]
- Tahir, A.A.; Chevallier, P.; Arnaud, Y.; Ashraf, M.; Tousif, M. Snow Cover Trend and Hydrological Characteristics of the Astore River Basin (Western Himalayas) and Its Comparison to the Hunza Basin (Karakoram Region). Sci. Total Environ. 2015, 505, 748–761. [Google Scholar] [CrossRef]
- Muhammad Qasim, S.K. Hydro-Meteorological Characteristics of Indus River Basin at Extreme North of Pakistan. J. Earth Sci. Clim. Chang. 2014, 5, 170. [Google Scholar] [CrossRef]
- Xu, D.; Liu, D.; Yan, Z.; Ren, S.; Xu, Q. Spatiotemporal Variation Characteristics of Precipitation in the Huaihe River Basin, China, as a Result of Climate Change. Water 2023, 15, 181. [Google Scholar] [CrossRef]
- Abbas, S.; Yaseen, M.; Latif, Y.; Waseem, M.; Muhammad, S.; Leta, M.K.; Sher, S.; Imran, M.A.; Adnan, M.; Khan, T.H. Spatiotemporal Analysis of Climatic Extremes over the Upper Indus Basin, Pakistan. Water 2022, 14, 1718. [Google Scholar] [CrossRef]
- Khan, F.; Ali, S.; Mayer, C.; Ullah, H.; Muhammad, S. Climate Change and Spatio-Temporal Trend Analysis of Climate Extremes in the Homogeneous Climatic Zones of Pakistan during 1962–2019. PLoS ONE 2022, 17, e0271626. [Google Scholar] [CrossRef]
- Anjum, M.N.; Ding, Y.; Shangguan, D.; Liu, J.; Ahmad, I.; Ijaz, M.W.; Khan, M.I. Quantification of Spatial Temporal Variability of Snow Cover and Hydro-Climatic Variables Based on Multi-Source Remote Sensing Data in the Swat Watershed, Hindukush Mountains, Pakistan. Meteorol. Atmos. Phys. 2018, 131, 467–486. [Google Scholar] [CrossRef]
- Waseem, M.; Ajmal, M.; Ahmad, I.; Khan, N.M.; Azam, M.; Sarwar, M.K. Projected Drought Pattern under Climate Change Scenario Using Multivariate Analysis. Arab. J. Geosci. 2021, 14, 544. [Google Scholar] [CrossRef]
- Aslam, A.Q.; Ahmad, S.R.; Ahmad, I.; Hussain, Y.; Hussain, M.S. Vulnerability and Impact Assessment of Extreme Climatic Event: A Case Study of Southern Punjab, Pakistan. Sci. Total Environ. 2017, 580, 468–481. [Google Scholar] [CrossRef] [PubMed]
- Ali, S.; Liu, Y.; Ishaq, M.; Shah, T.; Abdullah; Ilyas, A.; Din, I. Climate Change and Its Impact on the Yield of Major Food Crops: Evidence from Pakistan. Foods 2017, 6, 39. [Google Scholar] [CrossRef] [PubMed]
- Bolch, T.; Kulkarni, A.; Kääb, A.; Huggel, C.; Paul, F.; Cogley, J.G.; Frey, H.; Kargel, J.S.; Fujita, K.; Scheel, M.; et al. The State and Fate of Himalayan Glaciers. Science 2012, 336, 310–314. [Google Scholar] [CrossRef] [PubMed]
- Liu, Y.; Hu, X.; Wu, F.; Chen, B.; Liu, Y.; Yang, S.; Weng, Z. Quantitative Analysis of Climate Change Impact on Zhangye City’s Economy Based on the Perspective of Surface Runoff. Ecol. Indic. 2019, 105, 645–654. [Google Scholar] [CrossRef]
- Yang, T.; Li, Q.; Chen, X.; De Maeyer, P.; Yan, X.; Liu, Y.; Zhao, T.; Li, L. Spatiotemporal Variability of the Precipitation Concentration and Diversity in Central Asia. Atmos. Res. 2020, 241, 104954. [Google Scholar] [CrossRef]
- Burić, D.; Doderović, M. Trend of Percentile Climate Indices in Montenegro in the Period 1961–2020. Sustainability 2022, 14, 12519. [Google Scholar] [CrossRef]
- Chen, A.; He, X.; Guan, H.; Cai, Y. Trends and Periodicity of Daily Temperature and Precipitation Extremes during 1960–2013 in Hunan Province, Central South China. Theor. Appl. Climatol. 2018, 132, 71–88. [Google Scholar] [CrossRef]
- Toll, V.; Post, P. Daily Temperature and Precipitation Extremes in the Baltic Sea Region Derived from the BaltAn65+ Reanalysis. Theor. Appl. Climatol. 2018, 132, 647–662. [Google Scholar] [CrossRef]
- Meseguer-Ruiz, O.; Ponce-Philimon, P.I.; Quispe-Jofré, A.S.; Guijarro, J.A.; Sarricolea, P. Spatial Behaviour of Daily Observed Extreme Temperatures in Northern Chile (1966–2015): Data Quality, Warming Trends, and Its Orographic and Latitudinal Effects. Stoch. Environ. Res. Risk Assess. 2018, 32, 3503–3523. [Google Scholar] [CrossRef]
- Insaf, T.Z.; Lin, S.; Sheridan, S.C. Climate Trends in Indices for Temperature and Precipitation across New York State, 1948–2008. Air Qual. Atmos. Health 2013, 6, 247–257. [Google Scholar] [CrossRef]
- Caloiero, T. Trend of Monthly Temperature and Daily Extreme Temperature during 1951–2012 in New Zealand. Theor. Appl. Climatol. 2017, 129, 111–127. [Google Scholar] [CrossRef]
- Touré Halimatou, A.; Kalifa, T.; Kyei-Baffour, N. Assessment of Changing Trends of Daily Precipitation and Temperature Extremes in Bamako and Ségou in Mali from 1961–2014. Weather Clim. Extrem. 2017, 18, 8–16. [Google Scholar] [CrossRef]
- Croitoru, A.E.; Piticar, A. Changes in Daily Extreme Temperatures in the Extra-Carpathians Regions of Romania. Int. J. Climatol. 2013, 33, 1987–2001. [Google Scholar] [CrossRef]
- Chapagain, D.; Dhaubanjar, S.; Bharati, L. Unpacking Future Climate Extremes and Their Sectoral Implications in Western Nepal. Clim. Chang. 2021, 168, 8. [Google Scholar] [CrossRef]
- Salman, S.A.; Shahid, S.; Ismail, T.; Ahmed, K.; Chung, E.S.; Wang, X.J. Characteristics of Annual and Seasonal Trends of Rainfall and Temperature in Iraq. Asia-Pac. J. Atmos. Sci. 2019, 55, 429–438. [Google Scholar] [CrossRef]
- Khan, A.J.; Koch, M.; Tahir, A.A. Impacts of Climate Change on Thewater Availability, Seasonality and Extremes in the Upper Indus Basin (UIB). Sustainability 2020, 12, 1283. [Google Scholar] [CrossRef]
- Du, H.; Xia, J.; Yan, Y.; Lu, Y.; Li, J. Spatiotemporal Variations of Extreme Precipitation in Wuling Mountain Area (China) and Their Connection to Potential Driving Factors. Sustainability 2022, 14, 8312. [Google Scholar] [CrossRef]
- Zhang, X.; Zwiers, F.W.; Li, G.; Wan, H.; Cannon, A.J. Complexity in Estimating Past and Future Extreme Short-Duration Rainfall. Nat. Geosci. 2017, 10, 255–259. [Google Scholar] [CrossRef]
- Anjum, M.N.; Irfan, M.; Waseem, M.; Leta, M.K.; Niazi, U.M.; Rahman, S.U.; Ghanim, A.; Mukhtar, M.A.; Nadeem, M.U. Assessment of PERSIANN-CCS, PERSIANN-CDR, SM2RAIN-ASCAT, and CHIRPS-2.0 Rainfall Products over a Semi-Arid Subtropical Climatic Region. Water 2022, 14, 147. [Google Scholar] [CrossRef]
- Wu, S.; Hu, Z.; Wang, Z.; Cao, S.; Yang, Y.; Qu, X.; Zhao, W. Spatiotemporal Variations in Extreme Precipitation on the Middle and Lower Reaches of the Yangtze River Basin (1970–2018). Quat. Int. 2021, 592, 80–96. [Google Scholar] [CrossRef]
- Zhang, X.; Alexander, L.; Hegerl, G.C.; Jones, P.; Tank, A.K.; Peterson, T.C.; Trewin, B.; Zwiers, F.W. Indices for Monitoring Changes in Extremes Based on Daily Temperature and Precipitation Data. Wiley Interdiscip. Rev. Clim. Chang. 2011, 2, 851–870. [Google Scholar] [CrossRef]
- Alexander, L.V.; Zhang, X.; Peterson, T.C.; Caesar, J.; Gleason, B.; Klein Tank, A.M.G.; Haylock, M.; Collins, D.; Trewin, B.; Rahimzadeh, F.; et al. Global Observed Changes in Daily Climate Extremes of Temperature and Precipitation. J. Geophys. Res. Atmos. 2006, 111, D05109. [Google Scholar] [CrossRef]
- Hidalgo García, D.; Arco Díaz, J.; Martín Martín, A.; Gómez Cobos, E. Spatiotemporal Analysis of Urban Thermal Effects Caused by Heat Waves through Remote Sensing. Sustainability 2022, 14, 12262. [Google Scholar] [CrossRef]
- Saleem, F.; Zeng, X.; Hina, S.; Omer, A. Regional Changes in Extreme Temperature Records over Pakistan and Their Relation to Pacific Variability. Atmos. Res. 2021, 250, 105407. [Google Scholar] [CrossRef]
- Hussain, A.; Cao, J.; Hussain, I.; Begum, S.; Akhtar, M.; Wu, X.; Guan, Y.; Zhou, J. Observed Trends and Variability of Temperature and Precipitation and Their Global Teleconnections in the Upper Indus Basin, Hindukush-Karakoram-Himalaya. Atmosphere 2021, 12, 973. [Google Scholar] [CrossRef]
- Syed, A.; Liu, X.; Moniruzzaman, M.; Rousta, I.; Syed, W.; Zhang, J.; Olafsson, H. Assessment of Climate Variability among Seasonal Trends Using in Situ Measurements: A Case Study of Punjab, Pakistan. Atmosphere 2021, 12, 939. [Google Scholar] [CrossRef]
- Xiao, Z.; Duan, A.; Wang, Z. Atmospheric Heat Sinks over the Western Tibetan Plateau Associated with Snow Depth in Late Spring. Int. J. Climatol. 2019, 39, 5170–5180. [Google Scholar] [CrossRef]
- Yaseen, M.; Ahmad, I.; Guo, J.; Azam, M.I.; Latif, Y. Spatiotemporal Variability in the Hydrometeorological Time-Series over Upper Indus River Basin of Pakistan. Adv. Meteorol. 2020, 2020, 5852760. [Google Scholar] [CrossRef]


| Sr. No. | Weather Station | Longitude | Latitude | Altitude | Average Annual Temperature | Average Annual Precipitation |
|---|---|---|---|---|---|---|
| (dd) | (dd) | (m) | (°C) | (mm) | ||
| 1 | Astore | 74.90 | 35.37 | 2168 | 10.1 | 459.7 |
| 2 | Bagh | 74.09 | 33.78 | 2200 | 20.7 | 1165.6 |
| 3 | Balakot | 73.35 | 34.38 | 995.4 | 18.8 | 1475.0 |
| 4 | Bunji | 74.63 | 35.67 | 1470 | 17.7 | 160.7 |
| 5 | Cherrat | 71.55 | 33.81 | 1497.8 | 16.9 | 663.2 |
| 6 | Chilas | 74.10 | 35.42 | 1251 | 20.4 | 196.8 |
| 7 | Chitral | 71.83 | 35.85 | 1500 | 16.2 | 466.0 |
| 8 | Dir | 71.85 | 35.20 | 1375 | 15.7 | 1364.9 |
| 9 | Drosh | 71.78 | 35.57 | 1465 | 17.7 | 549.5 |
| 10 | Garhi Dupatta | 73.60 | 34.20 | 814 | 19.7 | 1339.0 |
| 11 | Gilgit | 74.33 | 35.92 | 1460 | 16.0 | 145.6 |
| 12 | Gupis | 73.40 | 36.17 | 2156 | 12.3 | 248.9 |
| 13 | Islamabad | 73.09 | 33.73 | 569 | 21.8 | 1262.5 |
| 14 | Jhelum | 73.37 | 32.94 | 287.2 | 23.9 | 862.1 |
| 15 | Kakul | 73.25 | 34.18 | 1309 | 16.9 | 1312.2 |
| 16 | Kohat | 71.43 | 33.57 | 513 | 20.1 | 616.3 |
| 17 | Kotli | 73.89 | 33.52 | 614 | 21.9 | 1183.7 |
| 18 | Muzaffarabad | 73.50 | 34.40 | 838 | 20.5 | 1377.7 |
| 19 | Murree | 73.40 | 33.91 | 2127 | 13.4 | 1694.6 |
| 20 | Parachinar | 70.08 | 33.86 | 1775 | 21.1 | 1114.8 |
| 21 | Peshawar | 71.56 | 34.02 | 360 | 23.1 | 530.3 |
| 22 | Rawalpindi | 73.04 | 33.59 | 540 | 21.7 | 1248.6 |
| 23 | Saidu Shrif | 72.35 | 34.82 | 970 | 26.3 | 1036.6 |
| 24 | Skardu | 75.54 | 35.34 | 2317 | 11.9 | 228.1 |
| Index | Definition | Symbol | Unit |
|---|---|---|---|
| Duration Indices | |||
| Cold spell duration | “Annual count of days with at least 6 consecutive days when TMIN < 10th percentile” | CSDI | Days |
| Warm spell duration index | “Annual count of days with at least six consecutive days when TMAX > 90th percentile” | WSDI | Days |
| Percentile-Based Extreme Temperature Indices | |||
| Cold night | “Annual count of days when TMIN < 10th percentile” | TN10p | Days |
| Hot night | “Annual count of days when TMIN > 90th percentile” | TN90p | Days |
| Cold days | “Annual count of days when TMAX < 10th percentile” | TX10p | Days |
| Hot days | “Annual count of days when TMAX > 90th percentile” | TX90p | Days |
| Absolute Indices | |||
| Coldest night | “Annual minimum value of TMIN” | TNn | °C |
| Hottest night | “Annual maximum value of TMIN” | TNx | °C |
| Coldest day | “Annual minimum value of TMAX” | TXn | °C |
| Hottest day | “Annual maximum value of TMAX” | TXx | °C |
| Maximum temperature means | “Annual mean daily maximum temperature” | TXmean | °C |
| Minimum temperature means | “Annual mean daily minimum temperature” | TNmean | °C |
| Diurnal temperature range | “Annual mean difference between TMAX and TMIN” | DTR | °C |
| Index | 1991–2000 | 2001–2010 | 2011–2020 |
|---|---|---|---|
| Hot Indices | |||
| TXmean (°C) | 1.70 | −0.78 | −0.33 |
| WSDI (days) | 23.33 | −8.00 | 0.00 |
| TN90p (days) | 5.15 | −7.73 | 0.22 |
| TX90p (days) | 13.81 | −6.61 | −0.78 |
| TNx (°C) | 0.50 | −0.50 | −1.00 |
| TXx (°C) | −0.14 | −1.25 | −3.17 |
| Cold Indices | |||
| TNmean (°C) | 0.85 | −0.75 | 0.32 |
| CSDI (days) | −13.33 | 16.25 | 0.00 |
| TN10p (days) | −8.28 | 6.05 | −4.60 |
| TX10p (days) | −9.65 | −0.33 | 1.50 |
| TNn (°C) | 0.40 | −1.57 | 0.75 |
| TXn (°C) | 0.29 | 1.00 | 0.00 |
| DTR (°C) | 1.08 | 0.08 | −0.11 |
| Sr. No. | Station | WSDI | TX90p | TN90P | TXx | TNx | TXmean |
|---|---|---|---|---|---|---|---|
| 1 | Astore | 1.89 | 1.50 | −0.07 | 1.69 | 2.32 | 1.84 |
| 2 | Bagh | 1.50 | 0.80 | −1.94 | −1.16 | −2.25 | 1.55 |
| 3 | Bala Kot | 1.87 | 3.37 | −2.87 | −0.39 | −2.25 | 3.64 |
| 4 | Bunji | 0.90 | 1.17 | 2.84 | 2.91 | 1.20 | 1.26 |
| 5 | Cherat | 3.01 | 4.05 | −1.74 | 1.72 | −1.58 | 4.66 |
| 6 | Chilas | 1.00 | 0.97 | −2.14 | −0.39 | −0.66 | 2.04 |
| 7 | Chitral | −0.06 | 0.54 | 0.56 | −0.66 | −0.64 | 0.83 |
| 8 | Dir | 1.36 | 2.01 | −2.12 | −0.23 | −1.85 | 1.80 |
| 9 | Drosh | 0.60 | −1.17 | −4.30 | −3.06 | −4.29 | 0.54 |
| 10 | Garhi Dupatta | 2.10 | 3.38 | −2.55 | −0.05 | −3.13 | 2.67 |
| 11 | Gilgit | −0.29 | −0.99 | 1.43 | −2.39 | −0.39 | −0.51 |
| 12 | Gupis | −0.44 | 0.31 | −1.72 | −3.47 | −1.37 | 1.43 |
| 13 | Islamabad | −0.16 | −0.68 | −0.68 | −0.78 | −0.32 | 0.27 |
| 14 | Jhelum | 0.00 | 1.63 | 0.17 | −0.26 | −1.16 | 1.07 |
| 15 | Kakul | 1.47 | 2.92 | −2.45 | 0.87 | −2.10 | 2.41 |
| 16 | Kohat | −0.32 | −0.99 | −2.40 | −2.27 | −2.10 | −0.43 |
| 17 | Kotli | −1.01 | 0.78 | 1.77 | −0.32 | 1.72 | 2.33 |
| 18 | Muzaffarabad | −0.36 | −0.48 | −2.53 | −1.81 | −2.28 | −0.46 |
| 19 | Murree | 0.44 | 1.31 | −0.08 | −0.27 | −1.23 | 1.00 |
| 20 | Para Chinar | 0.43 | −1.97 | −1.90 | 0.26 | 0.15 | 1.00 |
| 21 | Peshawar | −0.93 | 0.99 | 0.99 | −2.83 | −1.71 | −2.19 |
| 22 | Rawalpindi | −0.59 | −0.07 | −1.09 | −0.82 | −0.73 | −0.25 |
| 23 | Saidu Sharif | −0.28 | 0.14 | 0.27 | 0.07 | 0.03 | 0.00 |
| 24 | Skardu | 0.00 | −2.62 | −3.13 | −2.23 | 2.00 | 1.39 |
| Sr. No. | Station | CSDI | TX10p | TN10P | TXn | TNn | TNmean | DTR |
|---|---|---|---|---|---|---|---|---|
| 1 | Astore | −0.95 | −1.38 | −0.65 | 2.43 | 0.60 | 1.09 | 1.89 |
| 2 | Bagh | −1.32 | −2.40 | −0.95 | 1.94 | −2.88 | −0.12 | 2.67 |
| 3 | Bala Kot | 0.37 | −3.20 | 0.83 | 2.21 | −1.38 | −2.76 | 4.49 |
| 4 | Bunji | −1.09 | −0.87 | −4.08 | 1.62 | 0.55 | 3.65 | −2.70 |
| 5 | Cherat | 0.00 | −4.39 | 0.29 | 1.87 | 1.52 | −0.85 | 3.83 |
| 6 | Chilas | 1.65 | −2.63 | 1.24 | 1.34 | −1.98 | −0.85 | 4.50 |
| 7 | Chitral | 0.00 | −0.88 | −2.62 | −0.58 | 0.42 | 2.07 | −0.09 |
| 8 | Dir | 2.22 | −2.21 | −0.85 | 1.89 | 2.22 | −0.26 | 1.94 |
| 9 | Drosh | 2.22 | −1.90 | 3.50 | 0.14 | −2.04 | −3.71 | 5.32 |
| 10 | Garhi Dupatta | 1.38 | −2.26 | 0.08 | 1.02 | −3.24 | −1.14 | 3.61 |
| 11 | Gilgit | −2.34 | −0.22 | −4.08 | 1.82 | 0.92 | 3.49 | −2.58 |
| 12 | Gupis | −1.08 | −1.97 | −1.99 | 1.30 | 0.32 | 0.24 | 1.24 |
| 13 | Islamabad | 0.94 | −0.61 | 1.33 | 0.84 | −2.67 | −0.78 | 0.85 |
| 14 | Jhelum | −3.13 | −0.68 | −1.56 | −0.87 | −2.18 | 0.46 | 1.72 |
| 15 | Kakul | −0.48 | −2.21 | −1.36 | 1.18 | 0.00 | −1.11 | 2.69 |
| 16 | Kohat | −0.48 | −0.85 | −1.36 | 0.27 | 0.00 | −1.09 | −0.14 |
| 17 | Kotli | −2.42 | −2.53 | −3.43 | 2.15 | −0.26 | 1.95 | 1.05 |
| 18 | Muzaffarabad | 0.70 | −0.99 | 1.63 | 0.31 | −3.14 | 1.24 | 2.50 |
| 19 | Murree | −0.84 | −1.19 | −3.50 | 1.46 | 2.08 | −1.99 | −1.10 |
| 20 | Para Chinar | 2.59 | 0.54 | 0.58 | 2.64 | 3.23 | −2.16 | 3.83 |
| 21 | Peshawar | −1.24 | 0.03 | −1.22 | −0.96 | −0.76 | 1.00 | −0.85 |
| 22 | Rawalpindi | −0.18 | −0.12 | 0.07 | 0.90 | −1.00 | −0.73 | 1.38 |
| 23 | Saidu Sharif | 1.19 | −2.11 | −2.55 | 0.27 | 0.12 | 1.46 | 3.94 |
| 24 | Skardu | −1.02 | −0.73 | 0.73 | 2.37 | 0.50 | −2.40 | 1.89 |
Disclaimer/Publisher’s Note: The statements, opinions and data contained in all publications are solely those of the individual author(s) and contributor(s) and not of MDPI and/or the editor(s). MDPI and/or the editor(s) disclaim responsibility for any injury to people or property resulting from any ideas, methods, instructions or products referred to in the content. |
© 2023 by the authors. Licensee MDPI, Basel, Switzerland. This article is an open access article distributed under the terms and conditions of the Creative Commons Attribution (CC BY) license (https://creativecommons.org/licenses/by/4.0/).
Share and Cite
Ghanim, A.A.J.; Anjum, M.N.; Rasool, G.; Saifullah; Irfan, M.; Alyami, M.; Rahman, S.; Niazi, U.M. Analyzing Extreme Temperature Patterns in Subtropical Highlands Climates: Implications for Disaster Risk Reduction Strategies. Sustainability 2023, 15, 12753. https://doi.org/10.3390/su151712753
Ghanim AAJ, Anjum MN, Rasool G, Saifullah, Irfan M, Alyami M, Rahman S, Niazi UM. Analyzing Extreme Temperature Patterns in Subtropical Highlands Climates: Implications for Disaster Risk Reduction Strategies. Sustainability. 2023; 15(17):12753. https://doi.org/10.3390/su151712753
Chicago/Turabian StyleGhanim, Abdulnoor A. J., Muhammad Naveed Anjum, Ghulam Rasool, Saifullah, Muhammad Irfan, Mana Alyami, Saifur Rahman, and Usama Muhammad Niazi. 2023. "Analyzing Extreme Temperature Patterns in Subtropical Highlands Climates: Implications for Disaster Risk Reduction Strategies" Sustainability 15, no. 17: 12753. https://doi.org/10.3390/su151712753
APA StyleGhanim, A. A. J., Anjum, M. N., Rasool, G., Saifullah, Irfan, M., Alyami, M., Rahman, S., & Niazi, U. M. (2023). Analyzing Extreme Temperature Patterns in Subtropical Highlands Climates: Implications for Disaster Risk Reduction Strategies. Sustainability, 15(17), 12753. https://doi.org/10.3390/su151712753