

Analysis of Microclimatic Comfort Conditions in University Classrooms


Abstract
:1. Introduction
1.1. Effect of Microclimate on Humans
1.2. Fanger’s Model of Thermal Comfort
1.3. Prediction Methods
- Using the table of PMV values from GOST ISO 7730-2009, (if the relative air humidity is 50%).
- Direct measurements performed by using an integrated sensor for operative and equivalent temperatures.
2. Materials and Methods
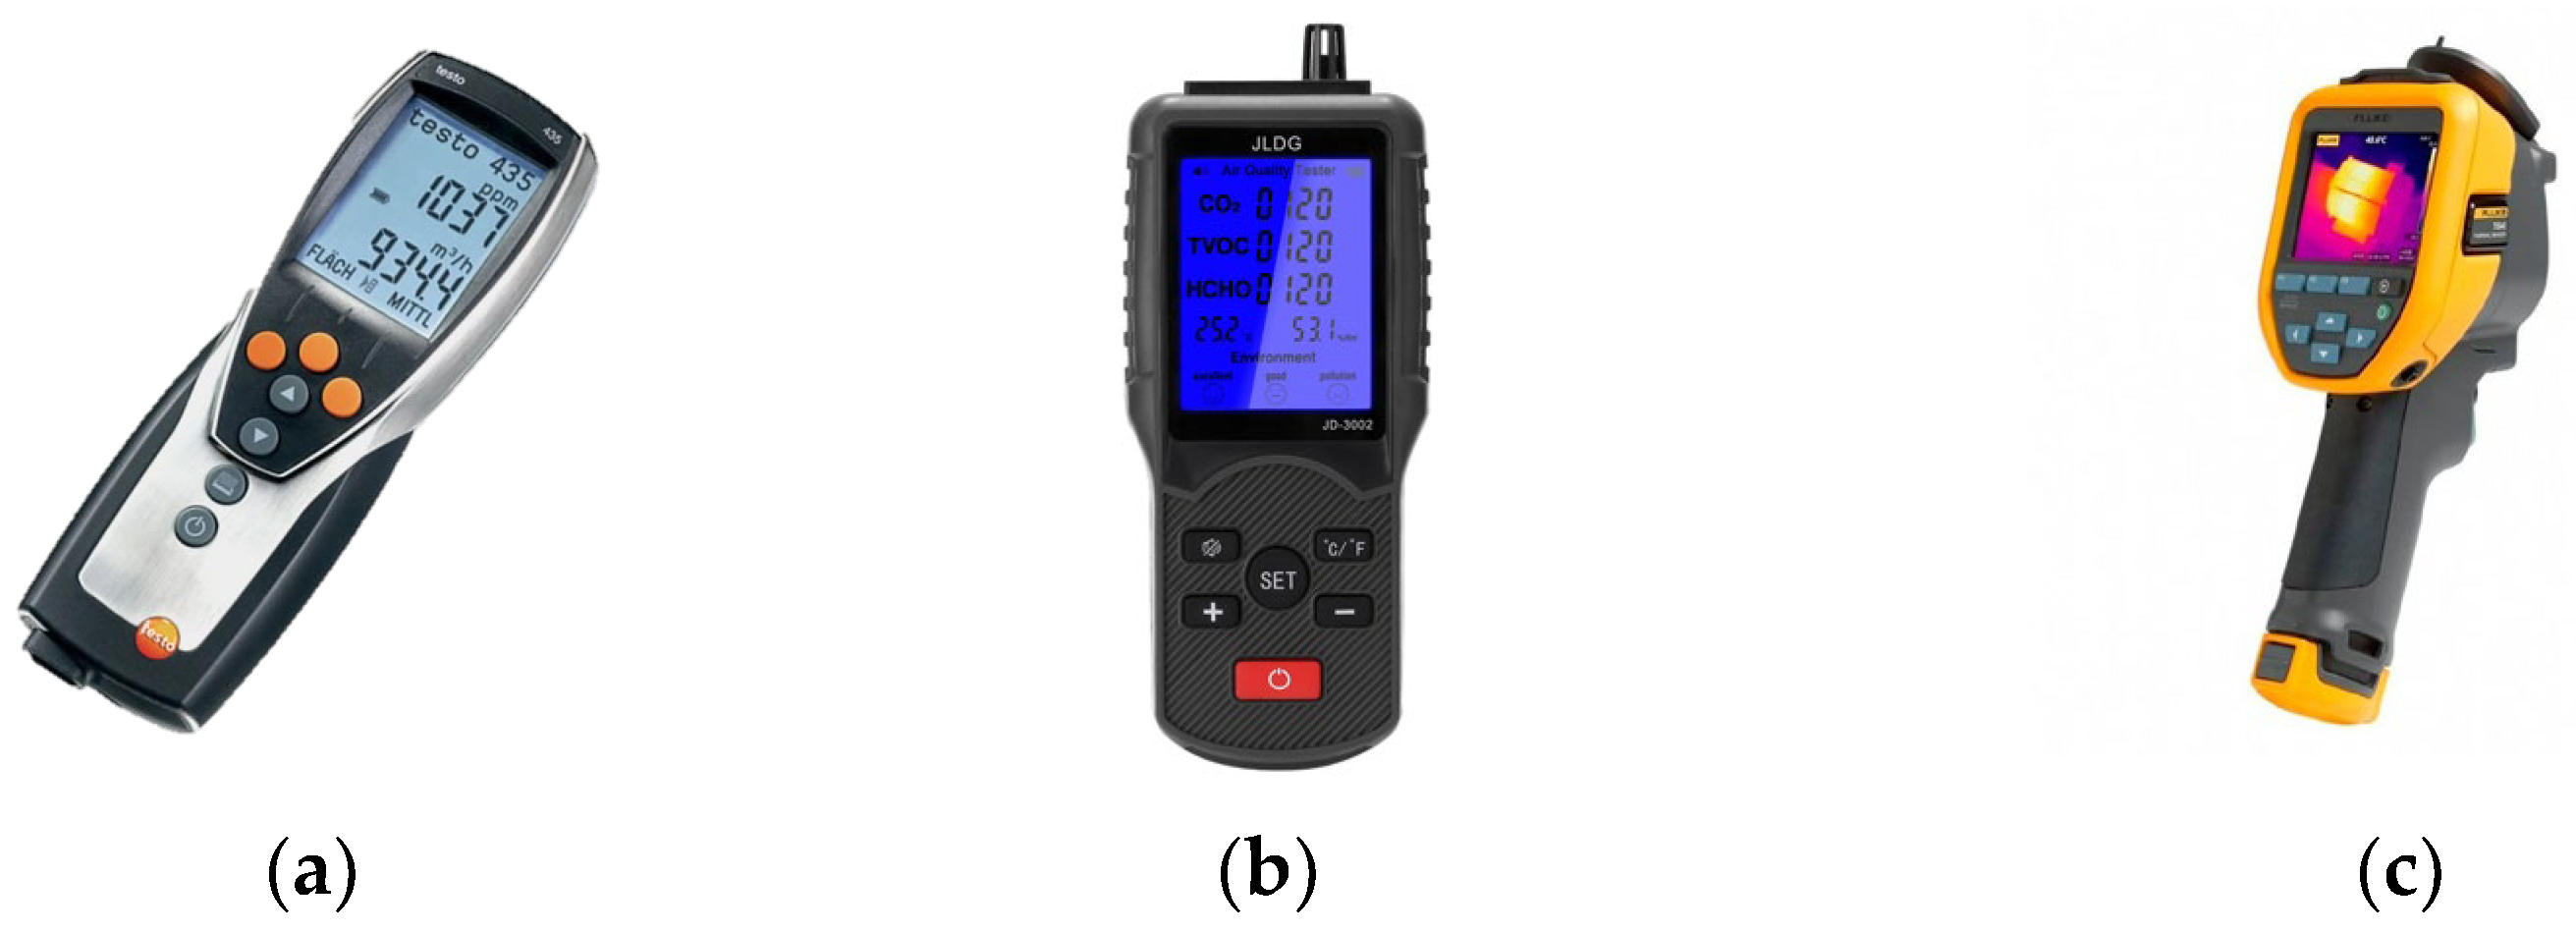
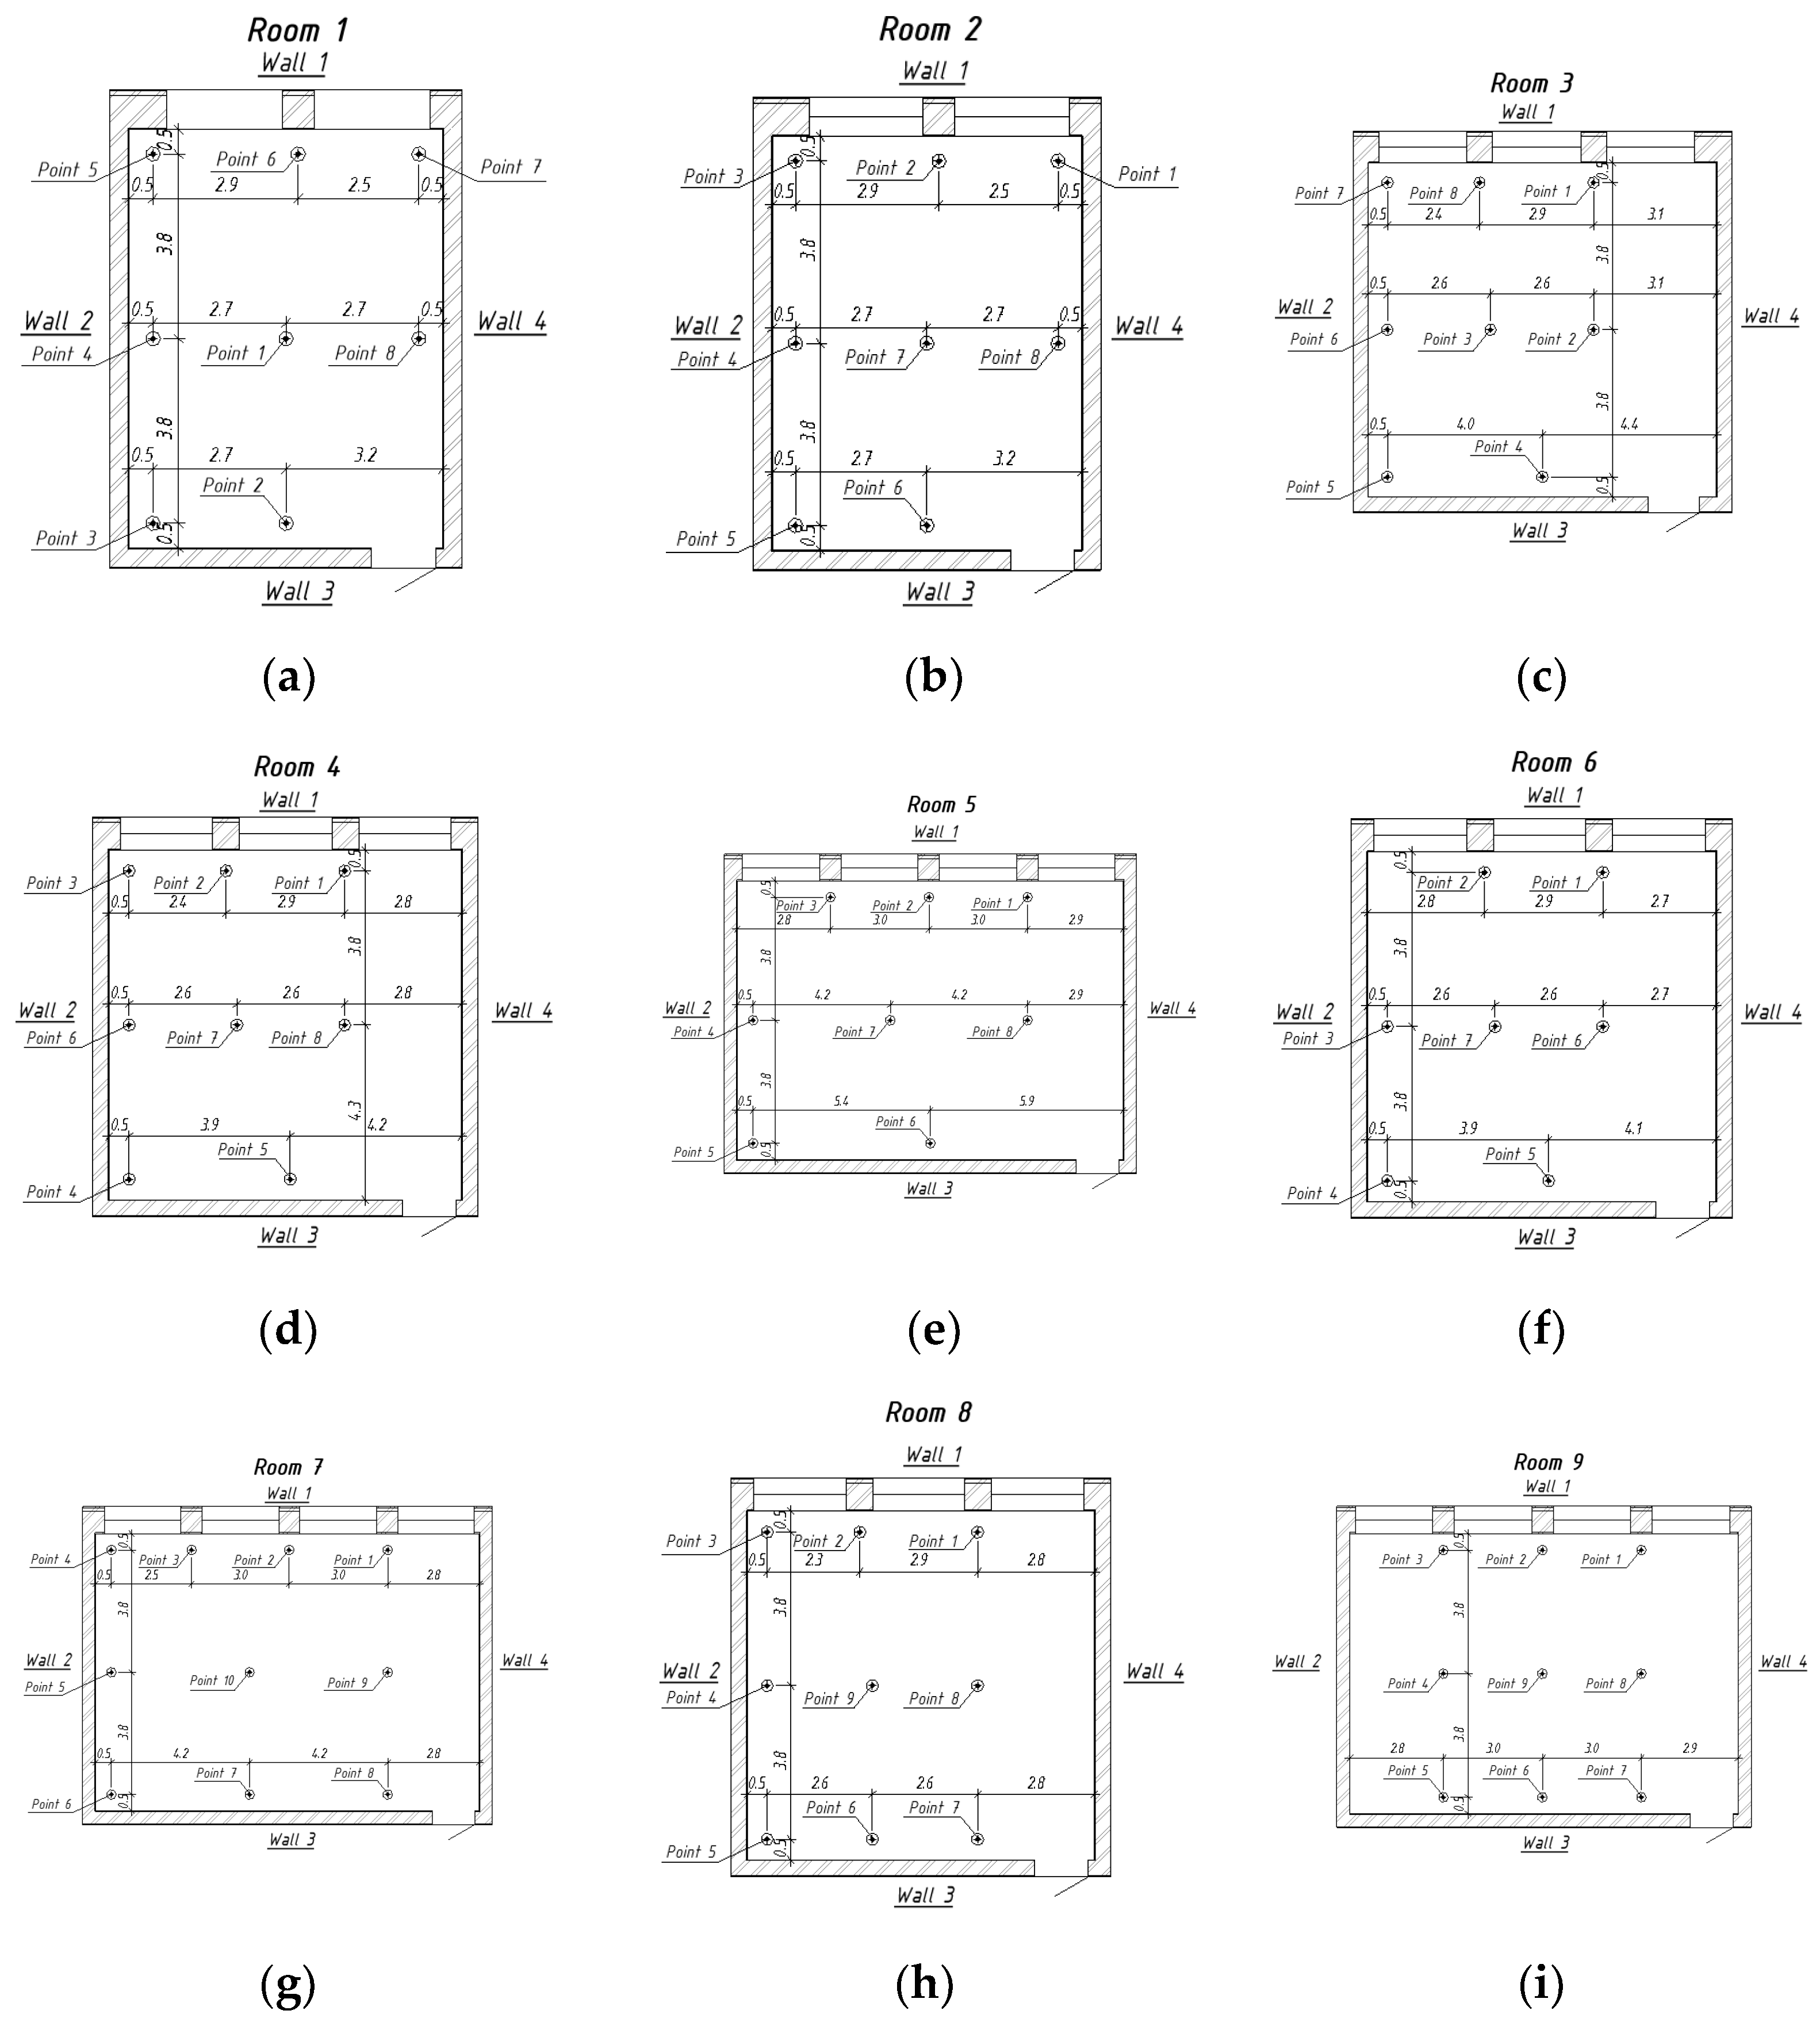
2.1. Measurement Procedure
2.2. Survey of Real Thermal Sensations of People in Rooms
- “Which classroom are you in?” This question was asked to record the specific location of the subject, because the survey was carried out in nine different classrooms.
- The subjects were asked how old they were, because metabolism declines with age.
- “Where are you sitting right now?” This question was asked to determine the approximate distance between the subject and the window as a source of cold air, because warm air can be distributed unevenly in a classroom.
- “What are you wearing?” This question was asked because the type of clothing can affect thermal sensations.
- “Rate on the following scale how you feel”. The subjects were presented with a scale from −3 to +3, where −3 corresponds to cold, −2 to cool, −1 to slightly cool, 0 to neutral, +1 to slightly warm, +2 to warm and +3 to hot.
- “What do you think is the outdoor temperature right now?” This question was asked because the subjective perception of the temperature outside the window can affect the thermal comfort of people in the room.
- “Do you feel any local discomfort?” This question was asked to gain for a more accurate understanding of the state of the indoor microclimate.
2.3. Calculation by Fanger Method
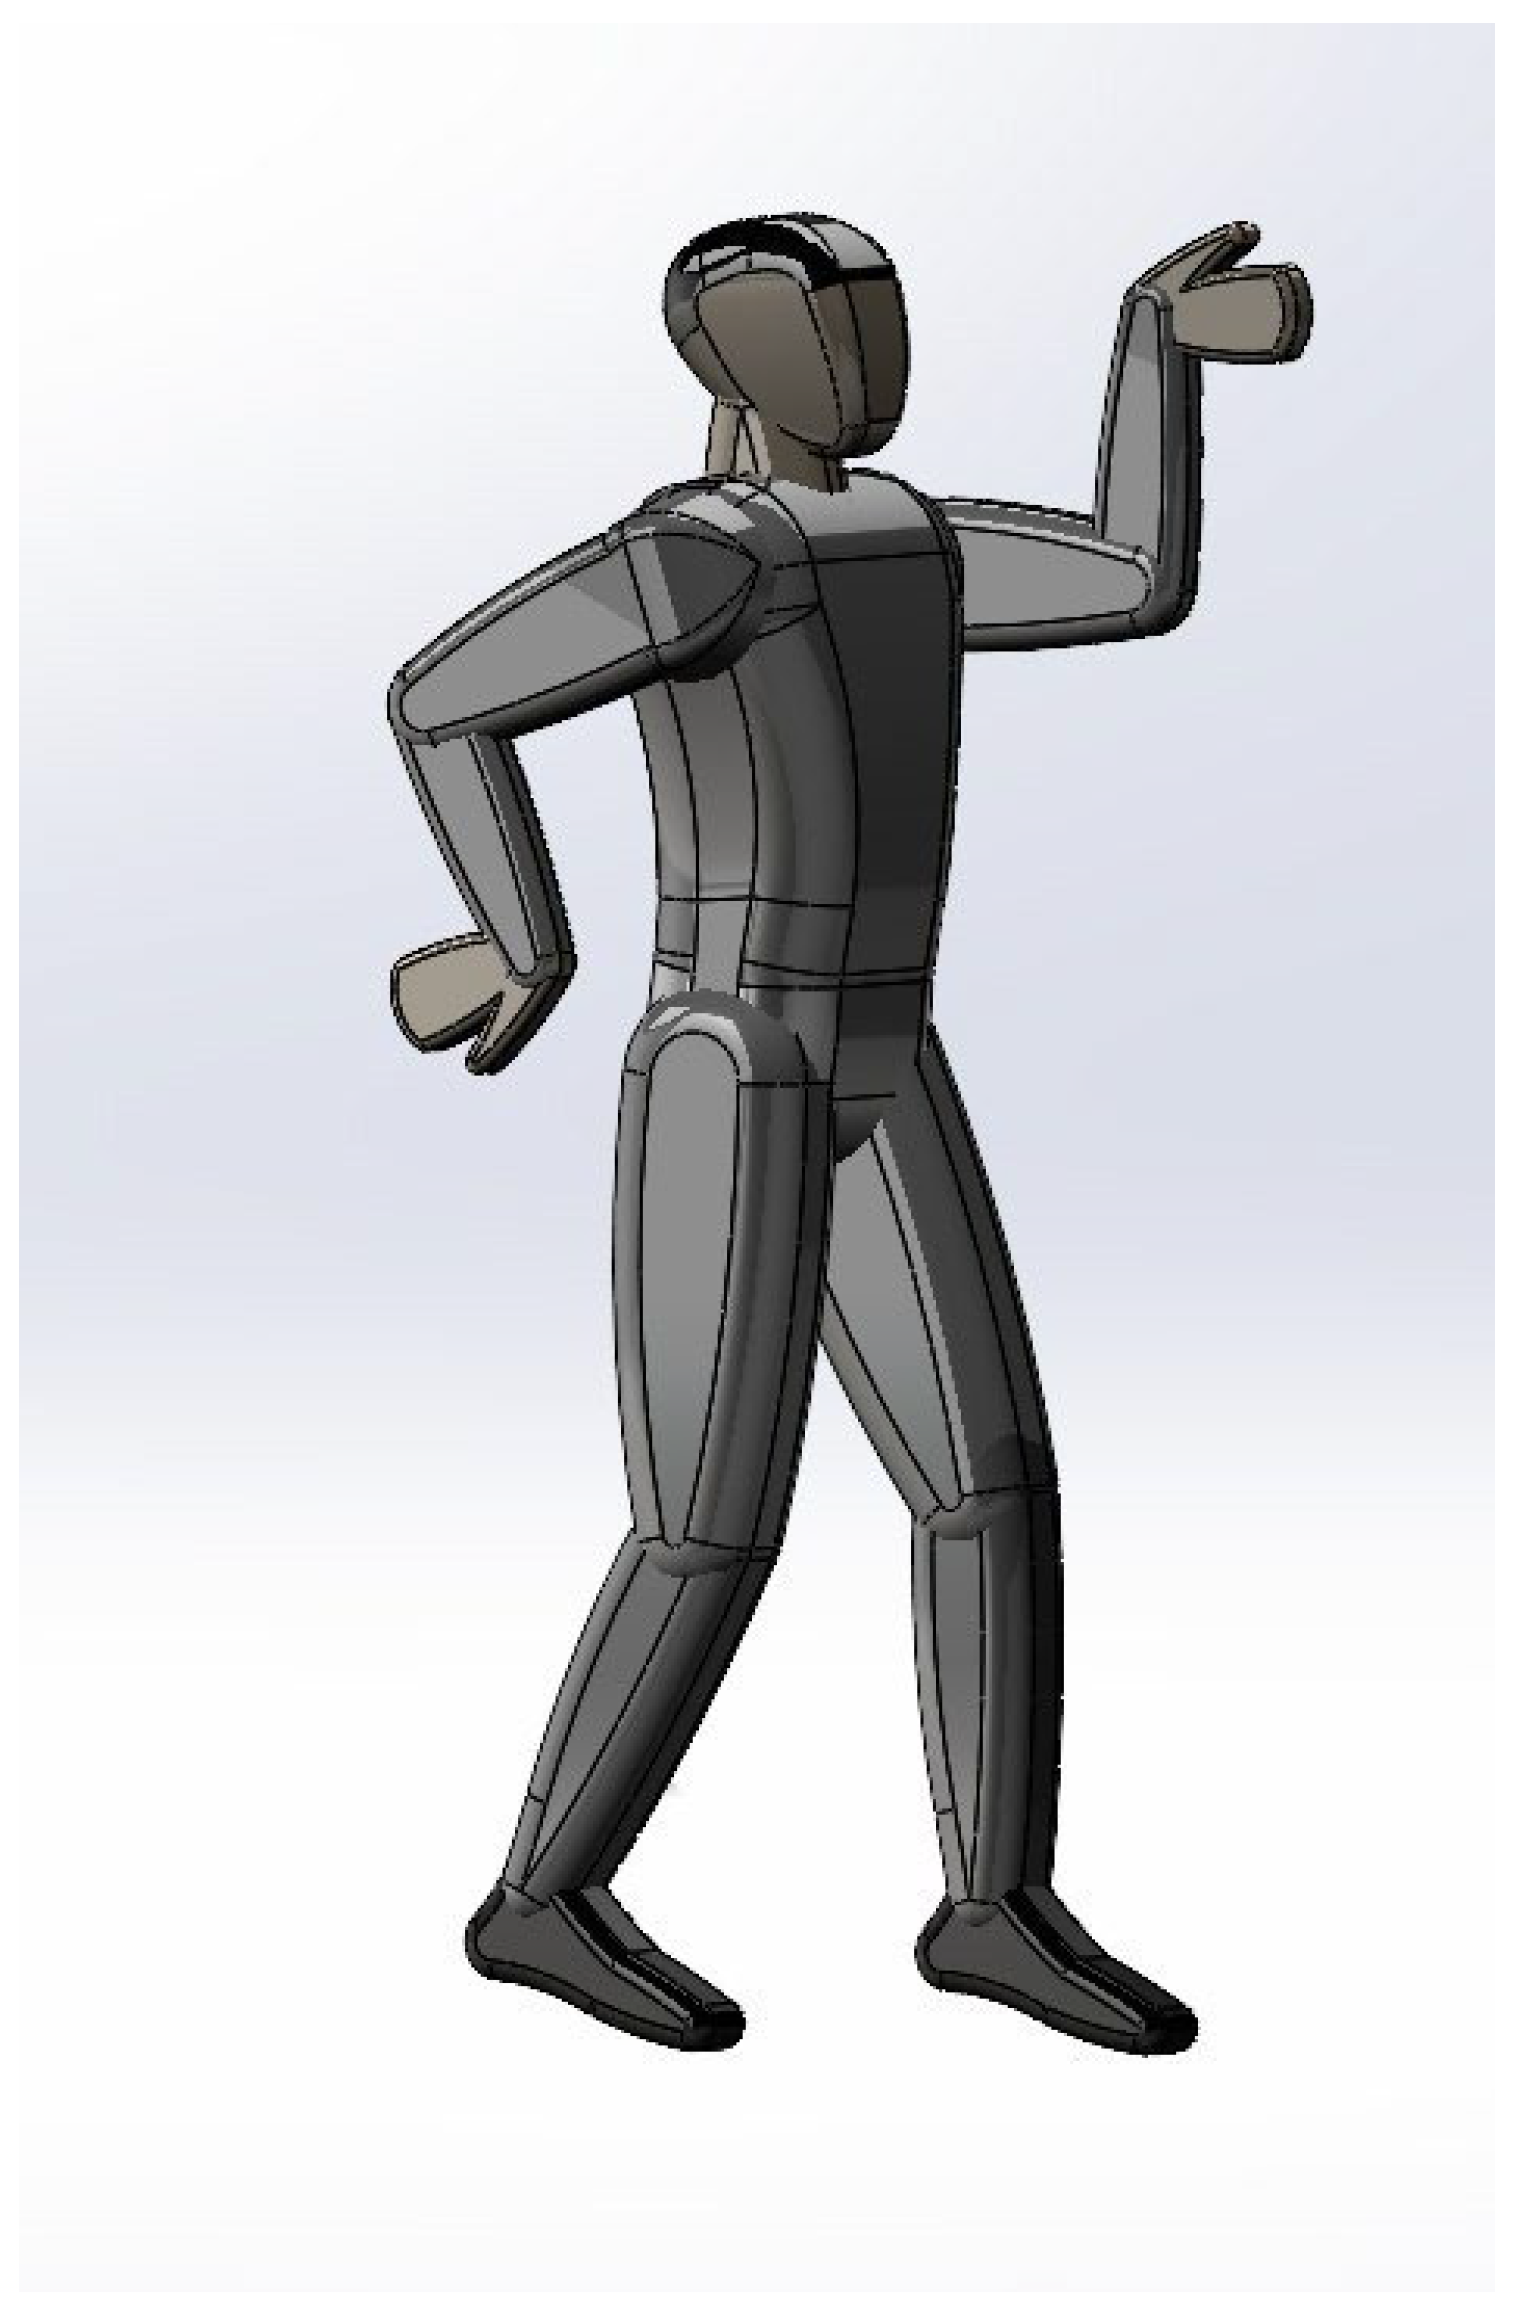
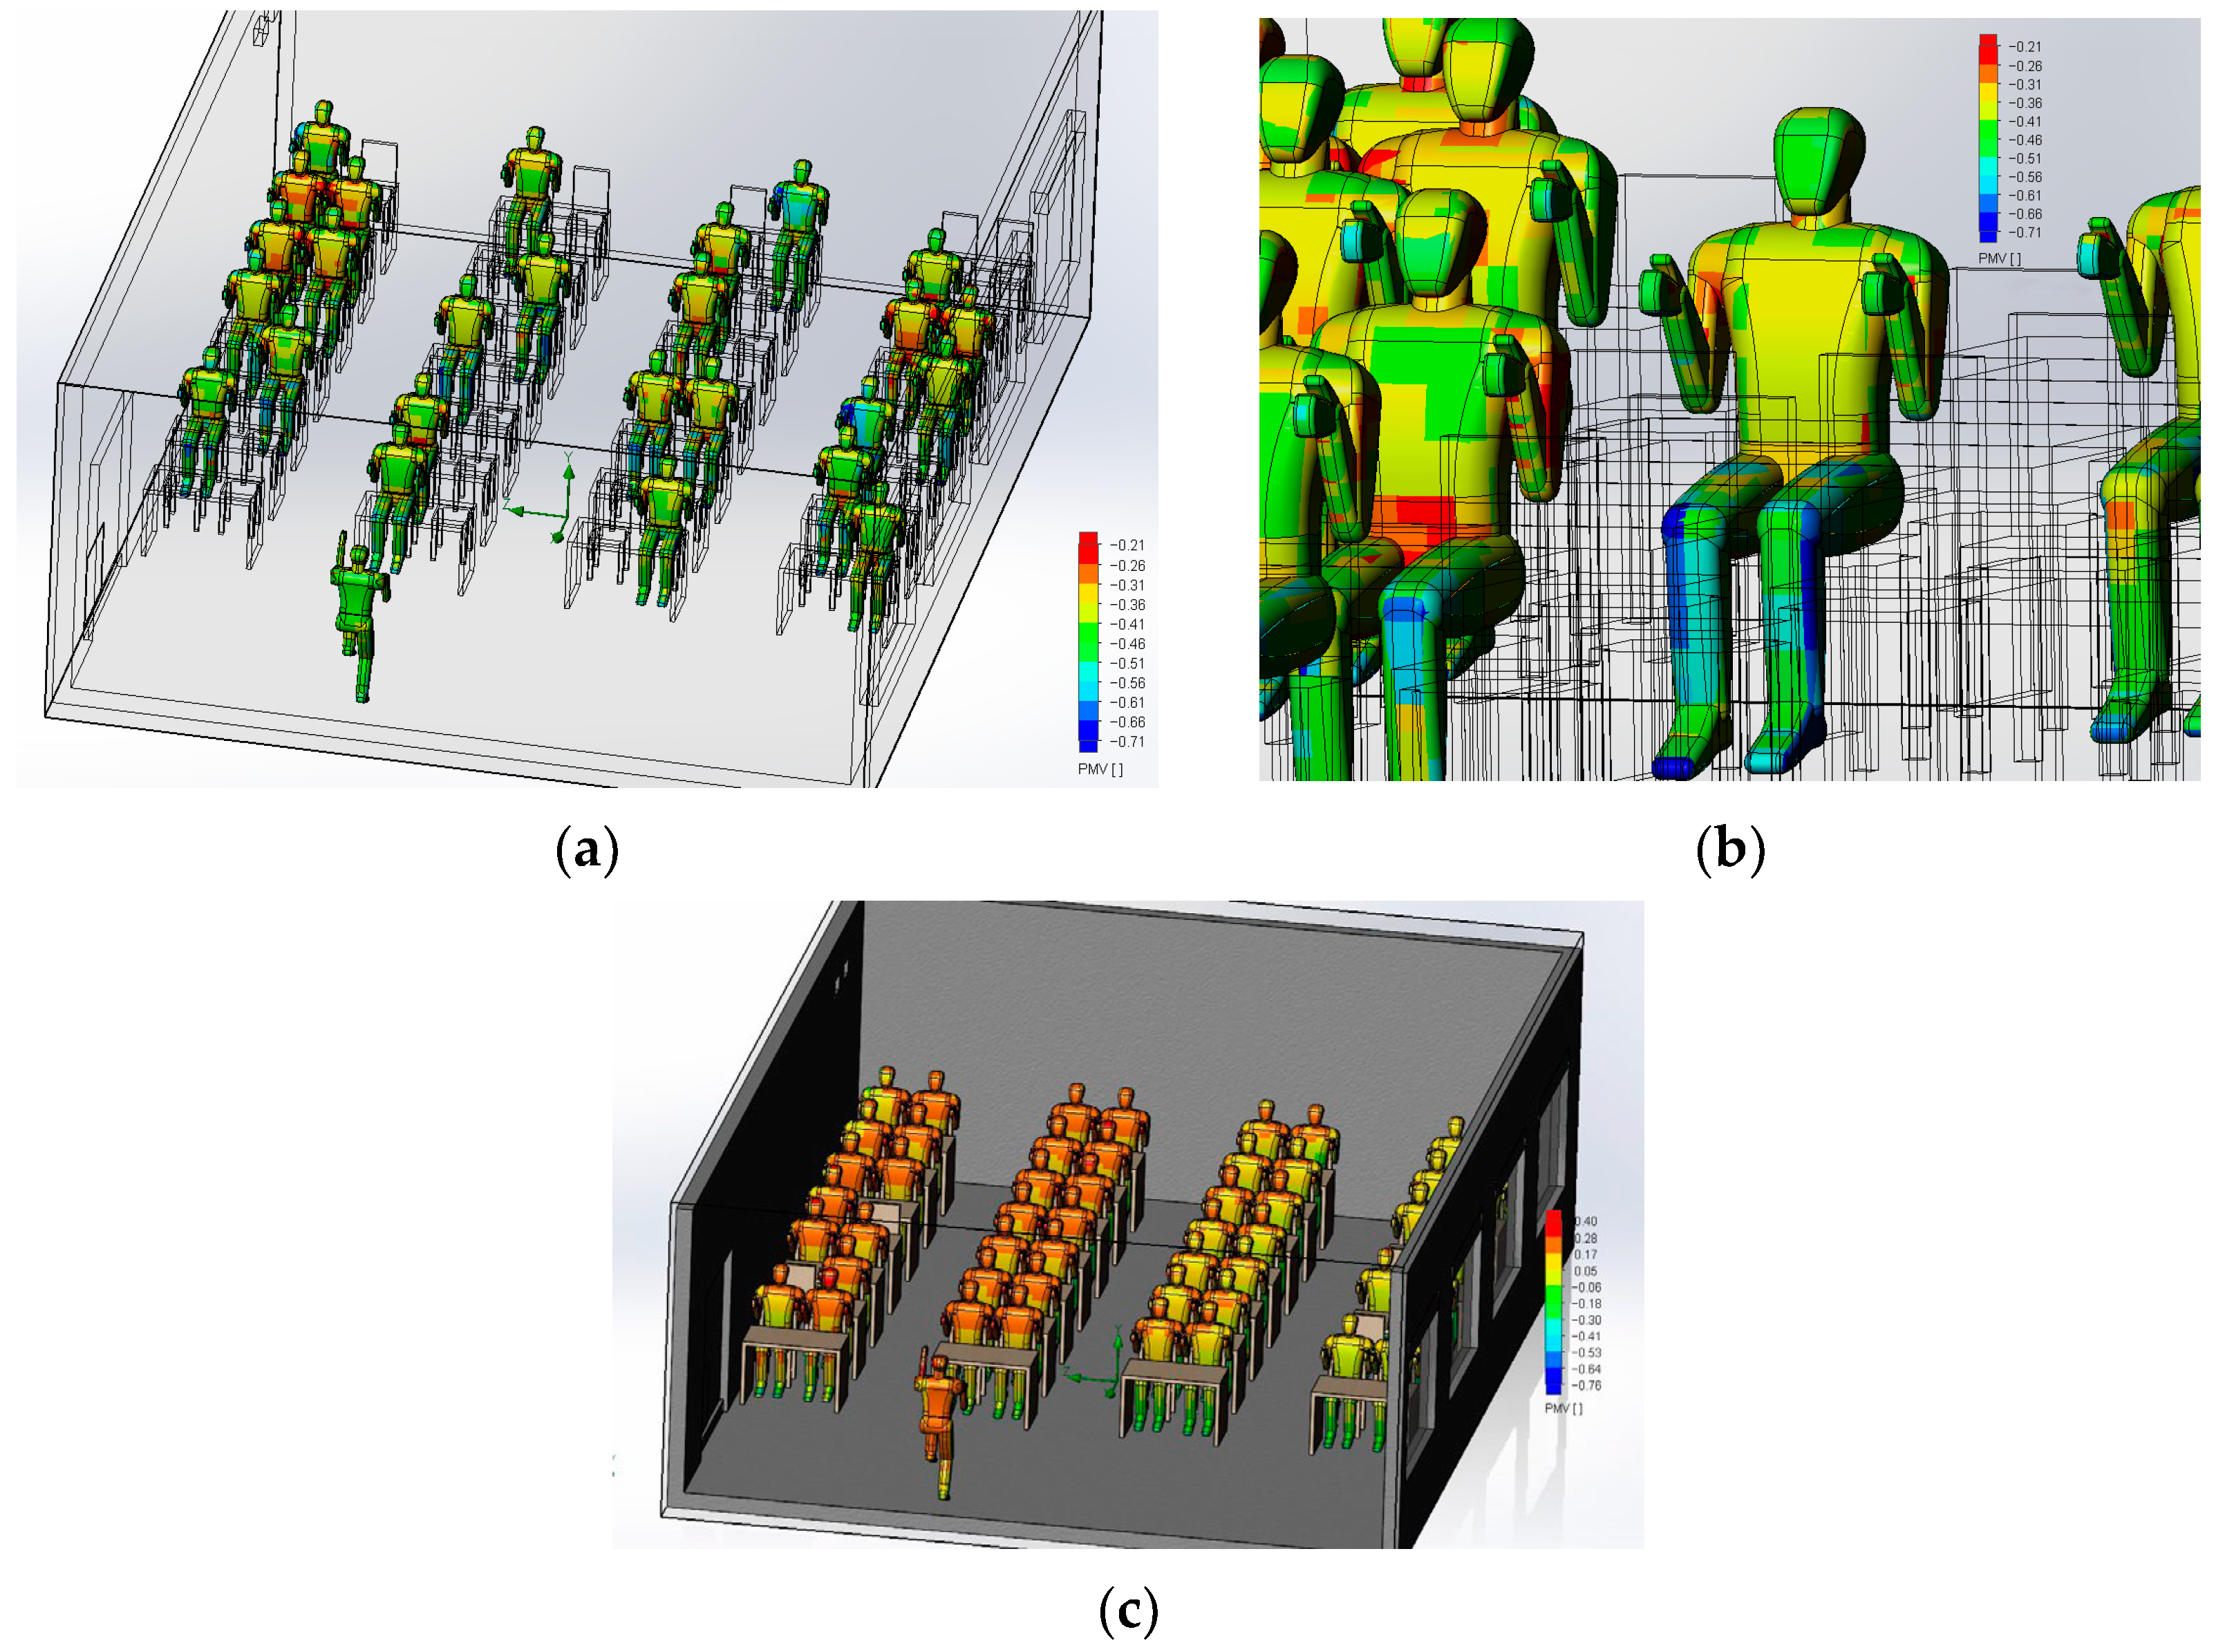
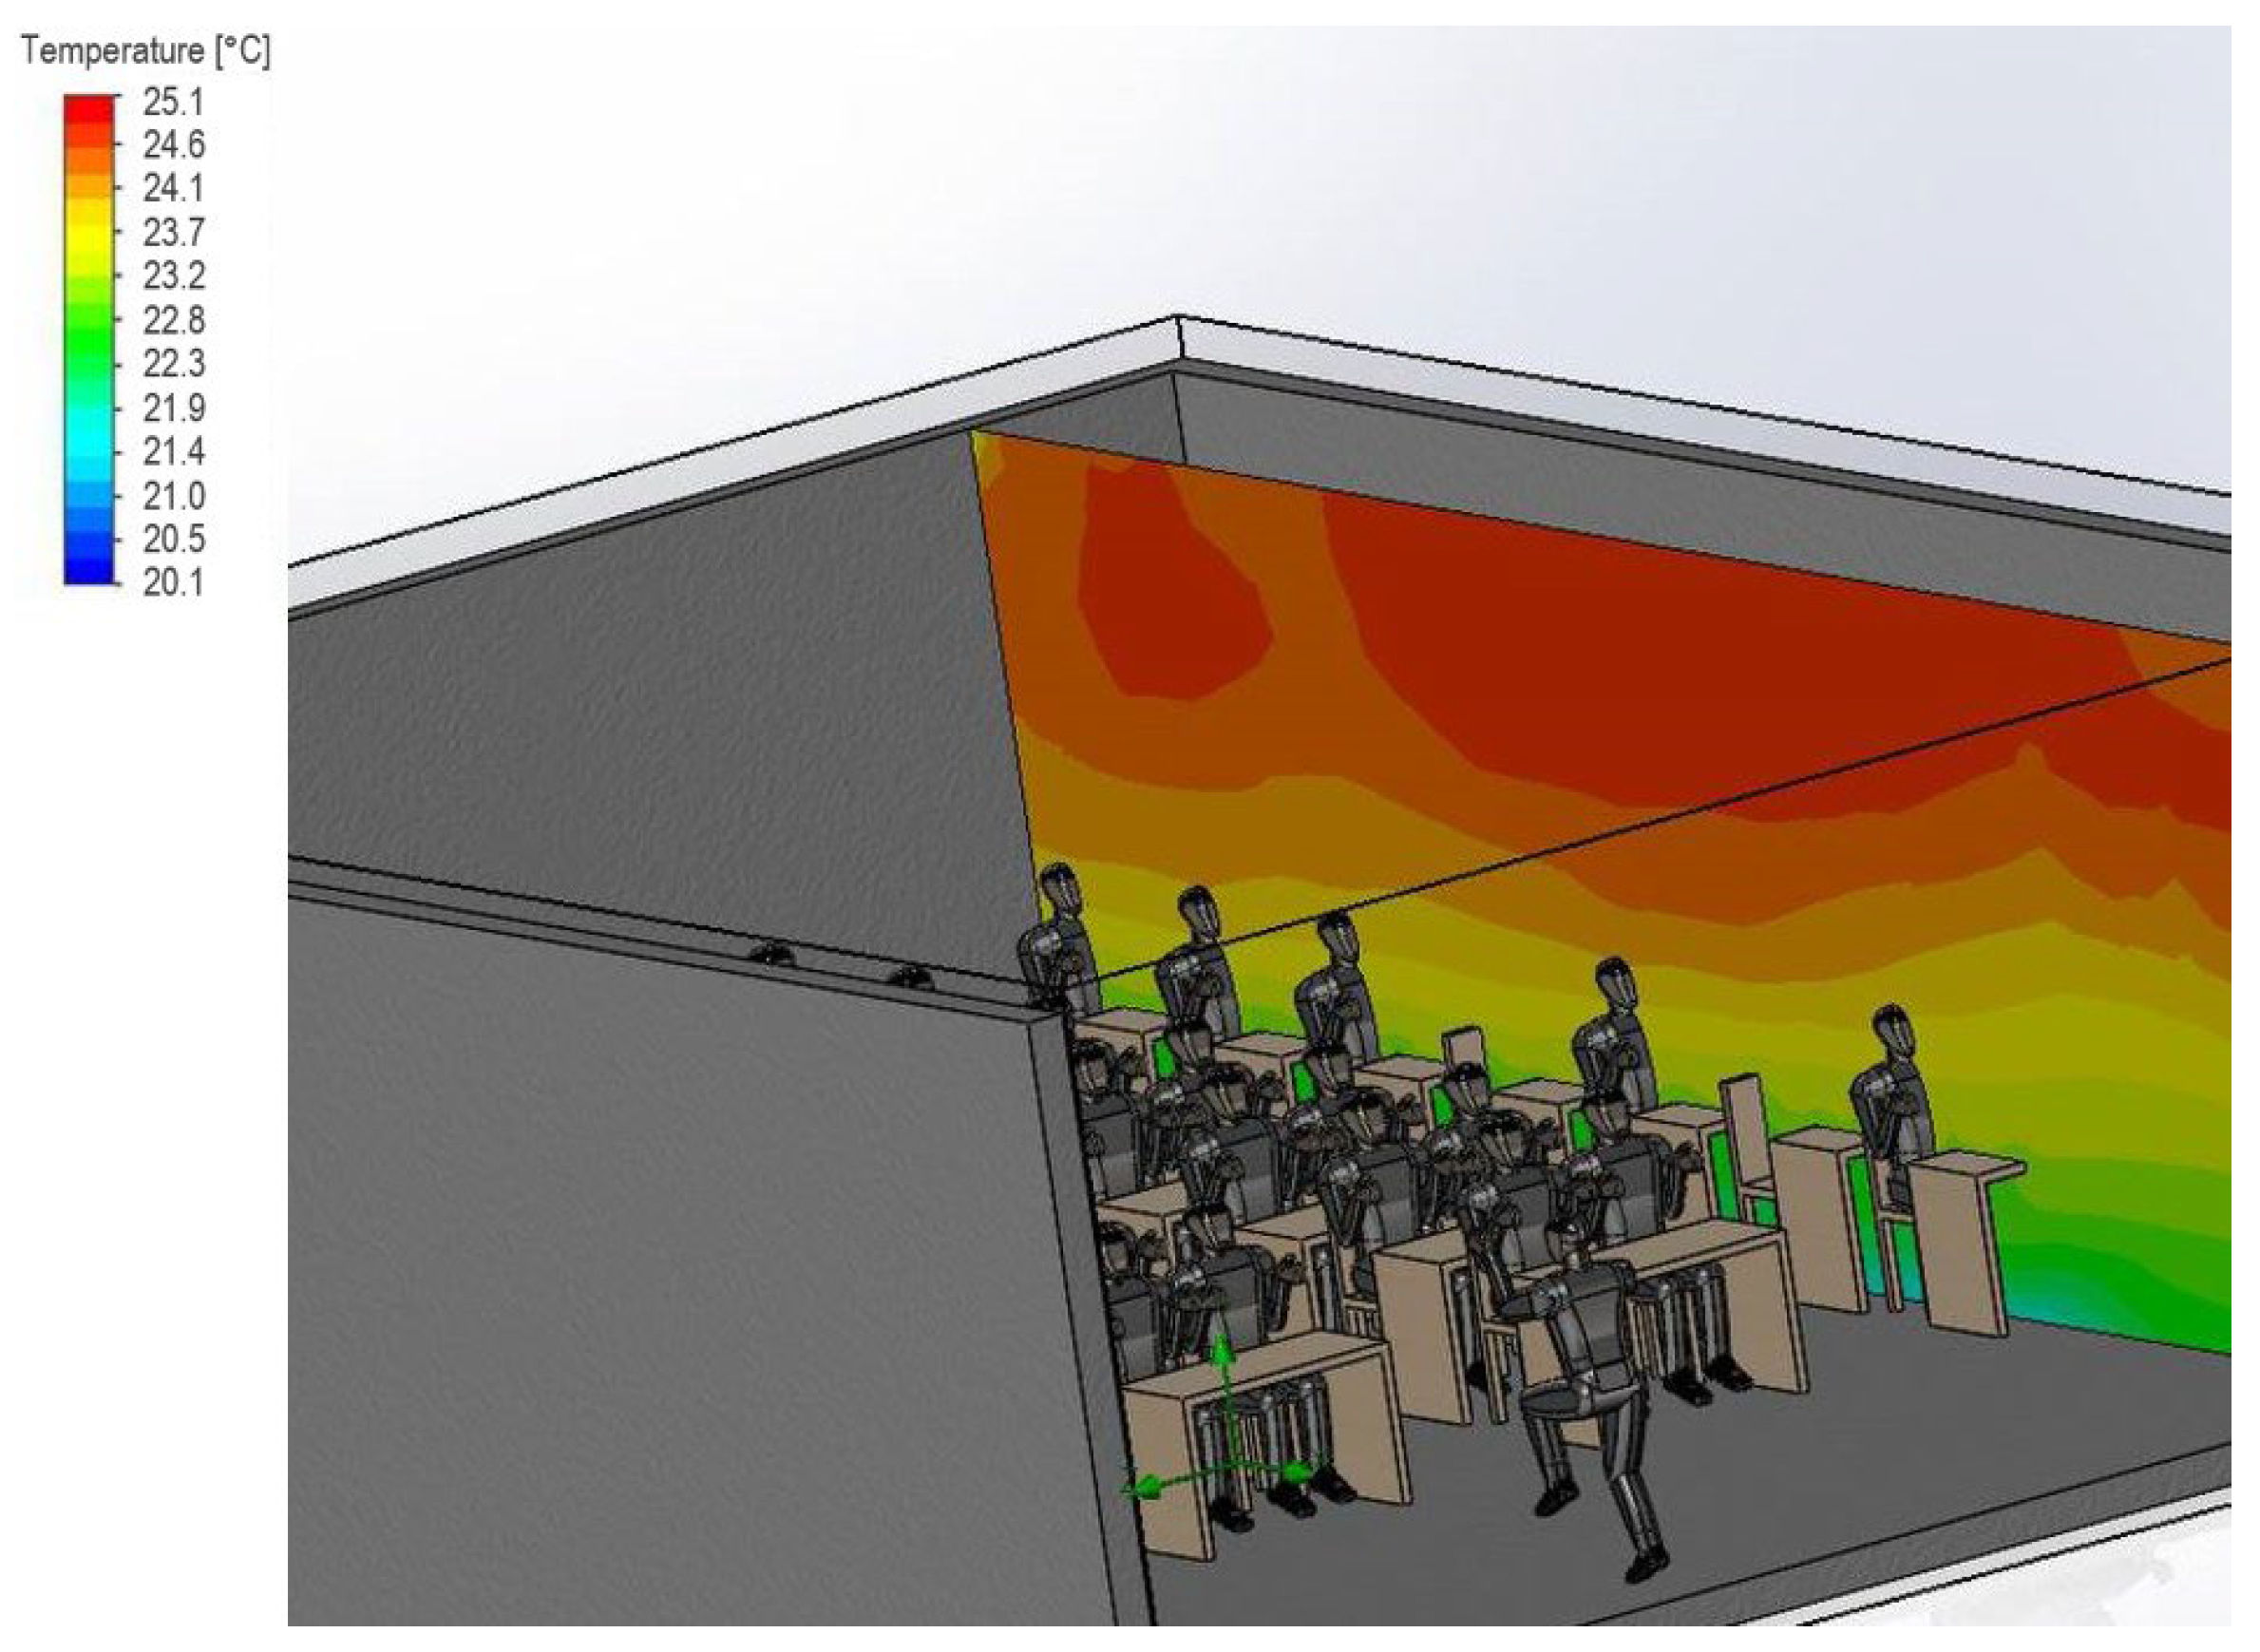
2.4. Simulation of Thermal Comfort in SolidWorks
- Formation of the model base taking into account the main dimensional characteristics and design features.
- Material selection as follows:
- -
- “Human” material (simulating the thermo-physical properties of the human body for the model shown in Figure 3).
- -
- “Air” material (selected for the space bounded by the enclosures to simulate heat losses and heat production).
- -
- Materials of enclosures (for walls, ceilings and windows, brick, concrete and glass were selected as materials, respectively).
- -
- Materials of additional elements (for desks, benches and doors, wood was selected as a material).
- Imposition of the following boundary conditions:
- -
- Indoor temperature (a temperature of 22 °C was set for the selected classrooms, which corresponds to the normal air temperature in the classrooms (before people enter and stay there)).
- -
- The pressure in the classroom was set to 101.325 kPa.
- -
- Outdoor temperature (given by the incoming airflow and corresponding to the air temperature on the corresponding measurement days, equal to 19 and 17 °C, respectively, for Rooms 5 and 7).
- -
- Heat generated by people (the mean thermal dissipation rate of a person at rest, taken equal to 90 W).
- -
- Simulation of natural ventilation (we simulated the supply and return airflow; since ventilation was mostly natural, we selected the windows and the door as working surfaces, respectively (imitation of ventilation); an incoming gas flow was set at the inlet (windows) (the inlet velocity was measured by an air quality tester and was equal to 1 m/s); the ambient pressure at the outlet (ventilation, door) was set to 101.25 kPa for the gas phase (flow in both directions was possible)).
- -
- A no-slip condition was imposed at the phase boundary (air speed = 0 m/s).
- Generation of computational mesh.
- Selection of solution parameters as follows:
- -
- Selection of calculated values for thermal comfort.
- -
- Selection of physics.
- -
- Selection of number of computational iterations.
- The creation and running of the computational scenario.
- Analysis of results and assessment of thermal comfort.
3. Results
3.1. Results Based on Manual Measurements
3.2. Results Based on EN-16798 Calculator
3.3. Survey Results
3.4. Results Based on SolidWorks Model
3.5. Overall Results
4. Discussion
5. Conclusions
Author Contributions
Funding
Data Availability Statement
Conflicts of Interest
References
- Rusanescu, C.O.; Rusanescu, M.; Jinescu, C.; Paraschiv, G. Influence of thermal comfort on health. Rev. Chim. 2019, 70, 1187–1191. [Google Scholar] [CrossRef]
- Ormandy, D.; Ezratty, V. Health and thermal comfort: From WHO guidance to housing strategies. Energy Policy 2012, 49, 116–121. [Google Scholar] [CrossRef]
- Barbic, F.; Minonzio, M.; Cairo, B.; Shiffer, D.; Dipasquale, A.; Cerina, L.; Vatteroni, A.; Urechie, V.; Verzeletti, P.; Badilini, F.; et al. Effects of different classroom temperatures on cardiac autonomic control and cognitive performances in undergraduate students. Physiol. Meas. 2019, 40, 054005. [Google Scholar] [CrossRef] [PubMed]
- Seppänen, O.A.; Fisk, W. Some quantitative relations between indoor environmental quality and work performance or health. HVA&R Res. 2006, 12, 957–973. [Google Scholar]
- Wang, L.; Wang, Y.; Fei, F.; Yao, W.; Sun, L. Study on winter thermal environment characteristics and thermal comfort of university classrooms in cold regions of China. Energy Build. 2023, 291, 113126. [Google Scholar] [CrossRef]
- van Hoof, J. Forty years of Fangers model of thermal comfort: Comfort for all? Indoor Air 2008, 18, 182–201. [Google Scholar] [CrossRef] [PubMed]
- Ovando-Chacon, G.E.; Rodríguez-León, A.; Ovando-Chacon, S.L.; Hernández-Ordoñez, M.; Díaz-González, M.; de J. Pozos-Texon, F. Computational Study of Thermal Comfort and Reduction of CO2 Levels inside a Classroom. Int. J. Environ. Res. Public Health 2022, 19, 2956. [Google Scholar] [CrossRef] [PubMed]
- Ongwuttiwat, K.; Sudprasert, S.; Leephakpreeda, T. Determination of human thermal comfort due to moisture permeability of clothes. Int. J. Cloth. Sci. Technol. 2018, 30, 462–476. [Google Scholar] [CrossRef]
- Rupp, R.F.; Parkinson, T.; Kim, J.; Toftum, J.; de Dear, R. The impact of occupant’s thermal sensitivity on adaptive thermal comfort model. Build. Environ. 2021, 207, 108517. [Google Scholar] [CrossRef]
- Filingeri, D.; Zhang, H.; Arens, E.A. Thermosensory micromapping of warm and cold sensitivity across glabrous and hairy skin of male and female hands and feet. J. Appl. Physiol. 2018, 125, 723–736. [Google Scholar] [CrossRef]
- Stokowiec, K.; Kotrys-Działak, D.; Jastrzȩbska, P. Verification of the Fanger model with field experimental data. J. Phys. Conf. Ser. 2022, 2339, 012027. [Google Scholar] [CrossRef]
- Xue, F.; Zhao, J. Building Thermal Comfort Research Based on Energy-Saving Concept. Adv. Mater. Sci. Eng. 2021, 2021, 7132437. [Google Scholar] [CrossRef]
- Karyono, K.; Abdullah, B.M.; Cotgrave, A.J.; Bras, A. The adaptive thermal comfort review from the 1920s, the present, and the future. Dev. Built Environ. 2020, 4, 100032. [Google Scholar] [CrossRef]
- d’Ambrosio Alfano, F.R.; Pepe, D.; Riccio, G.; Vio, M.; Palella, B.I. On the effects of the mean radiant temperature evaluation in the assessment of thermal comfort by dynamic energy simulation tools. Build. Environ. 2023, 236, 110254. [Google Scholar] [CrossRef]
- Yun, G.Y. Influences of perceived control on thermal comfort and energy use in buildings. Energy Build. 2018, 158, 822–830. [Google Scholar] [CrossRef]
- Sadeghian, P.; Rahnama, S.; Afshari, A.; Sadrizadeh, S. The role of design parameters on the performance of diffuse ceiling ventilation systems–thermal comfort analyses for indoor environment. Adv. Build. Energy Res. 2022, 16, 806–824. [Google Scholar] [CrossRef]
- Cheung, T.; Schiavon, S.; Parkinson, T.; Li, P.; Brager, G. Analysis of the accuracy on PMV—PPD model using the ASHRAE Global Thermal Comfort Database II. Build. Environ. 2019, 153, 205–217. [Google Scholar] [CrossRef]
- ISO 7730-2009; Ergonomics of the Thermal Environment. ISO: Geneva, Switzerland, 2009.
- ASHRAE Standard 55; Thermal Environmental Conditions for Human Occupancy. ASHRAE: Washington, DC, USA, 1966.
- Kim, J.H.; Min, Y.K.; Kim, B. Is the PMV index an indicator of human thermal comfort sensation? Int. J. Smart Home 2013, 7, 27–34. [Google Scholar]
- GOST 30494-2011; Residential and Public Buildings. Microclimate Parameters For Indoor Enclosures. GOST: St. Petersburg, Russia, 2011.
- BS EN-16798; Energy Performance of Buildings—Ventilation for Buildings. British Standards Institution: London, UK, 2019.
- Buratti, C.; Ricciardi, P. Adaptive analysis of thermal comfort in university classrooms: Correlation between experimental data and mathematical models. Build. Environ. 2009, 44, 674–687. [Google Scholar] [CrossRef]
- Zemitis, J.; Borodinecs, A.; Sidenko, N.; Zajacs, A. Simulation of IAQ and thermal comfort of a classroom at various ventilation strategies. E3S Web Conf. 2023, 396, 03005. [Google Scholar] [CrossRef]
- Ansaldi, R.; Corgnati, S.P.; Filippi, M. Comparison between Thermal Comfort Predictive Models and Subjective Responses in Italian University Classrooms. 2007. Available online: https://www.researchgate.net/publication/228503818_Comparison_between_thermal_comfort_predictive_models_and_subjective_responses_in_Italian_university_classroom (accessed on 5 March 2024).
- Corgnati, S.P.; Filippi, M.; Viazzo, S. Perception of the thermal environment in high school and university classrooms: Subjective preferences and thermal comfort. Build. Environ. 2007, 42, 951–959. [Google Scholar] [CrossRef]
- Dębska, L.; Zender, M. Analysis of the accuracy of the Fanger model in the intelligent building—A case study. E3S Web Conf. 2022, 347, 04012. [Google Scholar] [CrossRef]
- Cui, W.; Cao, G.; Park, J.H.; Ouyang, Q.; Zhu, Y. Influence of indoor air temperature on human thermal comfort, motivation and performance. Build. Environ. 2013, 68, 114–122. [Google Scholar] [CrossRef]
- Crosby, S.; Rysanek, A. Extending the Fanger PMV model to include the effect of non-thermal conditions on thermal comfort Build Run-Time Environment. In Proceedings of the eSIM Conference, Vancouver, BC, Canada, 14–16 June 2021. [Google Scholar]
- Arundel, A.V.; Sterling, E.M.; Biggin, J.H.; Sterling, T.D. Indirect health effects of relative humidity in indoor environments. Environ. Health Perspect. 1986, 65, 351–361. [Google Scholar] [PubMed]
- Ness, M.-C. Indoor relative humidity: Relevance for health, comfort, and choice of ventilation system. In Proceedings of the 3rd Valencia International Biennial of Research in Architecture, Valencia, Spain, 9–11 November 2022. [Google Scholar]
- Cattarin, G.; Simone, A.; Olesen, B.W. Human preference and acceptance of increased air velocity to offset warm sensation at increased room temperatures. In Proceedings of the 33rd AIVC conference–2nd TightVent Conference, Copenhagen, Denmark, 10–11 October 2012. [Google Scholar]
- O’Donovan, A.; Delaney, F.; O’Sullivan, P. Indoor environmental quality evaluation of lecture room environments: Changes due to infectious disease risk management. In Proceedings of the Comfort at the Extremes, Edinburgh, Scotland, UK, 5–6 September 2022. [Google Scholar]


| Room | 1 | 2 | 3 | 4 | 5 | 6 | 7 | 8 | 9 |
|---|---|---|---|---|---|---|---|---|---|
| Survey period | Apr | Apr | May | Sep | May | May | May | Sep | Apr |
| Outdoor temperature, °C | 15.6 | 16.1 | 19.2 | 17.3 | 18.5 | 18.1 | 19.7 | 17.4 | 15.6 |
| Number of points | 8 | 8 | 8 | 8 | 8 | 7 | 9 | 9 | 9 |
| Stand | No | No | No | No | No | No | No | No | No |
| Windows | Yes | Yes | Yes | Yes | Yes | Yes | Yes | Yes | Yes |
| Questionnaire number | 22 | 30 | 34 | 23 | 27 | 35 | 53 | 42 | 50 |
| Measurement No. | Measurement Point | Height from Floor, m | Temperature, °C | Air Speed, m/s | Relative Humidity, % | CO2 Concentration, ppm |
|---|---|---|---|---|---|---|
| 1 | 1 | 0.1 | 28.0 | 0.09 | 32.5 | 390 |
| 0.6 | 28.5 | 0.09 | 32.6 | 398 | ||
| 1.7 | 29.0 | 0.09 | 32.5 | 400 | ||
| 2 | 0.1 | 26.0 | 0.09 | 29.9 | 385 | |
| 0.6 | 26.3 | 0.09 | 29.9 | 385 | ||
| 1.7 | 26.9 | 0.09 | 29.9 | 385 | ||
| 3 | 0.1 | 26.0 | 0.10 | 28.7 | 385 | |
| 0.6 | 26.1 | 0.09 | 28.5 | 385 | ||
| 1.7 | 26.5 | 0.10 | 28.7 | 385 | ||
| 4 | 0.1 | 24.8 | 0.09 | 28.1 | 385 | |
| 0.6 | 25.0 | 0.10 | 28.1 | 385 | ||
| 1.7 | 25.2 | 0.09 | 28.1 | 385 | ||
| 5 | 0.1 | 23.5 | 0.11 | 29.9 | 392 | |
| 0.6 | 23.5 | 0.10 | 29.9 | 390 | ||
| 1.7 | 23.7 | 0.09 | 29.9 | 392 | ||
| 6 | 0.1 | 23.7 | 0.09 | 35.4 | 420 | |
| 0.6 | 23.7 | 0.09 | 35.6 | 425 | ||
| 1.7 | 23.8 | 0.09 | 35.8 | 427 | ||
| 7 | 0.1 | 23.1 | 0.09 | 30.4 | 404 | |
| 0.6 | 23.5 | 0.10 | 30.6 | 400 | ||
| 1.7 | 23.9 | 0.09 | 30.7 | 412 | ||
| 8 | 0.1 | 22.6 | 0.09 | 30.0 | 463 | |
| 0.6 | 22.8 | 0.09 | 30.6 | 460 | ||
| 1.7 | 22.8 | 0.09 | 30.3 | 475 | ||
| 2 | 1 | 0.1 | 28.2 | 0.10 | 32.8 | 398 |
| 0.6 | 28.2 | 0.09 | 33.0 | 400 | ||
| 1.7 | 29.3 | 0.09 | 32.9 | 420 | ||
| 2 | 0.1 | 26.2 | 0.09 | 30.0 | 400 | |
| 0.6 | 26.8 | 0.10 | 29.9 | 405 | ||
| 1.7 | 27.3 | 0.09 | 29.2 | 403 | ||
| 3 | 0.1 | 26.2 | 0.09 | 29.1 | 390 | |
| 0.6 | 26.0 | 0.09 | 28.8 | 392 | ||
| 1.7 | 26.3 | 0.09 | 28.8 | 402 | ||
| 4 | 0.1 | 24.9 | 0.10 | 28.7 | 387 | |
| 0.6 | 24.9 | 0.09 | 28.5 | 392 | ||
| 1.7 | 25.2 | 0.09 | 28.5 | 393 | ||
| 5 | 0.1 | 24.0 | 0.09 | 29.5 | 412 | |
| 0.6 | 24.3 | 0.10 | 29.0 | 420 | ||
| 1.7 | 24.2 | 0.11 | 28.8 | 418 | ||
| 6 | 0.1 | 24.2 | 0.09 | 35.4 | 458 | |
| 0.6 | 24.0 | 0.09 | 35.4 | 450 | ||
| 1.7 | 24.3 | 0.09 | 35.2 | 451 | ||
| 7 | 0.1 | 23.5 | 0.10 | 30.2 | 417 | |
| 0.6 | 23.7 | 0.09 | 30.7 | 413 | ||
| 1.7 | 23.9 | 0.09 | 30.0 | 429 | ||
| 8 | 0.1 | 22.8 | 0.10 | 30.2 | 475 | |
| 0.6 | 23.0 | 0.10 | 29.8 | 490 | ||
| 1.7 | 22.9 | 0.09 | 29.7 | 492 | ||
| 3 | 1 | 0.1 | 29.0 | 0.09 | 32.5 | 405 |
| 0.6 | 29.0 | 0.09 | 32.3 | 413 | ||
| 1.7 | 28.6 | 0.09 | 32.3 | 422 | ||
| 2 | 0.1 | 26.7 | 0.09 | 29.8 | 401 | |
| 0.6 | 26.8 | 0.09 | 29.8 | 407 | ||
| 1.7 | 26.9 | 0.09 | 28.3 | 408 | ||
| 3 | 0.1 | 26.9 | 0.09 | 28.6 | 405 | |
| 0.6 | 27.1 | 0.09 | 28.9 | 418 | ||
| 1.7 | 27.2 | 0.09 | 28.7 | 425 | ||
| 4 | 0.1 | 24.8 | 0.09 | 28.1 | 385 | |
| 0.6 | 25.3 | 0.09 | 27.7 | 395 | ||
| 1.7 | 25.3 | 0.09 | 27.6 | 396 | ||
| 5 | 0.1 | 24.3 | 0.09 | 29.5 | 423 | |
| 0.6 | 24.3 | 0.09 | 29.0 | 421 | ||
| 1.7 | 24.4 | 0.10 | 28.6 | 420 | ||
| 6 | 0.1 | 24.2 | 0.09 | 35.6 | 465 | |
| 0.6 | 24.1 | 0.10 | 35.7 | 463 | ||
| 1.7 | 24.1 | 0.10 | 35.0 | 470 | ||
| 7 | 0.1 | 23.6 | 0.09 | 29.7 | 424 | |
| 0.6 | 23.6 | 0.09 | 29.5 | 427 | ||
| 1.7 | 23.8 | 0.09 | 29.7 | 439 | ||
| 8 | 0.1 | 23.0 | 0.09 | 30.0 | 502 | |
| 0.6 | 23.0 | 0.09 | 29.7 | 506 | ||
| 1.7 | 23.1 | 0.10 | 29.7 | 499 |
| Wall 1 | Wall 2 | Wall 3 | Wall 4 | Floor | Ceiling | |
|---|---|---|---|---|---|---|
| Width, m | 6.4 | 8.5 | 6.4 | 8.5 | 6.4 | |
| Height, m | 3.6 | 8.5 | ||||
| Square, m | 23.0 | 30.6 | 23.0 | 30.6 | 54.4 | |
| Surface temperature, °C | 26.4 | 26.9 | 27.2 | 26.1 | 24.7 | 27.9 |
| Room | Measurement | Temperature, °C | Overall Temperature, °C | Relative Humidity, % | Overall Relative Humidity, % | Air Speed, m/s | Overall Air Speed, m/s | CO2 Concentration, ppm | Overall CO2 Concentration, ppm |
|---|---|---|---|---|---|---|---|---|---|
| 1 | 1 | 25.0 | 25.2 | 30.7 | 30.5 | 0.09 | 0.09 | 405 | 419 |
| 2 | 25.2 | 30.6 | 0.09 | 421 | |||||
| 3 | 25.4 | 30.3 | 0.09 | 431 | |||||
| 2 | 1 | 24.7 | 24.9 | 27.3 | 27.9 | 0.09 | 0.09 | 392 | 402 |
| 2 | 24.9 | 28.0 | 0.09 | 403 | |||||
| 3 | 25.1 | 28.5 | 0.09 | 410 | |||||
| 3 | 1 | 24.9 | 25.0 | 32.8 | 32.9 | 0.09 | 0.09 | 416 | 421 |
| 2 | 25.0 | 32.9 | 0.09 | 422 | |||||
| 3 | 25.1 | 33.0 | 0.09 | 425 | |||||
| 4 | 1 | 26.9 | 27.0 | 34.6 | 34.9 | 0.09 | 0.09 | 904 | 912 |
| 2 | 27.0 | 34.9 | 0.09 | 913 | |||||
| 3 | 27.1 | 35.3 | 0.09 | 920 | |||||
| 5 | 1 | 24.7 | 24.9 | 30.9 | 30.7 | 0.09 | 0.09 | 544 | 527 |
| 2 | 24.9 | 30.5 | 0.09 | 513 | |||||
| 3 | 25.0 | 30.7 | 0.09 | 526 | |||||
| 6 | 1 | 24.3 | 24.4 | 65.7 | 63.0 | 0.09 | 0.09 | 513 | 509 |
| 2 | 24.9 | 62.3 | 0.09 | 517 | |||||
| 3 | 24.6 | 61.0 | 0.10 | 498 | |||||
| 7 | 1 | 24.6 | 25.0 | 37.4 | 38.8 | 0.09 | 0.09 | 787 | 803 |
| 2 | 24.9 | 36.4 | 0.09 | 792 | |||||
| 3 | 25.4 | 42.5 | 0.09 | 831 | |||||
| 8 | 1 | 23.4 | 23.7 | 55.0 | 52.6 | 0.10 | 0.10 | 431 | 435 |
| 2 | 23.7 | 50.9 | 0.09 | 418 | |||||
| 3 | 23.9 | 52.0 | 0.10 | 457 | |||||
| 9 | 1 | 24.5 | 24.9 | 39.5 | 40.1 | 0.10 | 0.10 | 463 | 509 |
| 2 | 25.0 | 40.5 | 0.10 | 526 | |||||
| 3 | 25.0 | 40.2 | 0.10 | 538 |
| Room 1 | Room 2 | Room 3 | Room 4 | Room 5 | Room 6 | |
| Radiant temperature, °C | 26.5 | 24.6 | 24.4 | 26.2 | 24.0 | 22.7 |
| Room 7 | Room 8 | Room 9 | ||||
| Radiant temperature, °C | 26.7 | 22.7 | 23.7 |
| Room 1 | Room 2 | Room 3 | Room 4 | Room 5 | Room 6 | |
| Resulting temperature, °C | 25.9 | 24.8 | 24.7 | 26.6 | 24.5 | 23.6 |
| Room 7 | Room 8 | Room 9 | ||||
| Resulting temperature, °C | 25.9 | 23.2 | 24.3 |
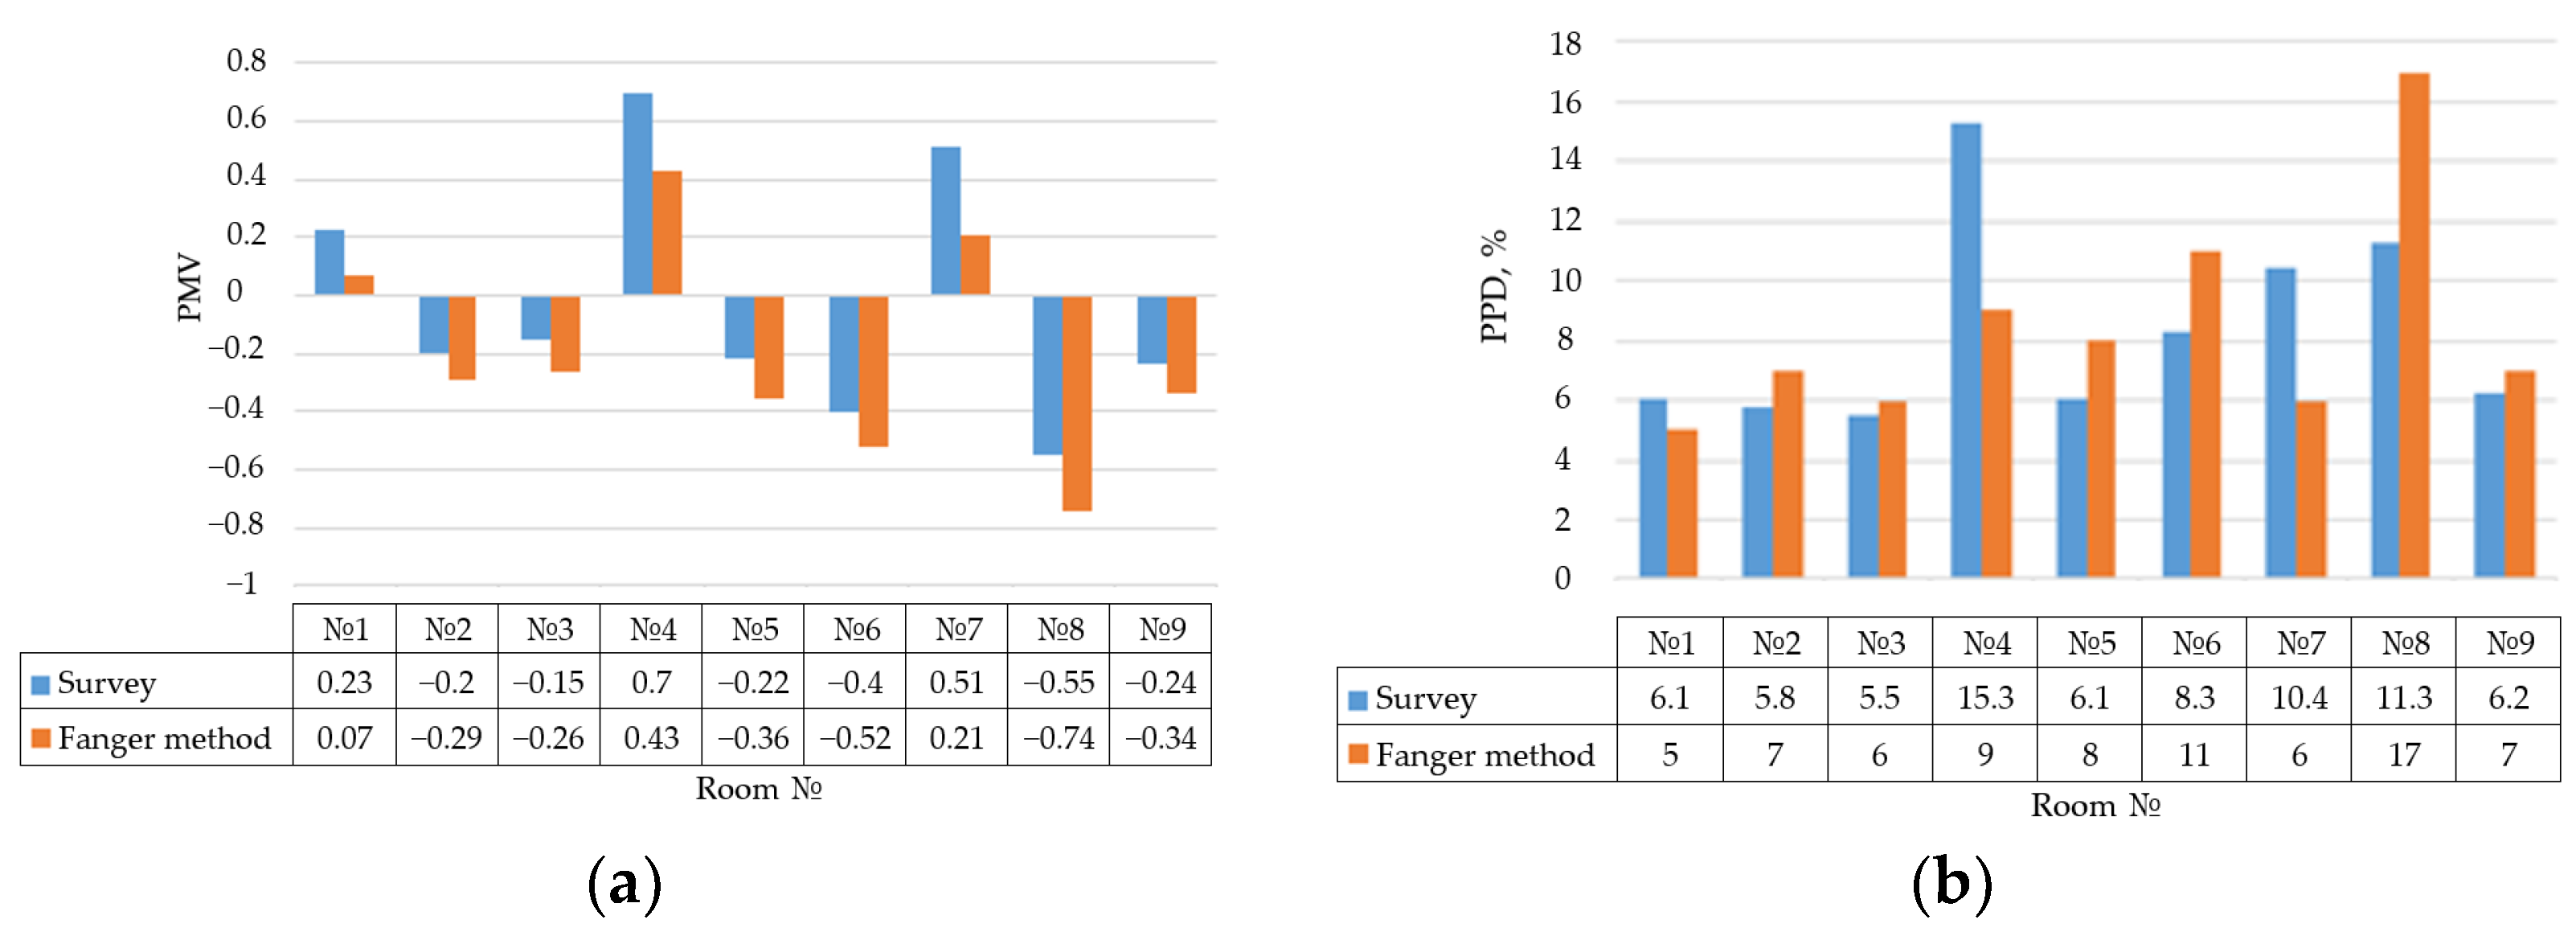
| Room | PMV Value | PPD Value, % | PD Value, % |
|---|---|---|---|
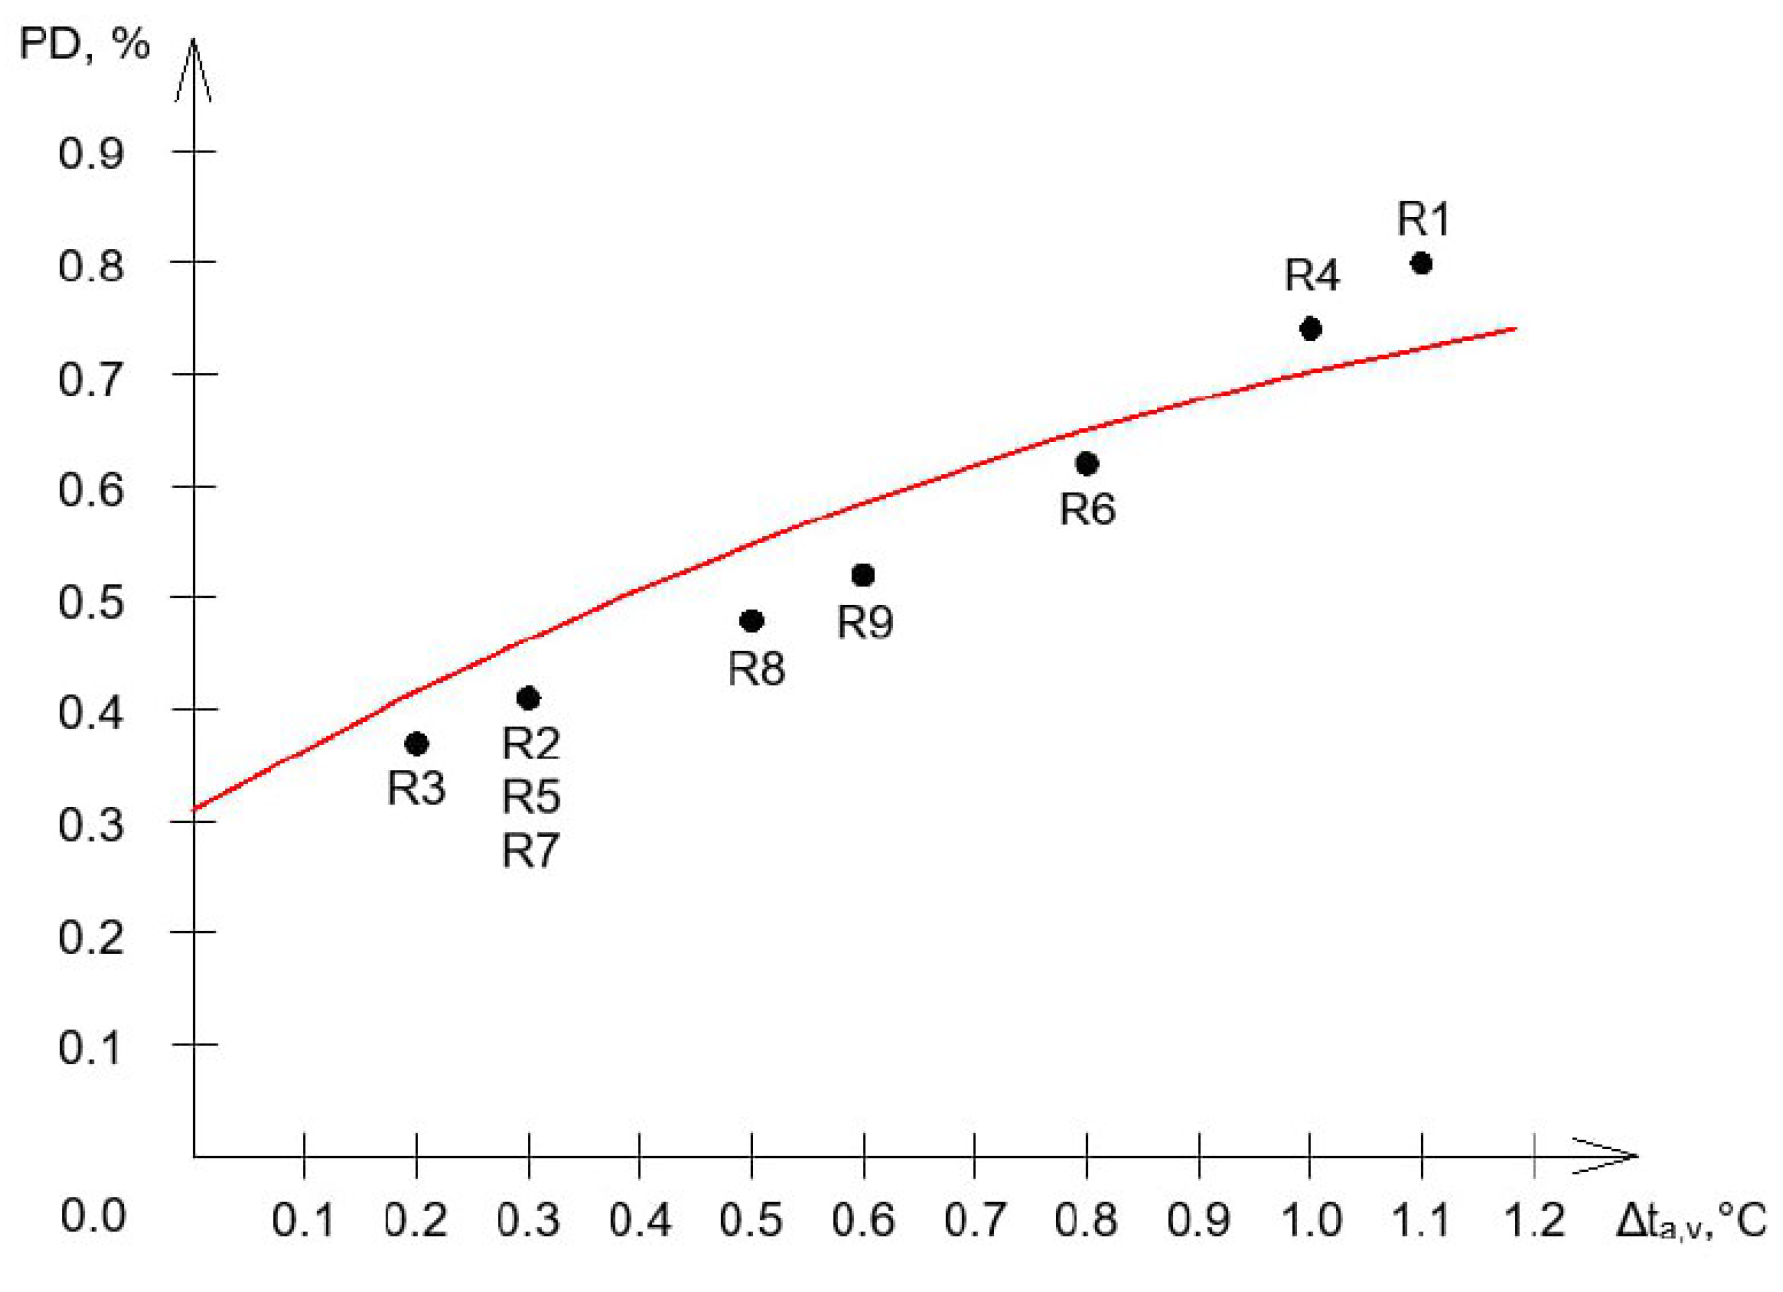
| 1 | 0.07 | 5 | <0.80 |
| 2 | −0.29 | 7 | <0.41 |
| 3 | −0.26 | 6 | <0.37 |
| 4 | 0.43 | 9 | <0.74 |
| 5 | −0.36 | 8 | <0.41 |
| 6 | −0.52 | 11 | <0.62 |
| 7 | 0.21 | 6 | <0.41 |
| 8 | −0.74 | 17 | <0.48 |
| 9 | −0.34 | 7 | <0.52 |
| Room No. | Location | Type of Clothing | Thermal Sensations | ||||||||||
|---|---|---|---|---|---|---|---|---|---|---|---|---|---|
| By the Window | In the Center | Away From the Window | T-Shirt | Long-Sleeved Shirt | Sweatshirt | Cold | Cool | Slightly Cool | Neutral | Slightly Warm | Warm | Hot | |
| 1 | 5 | 10 | 7 | 5 | 9 | 8 | 0 | 2 | 3 | 8 | 6 | 3 | 0 |
| 2 | 10 | 13 | 7 | 7 | 10 | 13 | 2 | 5 | 5 | 9 | 4 | 4 | 1 |
| 3 | 11 | 13 | 10 | 8 | 11 | 15 | 2 | 4 | 8 | 10 | 5 | 3 | 2 |
| 4 | 7 | 5 | 11 | 0 | 7 | 16 | 0 | 1 | 4 | 5 | 4 | 9 | 0 |
| 5 | 7 | 12 | 8 | 6 | 9 | 12 | 0 | 4 | 9 | 6 | 5 | 3 | 0 |
| 6 | 9 | 13 | 13 | 20 | 11 | 4 | 0 | 8 | 6 | 15 | 4 | 2 | 0 |
| 7 | 17 | 16 | 20 | 4 | 15 | 34 | 1 | 3 | 2 | 25 | 9 | 10 | 3 |
| 8 | 19 | 13 | 10 | 15 | 21 | 6 | 1 | 9 | 9 | 17 | 5 | 1 | 0 |
| 9 | 14 | 26 | 10 | 11 | 14 | 25 | 2 | 7 | 13 | 15 | 6 | 6 | 1 |
| Total | |||||||||||||
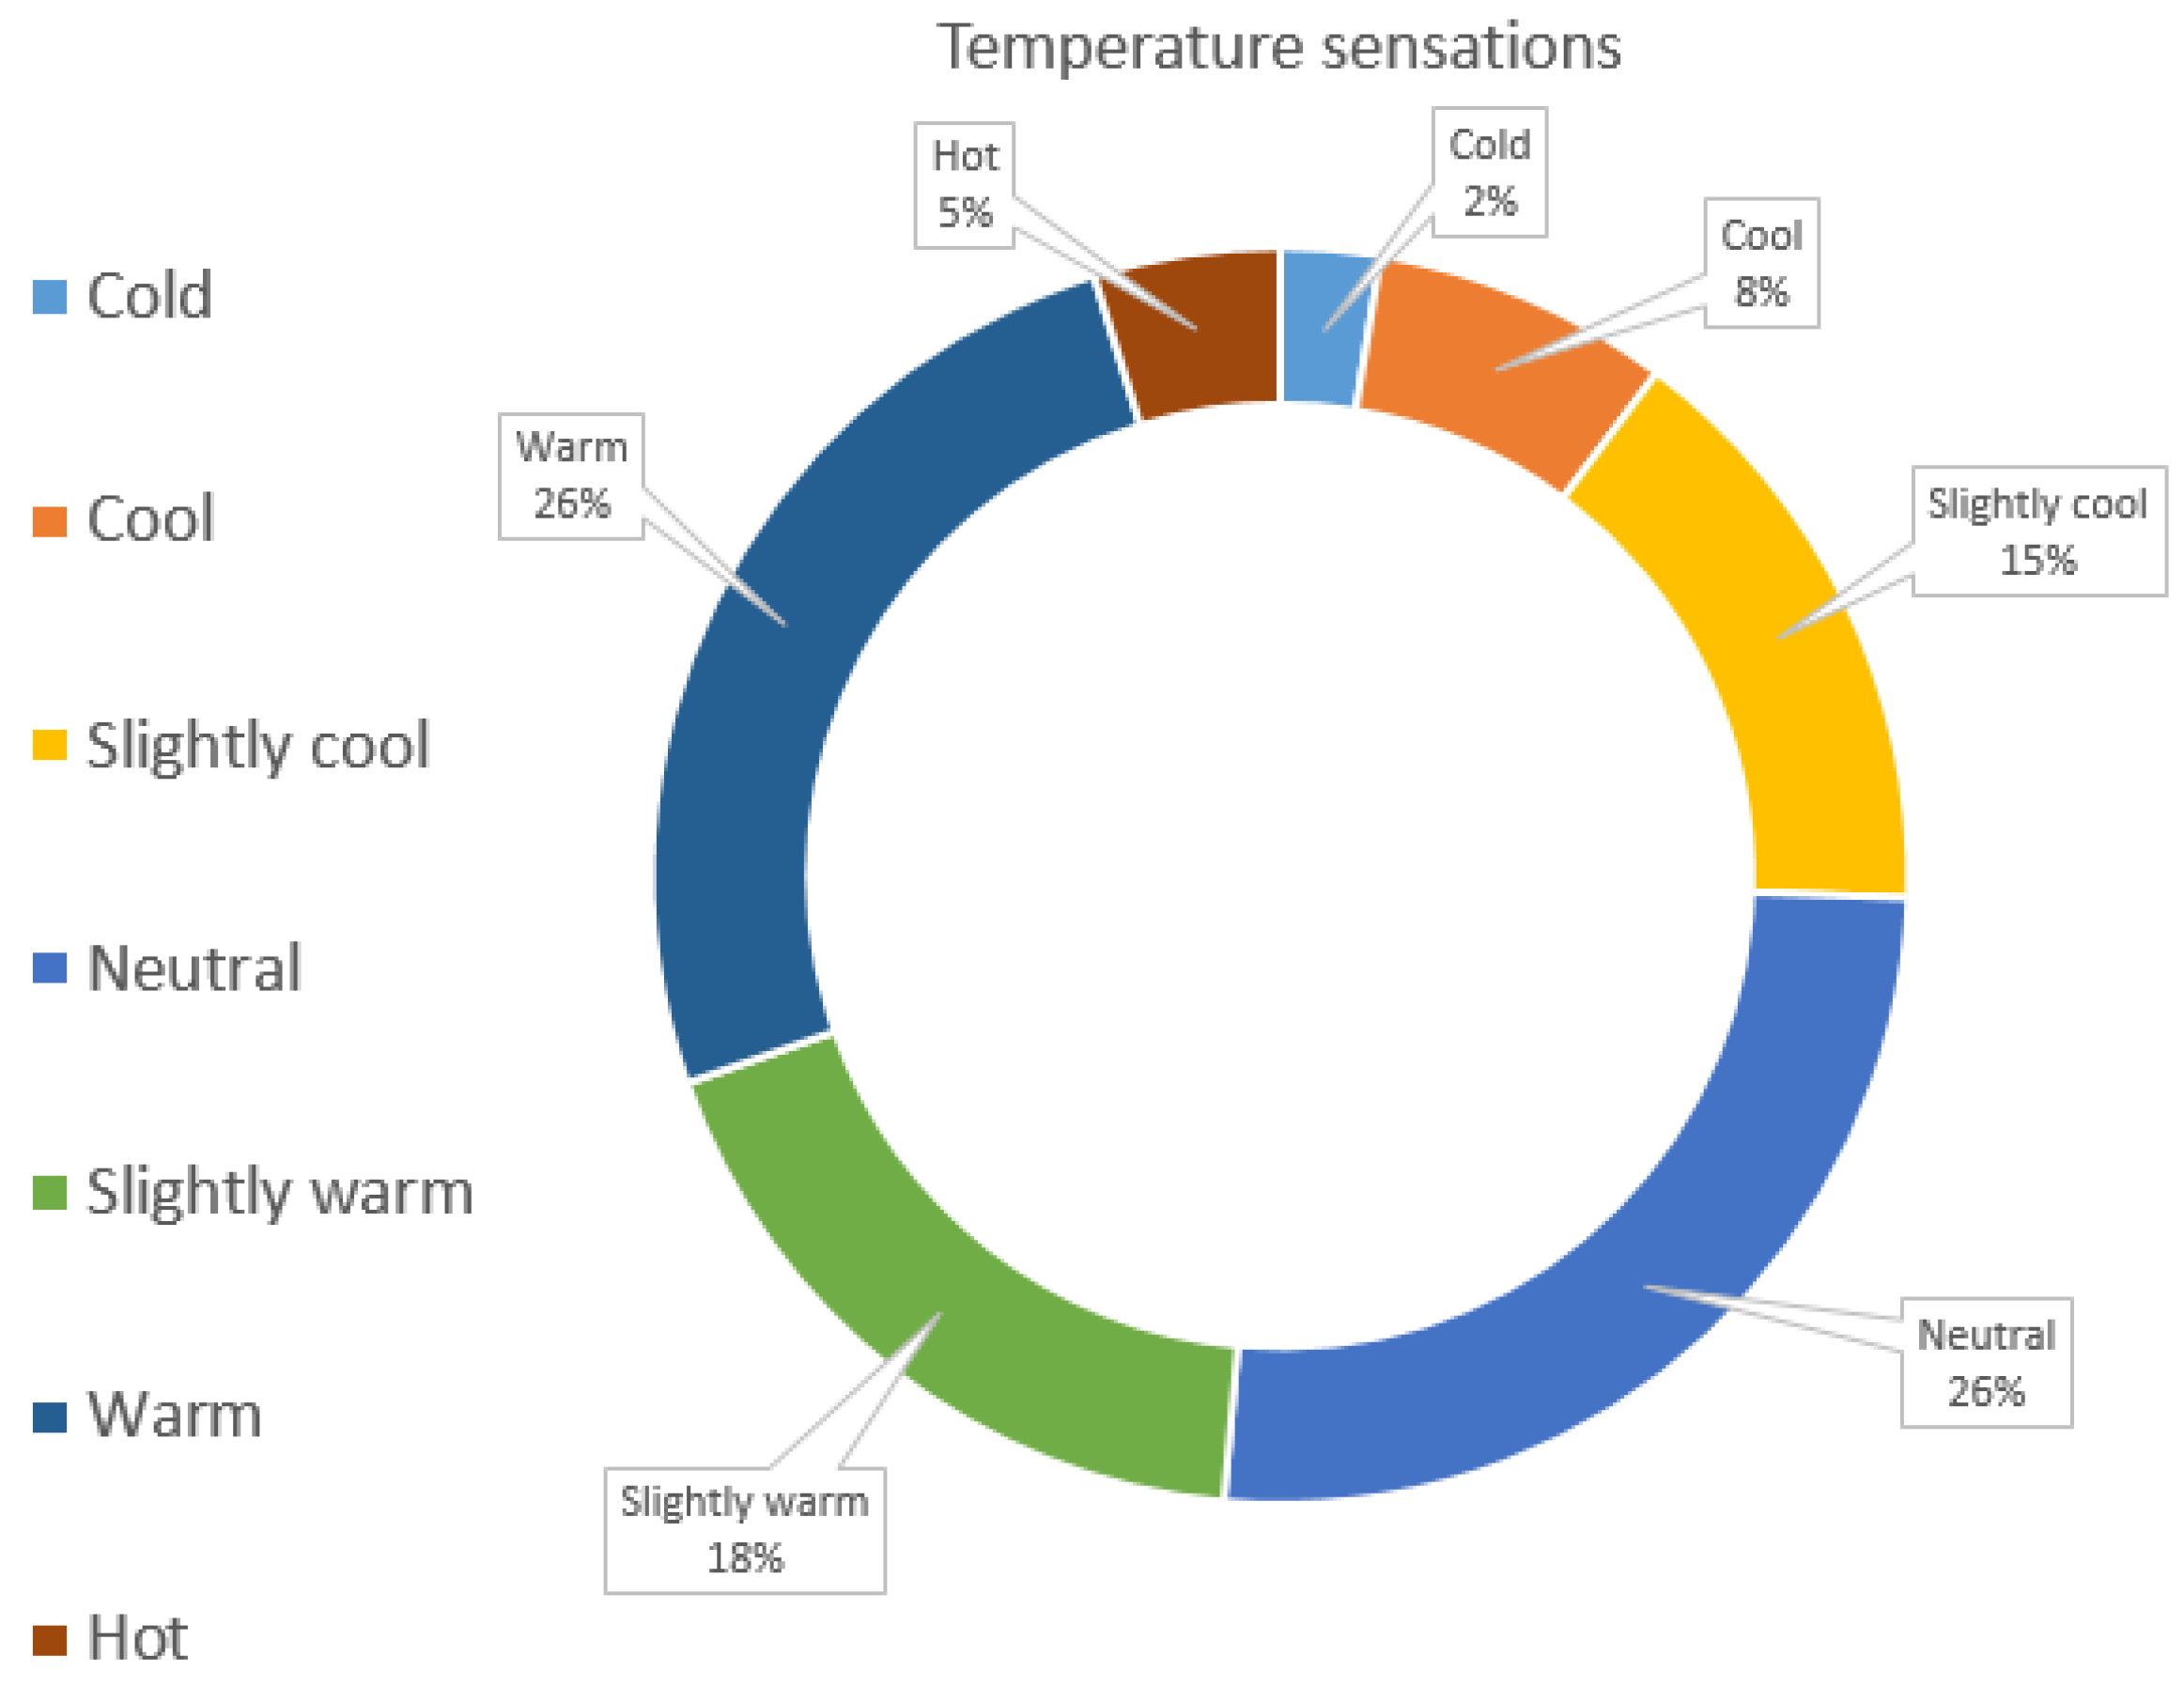
| 76 | 107 | 133 | 8 | 43 | 59 | 110 | 48 | 41 | 7 | ||||
| Room | PMV Value | PPD Value, % |
|---|---|---|
| 1 | 0.23 | 6.1 |
| 2 | −0.20 | 5.8 |
| 3 | −0.15 | 5.5 |
| 4 | 0.70 | 15.3 |
| 5 | −0.22 | 6.1 |
| 6 | −0.40 | 8.3 |
| 7 | 0.51 | 10.4 |
| 8 | −0.55 | 11.3 |
| 9 | −0.24 | 6.2 |
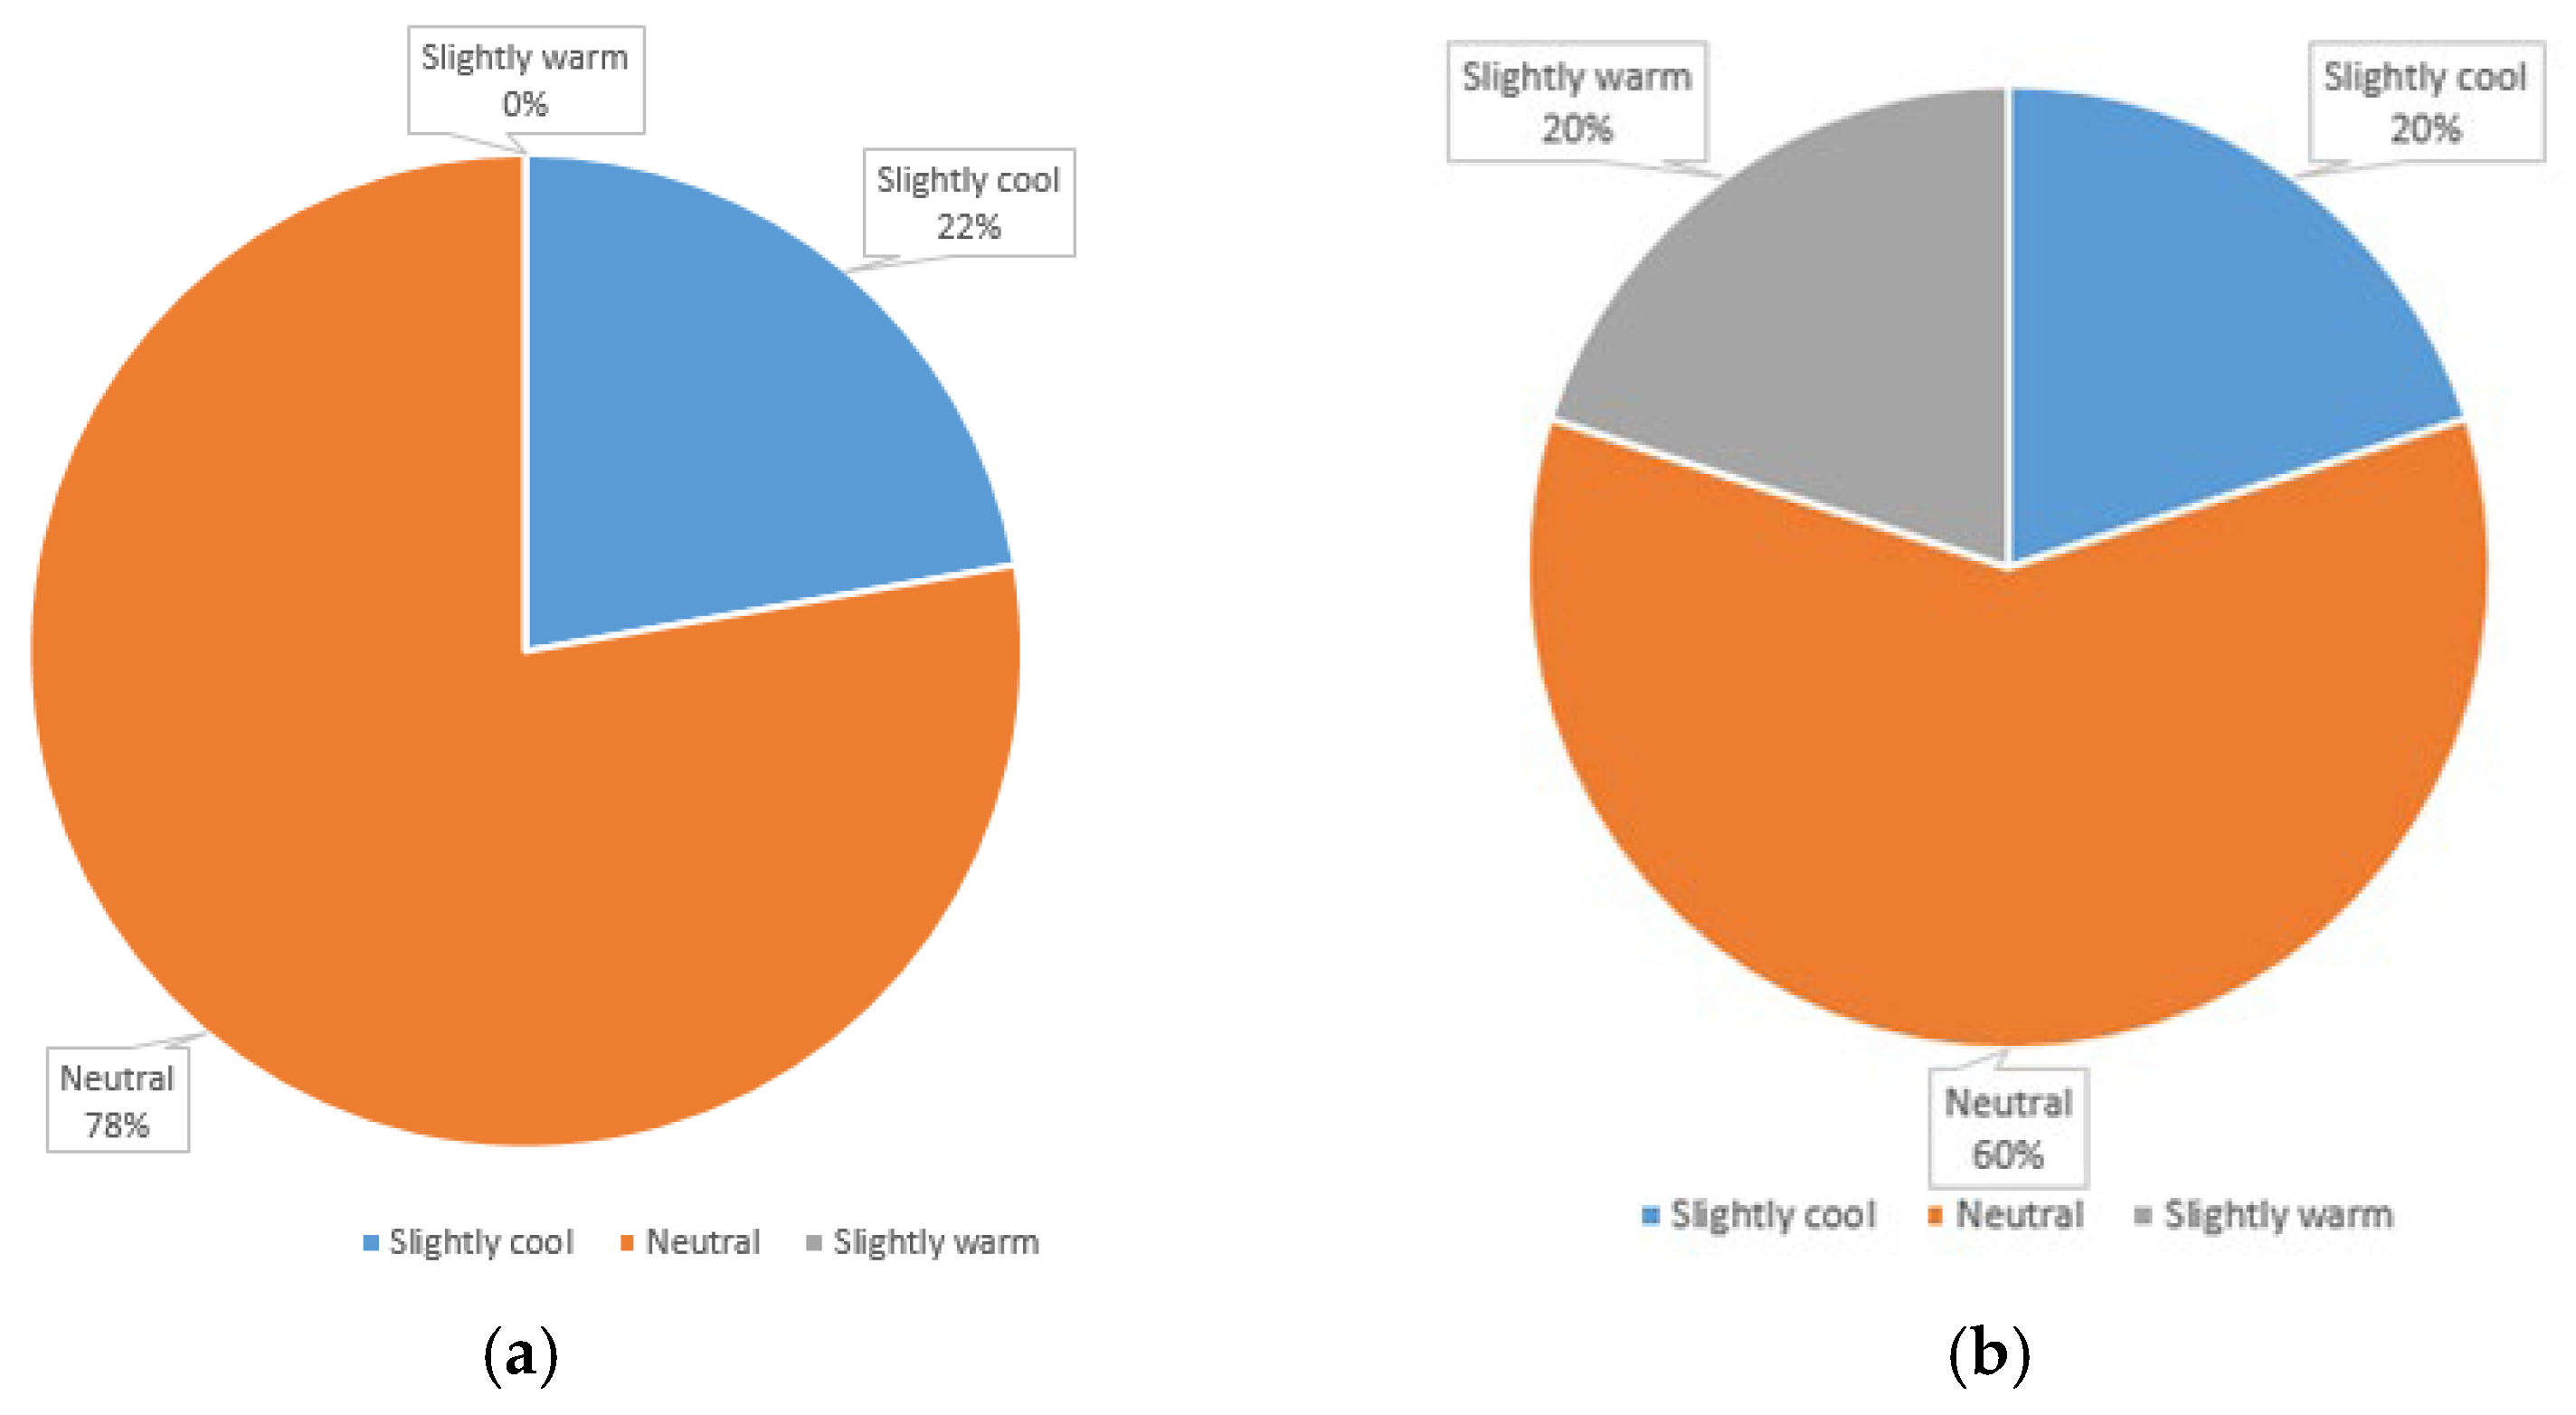
| Calculation Method | Room 5 | Room 7 |
|---|---|---|
| Method 1 | −0.22 | 0.51 |
| Method 2 | −0.36 | 0.21 |
| Method 3 | −0.3/−0.4 | 0.2/0.28 |
| Room | Microclimatic Parameters | Thermal Sensations Obtained by Calculator Based on Measurements (ASHRAE 55) | Real Thermal Sensations Obtained by Survey | ||
|---|---|---|---|---|---|
| Name, Unit of Measurement | ASHRAE 55 (Ideal Conditions) | Real | |||
| 1 | Temperature, °C | 19–21 | 25.2 | Neutral (PMV1 = 0.07 PPD1 = 5%) | Neutral (PMV2 = 0.23 PPD2 = 6.1%) |
| Air speed, m/s | 0.2–0.3 | 0.09 | |||
| Relative humidity, % | 30–45 | 30.5 | |||
| CO2 concentration, ppm | 500–600 | 419 | |||
| 2 | Temperature, °C | 19–21 | 24.9 | Neutral (PMV1 = −0.29 PPD1 = 7%) | Neutral (PMV2 = −0.20 PPD2 = 5.8%) |
| Air speed, m/s | 0.2–0. | 0.09 | |||
| Relative humidity, % | 30–45% | 27.9 | |||
| CO2 concentration, ppm | 500–600 | 402 | |||
| 3 | Temperature, °C | 19–21 | 25.0 | Neutral (PMV1 = −0.26 PPD1 = 6%) | Neutral (PMV2 = −0.15 PPD2 = 5.5%) |
| Air speed, m/s | 0.2–0.3 | 0.09 | |||
| Relative humidity, % | 30–45 | 32.9 | |||
| CO2 concentration, ppm | 500–600 | 421 | |||
| 4 | Temperature, °C | 19–21 | 27.0 | Neutral (PMV1 = 0.43 PPD1 = 9%) | Slightly warm (PMV2 = 0.70 PPD2 = 15.3%) |
| Air speed, m/s | 0.2–0.3 | 0.09 | |||
| Relative humidity, % | 30–45 | 34.9 | |||
| CO2 concentration, ppm | 500–600 | 912 | |||
| 5 | Temperature, °C | 19–21 | 24.9 | Neutral (PMV1 = −0.36 PPD1 = 8%) | Neutral (PMV2 = −0.22 PPD2 = 6.1%) |
| Air speed, m/s | 0.2–0.3 | 0.09 | |||
| Relative humidity, % | 30–45 | 30.7 | |||
| CO2 concentration, ppm | 500–600 | 527 | |||
| 6 | Temperature, °C | 19–21 | 24.4 | Slightly cool (PMV1 = −0.52 PPD1 = 11%) | Neutral (PMV2 = −0.40 PPD2 = 8.3%) |
| Air speed, m/s | 0.2–0.3 | 0.09 | |||
| Relative humidity, % | 30–45 | 63.0 | |||
| CO2 concentration, ppm | 500–600 | 509 | |||
| 7 | Temperature, °C | 19–21 | 25.0 | Neutral (PMV1 = 0.21 PPD1 = 6%) | Slightly warm (PMV2 = 0.51 PPD2 = 10.4%) |
| Air speed, m/s | 0.2–0.3 | 0.09 | |||
| Relative humidity, % | 30–45 | 38.8 | |||
| CO2 concentration, ppm | 500–600 | 580 | |||
| 8 | Temperature, °C | 19–21 | 23.7 | Slightly cool (PMV1 = −0.74 PPD1 = 17%) | Slightly cool (PMV2 = −0.55 PPD2 = 11.3%) |
| Air speed, m/s | 0.2–0.3 | 0.10 | |||
| Relative humidity, % | 30–45 | 52.6 | |||
| CO2 concentration, ppm | 500–600 | 435 | |||
| 9 | Temperature, °C | 19–21 | 24.9 | Neutral (PMV1 = −0.34 PPD1 = 7%) | Neutral (PMV2 = −0.24 PPD2 = 6.2%) |
| Air speed, m/s | 0.2–0.3 | 0.10 | |||
| Relative humidity, % | 30–45 | 40.1 | |||
| CO2 concentration, ppm | 500–600 | 509 | |||
| Calculation Method | PMVmean ± SD | PPDmean ± SD |
|---|---|---|
| Based on measurements | −0.20 ± 0.37 | 8.44 ± 3.68 |
| Based on survey | −0.04 ± 0.42 | 8.33 ± 3.36 |
Disclaimer/Publisher’s Note: The statements, opinions and data contained in all publications are solely those of the individual author(s) and contributor(s) and not of MDPI and/or the editor(s). MDPI and/or the editor(s) disclaim responsibility for any injury to people or property resulting from any ideas, methods, instructions or products referred to in the content. |
© 2024 by the authors. Licensee MDPI, Basel, Switzerland. This article is an open access article distributed under the terms and conditions of the Creative Commons Attribution (CC BY) license (https://creativecommons.org/licenses/by/4.0/).
Share and Cite
Strelets, K.; Zaborova, D.; Serbin, I.; Petrochenko, M.; Zavodnova, E. Analysis of Microclimatic Comfort Conditions in University Classrooms. Sustainability 2024, 16, 3388. https://doi.org/10.3390/su16083388
Strelets K, Zaborova D, Serbin I, Petrochenko M, Zavodnova E. Analysis of Microclimatic Comfort Conditions in University Classrooms. Sustainability. 2024; 16(8):3388. https://doi.org/10.3390/su16083388
Chicago/Turabian StyleStrelets, Ksenia, Daria Zaborova, Ilya Serbin, Marina Petrochenko, and Evgeniia Zavodnova. 2024. "Analysis of Microclimatic Comfort Conditions in University Classrooms" Sustainability 16, no. 8: 3388. https://doi.org/10.3390/su16083388
APA StyleStrelets, K., Zaborova, D., Serbin, I., Petrochenko, M., & Zavodnova, E. (2024). Analysis of Microclimatic Comfort Conditions in University Classrooms. Sustainability, 16(8), 3388. https://doi.org/10.3390/su16083388