1. Introduction
During the last few decades, human dynamics, institutional change, political relations and the global environment have become successively more intertwined. This increased global economic integration, global forms of governance, globally inter-linked social and environmental developments are often referred to as globalisation. However, depending on the researcher or commentator, it can mean the growing integration of markets and nation-states and the spread of technological advancements [
1]; receding geographical constraints on social and cultural arrangements [
2]; the increased dissemination of ideas and technologies [
3]; the threat to national sovereignty by trans-national actors [
4]; or the transformation of the economic, political and cultural foundations of societies [
5]. During the transition to greater globalization, risks may arise as application of new economic methodologies outpaces their understanding and control. A high globalization speed may also generate opportunities for speculation, uncertainty, and risk [
6].
For many commentators there is little doubt that globalisation has produced significant gains at the global level [
7]. Foreign trade in goods and services, capital, technology and labour all move more freely across borders. In addition to economic gains, there have been significant benefits in the areas of culture and governance [
8]. Public awareness of issues such as human rights, democracy and gender equality has increased significantly because of the greater access to newspapers, radio, television, telephones, computers and the internet. These developments have arguably led to improved allocative efficiency that, in turn, enhances growth and human development [
9].
At the same time, globalisation is also perceived as creating new threats: to individuals, societies and eco-systems. There are fears that it may exacerbate the gap between rich and poor—both within and across countries—creating new threats to human security in terms of financial volatility, political and cultural insecurity and environmental degradation. In other words, the beneficial, innovative and dynamic aspects of globalisation are being tempered, and according to some more than offset, by forces that create disruption and marginalisation, such as population growth and migration, the emergence of infectious diseases, widening disparities in development world-wide, climate change, an accelerating loss of bio-diversity and the scarcity and pollution of fresh-water resources [
10].
The sustainability of globalisation may or may not be in the same direction for all nations. Some countries may experience an improved local environment as a result of the globalisation process whereas others experience a deteriorating one [
11]. The same applies for social or economic effects of the globalisation process. Furthermore, sustainable development in one ‘domain’ may not necessarily related to a sustainable development in another domain and what is sustainable for a country may be not for the global environment [
12]. Of course, the globalisation result that most would want is one in which globally the environment, societies and the economic system develops sustainably, and all local ‘environments’ improve as well as the welfare of all nations. However, globalisation is unlikely to achieve of these objectives simultaneously [
12].
This complexity of the globalisation processes calls therefore for a truly integrated approach, combining social, economic and ecological aspects. In a globalising world policy-makers should be aware of the developments that take place simultaneously in the different domains, and the increasing interconnectedness needs to be the starting point for sustainable global policies. If consumerism and global economic processes do have polluting side-effects, it needs to be asked which direction these dynamics need to take for a sustainable future. The long-existing ‘environment
versus growth’ tension can be exposed, for which the term ‘sustainable development’ has been coined. The demands for environmental protection and economic development are said to be competing. Some claim an eternal competition, while others emphasise a possible win-win situation [
13].
Although there are many ways to describe the complexity of the processes related to globalisation, in this paper we used an indicator-based approach [
14]. To answer questions about the overall impact of globalisation, and to evaluate the consequences of globalisation in a rational and scientific manner, in this paper, we link the Maastricht Globalisation Index with Sustainability, Environmental, Responsible Competiveness and Human Development Indices to analyse if more globalised countries are doing better in terms of sustainable development and its dimensions.
2. The Maastricht Globalisation Index
In this section, we briefly describe the Maastricht Globalisation Index (MGI) [
14]. The Maastricht Globalisation Index or the “MGI” was developed by [
15] and [
16] to improve upon the existing indices. Reflecting the need for a balance between broad coverage, data availability and quality motivated the following choice of indicators (see
Table 1), with data for 117 countries (see
Figure 1).
Table 1.
Maastricht Globalisation Index (MGI) variables.
Table 1.
Maastricht Globalisation Index (MGI) variables.
| Category | Variable name | Variable definition |
|---|
| Political Domain | Embassies | Absolute number of in-country embassies and high commissions |
| Organizations | Absolute number of memberships in international organizations |
| Military | Trade in conventional arms as a share of military spending |
| Economic domain | Trade | Imports + exports of goods and services as a share of GDP |
| FDI | Gross foreign direct stocks as a share of GDP |
| Capital | Gross private capital flows as a share of GDP |
| Social & Cultural Domain | Migrants | Those who changes their country of usual residence per 100 inhabitant |
| Tourism | International arrivals + departures per 100 inhabitants |
| Technological Domain | Phone | Incoming + outgoing international telephone traffic in minutes per capita |
| Internet | Internet users as a share of population |
| Ecological Domain | Eco footprint | Ecological deficit in global ha |
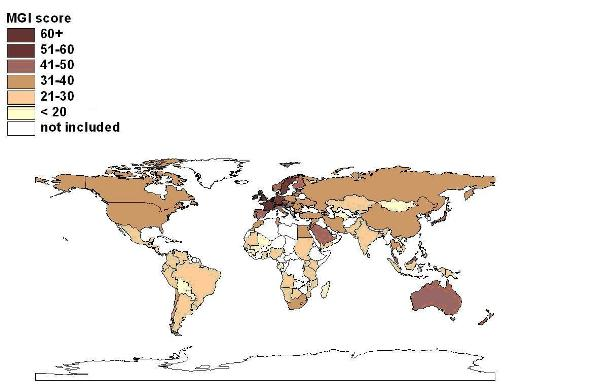
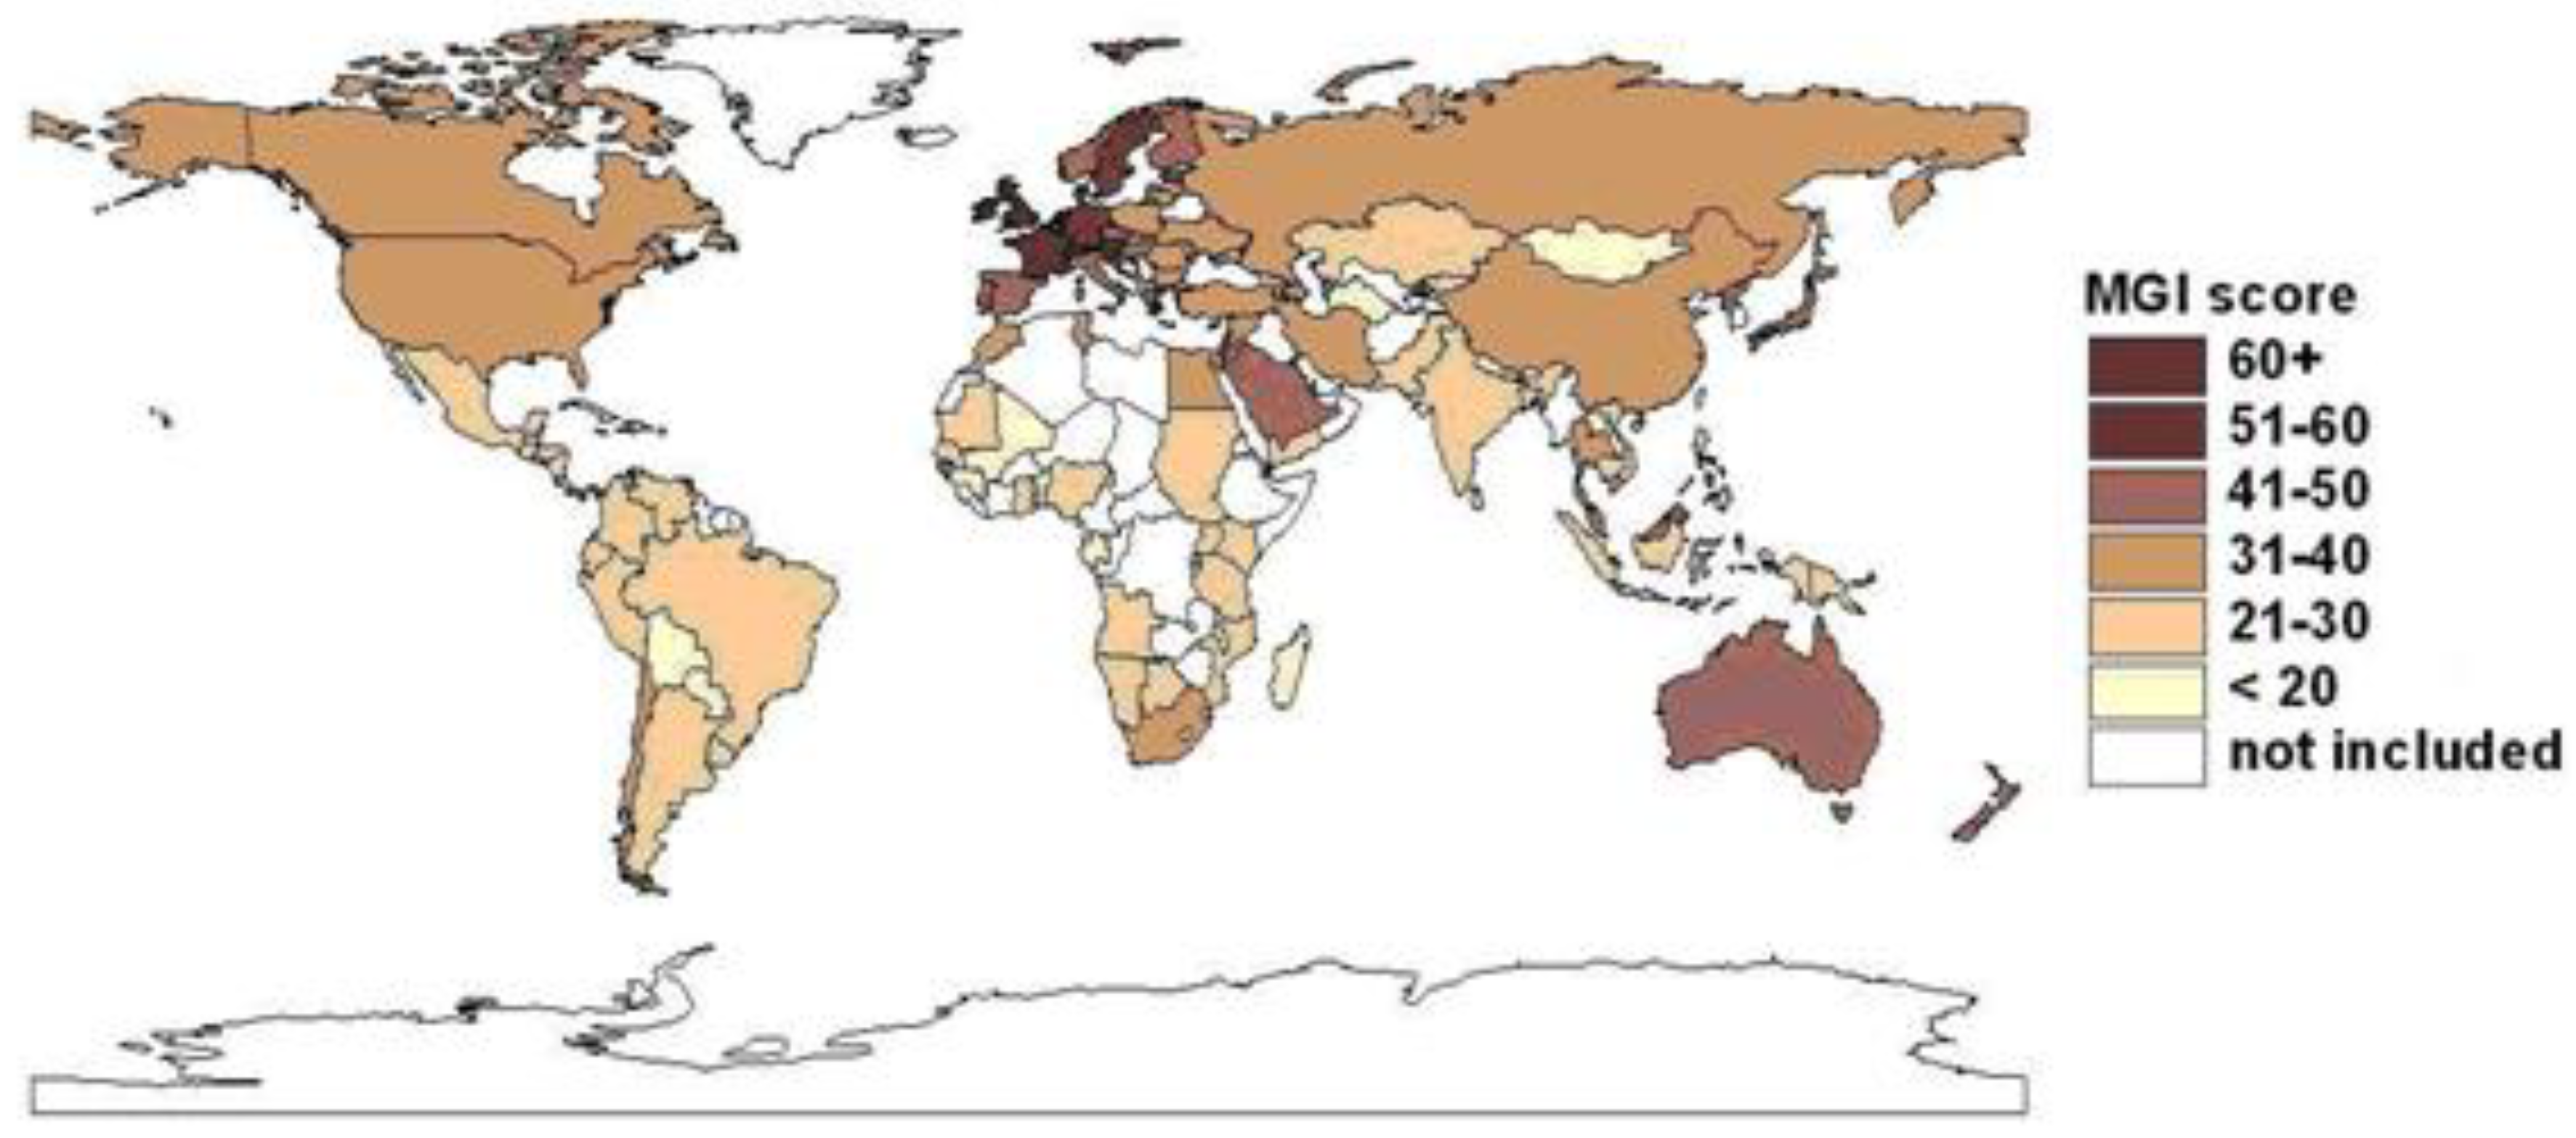
Figure 1.
Map of the MGI 2008.
Figure 1.
Map of the MGI 2008.
The MGI is constructed in a four-stage process (see also [
15,
17]) The first stage is conceptual and choices are made about which variables are most relevant and should be included in the index. In the second stage, suitable quantitative measures are identified for these variables. In the third stage, following [
18], each variable is transformed to an index with a zero to hundred scale (this differs from earlier calculations constructing the MGI [
15]). Higher values denote more globalisation. The data are then transformed—on the domain level—according to the percentiles of the base year (2000) distribution (using the formula ((V
i – V
min)/(V
max – V
min) × 100). In the last and final stage, a weighted sum of the measures is calculated to produce the final score, which is then used to rank and compare countries. The “most globalised” country has the highest score. Within each domain, every variable is equally weighted. The MGI scores are simply added,
i.e., all domains receive the same weight. In this paper we use the MGI calculated for 2008 [
19].
Several limitations in using the MGI (and in general globalisations indices) exist. Since there are missing data on the share of international linkages that are regional rather than global, it is impossible to distinguish globalisation from internationalisation and regionalisation with complete certainty. Therefore, there is an underlying assumption that countries with many international links have a correspondingly greater number of global linkages. As expected, international statistics on eleven different indicators ranging from politics and military to the environment have widely varying degrees of data quality, reflecting the different capabilities and priorities of the organisations collecting the data. Of particular concern are the domains in which the underlying data have not been collected by official international bodies like the World Bank, IMF or UN, but by private or semi-public organisations. In addition, many countries are reluctant to share information about activities related to their national security, which creates data gaps that are not easily filled.
The fact that countries with fewer international linkages tend to publish less data and are less likely to be included in international statistics biases against states that are less globalised [
20]. Additionally, despite being members of the UN and most other international bodies, countries with totalitarian or communist economic systems (e.g., North Korea, Cuba) are often excluded in international financial statistics. Therefore, this also leads to their exclusion due to lack of data. Finally, yet importantly, countries that are too small to collect internationally coherent statistics and/or are strongly integrated into the economies of their big neighbours (e.g., Luxembourg, Monaco, and Swaziland) are also missing from the statistics and therefore excluded from the MGI.
Both the sensitivity to extreme values and year-to-year variations are a major concern for the robustness of the other indices. With the methodology used to construct the MGI, the sensitivity of the index to extreme values has been sharply reduced since the distribution is now centred on the mean of a component rather than just lying somewhere between the extreme values. Similarly, the strongest year-to-year variations are filtered by the averaging process for the highly volatile components, sharply decreasing the dependence on the choice of base year in some of the component indicators. Furthermore, several weighting methods for composite indicators—like the MGI—exists, all with their own pros and cons. Regardless which weighting methods is used, weights are essential value judgments. For maximum transparency, we relied on equal weighting [
21]. We next tested the sensitivity of the weighting scheme at the domain level. With respect to the weights for the five domains tested in the sensitivity analysis, the country rankings are consistent for approximately half of the countries. Thus, the choice of the weights must be evaluated according to its analytical rationale, globalisation relevance, and implied value judgments.[
22].
3. Sustainability Indices
Sustainable development is not a single, well defined concept and various positions and perspectives exist. For a more extensive discussion, see e.g., [
23,
24]. Whichever view is propagated, it entails a normative choice. Furthermore, there has been an evolution of the concept over time from the early focus on the environmental dimension towards the current understanding that sustainable development is a process that integrates economical, environmental and societal objectives [
25]. Sustainable development is as a normative and fuzzy concept related to well-being and quality of life, that is context dependent, a result of societal preferences, and that allows for many divergent opinions to co-exist [
23,
26]. However, although sustainable development is a contested concept, the fundamentals are clear: maintaining the integrity of biophysical systems, ensuring a proper functioning economy, and improving or maintaining human wellbeing and health. For analytical purposes, in this paper, we follow the perception that sustainable development (and also globalisation) is a concept that can be operationalised by using science-based criteria and indicators.
The search for sustainability indicators continues to be framed primarily as a technical/scientific problem, rather than a political/social challenge. It should also be noted that indicators are often selected based on our
ability to measure them (a technical issue), rather than the
need to measure them (a normative issue). [
27] The search for indicators should always be preceded by the question ‘what is to be sustained’, which is a societal and normative question. Until agreement is reached on what it is that should be sustained, it is impossible to identify relevant and valid indicators.
Furthermore, many sets of indicators exist already and it seems that every year new ones are being developed; not one gives a complete and good insight into all relevant aspects of sustainability in a transparent, simple and easily understandable way, showing at a glance to what extent a society is sustainable or not [
28]. This suggests that either no single one is completely adequate or that every set serves a more or less different purpose.
For many people, the basic idea of sustainability focuses greatly on depletion of resources. Others consider that sustainability covers also (irreversible) pollution, conservation of nature and other environmental and ecological aspects. Some include the aspects of quality of human life, the human well-being. To explore the question if globalisation is sustainable, we select indices that represent different aspects of sustainable development mentioned above, as well as a general sustainable development index.
3.1. Human Development Index (HDI)
The HDI—human development index—is a summary composite index that measures a country’s average achievements in three basic aspects of human development: health, knowledge, and a decent standard of living. Health is measured by life expectancy at birth; knowledge is measured by a combination of the adult literacy rate and the combined primary, secondary, and tertiary gross enrolment ratio; and standard of living by GDP per capita (PPP US$). It is calculated for 177 countries and areas for which data is available. In addition human development indicators are presented for another 17 UN member countries for which complete data were not available. In this paper, data from the statistical update 2008 are used [
29].
3.3. GEF Benefits Index (GBI)
The Global Environment Facility (GEF) Benefits Index (GBI) is a measure of the potential of each country to generate global environmental benefits in a particular focal area. Separate indices are determined for the biodiversity and climate change focal areas. In this paper, we used the GBI for biodiversity potential, which seeks to measure the potential global benefits that can be realized from biodiversity related activities in a country. The indicator incorporates information on individual species range maps available from the IUCN for virtually all mammals (4,863), amphibians (5,915), and endangered birds (1,098); country data from the World Resources Institute for reptiles and vascular plants; country data from FishBase for 31,190 fish species; and the ecological characteristics of 867 world terrestrial ecoregions from WWF International. To combine these dimensions into one measure, the indicator uses dimensional weights that reflect the consensus of conservation scientists at the GEF, IUCN, WWF International, and other nongovernmental organizations. GEF benefits index for biodiversity is a composite index of relative biodiversity potential based on the species represented in each country and their threat status and diversity of habitat types. The index has been normalized from 0 (no biodiversity potential) to 100 (maximum biodiversity potential). Data resource used for the GEF Biodiversity (2005) is [
31].
3.4. Responsible Competitiveness Index (RCI)
Responsible competitiveness means markets that systematically and comprehensively reward business for strategies and practices that take explicit account of the social, economic and environmental impacts. Making sustainable development count in tomorrow’s markets requires political, business and civil society leaders building effective public policies, strengthening social conditions and supporting responsible markets. The Responsible Competitiveness Index (RCI) has been devised by AccountAbility in association with Brazilian business school Fundação Dom Cabral. The RCI is intended to be a robust analysis of how countries are performing in their efforts to promote responsible business practices. The 2007 index demonstrates performance in 108 countries covering over 96% of global GDP, with geographical representation on all five continents [
32].
3.5. Sustainable Society Index (SSI)
The SSI integrates various aspects of sustainability and quality of life of a national society in a simple and transparent way. Consisting of 22 indicators, grouped into 5 categories, it is based upon the definition of the Brundtland Commission, extended to the Brundtland + definition by explicitly including the social aspects of human life. The categories are: (i) personal development, (ii) clean environment, (iii) well-balanced society, (iv) sustainable use of resources, and (v) sustainable world. Using data from scientific institutes and international organizations, the SSI has been developed for 150 countries [
28].
4. Methods and Results
To give an indication of the crude association between the MGI and sustainability indices, the Spearman correlations and regression outcomes are given in
Table 2.
Table 2.
Spearman’s rho correlations for MGI and the sustainability indices.
Table 2.
Spearman’s rho correlations for MGI and the sustainability indices.
| | HDI | EPI | GBI | RCI | SSI |
|---|
| MGI | 0.795** | 0.628** | –0.291* | 0.759** | 0.170 |
| MGI domains | | | | | |
| Political | 0.447** | 0.286** | 0.086 | 0.369** | –0.051 |
| Economical | 0.413** | 0.376** | –0.404** | 0.406** | 0.202* |
| Social & cultural | 0.724** | 0.631** | –0.492** | 0.682** | 0.247** |
| Technological | 0.906** | 0.817** | –0.228* | 0.869** | 0.349** |
| Ecological | 0.356** | 0.202* | –0.311** | 0.319** | 0.021 |
| MGI variables | | | | | |
| Embassies | 0.500** | 0.343** | 0.311** | 0.396** | 0.006 |
| Organizations | 0.597** | 0.519** | 0.130 | 0.543** | 0.299** |
| Military | –0.003 | –0.101 | –0.096 | –0.043 | –0.301** |
| Trade | 0.120 | 0.112 | –0.459** | 0.068 | 0.051 |
| FDI | 0.424** | 0.409** | –0.124 | 0.447** | 0.173 |
| Capital | 0.675** | 0.540** | –0.267** | 0.661** | 0.251** |
| Tourism | 0.803** | 0.710** | –0.332** | 0.751** | 0.283** |
| Migrants | 0.505** | 0.414** | –0.412** | 0.496** | 0.185* |
| Internet | 0.904** | 0.808** | –0.151 | 0.864** | 0.350** |
| Phone | 0.818** | 0.720** | –0.297** | 0.807** | 0.303** |
| Eco footprint | 0.341** | 0.185* | –0.305** | 0.305** | 0.012 |
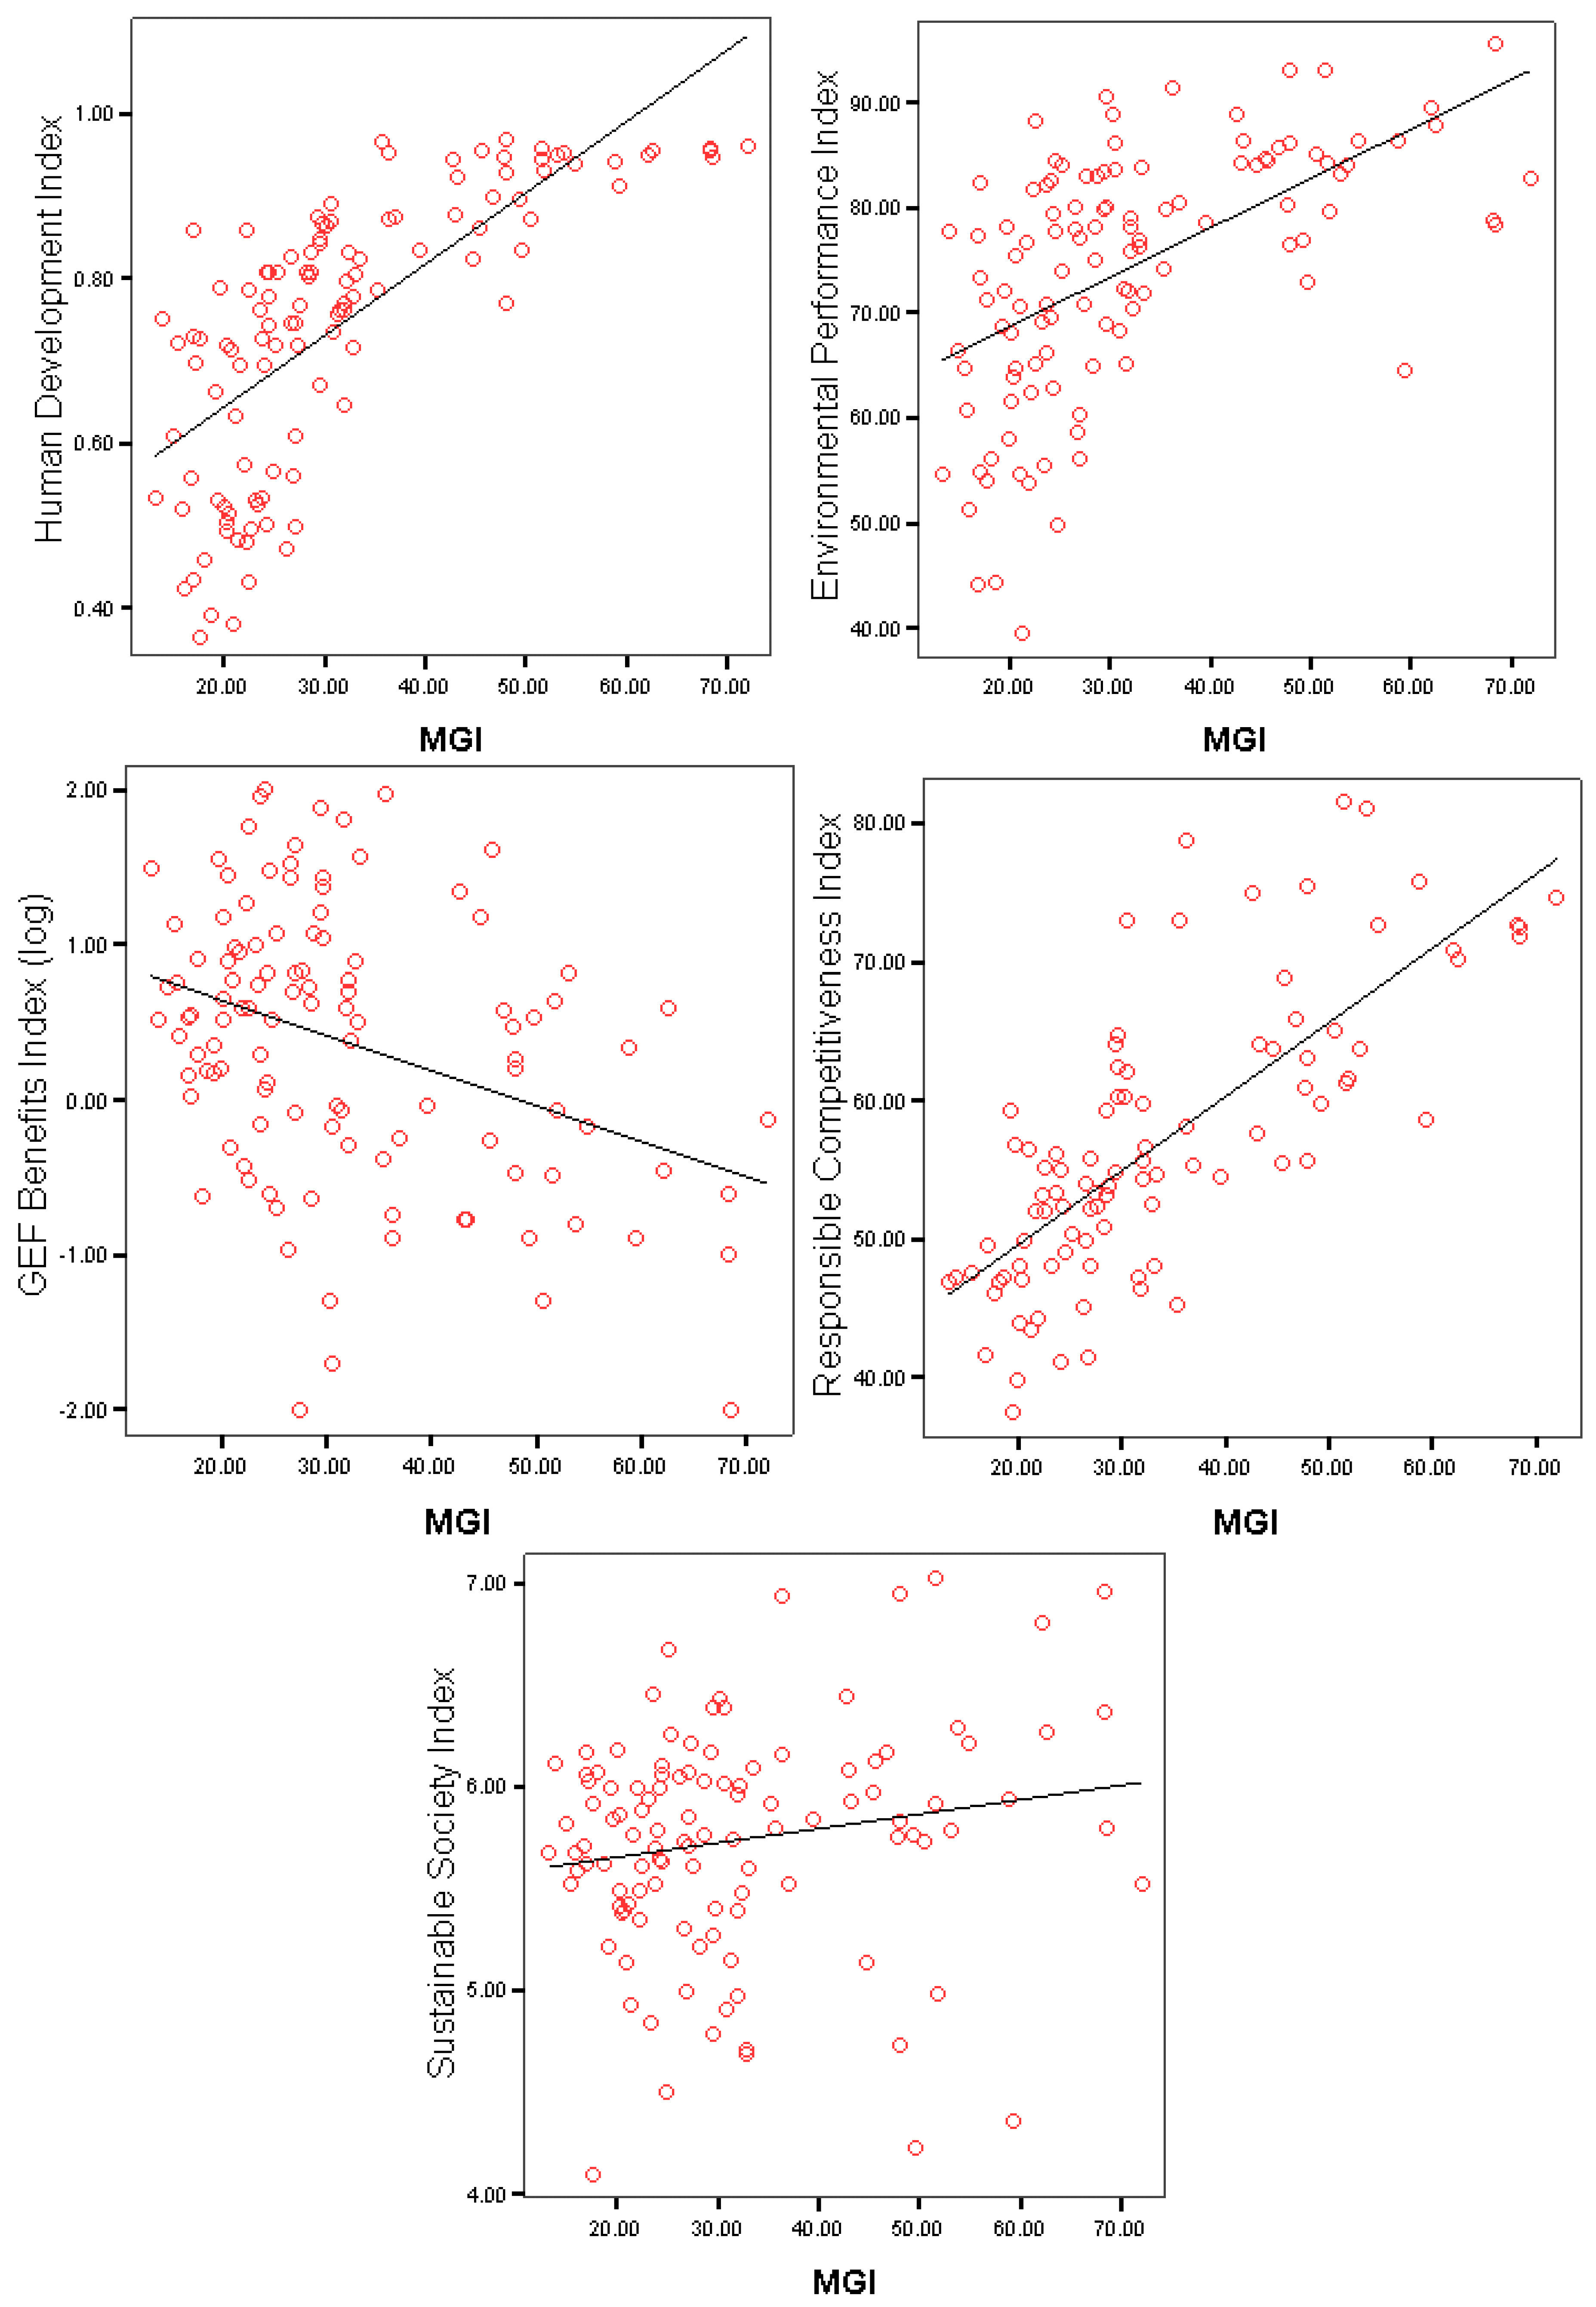
Figure 2 and
Table 3,
Table 4 and
Table 5 show the linear regression outcomes between the MGI and the indices. We use correlation and regression analysis to develop some evidence that may hint at causality, acknowledging that correlation (and regression) can not prove causality in such complex issue as globalisation is.
Figure 2.
Scatterplots and linear regression between MGI and sustainability indices.
Figure 2.
Scatterplots and linear regression between MGI and sustainability indices.
Table 3.
Linear regression coefficients for MGI and the sustainability indices.
Table 3.
Linear regression coefficients for MGI and the sustainability indices.
| | HDI | EPI | GBI (log) | RCI | SSI |
|---|
| constant | –12.28** | –17.09* | 33.92** | –25.43** | 7.04 |
| coefficient β | 59.14** | 0.66** | –5.35** | 5.58** | 4.36 |
| R-square | 0.51 | 0.31 | 0.12 | 0.56 | 0.03 |
Table 4.
Linear regression coefficients for MGI and the sustainability indices with control for per capita GDP growth.
Table 4.
Linear regression coefficients for MGI and the sustainability indices with control for per capita GDP growth.
| | HDI | EPI | GBI (log) | RCI | SSI |
|---|
| constant | –46.97** | –45.29** | –39.86** | –47.30** | –45.27** |
MGI
coefficient β | –6.22** | –0.09 | –3.95** | 0.44* | 0.06 |
GDP p.c. (log)
coefficient β | 21.86** | 22.00** | 19.17** | 14.40** | 20.12** |
| R-square | 0.58 | 0.59 | 0.65 | 0.63 | 0.59 |
Table 5.
T-test (means between low and high globalised countries).
Table 5.
T-test (means between low and high globalised countries).
| | HDI | EPI | GBI | RCI | SSI |
|---|
| t | 10.666*** | 6.944*** | –1.876 | 7.093*** | 1.458 |
As can been seen from
Table 2, except for the SSI, all sustainability indices are significantly correlated with the MGI. The Human Development Index, Environmental Performance Index, and the Responsible Competitiveness Index are highly positively correlated with the MGI, with Spearman correlation (rs) coefficients of 0.795, 0.628 and 0.759 respectively. The GEF Benefits Index is significantly negatively correlated (rs = –0.291) with the MGI; there is no significant correlation between the Sustainable Society Index and MG (rs = 0.170).
Turning to the individual domains and variables of globalisation,
Table 2 shows that the correlations are largely driven by the technological domain and the social and cultural domain of globalisation. Technological and social-cultural globalisation (with economic globalisation to a lesser degree) are significantly correlated with all sustainability indices. Regarding the SSI and GBI, we fail to find any significant correlations associated with political domain of globalisation. Likewise, there is no significant correlation between the ecological domain and the SSI.
Table 3 shows the results of the regression analysis. According to the results, globalisation shows higher values of the HDI and RCI with similar R-squared values. The R-squared between MGI and GBI and RCI is smaller, while there is no relationship between the MGI and SSI.
Table 4 shows the results of the regression analysis for MGI and the sustainability indices with control for GDP growth per capita. According to the results, globalisation shows high R-squared values for all sustainability indices. All indices have R-squared value above 0.50. After controlling for GDP growth per capita, the B coefficients between EPI and SSI with MGI are –0.09 and 0.06. Overall, control for GDP growth per capita, makes the relationship between MGI and the sustainability indices less significant.
To compare the difference in the score in the sustainability indices between more and less globalised countries, the countries are separated into two sub-samples according to their overall MGI score. The mean MGI score (=31.93) is used to distinguish between more and less globalised countries. A two-sided t-test is used to explore the null hypothesis: there is no difference between (the means of) more and less globalised countries in terms of sustainability indices (see
Table 5). We can summarize this as follows:
| H0: HDI more globalised countries | = HDI less globalised countries | reject |
| H0: EPI more globalised countries | = EPI less globalised countries | reject |
| H0: GBI more globalised countries | = GBI less globalised countries | accept |
| H0: RCI more globalised countries | = RCI less globalised countries | reject |
| H0: SSI more globalised countries | = SSI less globalised countries | accept |
Looking at the MGI 2008 data, we see that more globalised countries (compared to low globalised countries) have a significant higher Human Development Index, doing better on the Environmental Performance Index and perform better in their efforts to promote responsible business practices. There is no difference between low and high globalised countries in terms of biodiversity potential and the sustainable society index.
5. Discussion
Looking at the sustainability indices, we do see some differences. The sustainability indices addressing ‘a specific issue’ (like human development (HDI), environmental performance (EPI), business responsibility (RCI)), do show the strongest relationship with the level of globalisation.
The Human Development Index is a country’s average achievement in three areas (a long and healthy life, access to knowledge and a decent standard of living). Achievements in human development are correlated with—and, by construction, partly reflect—levels of income per capita [
29]. Economic and technological globalisation are therefore important drivers of the HDI.
Responsible Competitiveness strategies require strong policy drivers (like include indicators demonstrating government commitment, such as the signing and ratification of international treaties, the design of a responsible tax system, the implementation of stringent environmental regulations and measures to reduce gender inequality) and ‘social enablers’ (e.g., a culture of transparency, a free and inquisitive press, an intolerance of corruption and a dense network of non-governmental organizations [
32]. It makes sense that the countries with high MGI values are also those with strong performance the RCI index.
Like the HDI, per capita GDP is correlated with higher performance on the EPI. In particular, overall EPI scores are higher in countries that have a per capita GDP of $10,000 or higher. The measure of freedom of expression, freedom of association, and a free media incorporated in the EPI show a positive correlation for environmental performance. Likewise, the comprehensive measurement of the comparative strengths and weakness of major and emerging national economies shows a strong positive relationship with environmental performance [
30]. These underlying indicators of the EPI are influenced by globalisation process (as described in the MGI).
The lack of (or low) relationship between the level of globalisation and the biodiversity potential may in part be due to the complexity of the globalisation-biodiversity level, which is highly spatial explicit (and hence, difficult to compare on a county by country basis) [
33]. We could not find any significant relationship between the Society Sustainability Index and the level of globalisation. As the SSI is the most comprehensive index of the Sustainability Indices studies, this result is likely due to the fact that both positive and negative implications of globalisation are reflected in the sub-indicators of the SSI (
i.e., the SSI is not discriminative enough amongst the countries we included in our analysis).
Important to note is that all indices have component indicators and data on the country level, without a specific spatial dimension. Globalisation interacts with sustainable development at levels that make measurement difficult, e.g., trans-border environmental issues, cultural transformations and a so-called ‘global consciousness’. For example, the data do not show us that the most globalised countries might have a higher HDI or EPI because they have exported their pollution or that the costs of the goods and services they enjoy and contribute to their lifestyles are borne by people and environments in other parts of the world.
6. Conclusions
In this paper we have considered the impact of the recent process of globalisation on the sustainability of world developments in the light of various sustainability indices. Looking at the results, globalisation can be characterised as both more complicated and more surprising than was anticipated. One clear lesson can be learned from the many global assessments that have been produced over the past decades: dogmatic predictions regarding the earth’s future are unreliable, ill-founded and misleading, and can be politically counterproductive. So, this analysis is beset with the uncertainties and assumption that apply to global statistical indicator analysis [
34]. Also, looking at a more detailed (variable) level, the analysis becomes somewhat more complex. If consumerism and global economic processes do have polluting side-effects, it needs to be asked which direction these dynamics need to take for a sustainable future. The growth in transport, for instance, is connected to the exploitation of natural resources [
35]. Another example, India, is regarded as one of the most important emerging powers, with impressive growth rates, which seem to have their basis in the recent policies of globalisation. However, in this country environmental degradation is of serious concern [
36].
Furthermore, this analysis is based on ‘present day data’. As the globalising processes intensify over time, the indirect impacts of human-induced disruption of global biogeochemical cycles and global climate change may start to become more apparent [
37]. Borghesi and Vecelli also state that the available empirical evidence suggests that the current process of globalisation is unsustainable in the long run unless we introduce new institutions and policies able to govern it [
38], a similar claim being made by Tisdall [
11] and Watanabe [
39] looking at economic globalisation only.
What is clear is that the increasing complexity of our global society means that sustainable development cannot be addressed from a single perspective, country or scientific discipline. Planning for sustainable development in the context of globalisation is far more complex than most problems that had to be tackled in the past. Planning for sustainable development requires new paradigms and innovative methods, balancing the short term and long term, the objective and value-laden, the quantitative and qualitative, the certain and uncertain. As addressed by others (e.g., [
38]), it is our hope that a further analysis of sustainable globalisation may help in adjusting and optimising the process of globalisation on every level in the direction of a sustainable development. To this end, extensive empirical work is needed to identify the relevant causal mechanisms underlying the influence of globalisation on sustainable development.


