Estimation of Institution Restoration
The proposed restoration model was employed in order to estimate the restoration curves according to the tsunami intensity, based on the collected data in southern Sri Lanka. First of all, damage state parameters and restoration rate parameters were calculated based on the equations presented in
Section 3.1. The restoration process and resistance to tsunami force are different by the type of buildings, conditions of the facilities and so on. However, in the present study, we do not have enough numbers of answers to analyze these factors separately. Therefore, all the buildings for different industries are assumed to have the same resistance and arranged without distinguishing industrial classification. The fishery industry, which was dependent on fishing boats was different from others and was subsequently removed from this analysis.
Table 4,
Table 5 show the data for number of answers, beta distribution parameters, and average and variance of the damage ratio,
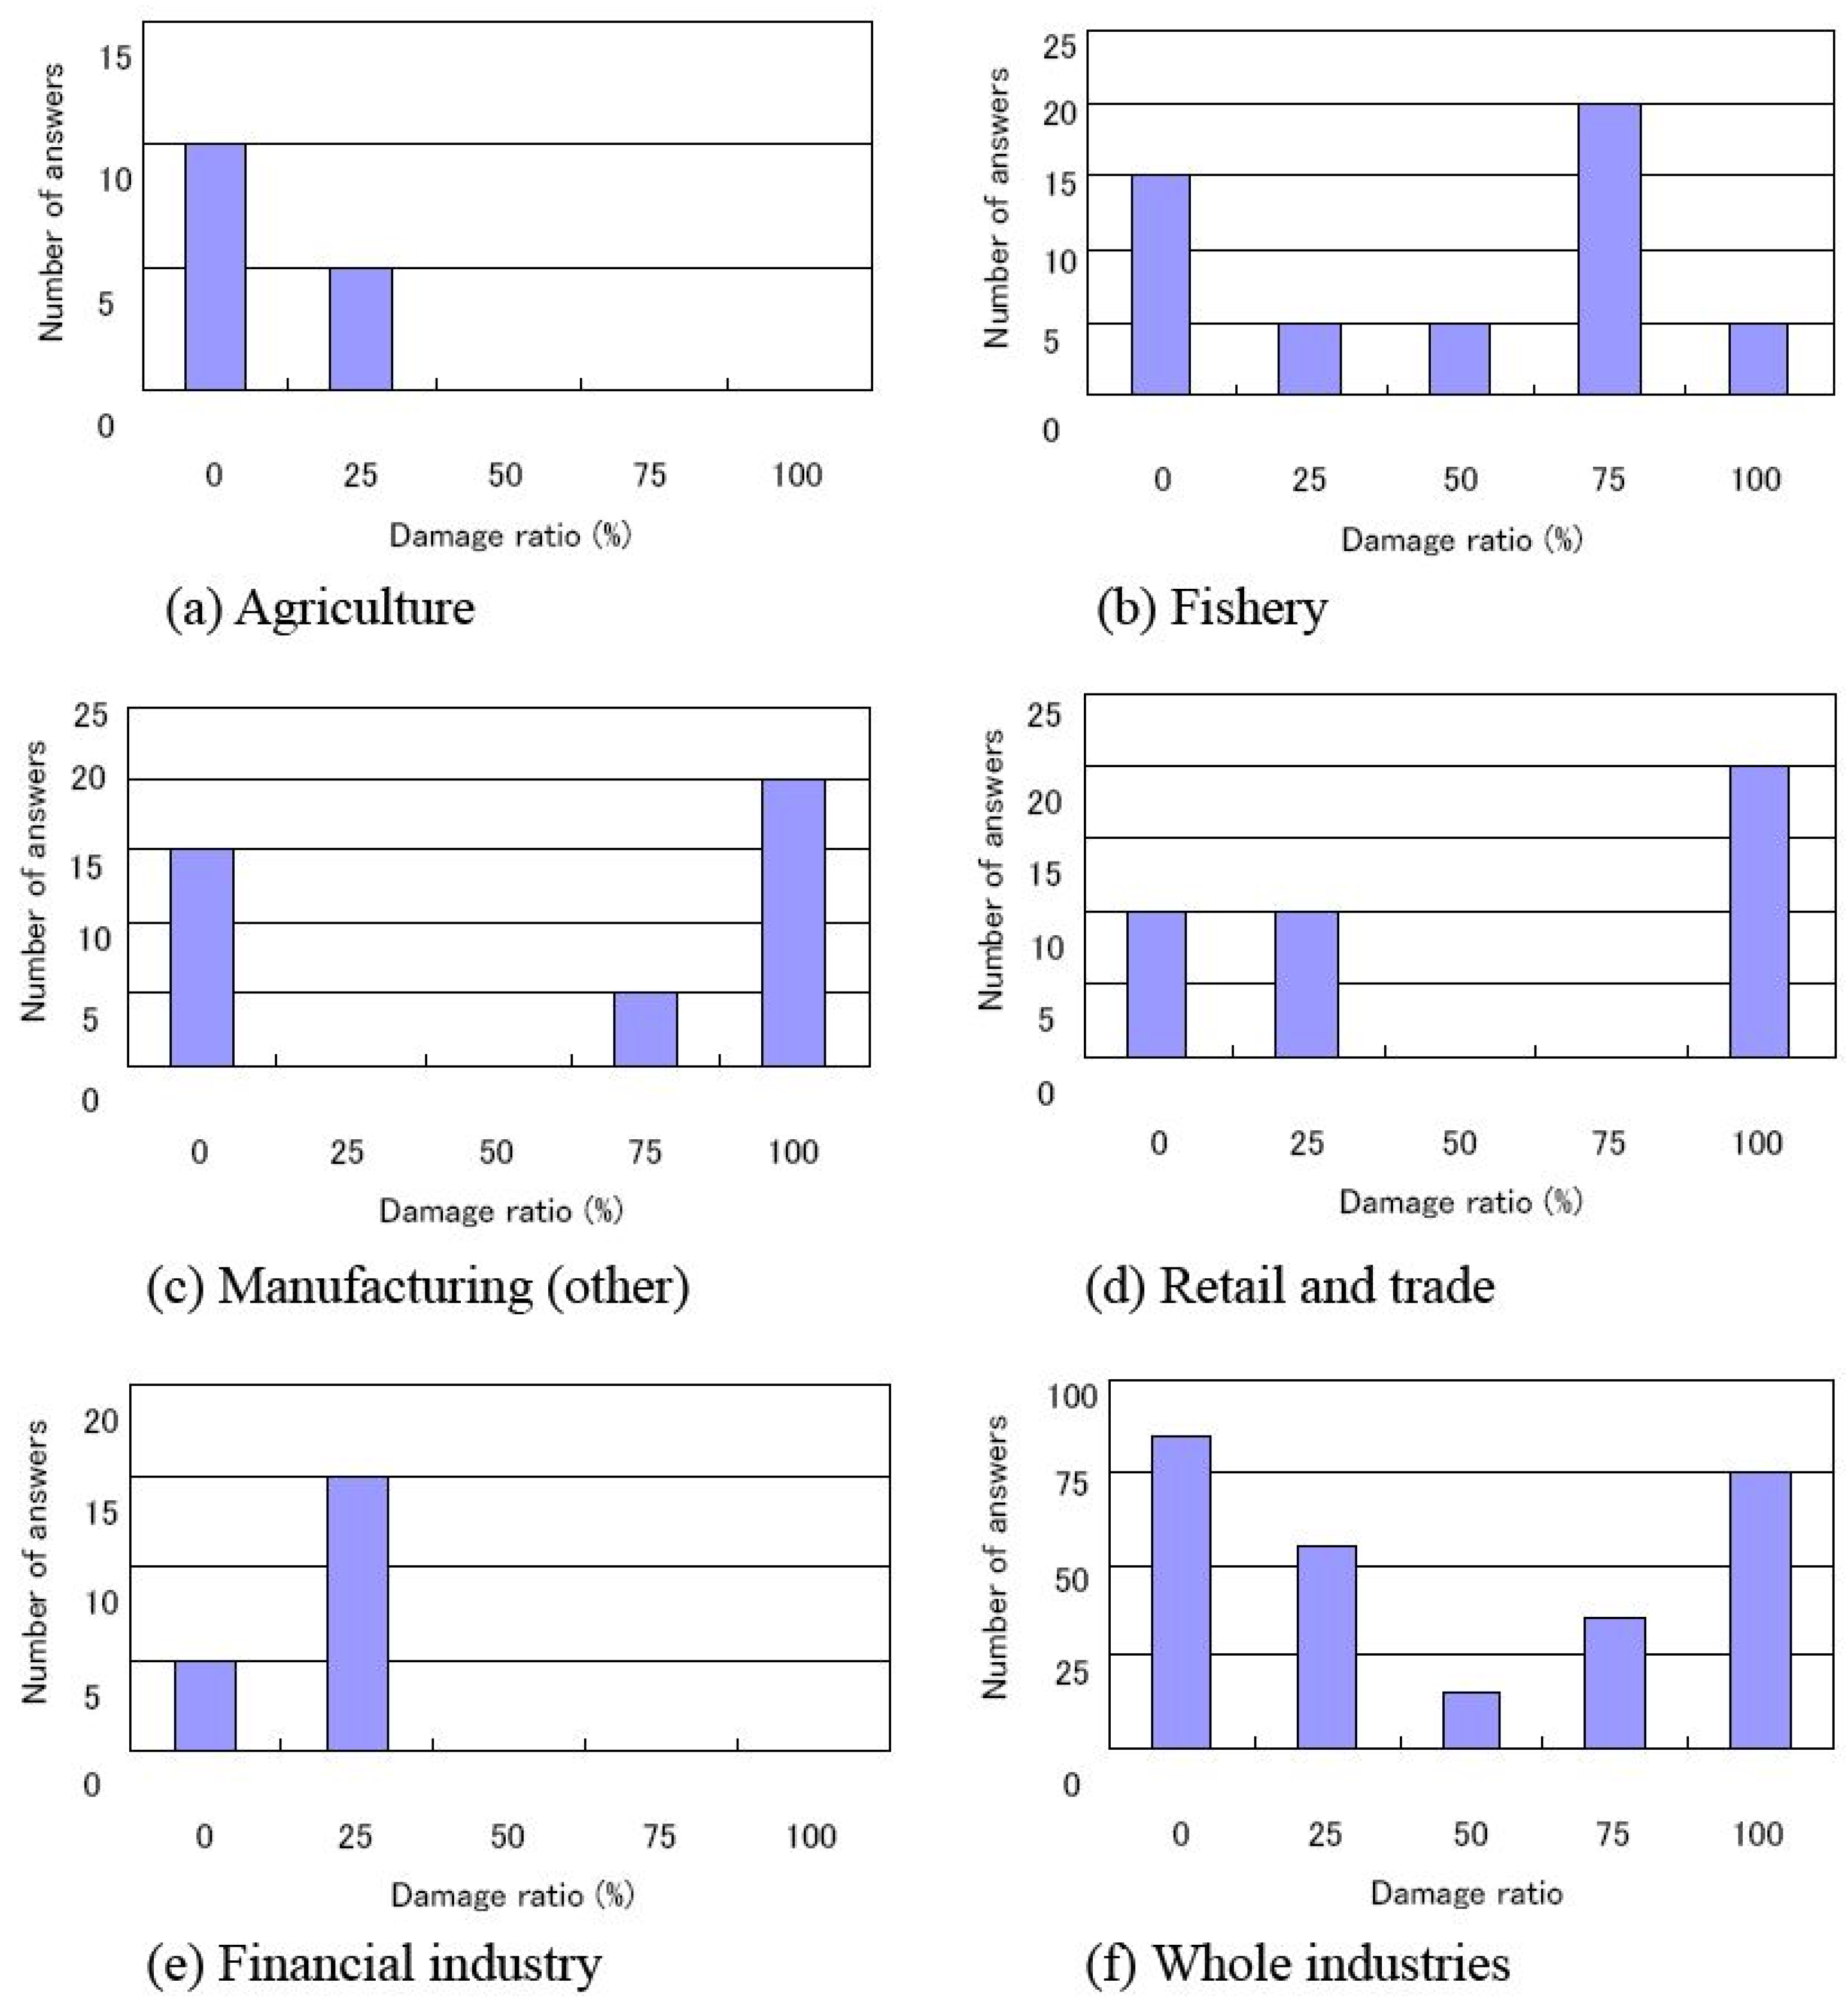
y(%), of the building and facilities, for the different levels of tsunami intensities. If the tsunami level is 0 (there was no inundation), it can be concluded that there was no physical damage to the building and facilities. In addition, as the number of answers of tsunami intensity levels 2 and 3 are limited, their answers were influenced by answers of previous and next industry level. For example of tsunami intensity level 2 in
Table 4, the counter of origin level 2 is 4. The level 1 and 3 were adjusted due to level 2 and average and variance were calculated. As the result of
Table 4,
Table 5, the damage rate increases according to tsunami intensity level and the variance of level 2 and 3 show high values. Thus, as it can be seen in the increment of 0% to 100%, the damage rate distribution curve has two peaks.
Table 4.
Parameter of building damage rate, y(%), due to the tsunami intensity level.
Table 4.
Parameter of building damage rate, y(%), due to the tsunami intensity level.
| Tsunami intensity | Number of | Average | Variance | Beta distribution parameter |
|---|
| level x | answers N | E(y) | Var(y) | q | r |
| 1 | 65 | 3.84 | 88.14 | 0.13 | 3.07 |
| 2 | 25 | 60 | 2062.5 | 0.1 | 0.07 |
| 3 | 36 | 53.57 | 922.6 | 0.91 | 0.78 |
| 4 | 130 | 63.46 | 1561.54 | 0.31 | 0.18 |
Table 5.
Parameter of facilities damage rate, y(%), due to the tsunami intensity level.
Table 5.
Parameter of facilities damage rate, y(%), due to the tsunami intensity level.
| Tsunami intensity | Number of | Average | Variance | Beta distribution parameter |
|---|
| level x | answers N | E(y) | Var(y) | q | r |
| 1 | 69 | 6.25 | 468.75 | 0.02 | 0.23 |
| 2 | 23 | 62.5 | 2291.67 | 0.02 | 0.01 |
| 3 | 92 | 46.25 | 1072.92 | 0.51 | 0.74 |
| 4 | 76 | 55.77 | 849.36 | 1.06 | 0.84 |
Furthermore,
Table 6,
Table 7. show the results of occurrence probability of buildings and facilities, using the beta distribution’s parameters. For the damage states A and B, the occurrence probability increases as the tsunami intensity level becomes large.
Table 6.
Occurrence probability of building damage.
Table 7.
Occurrence probability of facility damage.
The parameters of the restoration density function were then estimated at every damage state of the institution. Even if it was past nine months since the first investigation since the tsunami (at the end of September 2005), most fishery industries were still being restored or had not restored yet. Thus, answers from the fishery industries were removed from the analyses as mentioned above. Five of 29 answers (building/facilities or both) had not been restored by the time of the survey. The government announced that the area within a 100 m buffer zone from the shore would not be supported. This regulation would also hamper quick restoration. Here, the restoration completion of the above building/facilities is considered to have taken 360 days.
In the
Table 8,
Table 9, the parameters of the restoration density function of each damage state for buildings and facilities are presented respectively using the gamma distribution. The damage state D of
Table 9. is estimated from relations with restoration days of other damage states. As the damage becomes more severe, average of the restoration days would get longer.
Table 8.
Parameters of the restoration density function of damage states for buildings.
Table 8.
Parameters of the restoration density function of damage states for buildings.
| Tsunami intensity | Number of | Average | Variance | Gamma distribution parameter |
|---|
| level DS | answers N | E(t) | Var(t) | k | v |
| A | 14 | 222.4 | 10435.8 | 3.493 | 0.014 |
| B | 3 | 240.7 | 25665.2 | 2.212 | 0.009 |
| C | 2 | 142.2 | 26480.8 | 0.711 | 0.004 |
| D | 11 | 55.6 | 5005.2 | 0.589 | 0.009 |
Table 9.
Parameters of the restoration density function of damage states for facilities
Table 9.
Parameters of the restoration density function of damage states for facilities
| Tsunami intensity | Number of | Average | Variance | Gamma distribution parameter |
|---|
| Level DS | answers N | E(t) | Var(t) | k | v |
| A | 19 | 168.3 | 7765.2 | 4.321 | 0.03 |
| B | 4 | 114.6 | 15966.1 | 0.796 | 0.009 |
| C | 5 | 77.8 | 15606.3 | 0.311 | 0.004 |
| D | 3 | 55.6 | 5005.2 | 1.196 | 0.033 |
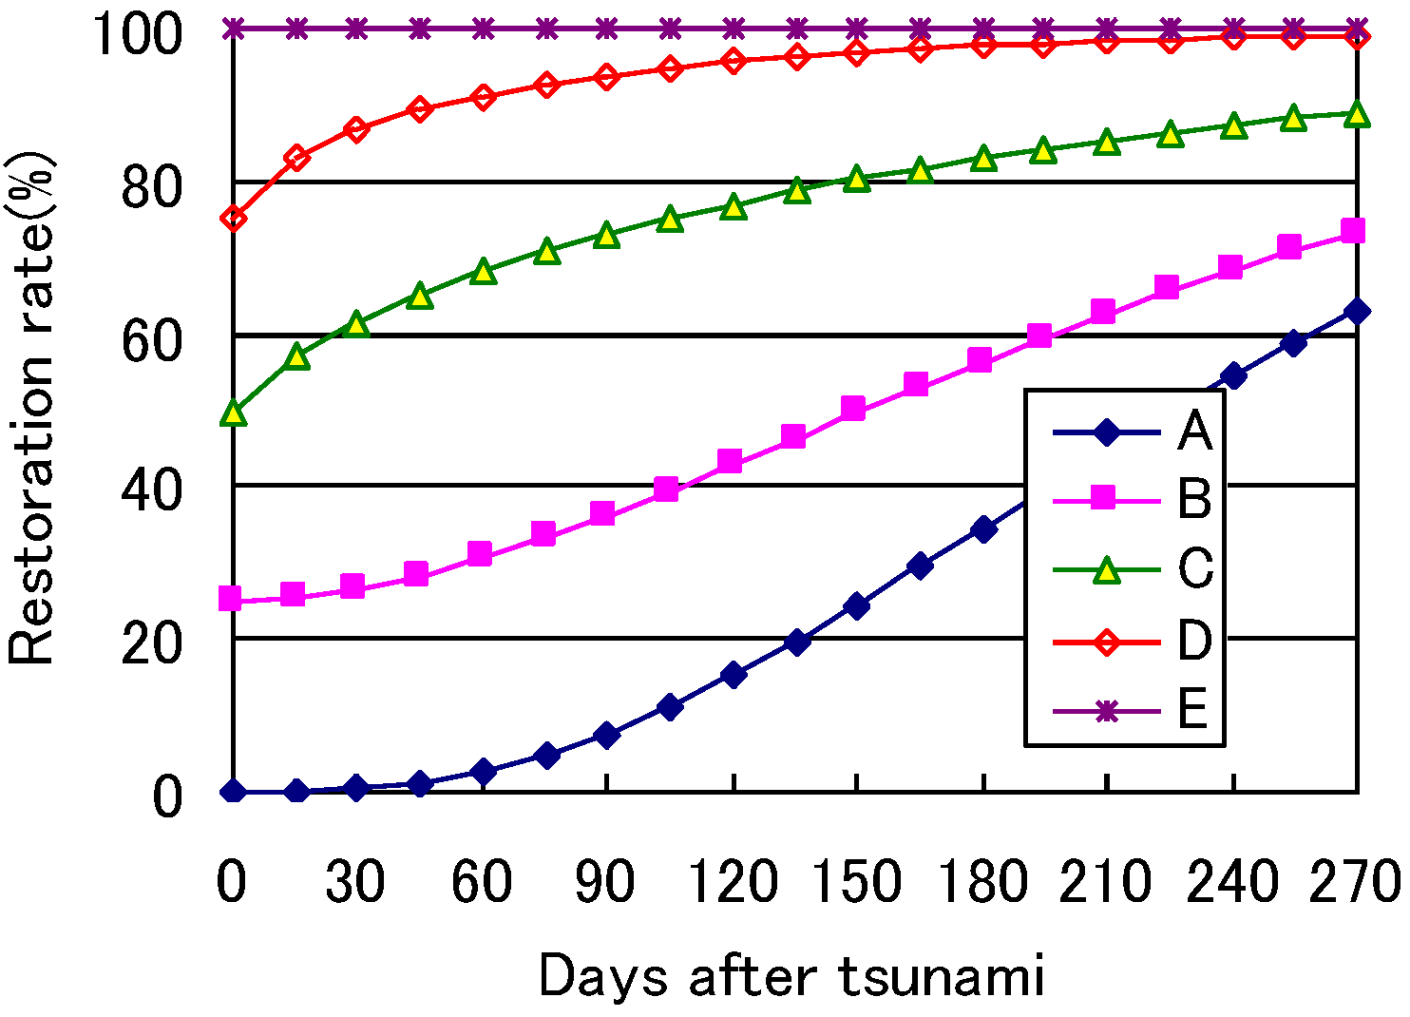
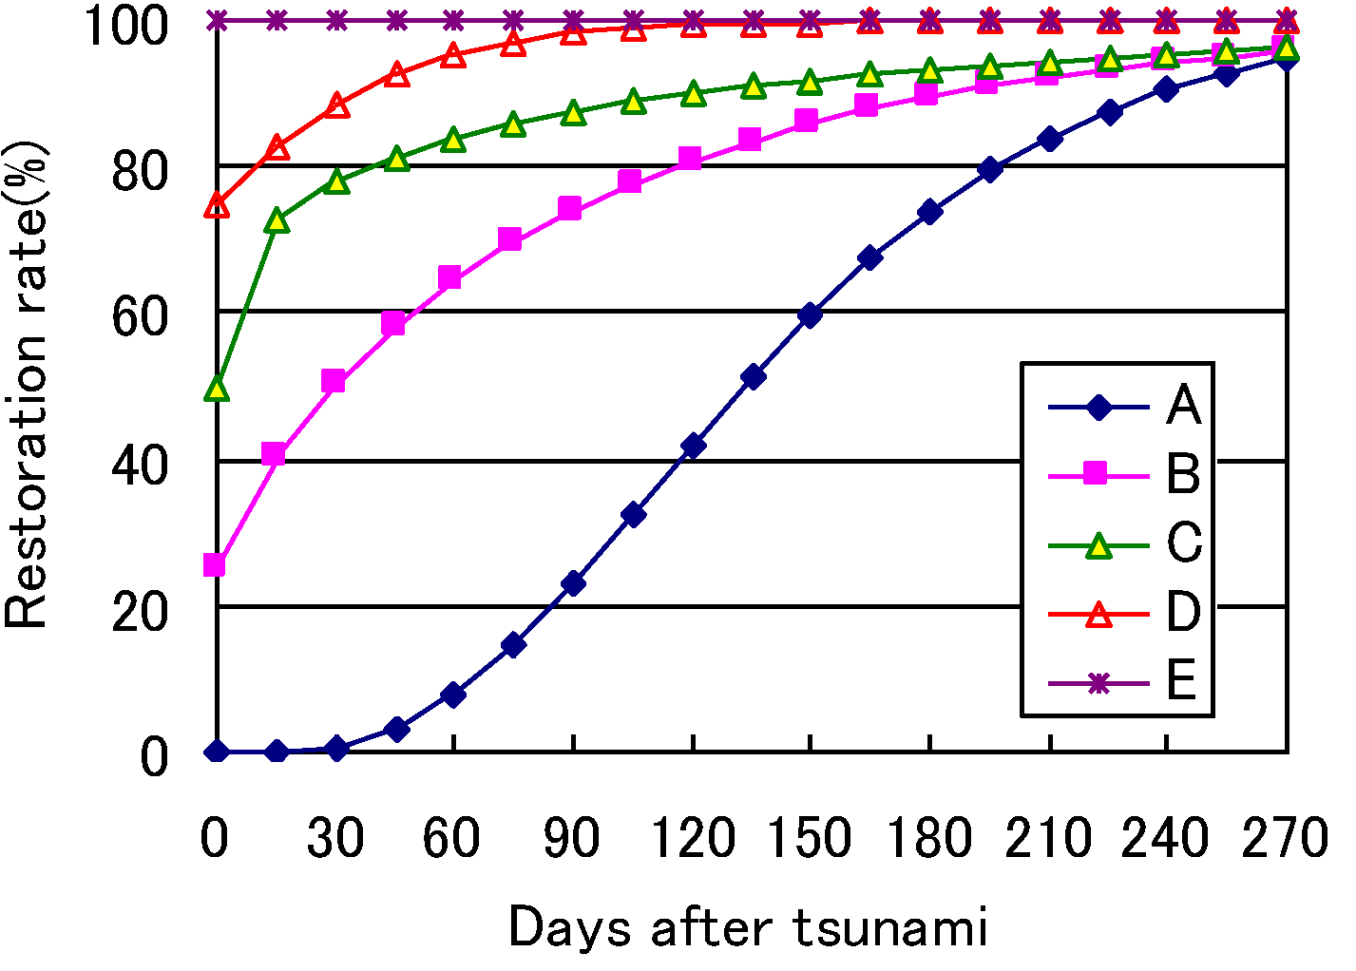
Furthermore, the conditional restoration curves of each damage state according to equation (7) are shown in
Figure 9,
Figure 10. If the building is in damage state A or B, it dramatically slows down the restoration curve; on the other hand, the restoration curve becomes convex if it is in another damage state. This means that if the industrial building and facilities were completely destroyed or washed away by tsunami wave, they needed more time for restoration because of the cost and different construction method of restoration. Moreover, the damage state A of the facilities draws a concave restoration process, but other damage states show fast restoration.
Figure 9.
Restoration process of buildings.
Figure 9.
Restoration process of buildings.
Figure 10.
Restoration process of facilities.
Figure 10.
Restoration process of facilities.
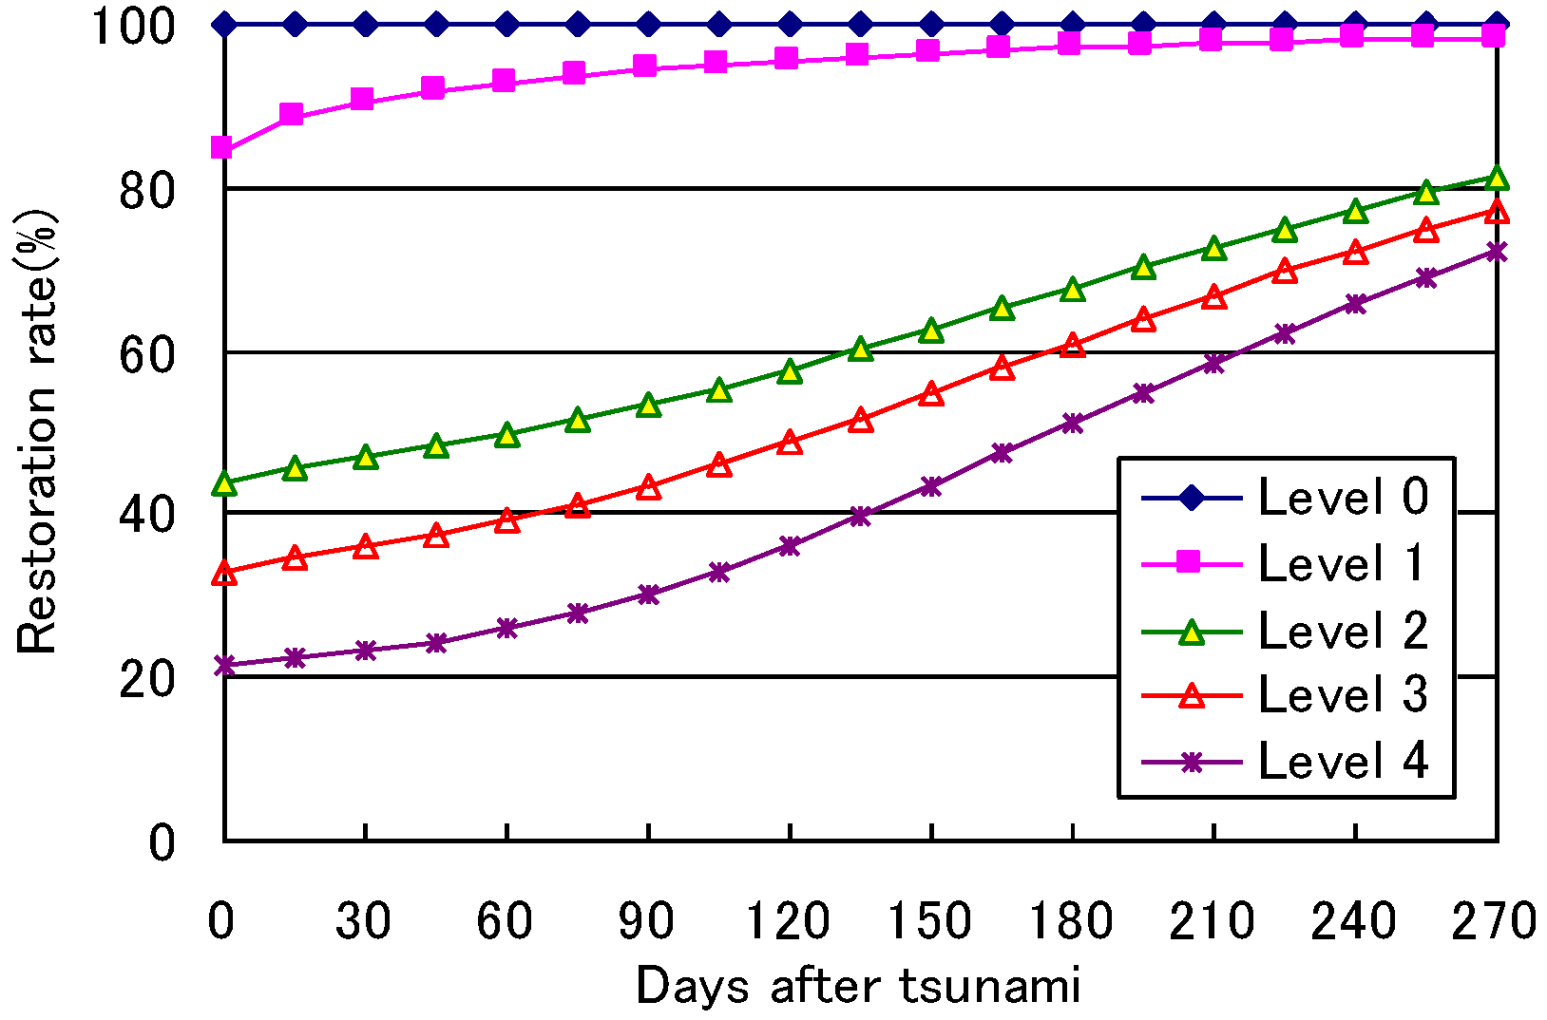
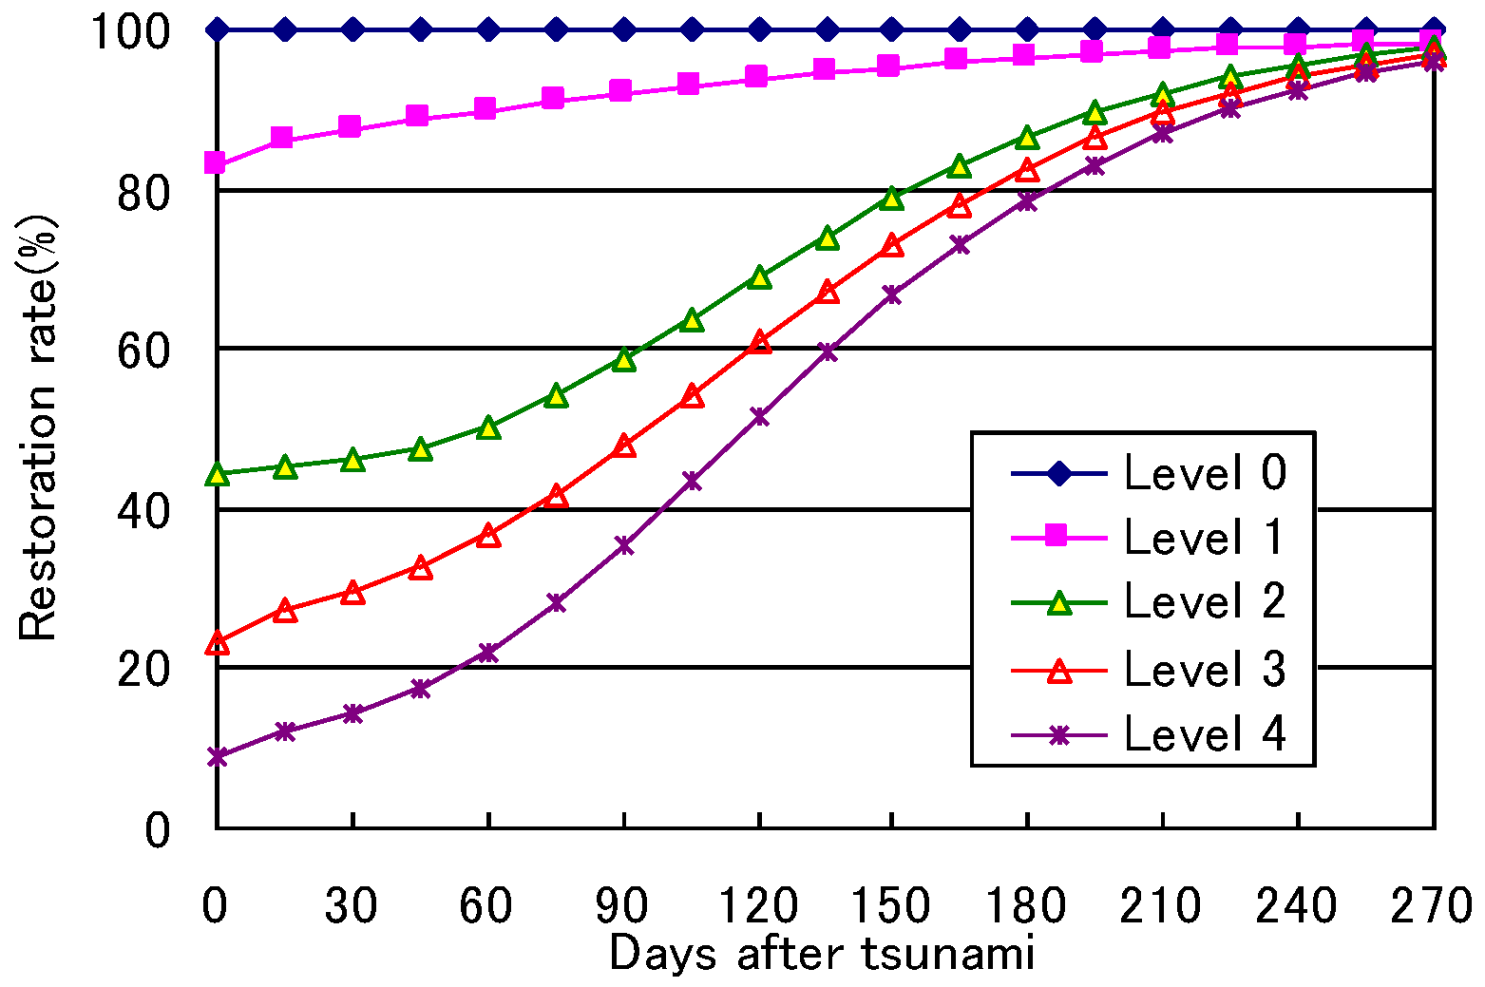
The restoration of buildings and facilities due to the tsunami intensity level, which is calculated from the occurrence probability of the damage state, are presented in
Figure 11,
Figure 12. Concerning the restoration of buildings, there is a gap between the tsunami intensity less than level 1 and more than 2. If the tsunami intensity level is more than level 2, the occurrence probability of damage state A becomes higher. Therefore, the restoration process decreases.
Figure 11.
Restoration rate of buildings according to tsunami intensity levels.
Figure 11.
Restoration rate of buildings according to tsunami intensity levels.
Figure 12.
Restoration rate of facilities according to tsunami intensity levels.
Figure 12.
Restoration rate of facilities according to tsunami intensity levels.


 , that defends on time, t, related to the facility Fn with tsunami intensity level, x, has given the occurrence probability
  of damage state, DS, in the tsunami intensity level x, and conditional restoration rate of business facilities,
  , according to damage state, DS, defending on time is as follows.

 y
y 

 , and variance,
  , are as follows,


 is explained. The restoration rate can be calculated using the accumulated value of the restoration density distribution,
  , of each damage state DS and representative figure kDS of damage state DS.


 , and variance
  are as follows,


 becomes 1. In contrast, when the lifeline is not functional, the representative figure kDS of damage state DS becomes 1, and the state restoration rate
  gives accumulated value of the conditional restoration density distribution.


