
Eliminating Overload Trucking via a Modal Shift to Achieve Intercity Freight Sustainability: A System Dynamics Approach

Abstract
:1. Introduction
2. Literature Review
2.1. Methods for Freight Sustainability Assessment
- The above-mentioned methodologies presuppose that the exogenous stimuli, e.g., policy activities, can be clearly distinguished and, thereafter, examine the effects of the stimuli separately [23]. Regarding the problem of this study, solving the overloaded trucking problem involves changing the truck payload, which gives rise to simultaneous variations in multiple determinants of a freight system, such as transport cost, transport time, and truck traffic volume, which cannot be clearly and individually separated and analyzed.
- The strategic evaluation of freight sustainability should be performed at the macro level of freight systems, which requires including components of freight systems, as comprehensively as possible. This requirement leads to a method that facilitates accommodating a wide range of components, while simplifying the details of the components. In contrast, optimization- and simulation-based methods are characterized as high-resolution in components’ details but as low-resolution in the coverage of components [24]. Consequently, these methods are more appropriate for the analysis of sub-systems of freight systems or of sub-objectives of freight sustainability.
- The assessment of the effect of modal shift policies on the overall performance of sustainability needs to, simultaneously, take into account economic, social, and environmental objectives. The optimization- and simulation-based methods, intended to optimize individual sub-objectives, cannot reliably evaluate the overall sustainable performance of a freight system, even when these methods are used in such a way that one model’s results feed into another model’s assumption [25]. In other words, these methods are generally inadequate for the assessment of the overall performance of sustainability when the whole is greater than the sum of its parts; namely, freight sustainability as the emergence of intertwining factors, including freight activities, policies, and time.
- The essence of the problem of overloaded trucking lies in the interactions of different agents’ (e.g., freight owners, infrastructure operators, and the government) decisions, based on their own interests. SD is useful in understanding these interactions by setting both multiple variables representing the behavior of those agents and equations between variables that reflect the interdependency of those agents.
- The objective of this study is to evaluate policies’ effects on sustainability, regarding which both economic effects and social and environmental effects should be considered simultaneously. SD allows the cost-benefit analysis approach to be integrated [7], which enables a consistent assessment of policies by converting both economic effects and social and environmental effects into monetary equivalents; thus, it is suitable for evaluating global effects of modal shift policies on freight sustainability.
- The nature of this research is policy evaluation, which is in the strategic horizon that the long-term effects of policies are to be assessed. SD has the advantage in policy evaluation of not only analyzing the ultimate effects of policies over a long time period, but also providing a time path of policies’ impacts on systems [24].
2.2. SD and Applications to Freight Transportation
3. Methodology
3.1. Problem Description and Hypotheses of the Model
- (1)
- A modal shift policy is fixed throughout the simulation period once it is implemented, without considering the situation that the policy is altered or aborted.
- (2)
- The model considers only highway pavement damage from heavy-duty trucks while neglecting that from small passenger cars because of the minor influences of passenger cars on highway pavement. Regarding the maintenance of infrastructures, the model excludes the situation of delayed maintenance operations due to a budget shortfall [35] and assumes that maintenance operations initiated in a year can be accomplished within the year.
- (3)
- The model assumes that new vehicles are to be put into service instantly, without considering the delay in the processes of sales and delivery of the new vehicles.
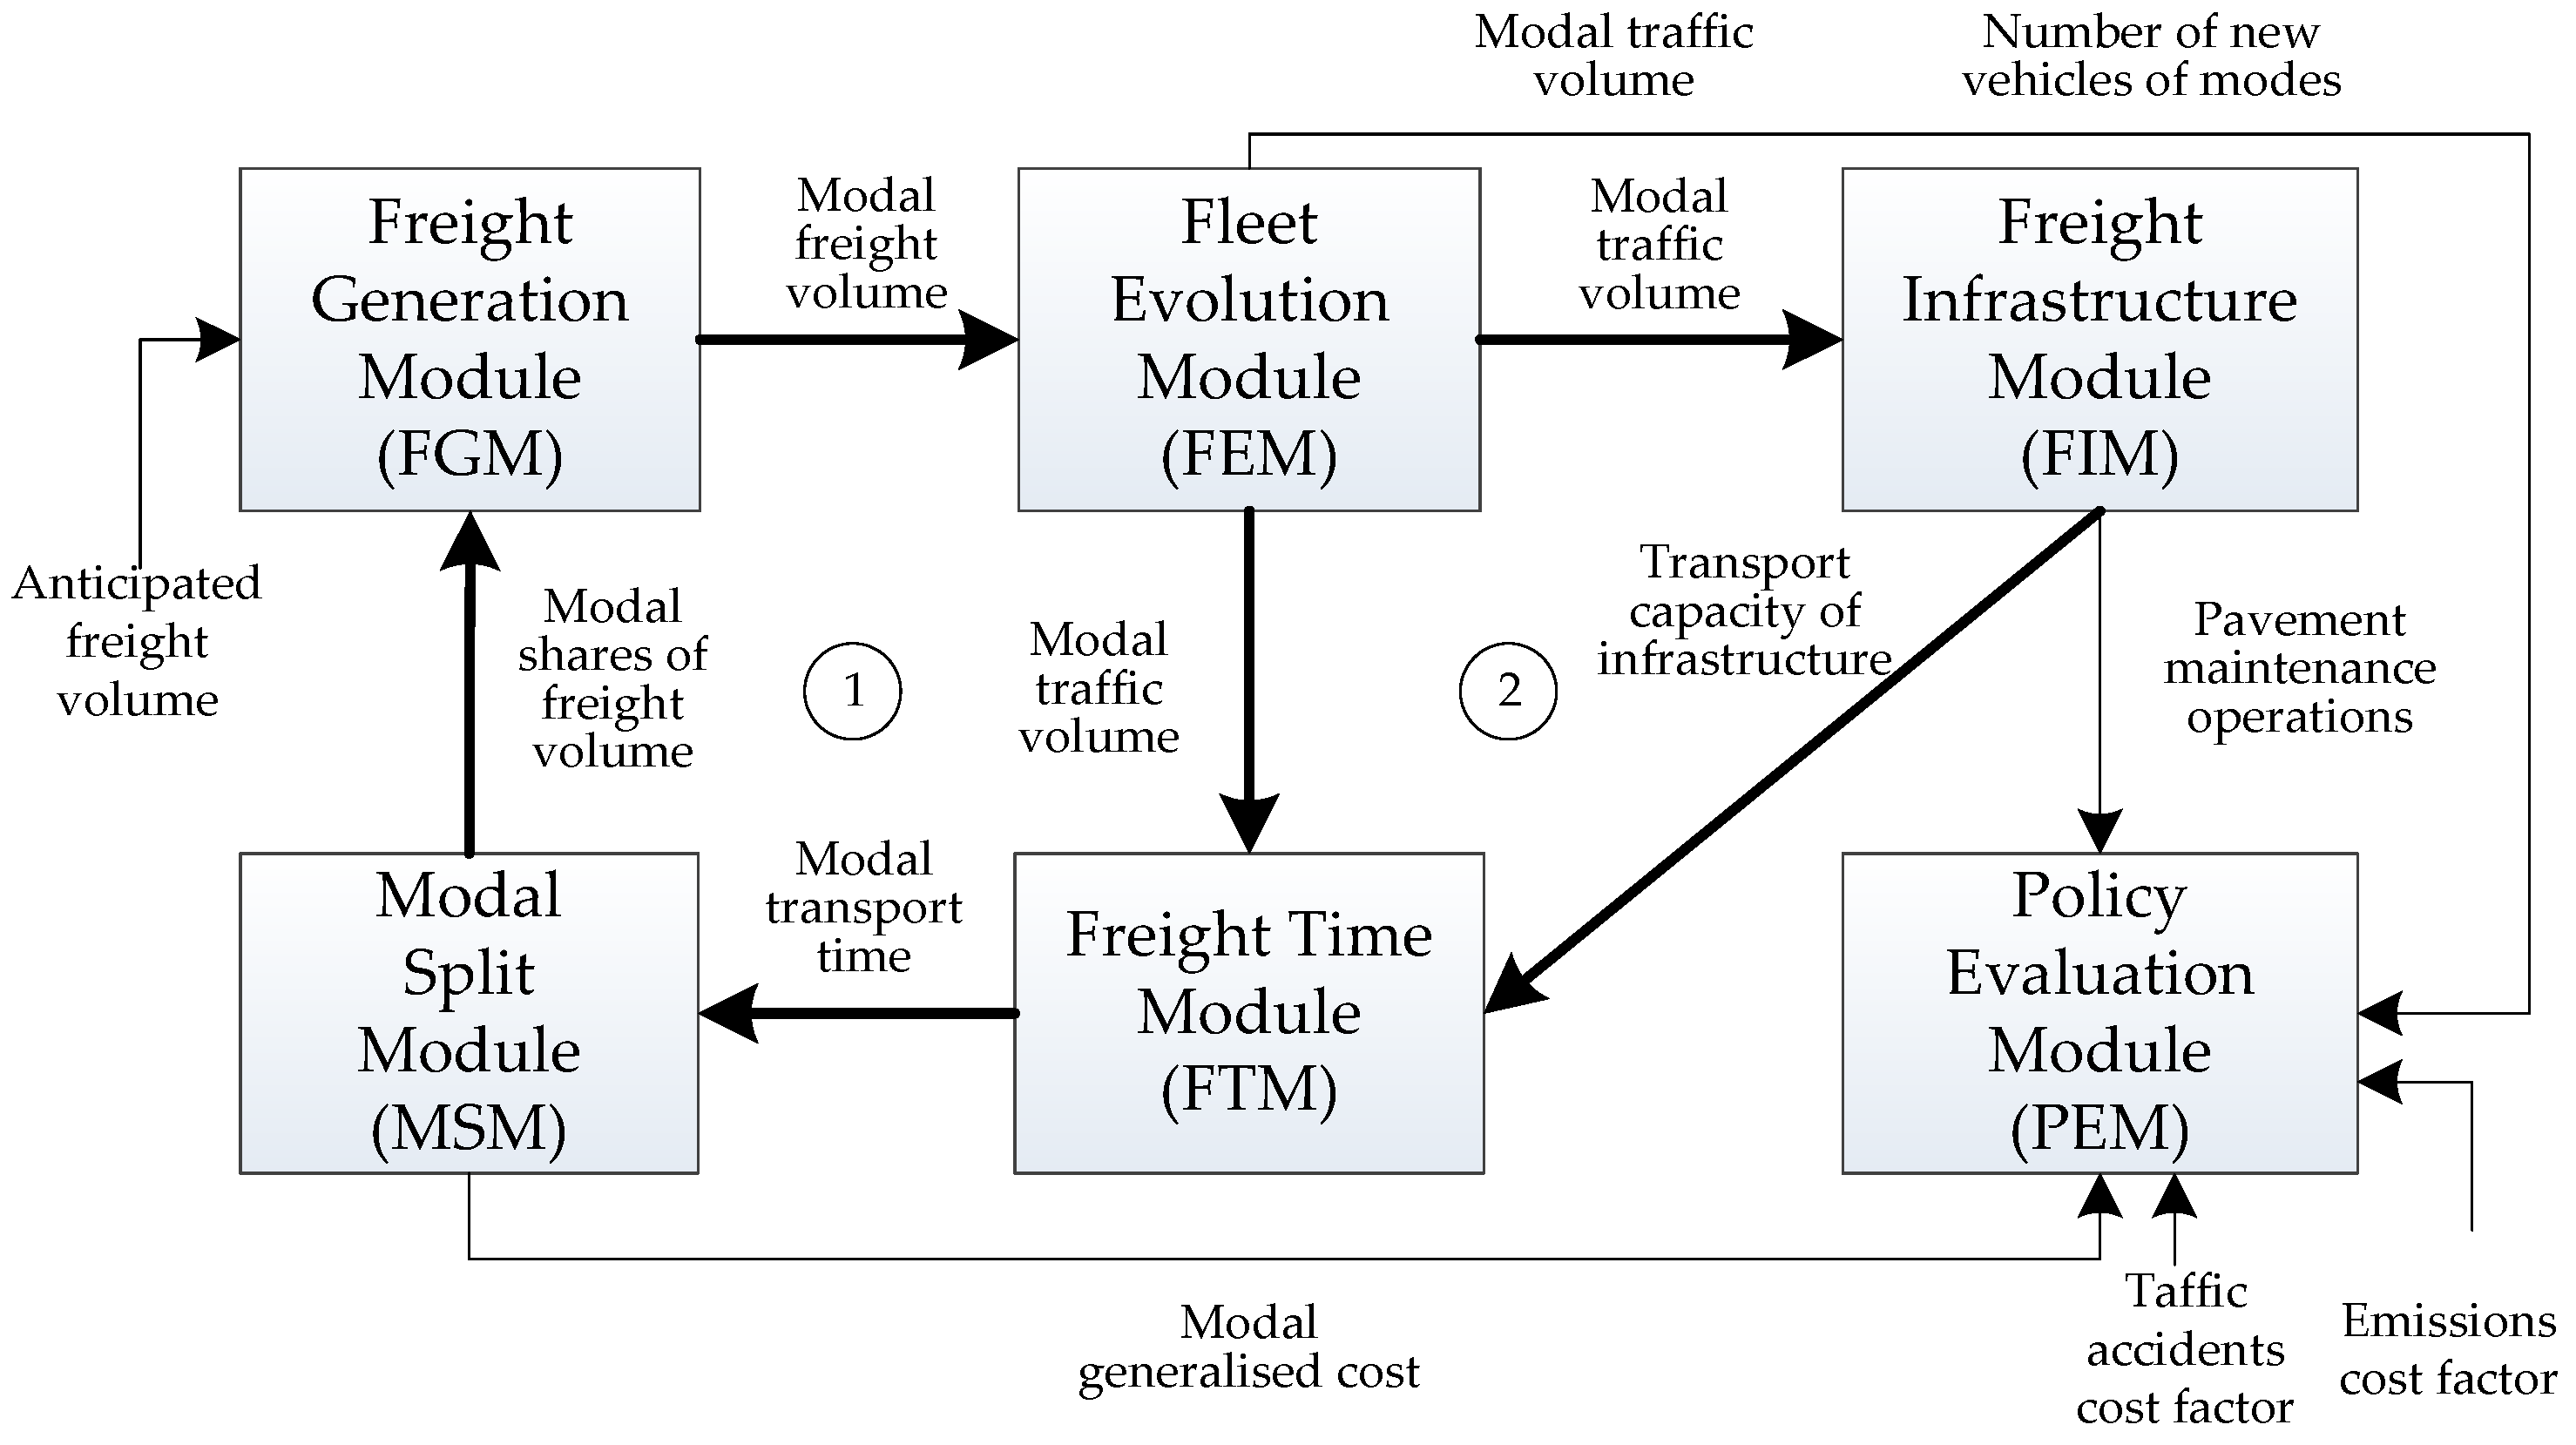
3.2. Model Framework
3.3. Model Development
3.3.1. The Freight Generation Module
3.3.2. The Fleet Evolution Module
3.3.3. The Freight Infrastructures Module
3.3.4. The Freight Time Module
- (1)
- The average transport time is determined by the average transport speed of a mode and transport mileage. Regarding the railway transport, the average speed is related to the performance of both infrastructures (e.g., class of rail lines, electrified or not) and locomotives (e.g., engine type, traction power). While the average transport speed of highway trucks is determined by a more complicated mechanism in which the congestion level needs to be taken into account, since the truck traffic volume of a highway is allowed to exceed the maximum capacity of the highway. The greater the highway capacity, or the lesser the truck traffic volume, the lower the congestion level and, thus, the higher the average speed of trucks. This relationship is quantified by the following speed-flow function [43]:where and are, respectively, the average speed and the highest speed of trucks on highway k in year t, is the truck traffic volume of highway k in year t, fed by the FEM, and is the average capacity of highway k in year t, provided by the FIM. The values of , , and , related with highway types, are defined by the SDHAP.The speed-flow function manifests an entangled situation as overload trucking is involved. On one hand, overloaded trucking gives rise to the highest speed of trucks dropping, leading to a decline in the average speed. On the other hand, overloaded trucking causes truck traffic volume to decrease, resulting in relief of congestion and an increase in the average speed.
- (2)
- The average freight handling time, including loading, unloading, and waiting time in freight yards or warehouses, is calculated by the following function:where is the average freight handling time of mode x in year t, is the average payload of freight vehicles of mode x, and are, respectively, loading and unloading capacities, and is the waiting time of vehicles in freight yards or warehouses. Regarding highway trucks, loading and unloading processes act as a queuing system [44], in which is determined by both the number of loading or unloading machines and the number of arriving trucks calculated based on truck traffic volume. Regarding freight trains, is the average value of the best and worst values of waiting time as railway transport is operated based on a scheduled timetable, which is obtained by the freight volume of the railway, provided by the FGM, and the traction tons of a freight train.
3.3.5. The Modal Split Module
- (1)
- The unit freight operating cost, including unit freight transport and handling costs, is calculated by the following function:where is the unit freight transport cost of mode x in year t. For highway transport, varies with the truck payload. The higher the payload (including the payload exceeding the statutory limit in overloaded trucking), the lower the . Hang et al. [46] quantified this relationship between the unit freight transport cost and the payload of highway trucks in China. For railway transport, is actually in terms of the price of freight service provided by the China Railway Corporation as a third party of transportation. In general, the unit freight transport cost of railway is lower than that of highway due to the scale economies of transport, even when highway trucks are overloaded. However, in circumstance that there are no feeder railways for both shippers and consignees, trucking legs to both ends of railway should be considered; then is actually the unit intermodal transport cost. is the unit freight handling cost, which depends on the handling cost of the unit freight volume and the handling times . One of the key disadvantages of railway transport is the need to conduct multiple handling of goods if intermodal transport is involved in which trucking legs to both ends of the railway are needed. In this situation, the unit freight handling cost includes not only that of railway transport leg , but also that of highway trucking legs . Therefore, the modal choice strongly depends on the handling costs, as well as on the availability of co-infrastructure.
- (2)
- The unit freight time cost is obtained by multiplying the unit freight time and the value of time (VOT). The unit freight time, including freight transport time and handling time, is calculated by the FTM. The VOT is the monetary value assigned to a unit of time and it depends on the freight type. The higher the value of a certain type of cargoes, the higher the VOT.
3.3.6. The Policy Evaluation Module
- (1)
- Economic costs refer to the costs paid by the agents involved directly in transport activities (e.g., freight owners, carriers), including:
- The freight generalized cost, including freight operating and time costs, provided by the MSM.
- The freight vehicles’ purchasing cost, which is estimated by the vehicle price and the number of new vehicles each year fed by the FEM. It is worth noting that the purchasing cost of railway vehicles includes that of locomotives only, without that of rolling stock. This is because all of the rolling stock is under unified management of China Railway Corporation, and companies cannot buy rolling stock, but rent them from China Railway Corporation. The cost for renting rolling stock has been accounted for in the transport cost of the railway.
- The investments on the railway infrastructure, based on the condition that an IFS does not have railways; and the maintenance cost of the railway infrastructure, which has already been accounted for in the transport cost, is actually in terms of the price of freight service provided by the China Railway Corporation as a third party of transportation.
- (2)
- Social costs refer to the costs paid by the government or the public, including:
- The highway pavement maintenance cost, calculated by the maintenance operations fed by the FIM and the corresponding costs of maintenance operations. It is worth noting that this cost is classified into social costs because it is funded by the state’s fiscal department, not the highway operator.
- The traffic accidents cost, which is obtained by multiplying the modal traffic volume and a modal-accident cost factor. Particularly for highways, the value of the accidents cost factor varies with the truck weight. The higher the truck weight, the worse the maneuver of trucks, and, thus, the greater the accidents rate and the factor value.
- Greenhouse gas and air pollutants emissions costs, which are estimated individually by adopting fuel-based and distance-based approaches [47]. The general method used for both approaches is to estimate the emissions amount first by multiplying the amount of freight activities and an emission factor per unit of freight activity, then to calculate emissions costs by the marginal costs of respective emissions. Noted that if trucks are overloaded, the emissions of a single truck increase under a heavier payload, but the amount of trucking activities decreases at the same time, making the situation more complex.
- The noise cost, which is excluded in the model because most of the areas that China’s IFSs cover are sparsely populated.
4. Model Application and Validation
5. Policy Formulation
- (1)
- The baseline, which is the scenario with a projection of the past and current trends so that the following policy scenarios can be compared with it for evaluation. As mentioned above, there is severe overloaded trucking on the regular highway. It is assumed in the baseline that this pattern will continue in the future without any policy intervention.
- (2)
- The RWR, in which all of the overloaded trucks on the regular highway are assumed to meet the statutory limit from 2016, the starting year of the scenario.
- (3)
- The MSR, which includes MSR III, MSR II, and MSR I that are to be implemented individually. In the scenarios of the MSR, it is assumed that a railway is to be constructed from the starting year of 2016, and the RWR for highways is also implemented at the same time.
6. Results and Discussion
6.1. Sustainable Effects of the RWR
- (1)
- The RWR causes an increase of 10.86 billion Yuan of the CEC compared with the baseline, in which:
- The cumulative truck purchasing cost (CTPC) rises by 2.53 billion Yuan, because the RWR reduces the truck payload and, thus, increases the number of trucks to fulfill the same amount of freight.
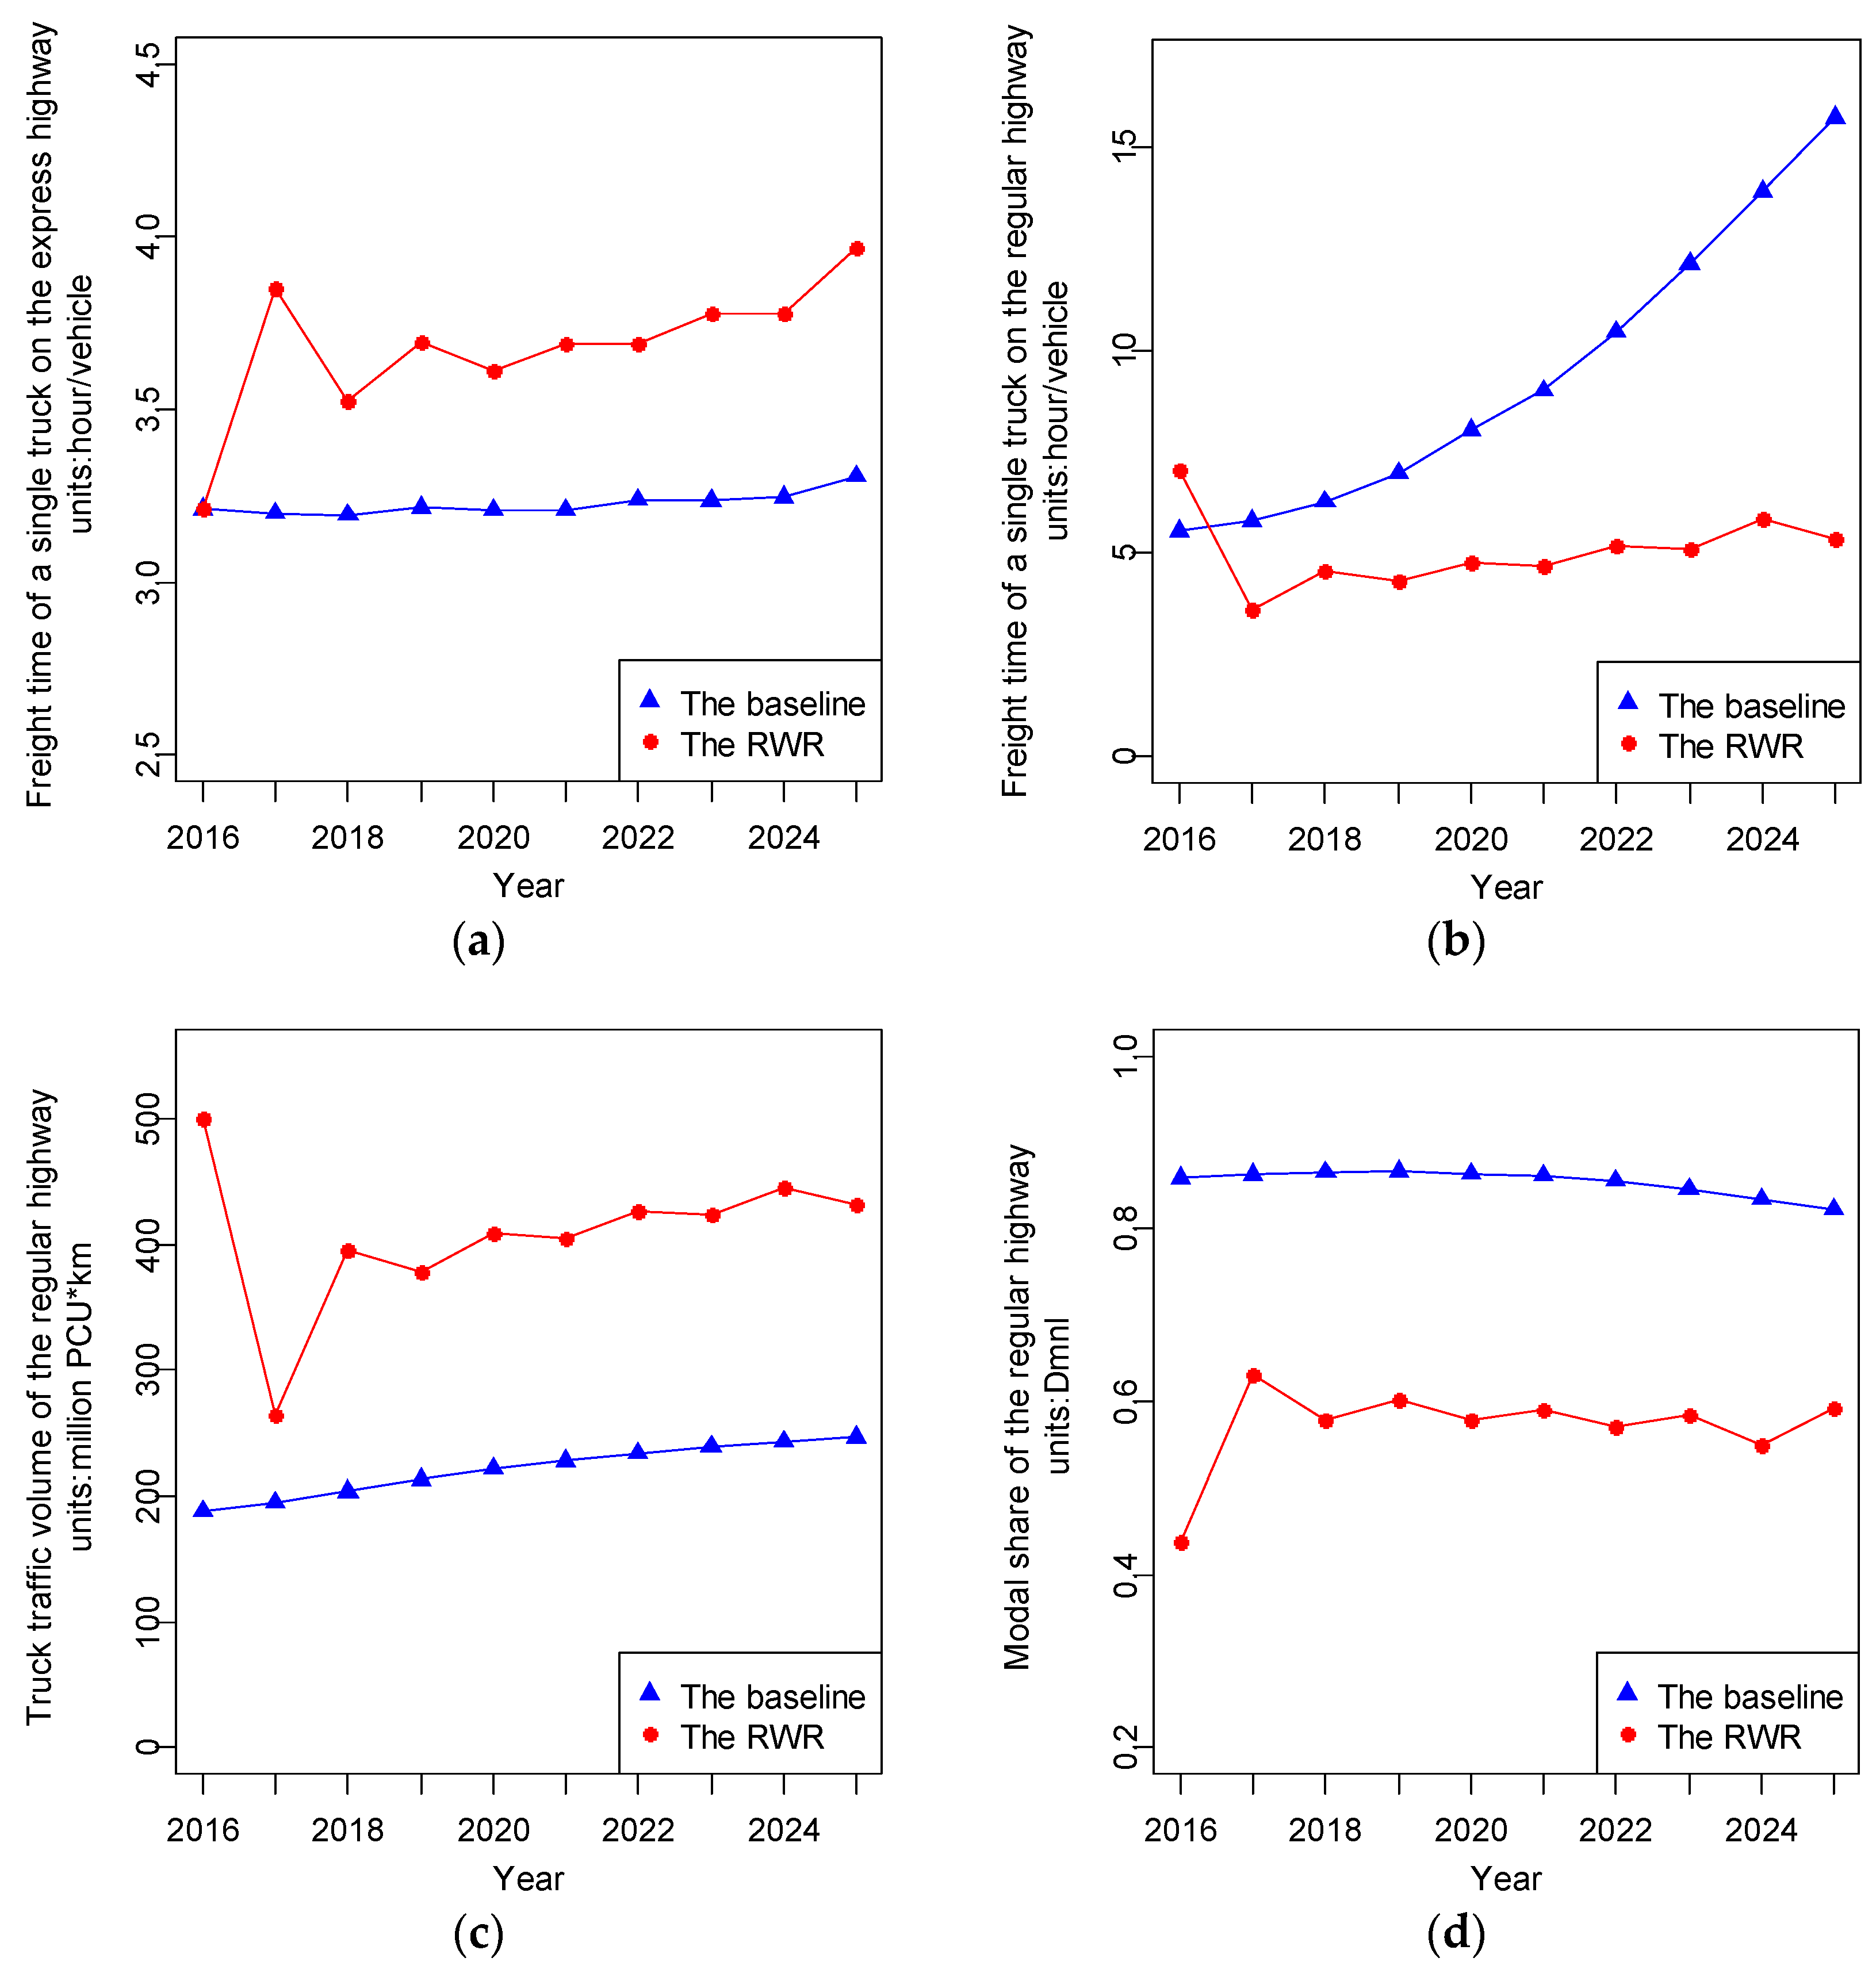
- The cumulative generalized cost (CGC) increases by 8.33 billion Yuan, most of which is contributed by the increase of the cumulative freight operating cost (7.22 billion Yuan), as the RWR counteracts the scale economies of transportation by significantly lowering the truck payload. Regarding the other constituent part of the CGC, namely the cumulative freight time cost, the results show that: (1) the cumulative freight time cost of truck traffic on the express highway increases by 1.25 billion Yuan because the RWR lowers the attractiveness of the regular highway and directs more truck traffic to the express highway, increasing the congestion and freight time of both a single truck (as shown in Figure 6a) and truck traffic; and (2) the cumulative freight time cost of truck traffic on the regular highway decreases slightly by 0.14 billion Yuan. The reason is that the freight time of a single truck remarkably decreases on one hand (as shown in Figure 6b), as the consequence of a greater capacity of the regular highway because permissible trucking hours are no longer limited to the nighttime once trucks meet the statutory limit; on the other hand, however, the truck traffic volume of the regular highway still increases (as shown in Figure 6c) by the RWR despite a lower modal share (as shown in Figure 6d), leading to a minor change in the freight time of truck traffic.
- (2)
- The RWR contributes a reduction of 5.62 billion Yuan of the CSC compared with the baseline, in which:
- The cumulative pavement maintenance cost (CPMC) drops remarkably by 4.49 billion Yuan. On one hand, the CPMC of the express highway increases by 1.33 billion Yuan, as the result of more operation times of corrective maintenance (as shown in Figure 7a) caused by more wear of tear to the pavement from a greater truck traffic volume. On the other hand, however, the CPMC of the regular highway decreases significantly by 5.82 billion Yuan, as the RWR effectively protects the pavement and reduces the operation times of costly restorative maintenance (as shown in Figure 7b).
- The cumulative greenhouse gas and air pollutant emissions cost (CGAC) decreases by 0.29 billion Yuan because the reduction of emissions of a single truck with a lighter payload contributes more than the increase in the truck traffic volume.
- The cumulative traffic accidents cost (CTAC) decreases by 0.84 billion Yuan, as the reduction in the traffic accidents rate under the RWR contributes more than the increase in the truck traffic volume.
- (3)
- In summary, the increase in the CEC is higher than the reduction in the CSC by the RWR, leading to an increase in the TCC by 5.24 billion Yuan in contrast to the baseline. This indicates that the RWR lowers the overall performance of the sustainability of the Cao-Tang freight system and is not an effective option.
6.2. Sustainable Effects of the MSR
- (1)
- The CECs of the three MSR scenarios present two important features, as shown in Figure 8a. First, within the initial stage of the simulation period, the CECs of all three MSR scenarios are higher than that of the RWR, and the higher the class of the railway, the greater the CEC value. At the end of the simulation period, this trend is just the opposite. Second, the CECs of all three MSR scenarios are higher than that of the baseline. The reasons are as follows:
- The CTPCs of all three MSR scenarios are lower than that of the RWR, and the higher the class of the railway, the lower the CTPC (as shown in Figure 8b), as the railway with a higher class shifts more freight away from highways and brings about less trucks fulfilling the freight demand of highways. However, the CTPC is still higher than that of the baseline even as the railway reaches Class I. This is because the railway is under construction in the first three years and many new trucks are to be purchased under the enforcement of the RWR, leading to a fast increase in the CTPC in the first three years of the simulation period.
- The CGCs of all three MSR scenarios are lower than that of the RWR (as shown in Figure 8c), owing to involvement of the railway as a more efficient mode for both operating and time costs. However, even when the railway reaches Class I, the CGC is still higher than that of the baseline, mainly due to the contribution of CGC within the first three years when the railway is under construction.
- The cumulative investments on railway infrastructure and locomotives (CIRI), which is additional to the RWR and the baseline, is determined by the technical specifications of the railway, and the higher the class of the railway, the greater the CIRI (as shown in Figure 8d).
- Summing up the above costs, it is clear that the trends of the CECs of MSR scenarios within the first three years are mainly caused by the additional CIRIs. After the railway is put into operation, the additional CIRIs are gradually offset by both the CTPCs and the CGCs with lower growth rates.
- (2)
- The CSCs of all three MSR scenarios are remarkably lower than that of the baseline and further lower than that of the RWR, and the higher the class of the railway, the lower the CSC (as shown in Figure 9a). The reasons are as follows:
- The CPMCs of all three MSR scenarios are further lower than that of the RWR, due to the joint effects of the RWR that protects the pavement and the MSR that reduces the truck traffic volume of highways, and the higher the class of the railway, the lower the CPMC (as shown in Figure 9b).
- The CGACs, as well as the CTACs, of all three scenarios are lower than those of the RWR, due to the involvement of the railway as a more fuel-efficient mode and safer mode, and the higher the class of the railway, the lower the CGAC and CTAC (as show in Figure 9c,d).
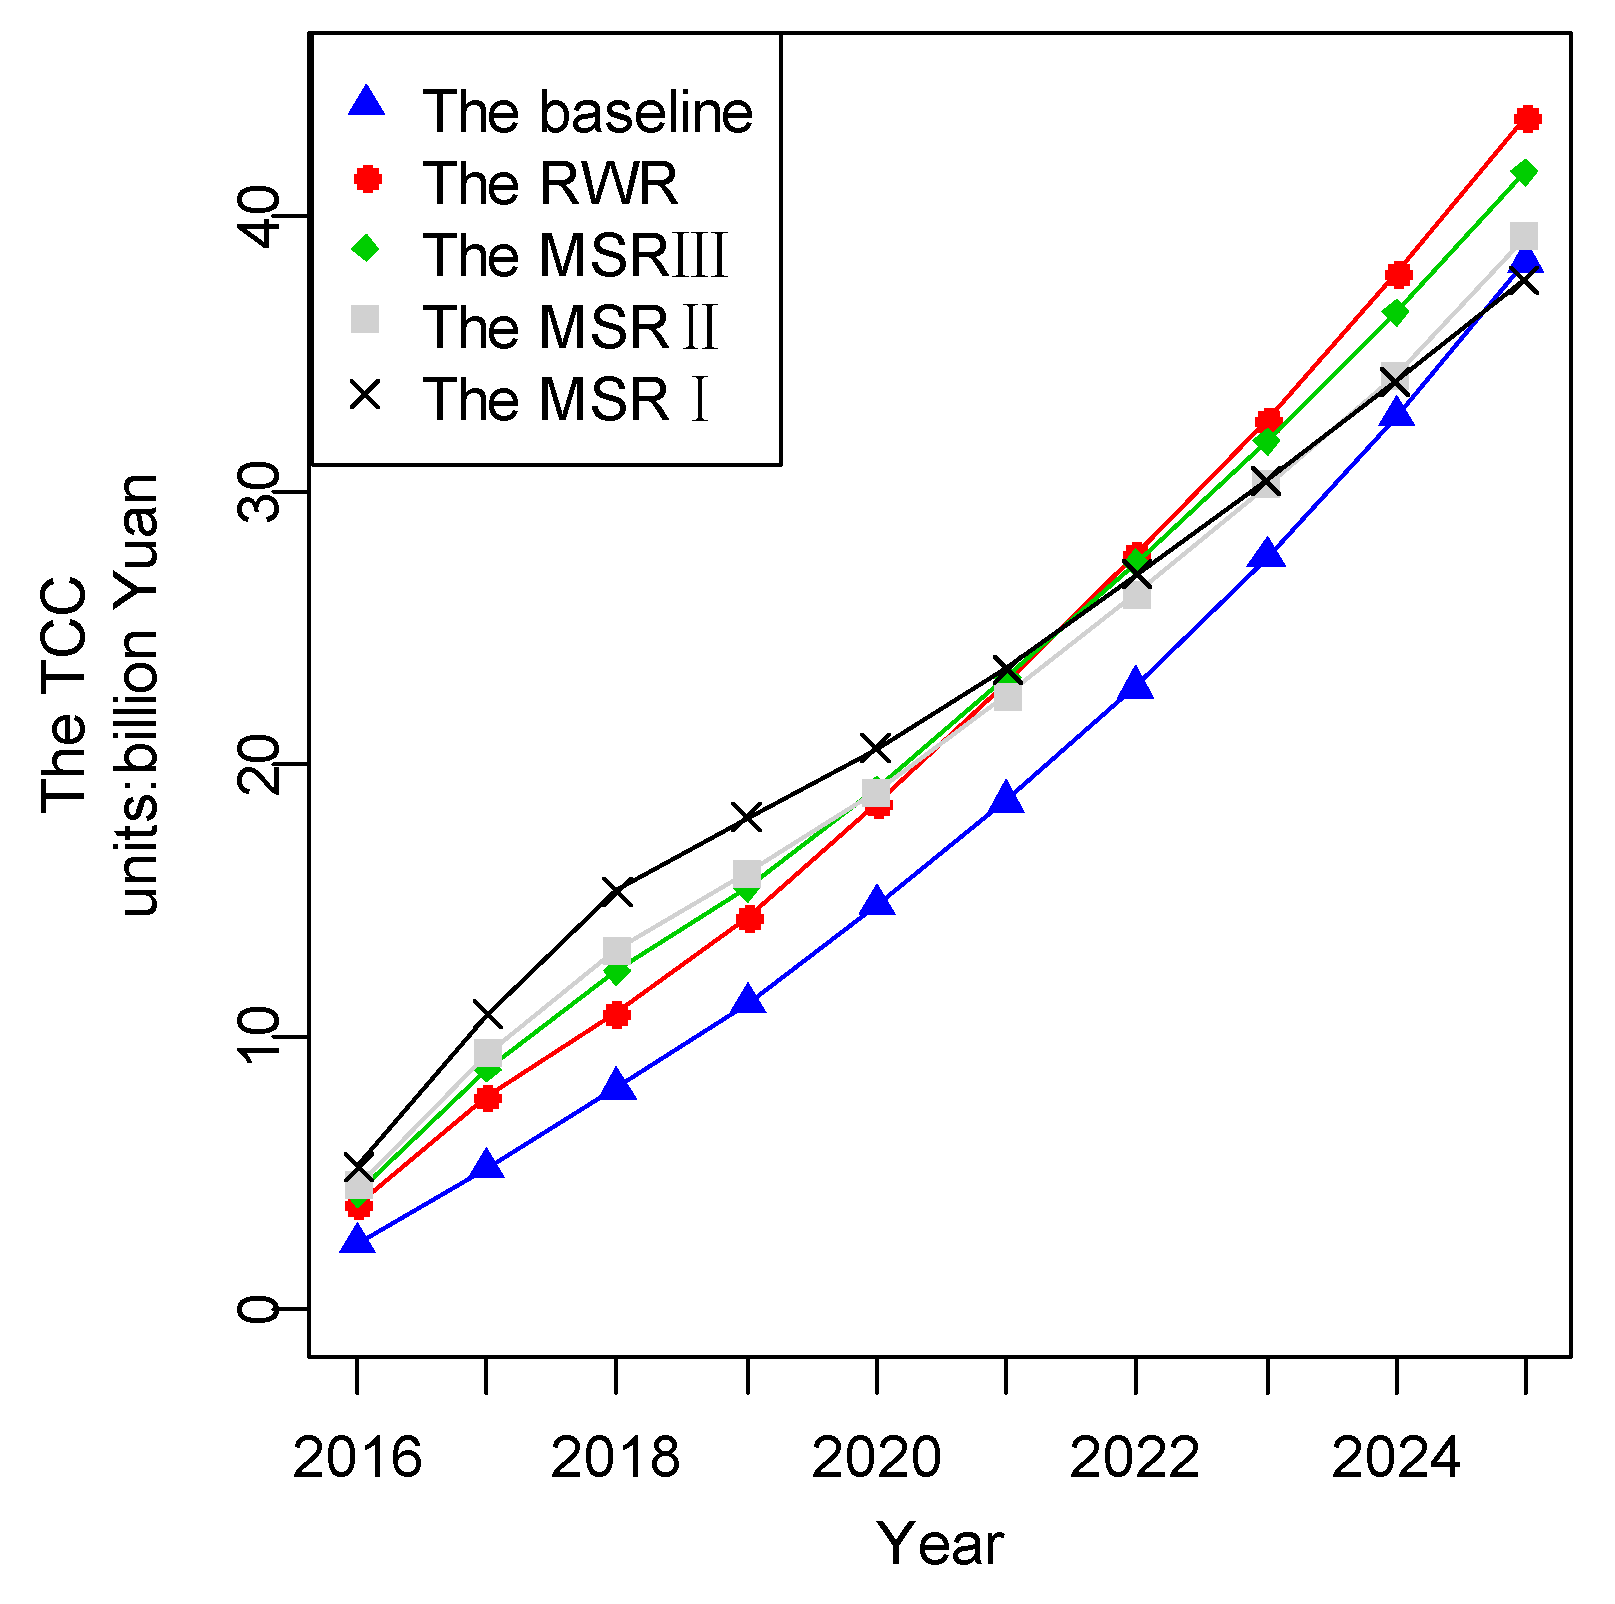
- (3)
- Summing up the CESs and the CSCs, the TCCs of the three MSR scenarios are obtained and compared with that of both the baseline and the RWR, as shown in Figure 10.
6.3. Discussion
- (1)
- The first scenario changes the processing method regarding railway investments. In the case of this study, railway investments, including investments on railway infrastructure and locomotives, are included in the CEC in form of one-time investments within the first three years during which the railway infrastructure is constructed. However, it is more widely accepted from an accounting perspective that the depreciation expense of railway investments should be used. Depreciation is a method of reallocating the cost of a tangible asset over its useful life span of it being in motion. Depreciation expense of an asset is calculated based on four criteria, including: (1) cost of the asset; (2) expected salvage value; (3) estimated useful life of the asset; and (4) a method of apportioning the cost over such a life span. In this scenario, the accumulated depreciation expense of railway investments, instead of one-time investments, is included in the CEC. Parameters regarding the depreciation expense calculation are shown in Table 6, referring to the specifications for administration of fixed assets of railway transport companies, released by China Railway Corporation in 2005.
- (2)
- The second scenario extends the simulation period of the model. It is worth noting that in the first scenario the sustainable effects of the MSR III are still worse than that of the baseline, even though the railway investments are handled as a depreciation expense. Particularly for the case of this study, the main disadvantage of multiple handling times and extra handling costs of railway transport is actually eliminated because both the Caofeidian port and steel companies in Tangshan are equipped with internal railways that can be connected seamlessly with the main railroad. The main cause is that the simulation period is preset as just 10 years, during which the advantage of railway transport for bulk freight (e.g., iron ore) cannot be fully exploited. The second scenario extends the simulation period by 10 years. The results show that the sustainable effects of the MSR III within a longer time span would be better than that of the baseline.
- (3)
- The third scenario lowers the average overloaded ratio of trucks within the baseline. In the case of this study, the average overload ratio of trucks is very high (165.7%) due to both the nature of iron ore with high density and the truck type, which is the largest among truck types in China. Regarding other cases, the average overloaded ratio of trucks may be lower as smaller trucks may be used. This scenario simulates this situation by assigning the average overloaded ratio of trucks in the baseline with a smaller value (30%). Under this setting, the results show that the baseline, namely tolerating the practice of overloaded trucking, is the worst option. The sustainable effects of the RWR are even better than the baseline, not to mention the MSR scenarios. This is mainly because the increase of the pavement maintenance cost incurred by trucks with a low overloaded ratio is higher than the decrease of freight operating cost.
- (4)
- The fourth scenario is more complicated as it simultaneously changes settings of several parameters. In the case of this study, the freight type is iron ore, which is characterized by high freight volume and overloaded ratio of trucks, but low freight VOT (value of time). Regarding other cases of IFSs, there may exists a freight type with the opposite characteristics, namely low freight volume and overloaded ratio, but high freight VOT (e.g., containers). This scenario simulates this situation by significantly raising the initial value of VOT from 70 Yuan/hour to 350 Yuan/hour and, meanwhile, reducing the initial value of freight volume from 9.37 million tons/year to 5 million tons/year and the overloaded ratio from 165.7% to 30%. Furthermore, trucking legs at both ends of railway line should be considered because there are usually no feeder railways for both shippers and consignees regarding other freight types except bulk freight. Under these settings, the results show that the RWR is the best option, for the reason that is similar with that of the third scenario. The results also show that the sustainable effects of all three MSR scenarios are worse than that of the baseline. This is because of a higher handling cost caused by multiple handling times due to the existence of trucks feeding processes and, furthermore, a higher time cost is incurred due to both a higher freight handling time and a greater VOT.
7. Conclusions
Further Research
Acknowledgments
Author Contributions
Conflicts of Interest
References
- Mihyeon Jeon, C.; Amekudzi, A. Addressing sustainability in transportation systems: Definitions, indicators, and metrics. J. Infrastruct. Syst. 2005, 11, 31–50. [Google Scholar] [CrossRef]
- Cormier, A.; Gilbert, R. Defining Sustainable Transportation. Available online: http://cst.uwinnipeg.ca/documents/Defining_Sustainable_2005.pdf (accessed on 21 July 2015).
- Haghshenas, H.; Vaziri, M. Urban Sustainable transportation indicators for global comparison. Ecol. Indic. 2012, 15, 115–121. [Google Scholar] [CrossRef]
- Kadłubek, M. Examples of sustainable development in the area of transport. Procedia Econ. Financ. 2015, 27, 494–500. [Google Scholar] [CrossRef]
- Goldman, T.; Gorham, R. Sustainable urban transport: Four innovative directions. Technol. Soc. 2006, 28, 261–273. [Google Scholar] [CrossRef]
- Sosa, A.; Klvac, R.; Coates, E.; Kent, T.; Devlin, G. Improving log loading efficiency for improved sustainable transport within the Irish forest and biomass sectors. Sustainability 2015, 7, 3017–3030. [Google Scholar] [CrossRef]
- Hang, W.; Li, X. Application of system dynamics for evaluating truck weight regulations. Transp. Policy 2010, 17, 240–250. [Google Scholar] [CrossRef]
- Liu, P.; Mu, D. Evaluating sustainability of truck weight regulations: A system dynamics view. J. Ind. Eng. Manag. 2015, 8, 1711–1730. [Google Scholar] [CrossRef]
- Tsamboulas, D.; Vrenken, H.; Lekka, A.M. Assessment of a transport policy potential for intermodal mode shift on a European scale. Transp. Res. Part A Policy Pract. 2007, 41, 715–733. [Google Scholar] [CrossRef]
- Woodburn, A.; Browne, M.; Piotrowska, M.; Allen, J. Literature Review WM7: Scope for Modal Shift through Fiscal, Regulatory and Organisational Change. Available online: http://www.greenlogistics.org/SiteResources/e03d3ccc-eabe-4a86-b575-ef0e5d465343_WM7%20-%20Westminster%20-%20Modal%20Shift.pdf (accessed on 10 July 2015).
- Park, M.; Regan, A.; Yang, C.H. Emissions impacts of a modal shift: A case study of the Southern California ports region. J. Int. Logist. Trade 2007, 5, 67–81. [Google Scholar]
- Johnston, M.; Bickford, E.; Holloway, T.; Dresser, C.; Adams, T.M. Impacts of biodiesel blending on freight emissions in the Midwestern United States. Transp. Res. Part D Transp. Environ. 2012, 17, 457–465. [Google Scholar] [CrossRef]
- Bickford, E.; Holloway, T.; Karambelas, A.; Johnston, M.; Adams, T.; Janssen, M.; Moberg, C. Emissions and air quality impacts of truck-to-rail freight modal shifts in the Midwestern United States. Environ. Sci. Technol. 2013, 48, 446–454. [Google Scholar] [CrossRef] [PubMed]
- Regmi, M.B.; Hanaoka, S. Assessment of modal shift and emissions along a freight transport corridor between Laos and Thailand. Int. J. Sustain. Transp. 2015, 9, 192–202. [Google Scholar] [CrossRef]
- Awasthi, A.; Chauhan, S.S.; Omrani, H. Application of fuzzy TOPSIS in evaluating sustainable transportation systems. Expert. Syst. Appl. 2011, 38, 12270–12280. [Google Scholar] [CrossRef]
- Vermote, L.; Macharis, C.; Putman, K. A road network for freight transport in Flanders: Multi-actor multi-criteria assessment of alternative ring ways. Sustainability 2013, 5, 4222–4246. [Google Scholar] [CrossRef]
- Tang, X.; Zhang, J.; Xu, P. A multi-objective optimization model for sustainable logistics facility location. Transp. Res. Part D Transp. Environ. 2013, 22, 45–48. [Google Scholar]
- Hajibabai, L.; Bai, Y.; Ouyang, Y. Joint optimization of freight facility location and pavement infrastructure rehabilitation under network traffic equilibrium. Transp. Res. Part B Meth. 2014, 63, 38–52. [Google Scholar] [CrossRef]
- Qu, Y.; Bektaş, T.; Bennell, J. Sustainability SI: Multimode multicommodity network design model for intermodal freight transportation with transfer and emission costs. Netw. Spat. Econ. 2016, 16, 303–329. [Google Scholar] [CrossRef]
- Anand, N.; van Duin, R.; Tavasszy, L. Ontology-based multi-agent system for urban freight transportation. Int. J. Urban Sci. 2014, 18, 133–153. [Google Scholar] [CrossRef]
- Van Lier, T.; Caris, A.; Macharis, C. Sustainability SI: Bundling of outbound freight flows: Analyzing the potential of internal horizontal collaboration to improve sustainability. Netw. Spat. Econ. 2016, 16, 277–302. [Google Scholar] [CrossRef]
- Aditjandra, P.T.; Galatioto, F.; Bell, M.C.; Zunder, T.H. Evaluating the impacts of urban freight traffic: Application of micro-simulation at a large establishment. Eur. J. Transp. Infrastruct. Res. 2016, 16, 4–22. [Google Scholar]
- Schade, W.; Rothengatter, W. Strategic sustainability analysis: Broadening existing assessment approaches for transport policies. Transp. Res. Rec. 2001, 1756, 3–11. [Google Scholar] [CrossRef]
- De Jong, G.; Gunn, H.; Walker, W. National and international freight transport models: An overview and ideas for future development. Transp. Rev. 2004, 24, 103–124. [Google Scholar] [CrossRef]
- Homer, J.B.; Keane, T.E.; Lukiantseva, N.O. Evaluating Strategies to Improve Railroad Performance—A System Dynamics Approach. Available online: http://www.norbridgeinc.com/industries/WSC172.pdf (accessed on 12 October 2015).
- Ülengin, F.; Kabak, Ö.; Önsel, Ş.; Ülengin, B.; Aktaş, E. A Problem-structuring model for analyzing transportation-environment relationships. Eur. J. Oper. Res. 2010, 200, 844–859. [Google Scholar] [CrossRef]
- Richardson, B.C. Sustainable transport: Analysis frameworks. J. Transp. Geogr. 2005, 13, 29–39. [Google Scholar] [CrossRef]
- Maheshwari, P.; Khaddar, R.; Kachroo, P.; Paz, A. Dynamic modeling of performance indices for planning of sustainable transportation systems. Netw. Spat. Econ. 2016, 16, 371–393. [Google Scholar] [CrossRef]
- Shepherd, S.P. A review of system dynamics models applied in transportation. Transp. B Transp. Dynam. 2014, 2, 83–105. [Google Scholar] [CrossRef]
- Abbas, K.A.; Bell, M.G. System dynamics applicability to transportation modeling. Transp. Res. Part A Policy Pract. 1994, 28, 373–390. [Google Scholar] [CrossRef]
- Han, J.; Hayashi, Y. A system dynamics model of CO2 mitigation in China’s inter-city passenger transport. Transp. Res. Part D Transp. Environ. 2008, 13, 298–305. [Google Scholar] [CrossRef]
- Ercan, T.; Onat, N.C.; Tatari, O. Investigating carbon footprint reduction potential of public transportation in United States: A system dynamics approach. J. Clean. Prod. 2016, 133, 1260–1276. [Google Scholar] [CrossRef]
- Fiorello, D.; Fermi, F.; Bielanska, D. The ASTRA model for strategic assessment of transport policies. Syst. Dynam. Rev. 2010, 26, 283–290. [Google Scholar] [CrossRef]
- Haghani, A.; Lee, S.Y.; Byun, J.H. A system dynamics approach to land use/transportation system performance modeling part I: Methodology. J. Adv. Transp. 2003, 37, 1–41. [Google Scholar] [CrossRef]
- Fallah-Fini, S.; Rahmandad, H.; Triantis, K.; de la Garza, J.M. Optimizing highway maintenance operations: Dynamic considerations. Syst. Dynam. Rev. 2010, 26, 216–238. [Google Scholar] [CrossRef]
- Goh, Y.M.; Love, P.E. Methodological application of system dynamics for evaluating traffic safety policy. Saf. Sci. 2012, 50, 1594–1605. [Google Scholar] [CrossRef]
- Liu, S.; Triantis, K.P.; Sarangi, S. A framework for evaluating the dynamic impacts of a congestion pricing policy for a transportation socioeconomic system. Transp. Res. Part A Policy Pract. 2010, 44, 596–608. [Google Scholar] [CrossRef]
- Cao, J.; Menendez, M. System dynamics of urban traffic based on its parking-related-states. Transp. Res. Part B Meth. 2015, 81, 718–736. [Google Scholar] [CrossRef]
- China Railway Corporation. Code for Design of Railway Line (GB 50090-2006); China Planning Press: Beijing, China, 2006. (In Chinese) [Google Scholar]
- Hao, H.; Wang, H.W.; Ouyang, M.G.; Cheng, F. Vehicle survival patterns in China. Sci. China Technol. Sci. 2011, 54, 625–629. [Google Scholar] [CrossRef]
- Ministry of Transport of China. Specifications for Design of Highway Asphalt Pavement (JTG D20-2006); China Communications Press: Beijing, China, 2006. (In Chinese)
- Sun, L.; Liu, X. General deterioration equation for pavement performance. J. Tongji Univ. 1995, 23, 512–518. (In Chinese) [Google Scholar]
- Saha, P.; Sarkar, A.K.; Pal, M. Evaluation of speed-flow characteristics on two-lane highways with mixed traffic. Transport 2015. [Google Scholar] [CrossRef]
- Krause, A.; Musingwini, C. Modelling open pit shovel-truck systems using the Machine Repair Model. J. S. Afr. Inst. Min. Metall. 2007, 107, 469–476. [Google Scholar]
- Fiorello, D.; Martino, A.; Rinaldi, M. The ASTRA-Italia Model for Strategic Assessment of Transport Policies and Investments. Available online: http://www.systemdynamics.org/conferences/2002/proceed/papers/Fiorell1.pdf (accessed on 6 December 2014).
- Hang, W.; Li, X.; He, J. Research of highway freight vehicle operating cost based on vehicle axle type classification. J. Highw. Transp. Res. Dev. 2005, 22, 170–174. (In Chinese) [Google Scholar]
- Maurer, H.H. Development of an Integrated Model for Estimating Emissions from Freight Transport. Available online: http://www.its.leeds.ac.uk/peat/images/uploads/1257162332MAURER%20PhD%20thesis.pdf (accessed on 20 October 2015).
- Niu, J. Prediction of demand for iron ores in China based on principal component regression analysis. J. Univ. Sci. Technol. Beijing 2011, 33, 1178–1181. (In Chinese) [Google Scholar]
- Jia, L.; Xu, D. Analysis and prediction of the demand for iron ore: Using panel, grey, co-integration and ARIMA models. Resour. Sci. 2014, 36, 1382–1391. (In Chinese) [Google Scholar]


| Abbreviations | Comments | Abbreviations | Comments |
|---|---|---|---|
| IFS | Intercity freight system | VOT | Value of time |
| SD | System dynamics | PCU | Passenger car unit |
| CDRL | Code for design of railway line | RWR | Rigid weight regulation |
| FGM | Freight generation module | MSR | Modal shift from road towards railway |
| FEM | Fleet evolution module | TCC | Total cumulative cost |
| FIM | Freight infrastructures module | CEC | Cumulative economic cost |
| FTM | Freight time module | CSC | Cumulative social cost |
| MSM | Modal split module | CGC | Cumulative generalized cost |
| PEM | Policy evaluation module | CTPC | Cumulative truck purchasing cost |
| PPI | Pavement performance indicator | CPMC | Cumulative pavement maintenance cost |
| SDHAP | Specifications for design of highway asphalt pavement | CGAC | Cumulative greenhouse gas and air pollutant emissions cost |
| RM | Restorative maintenance | CTAC | Cumulative traffic accidents cost |
| CM | Corrective maintenance | CIRI | Cumulative investments on railway infrastructure and locomotives |
| Maintenance Operations | Thresholds of PPI Values | Maintenance Effects |
|---|---|---|
| Restorative Maintenance (RM) | , | , |
| Corrective Maintenance (CM) | , | , |
| Do Nothing (DN) | , | - |
| Parameters | Values/Units |
|---|---|
| Initial value of the freight volume | 9.37 × 10⁶ tons |
| Annual growth rate of the freight volume | 4.13%, 2015–2019; 2.92%, 2020–2025 |
| Maximum cumulative equivalent axles of the express highway | 42.18 × 10⁶ axles |
| Maximum cumulative equivalent axles of the regular highway | 33.00 × 10⁶ axles |
| PCU of the trucks on the express highway | 7.0 PCU/vehicle |
| PCU of the trucks on the regular highway | 5.5 PCU/vehicle |
| Mileage of the express highway | 90.7 km |
| Mileage of the regular highway | 94.9 km |
| Average payload of trucks on the express highway | 35 tons/vehicle |
| Average payload of trucks on the regular highway | 93 tons/vehicle |
| Initial value of the railway operating cost | 0.09 Yuan/ton∙km |
| Annual growth rate of the trucking operating cost | 2.84% |
| Annual growth rate of the railway operating cost | 5% |
| Initial value of iron ore’s value of time | 70 Yuan/hour |
| Annual growth rate of iron ore’s value of time | 2% |
| Technical Parameters | Values | |||
|---|---|---|---|---|
| Class III | Class II | Class I | ||
| Lines | Maximum capacity | 10 × 106 tons/year | 20 × 106 tons/year | 30 × 106 tons/year |
| Number of tracks | Double-track | Double-track | Double-track | |
| Length | 110 km | 110 km | 110 km | |
| Construction period | 3 years | 3 years | 3 years | |
| Construction cost | 13 × 106 Yuan/km | 20 × 106 Yuan/km | 40 × 106Yuan/km | |
| Block system | Semi-automatic | Semi-automatic | Semi-automatic | |
| Locomotives | Type | DongFeng4B | DongFeng4D | HeXieNeiran3 |
| Engine power | Diesel | Diesel | Diesel | |
| Traction tons | 2500 tons | 4000 tons | 5000 tons | |
| Price | 4.7 × 10⁶ Yuan | 7 × 10⁶ Yuan | 10.5 × 10⁶ Yuan | |
| Scenarios Setting | Sustainable Effects of Modal Shift Policies | |||||
|---|---|---|---|---|---|---|
| Best → Worst | ||||||
| 0 | Current setting | MSR I | Baseline | MSR II | MSR III | RWR |
| 1 | Depreciation of railway investments | MSR II | MSR II | Baseline | MSR III | RWR |
| 2 | Depreciation of railway investments + Extended simulation period | MSR I | MSR II | MSR III | Baseline | RWR |
| 3 | Lower overloaded ratio of trucks | MSR I | MSR II | MSR III | RWR | Baseline |
| 4 | Depreciation of railway investments + Higher VOT + Lower freight volume and overloaded ratio | RWR | Baseline | MSR III | MSR II | MSR I |
| Salvage Rate | Useful Life Span | Depreciation Method | |
|---|---|---|---|
| Lines | 3% | 45 years | Straight-line |
| Locomotives | 5.04% | 20 years | Straight-line |
© 2017 by the authors. Licensee MDPI, Basel, Switzerland. This article is an open access article distributed under the terms and conditions of the Creative Commons Attribution (CC BY) license ( http://creativecommons.org/licenses/by/4.0/).
Share and Cite
Liu, P.; Mu, D.; Gong, D. Eliminating Overload Trucking via a Modal Shift to Achieve Intercity Freight Sustainability: A System Dynamics Approach. Sustainability 2017, 9, 398. https://doi.org/10.3390/su9030398
Liu P, Mu D, Gong D. Eliminating Overload Trucking via a Modal Shift to Achieve Intercity Freight Sustainability: A System Dynamics Approach. Sustainability. 2017; 9(3):398. https://doi.org/10.3390/su9030398
Chicago/Turabian StyleLiu, Pei, Dong Mu, and Daqing Gong. 2017. "Eliminating Overload Trucking via a Modal Shift to Achieve Intercity Freight Sustainability: A System Dynamics Approach" Sustainability 9, no. 3: 398. https://doi.org/10.3390/su9030398
APA StyleLiu, P., Mu, D., & Gong, D. (2017). Eliminating Overload Trucking via a Modal Shift to Achieve Intercity Freight Sustainability: A System Dynamics Approach. Sustainability, 9(3), 398. https://doi.org/10.3390/su9030398