1. Introduction
To achieve the ultimate goal of environmental sustainability, efforts in the use stage are as necessary as those in the manufacturing and recycling stages. The concept of “design for sustainable behavior” (DfSB) that leads users of products or services to behavioral change for the purpose of environmental sustainability has caught much attention since a rebound effect was observed where people pay less attention to sustainable behavior, such as turning power off after they adopted energy efficient light bulbs (Midden [
1]). On the other hand, behavior change support systems (BCSS) is a key construct of research on persuasive technology and persuasive system design, and often adopts some design strategies to persuade users toward behavior changes. Oinas-Kukkonen [
2] gave a definition of “behavior change support system” (BCSS) as: “a socio-technical information system with psychological and behavioral outcomes designed to form, alter or reinforce attitudes, behaviors or an act of complying without using coercion or deception”. In light of the concepts of DfSB and BCSS, this study focuses on selecting effective persuasive strategies and game elements that could be used in design for energy-saving behavior. Many studies have contributed to this interdisciplinary area and some examples are reviewed in the next section. This work emphasizes that selecting persuasive strategies and game design elements should not be in one-size-fits-all manner, since target users may be individuals with different backgrounds, attitudes, and motives. Via a questionnaire survey, we adopt a data-driven approach towards selecting persuasive strategies by considering the difference in users’ attributes to enhance the persuasiveness of BCSS design. To find appropriate game design elements that could work together with a persuasive strategy, an affinity diagram method is used to map the elements to persuasive strategies based on experts’ opinions.
This article is structured as follows:
Section 2 reviews literature about persuasive strategies, persuasive design, game design elements, and related cases.
Section 3,
Section 4,
Section 5 and
Section 6 discuss and present four parts of the work, including (1) by reviewing literature and analyzing more than twenty eight cases of information systems that persuade users to adopt energy-saving behavior, twelve useful persuasive strategies are selected and recommended. (2) Through a questionnaire survey and statistical analyses, the persuasiveness of twelve persuasive strategies applied in design for encouraging energy-saving behavior is explored for different user groups. (3) After screening a group of relevant game design elements, an affinity diagram method is applied to establish the relationship between persuasive strategies and game design elements. (4) Using the results derived from the affinity diagram and statistical analyses, design suggestions can be provided by considering users’ attributes. An illustrative example is presented to demonstrate the application potential of the research results.
2. Literature Review
This section of literature review includes four parts: (1) persuasive technology and persuasive strategy, (2) gamification and game design elements, (3) the relation between persuasive strategies and game design elements, and (4) the cases of information systems aiming at energy-saving behaviors.
2.1. Persuasive Technology and Persuasive Strategy
Fogg [
3] pioneered the concept of persuasive technology that focuses on computer and information technology used to change people’s attitudes or behavior. Fogg mentioned that there are three fundamental ways of using computer functions to persuade people of desired behavior, including tool, medium, and social actors. Oinas-Kukkonen [
2] defined a type of emerging information systems as behavior change support system applying the concept of persuasive technology, whereas the information systems could be web portals, smart-phone applications, or traditional information systems. Hamari et al. [
4] reported that the concept of persuasive design and technology has received a growing interest in many domains, such as health, exercise, ecological consumption, education, and commercial marketing. Wiafe and Nakata [
5] mentioned that the majority of persuasive systems are provided for health promotion, while 25% of them were designed for environmental sustainability. Oinas-Kukkonen and Harjumaa [
6] proposed a method called persuasive system design (PSD) that includes twenty eight useful persuasive strategies under four categories, including primary task support, computer-human dialog support, system credibility, and social support. Since users with different motives or backgrounds may perceive persuasive strategies in different ways, several researches have stated that individual differences including demographic and psychological factors are important to behavior change for energy usage and saving (Abrahamse and Steg [
7]; Frederiks et al. [
8]). Gabrielli et al. [
9] developed an Android prototype for sustainable urban mobility that employed four behavior change strategies including goal-setting, self-monitoring, personalized notifications, and sharing. Petkov et al. [
10] designed a mock-up screen for an eco-feedback system that provides different types of feedback information and the results show that people with different levels of environmental awareness are motivated by different types of feedback. Orji et al. [
11] examined the persuasiveness of ten commonly used persuasive strategies for healthy eating and estimated the persuasiveness of these ten strategies for seven gamer types via a questionnaire survey. Orji [
12] investigated the persuasiveness of persuasive strategies commonly employed in persuasive games with respect to gender differences. In the literature, there are no publications working on persuasive design for energy behavior considering the difference in users’ attributes.
2.2. Gamification and Game Elements
Many studies considered “gamification” and depicted its application potential in different contexts. Some examples include Deterding et al. [
13], Huotari & Hamari [
14], Werbach & Hunter [
15], and Zichermann & Cunningham [
16]. Deterding et al. [
13] defined gamification as “the use of game design elements in non-game contexts” and indicated that it has been largely adopted in the software industry to make users feel fun and love to use a product. Deterding et al. [
13] also identified game design elements as those elements, which are easily found in most of games, playing an important role in designing games and expressing the game’s characteristics. Many researchers adopted the game design framework—game mechanics, game dynamics, and game aesthetics (MDA) proposed by Hunicke et al. [
17] to analyze what game elements could be included in a design (Blohm & Leimeister [
18]; Bunchball [
19]; Kim [
20]; Zichermann & Cunningham [
16]). Game mechanics refer to the particular components of the game, at the level of data representation and algorithms, and are the various actions, behavior, and control mechanisms afforded to players within a game context. Game dynamics could be described as the run-time behavior of the mechanics acting on player inputs and each other’s outputs over time from designers’ perspective or from players’ perspective. Game dynamics works to create game experiences. Game aesthetics are about how a game affects players’ feelings. Above studies provide sources for collecting candidates of the design elements of game mechanics and game dynamics for design for energy-saving behavior.
2.3. Persuasive Strategies and Gamification
With the introduction of persuasive strategy and gamification, one interesting question is whether the two can be applied together. Froehlich [
21] gave two conceptual illustrations describing the role of persuasive technology and gamification with respect to environmental sustainability. He stated that green gamification is an emerging research area covering persuasive technology, eco-feedback, and environmental psychology. Werbach [
22] also mentioned that gamification is a form of persuasive design and it can effectively promote both motivation and ability for persuasion. While comparing persuasive strategies with game design elements, Hamari et al. [
23] noted that persuasive technology emphasizes on social and communicative persuasion and attitude change, whereas gamification focuses more on invoking users’ (intrinsic) motivations. Huber and Hilty [
24] argued that there were some limitations of persuasive technology in the design of BCSSs for energy-saving and proposed four design suggestions in the gamification-based design method. To bridge the gap between game design and persuasive design, Orji et al. [
11] used an affinity diagram method to map the common game design elements to persuasive strategies for designing persuasive games for healthy eating behavior. In this work, game design elements are collected from the literature and gamification websites and analyzed with the MDA framework to identify relevant game design elements for energy-saving behavior.
2.4. Cases of Design for Energy-Saving Behavior
In this section, products and information systems designed to encouraging more energy-saving behavior are collected and briefly discussed. These collected cases fall into three categories according to application settings:
- (A)
Information systems put in smart home platforms: Karlin et al. [
25] defined a smart home platform as a software platform that delivered a managed environment and provided core household services to enable a standardized way for devices and appliances to interact. A group as a good example is often called home energy management systems (HEMS) that generate and deliver various reports, analyses, and plots for energy usage to the users. Case examples referred to the above description include In-Snergy Family, Presence Pro Energy, and Wiser Smart.
- (B)
Information systems set for data analytics: Karlin et al. [
25] mentioned that data analytics platforms could help analyze large volumes of data collected from smart hardware or utility meters to provide insight about energy usage. For example, Opower provides services to utility companies and helps analyze the energy usage data and generate energy usage reports delivered to their customers. In the US, a program called “green button” is executed for encouraging consumers to understand and manage their energy usage by downloading their energy usage data from the utility companies. Thus, several apps with green button have been developed, such as Leafully, Kill-Ur-Watts, and WattzOn.
- (C)
Web and mobile application platform: Some applications related to energy saving or reducing climate change effects are developed and can be downloaded for free from application stores. Examples like Oroeco and Low Carbon Emission allow users to log in and manually input their living patterns and energy-saving actions so that the carbon emissions of self-reported behavior could be calculated and presented. JouleBug is another social mobile application that could record energy-saving actions undertaken by users, and users can share the performance of energy-saving behavior to their social networks. An information system called “Professor Tanda” (Chamberlain et al. [
26]) is also an application working on mobile phones that can collect users’ habits or activities through a series of dialogs between users and the virtual Professor Tanda.
In addition to simply summarizing information and making plots, some information systems have actively employed persuasive strategies of PSD for persuading users toward energy-saving behavior. For example, WattzOn is an energy management platform that helps people save energy where persuasive strategies like personalization, self-monitoring, simulation, rewards, reminders, suggestions, social comparison, cooperation, and goal-setting are employed. Eco Island (Takayama et al. [
27]) is a system developed to persuade individuals and families to change their energy usage habits for reducing CO
2 emissions. Wiafe and Nakata [
5] reviewed the papers which were presented in the International Conferences on Persuasive Technology from 2006 to 2010 and identified feedback, simulation, suggestion, self-monitoring, reward, and social roles as the most frequently used persuasive strategies in the persuasive designs related to environmental issues. In the context of the Peacox project (Busch et al. [
28]), personalized mobile or web tools are designed to persuade people to travel in an eco-friendly way. Corbett [
29] analyzed the persuasive design principles used in the Carbon Management Systems (CMS), which is designed and used in organizations to persuade employees toward environmental behaviors. Wunsch et al. [
30] explored the capacity of persuasive strategies for encouraging biking.
3. Screening Relevant Persuasive Strategies and Questionnaire Design
To help designers select more persuasive strategies employed in the design for encouraging energy-saving behavior considering user attributes, a data-driven approach is adopted to explore the possible demographic differences on persuasiveness of various persuasive strategies via a questionnaire survey. It’s expected that statistical analysis results can direct some useful design suggestions for selecting effective persuasive strategies as target user groups are specified. This section presents how to screen the candidates of persuasive strategies via literature review and existing application cases. In next section, a survey is conducted by putting these candidates of persuasive strategies into a questionnaire and presented via storyboards to collect the responses from potential users. Designers could use the persuasive strategies that are perceived more persuasive for the target users, as the statistical results of the survey show that persuasiveness of strategies are significantly different for different user groups.
Since only a limited number of persuasive strategies can be presented in the questionnaire to get reasonable responses from respondents, an analysis of the candidates of strategies from the literature is conducted. In addition to the 28 persuasive strategies proposed by Oinas-Kukkonen and Harjumaa [
6], two more persuasive strategies are identified, including a strategy called “creating of awareness” mentioned in Busch et al. [
28] and a strategy called “goal-setting” mentioned in Gabrielli et al. [
9] and Malhotra et al. [
31].
To learn more about the practical application of these candidate persuasive strategies, this study collected case information systems for encouraging energy-saving behavior and checked if the strategies were used in each case. A total of 28 cases that fall into the three categories mentioned in
Section 2 for encouraging energy-saving behavior are collected. To screen out the most frequently used and relevant strategies, the thirty candidates of strategies were carefully examined by checking (1) the relevance of each strategy to design for energy-saving behavior, (2) how many times each strategy has been used in the 28 collected cases, and (3) whether the strategy can be clearly depicted in storyboard and comprehended by respondents. At the end, the 30 candidates of persuasive strategies were reduced to twelve strategies. These twelve persuasive strategies shown in
Table 1 were presented in the questionnaire. Some design examples of the strategies are illustrated in
Table A1.
A questionnaire survey was conducted to explore the possible demographic differences in the persuasiveness of persuasive strategies. The questionnaire includes three parts: (1) the first part of the questionnaire is to measure the persuasiveness of each persuasive strategy. Each persuasive strategy is presented using a storyboard that was drawn following the guideline suggested by Truong et al. [
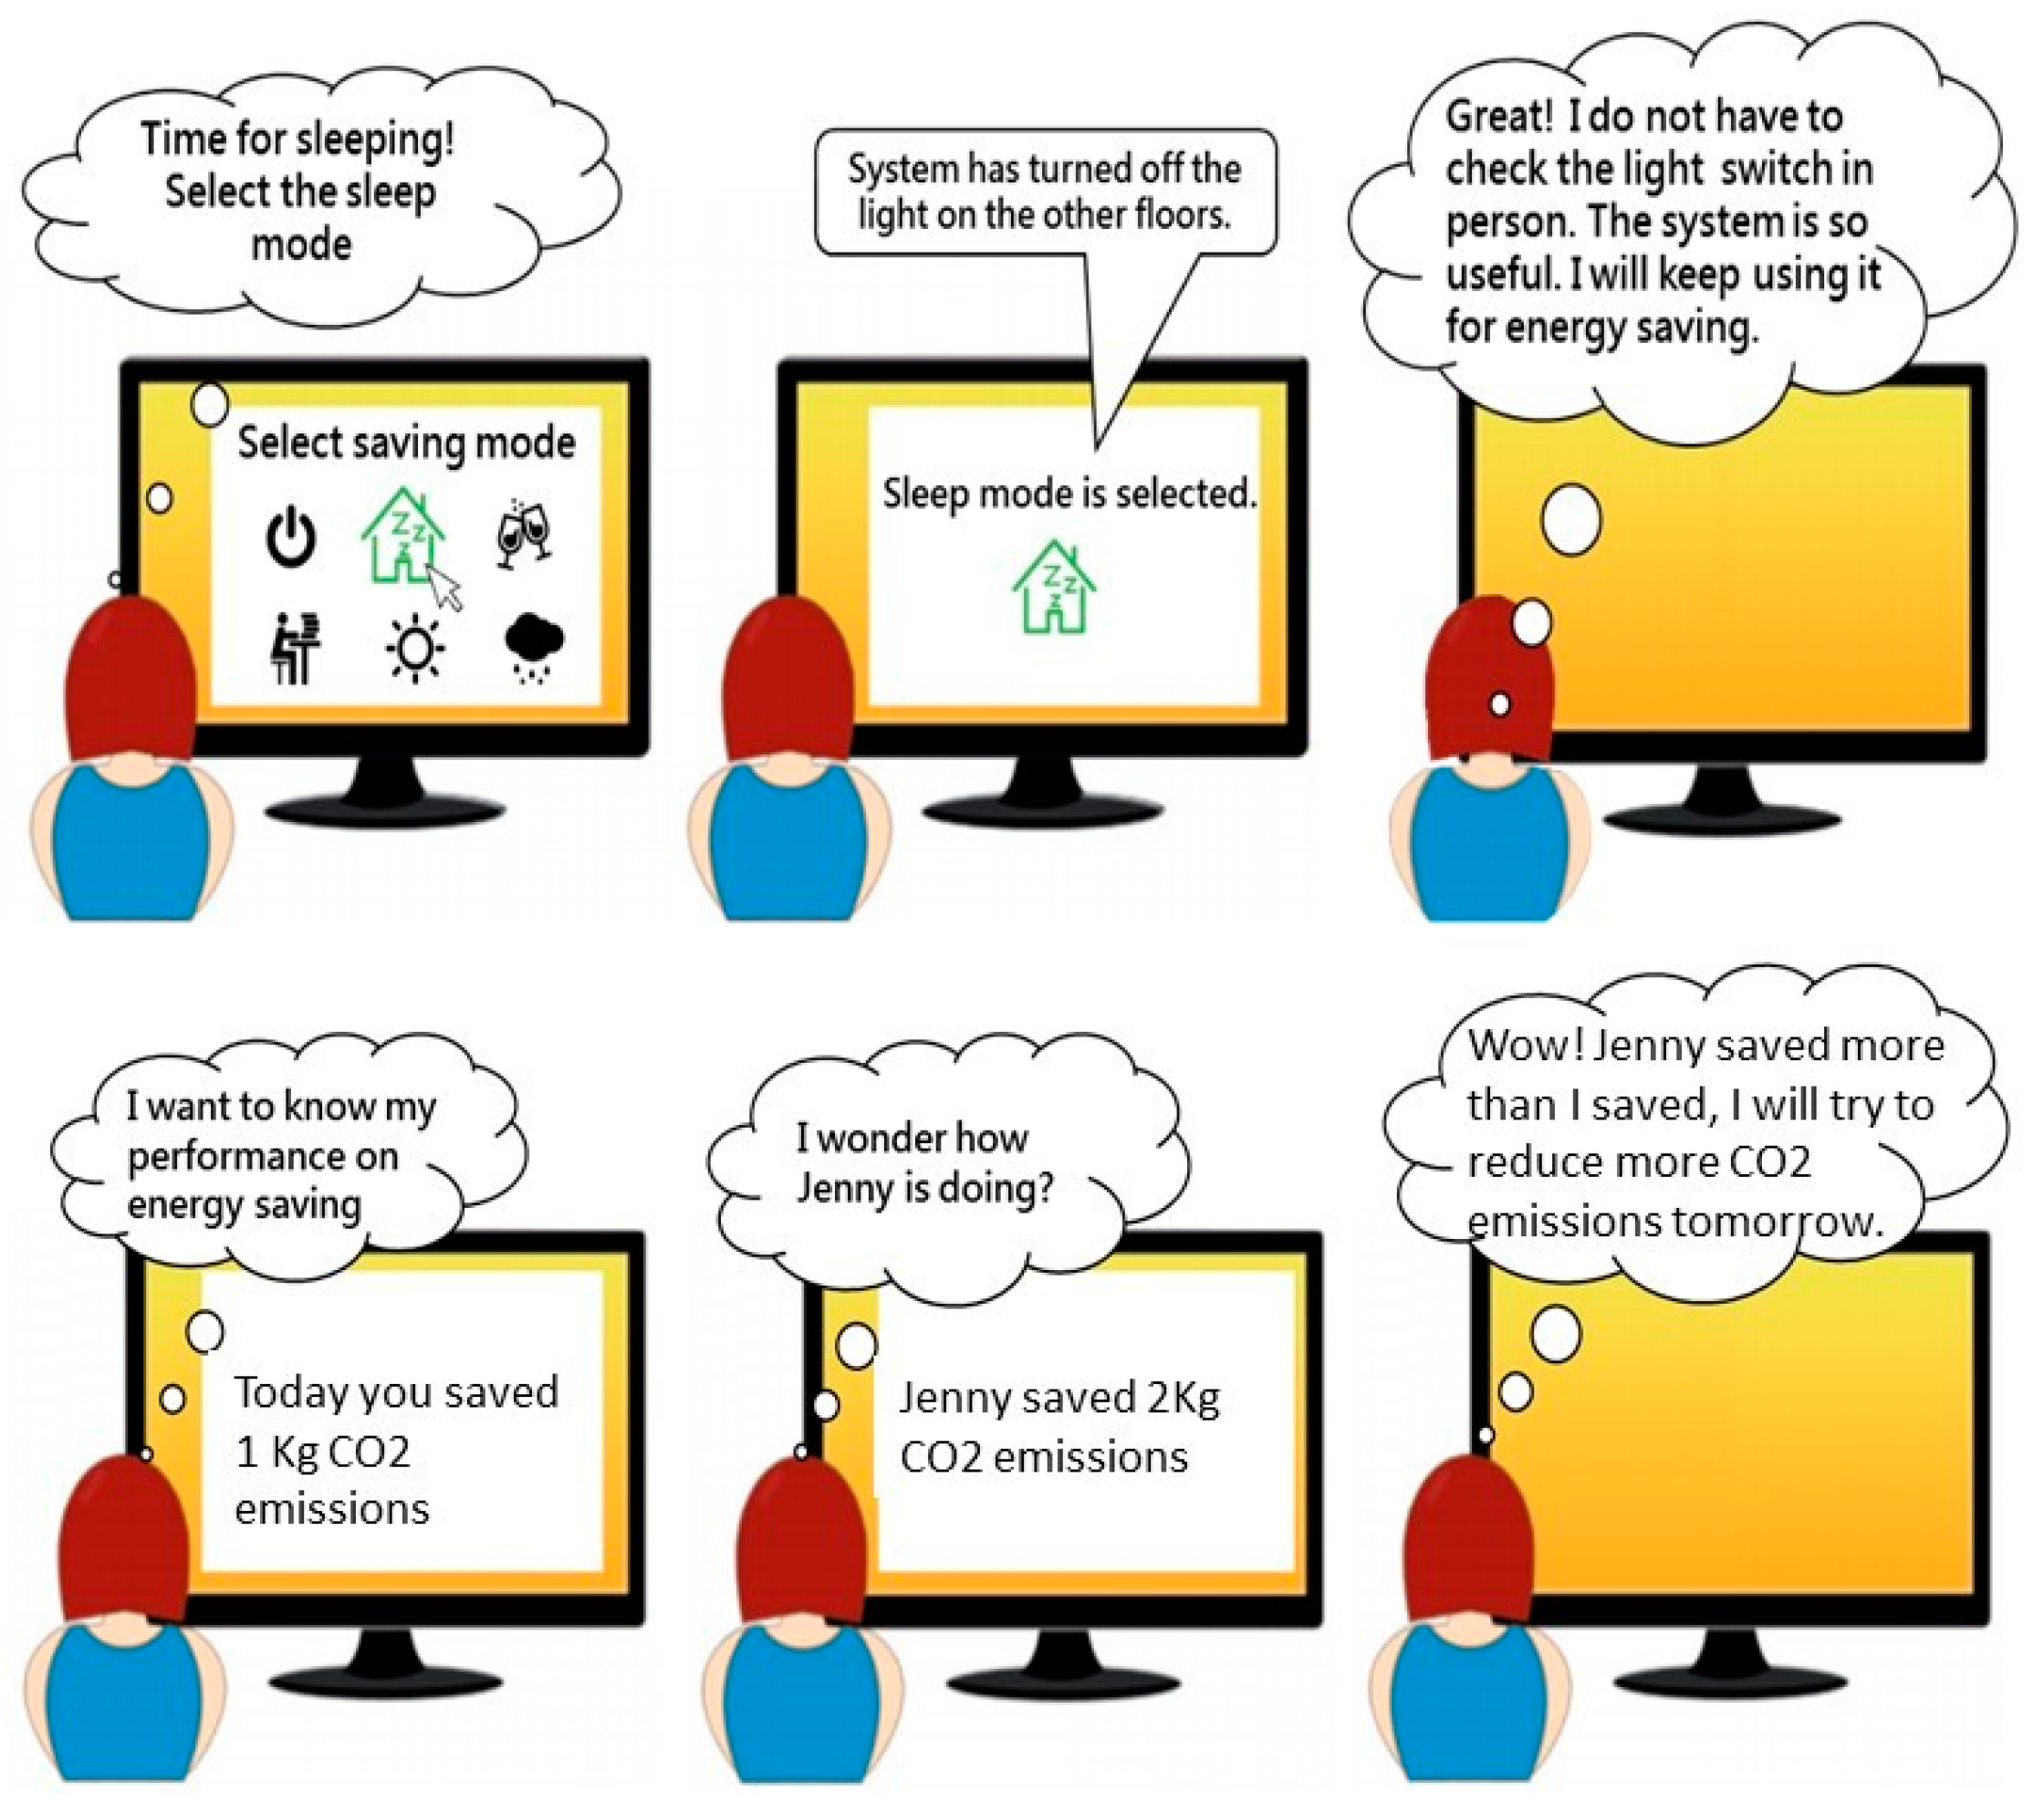
32]. Each storyboard contains three blocks which describe a series of hypothetical situations and interaction between users and the information system designed with a persuasive strategy.
Figure 1 shows two examples of storyboards depicting two persuasive strategies: reduction and social comparison. The main purpose of a storyboard presentation is to let respondents fit into the scene illustrated in a storyboard so that respondents from various backgrounds could easily understand what it would be like while interacting with the system. Each storyboard is followed by three questions to measure respondents’ perceived persuasiveness of each persuasive strategy. (2) Five questions to collect respondents’ demographic information like age, gender, vocation, education level, and income. (3) Five questions to measure respondents’ environmental awareness level, which is an additional construct other than conventional demographic variables. Respondents answer each question with the Likert scale of 1 to 5 (1—Strongly disagree, 2—Disagree, 3—Neither agree nor disagree, 4—Agree to 5—Strongly agree). Statistical analyses are later conducted to find if the persuasiveness of persuasive strategies are different with respect to different demographic variables and environmental awareness levels.
To measure the “persuasiveness” of each persuasive strategy, each storyboard is followed by three questions that were raised referring to the work of Drozd et al. [
33] which include (1) if I use the system, I would have the intention to pursue energy-saving behavior. (2) The function of the system can convince me to use the system to perform energy-saving behavior. (3) The function of the system would make me reconsider my habits about using energy. The respondents were asked whether they agree with each of the three statements with the Likert scale of 1 to 7 (1—Disagree very strongly, 2—Disagree strongly, 3—Disagree, 4—Neither disagree nor agree, 5—Agree, 6—Agree strongly, 7—Agree very strongly). The higher the score, the more persuasiveness the respondent feels about the respective strategy.
4. Statistical Analyses for Recommending Persuasive Strategies for Different Users
The questionnaires were sent out and collected in the spring of 2016 via a web survey and a paper survey in Taiwan. Since most of the respondents from the web survey were young people, a paper survey was conducted to have more responses from elder ones. A total of 280 responses were collected from the survey. To make sure the responses are effective, the time for each respondent to go through all questions was tracked and an attention filter question was put in the questionnaire to detect whether respondents actually pay attention to each question. Responses that were completed in less than three minutes or getting the attention filter question wrong were considered invalid. After screening with above two criteria, a total of 221 valid responses were retained as a result.
Table 2 shows the respondents’ demographic information.
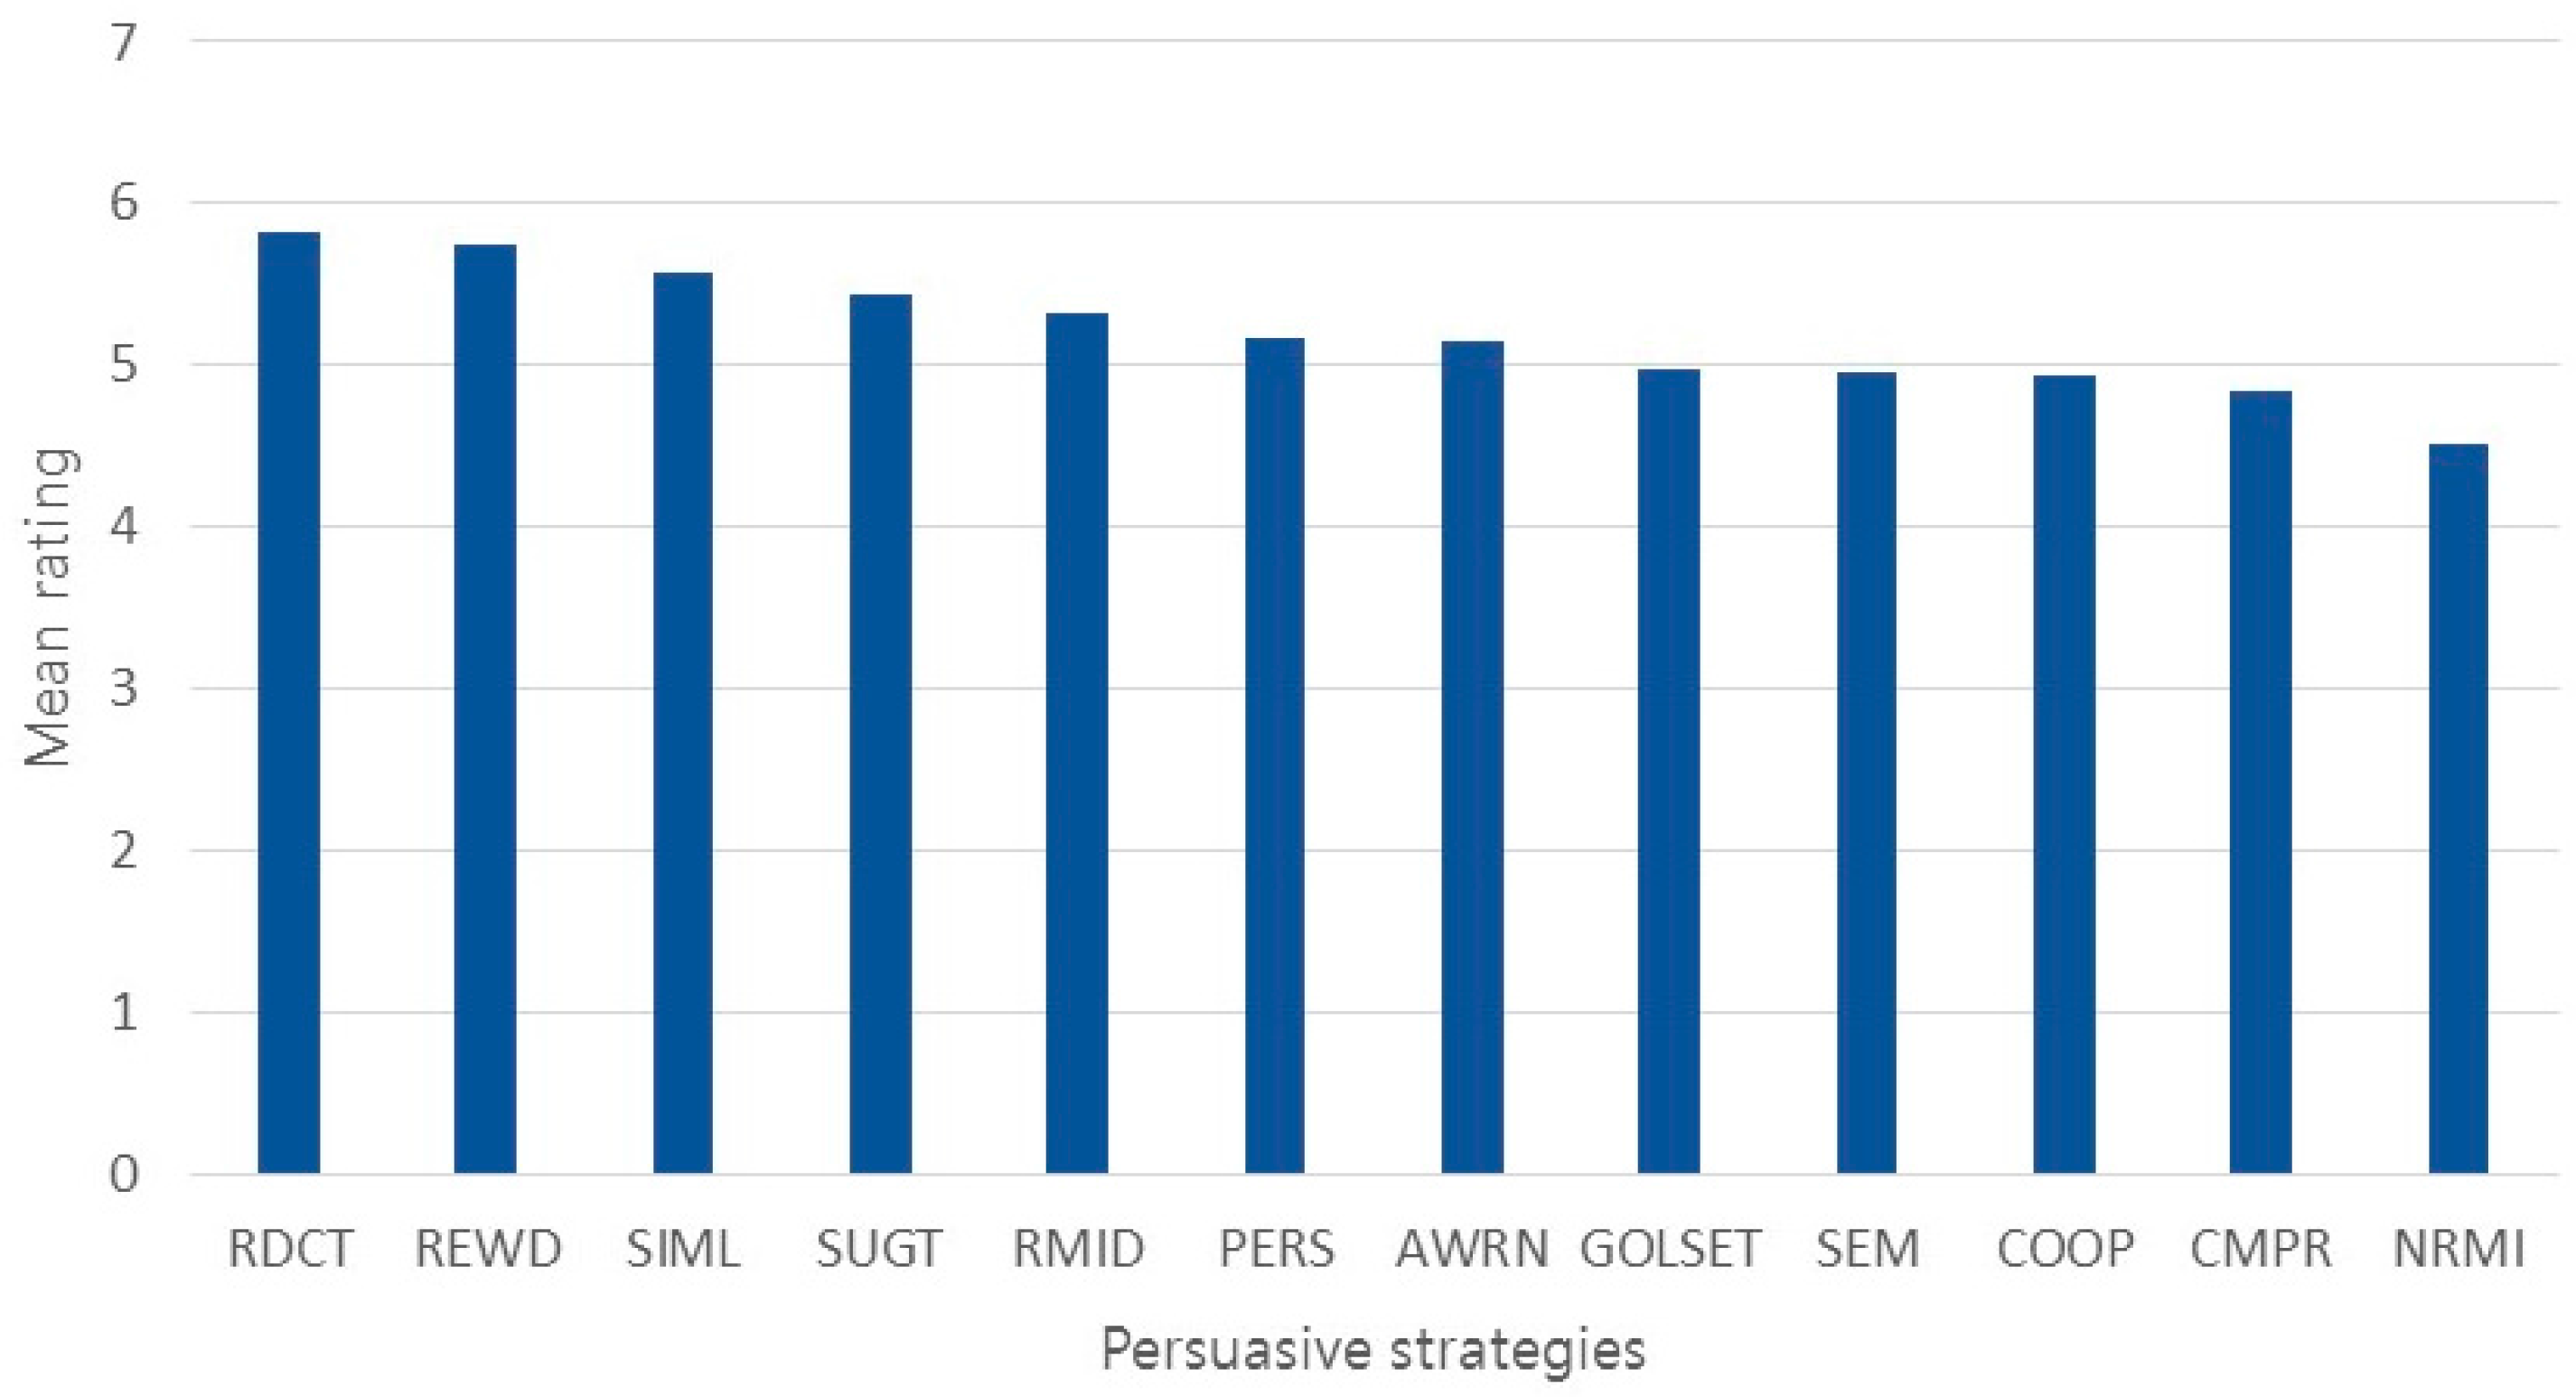
For all respondents, after the consistency check with Cronbach’s alpha, the persuasiveness of each persuasive strategy was examined by performing a statistical test to see if the mean of persuasiveness measure was significantly greater than 5, which was considered significantly persuasive. The results of mean ratings are shown in
Figure 2. The statistical tests indicate that the persuasiveness ratings of five persuasive strategies including reduction, reward, simulation, suggestion, and reminder are significantly more than five. The abbreviation of each strategy in
Figure 2 can be referred to that in
Table 1. On the other hand, while testing whether the mean is significantly less than 5, only one strategy, normative influence, is significantly less persuasive. The persuasiveness of the rest of persuasive strategies are at a moderate level. By comparing the means of persuasiveness measures, the results show that the persuasive strategies related to social support such as cooperation, social comparison, and normative influence are less persuasive compared to the other three groups of strategies.
In the following sub-sections, statistical analyses using ANOVA (Analysis of Variance) were conducted to test the effects of the two factors, a persuasive strategy and a demographical variable (including environmental awareness), on persuasiveness. Since each respondent was repeatedly measured for the persuasiveness of the twelve selected different persuasive strategies, the repeated measures ANOVA (RM-ANOVA) was performed in SPSS. Due to the dependence of collected data, when RM-ANOVA is carried out, the sphericity assumption needs to be checked. In the following, the Mauchly’s test of sphericity is used to test for within-group designs and Box’s test is used for between-group designs, and when both of the statistics with the level are above p > 0.05 the analytical assumptions of the RM-ANOVA are met. When the interaction effect of the two factors is significant, the different levels of a demographic variable would lead to different persuasiveness of persuasive strategies.
Statistical analyses using RM-ANOVA were conducted to test the effects of the twelve selected persuasive strategies and several demographic variables (including environmental awareness). The results show that the interaction effects between different strategies and two variables (age and environmental awareness) are significant, while the interactions between strategies and the other demographic variables such as gender, vocation, and education level are not significant. The following two subsections discuss the findings about users with different ages and environmental awareness levels.
4.1. Persuasive Strategies for Users of Different Ages
RM-ANOVA was conducted to see if the persuasiveness of the persuasive strategies would be different because of age difference. According to a survey on the digital divide by National Development Council in Taiwan [
34], people above age 40 are generally less familiar with digital and mobile communication products which are the interest of this study. In light of the survey report, respondents were divided into two groups including people under age 40 and people above age 41 because they were suspected to have different behavior when interacting with digital and mobile communication products. Before analyzing age differences, Mauchly’s test was performed and the sphericity assumption was satisfied. According to RM-ANOVA results, the interaction factor between age and strategies is statistically significant, implying that the persuasiveness of persuasive strategies is different in different age groups. As to the results of two main factors, the age difference is not significantly related to persuasiveness, while different strategies do make significant differences on persuasiveness.
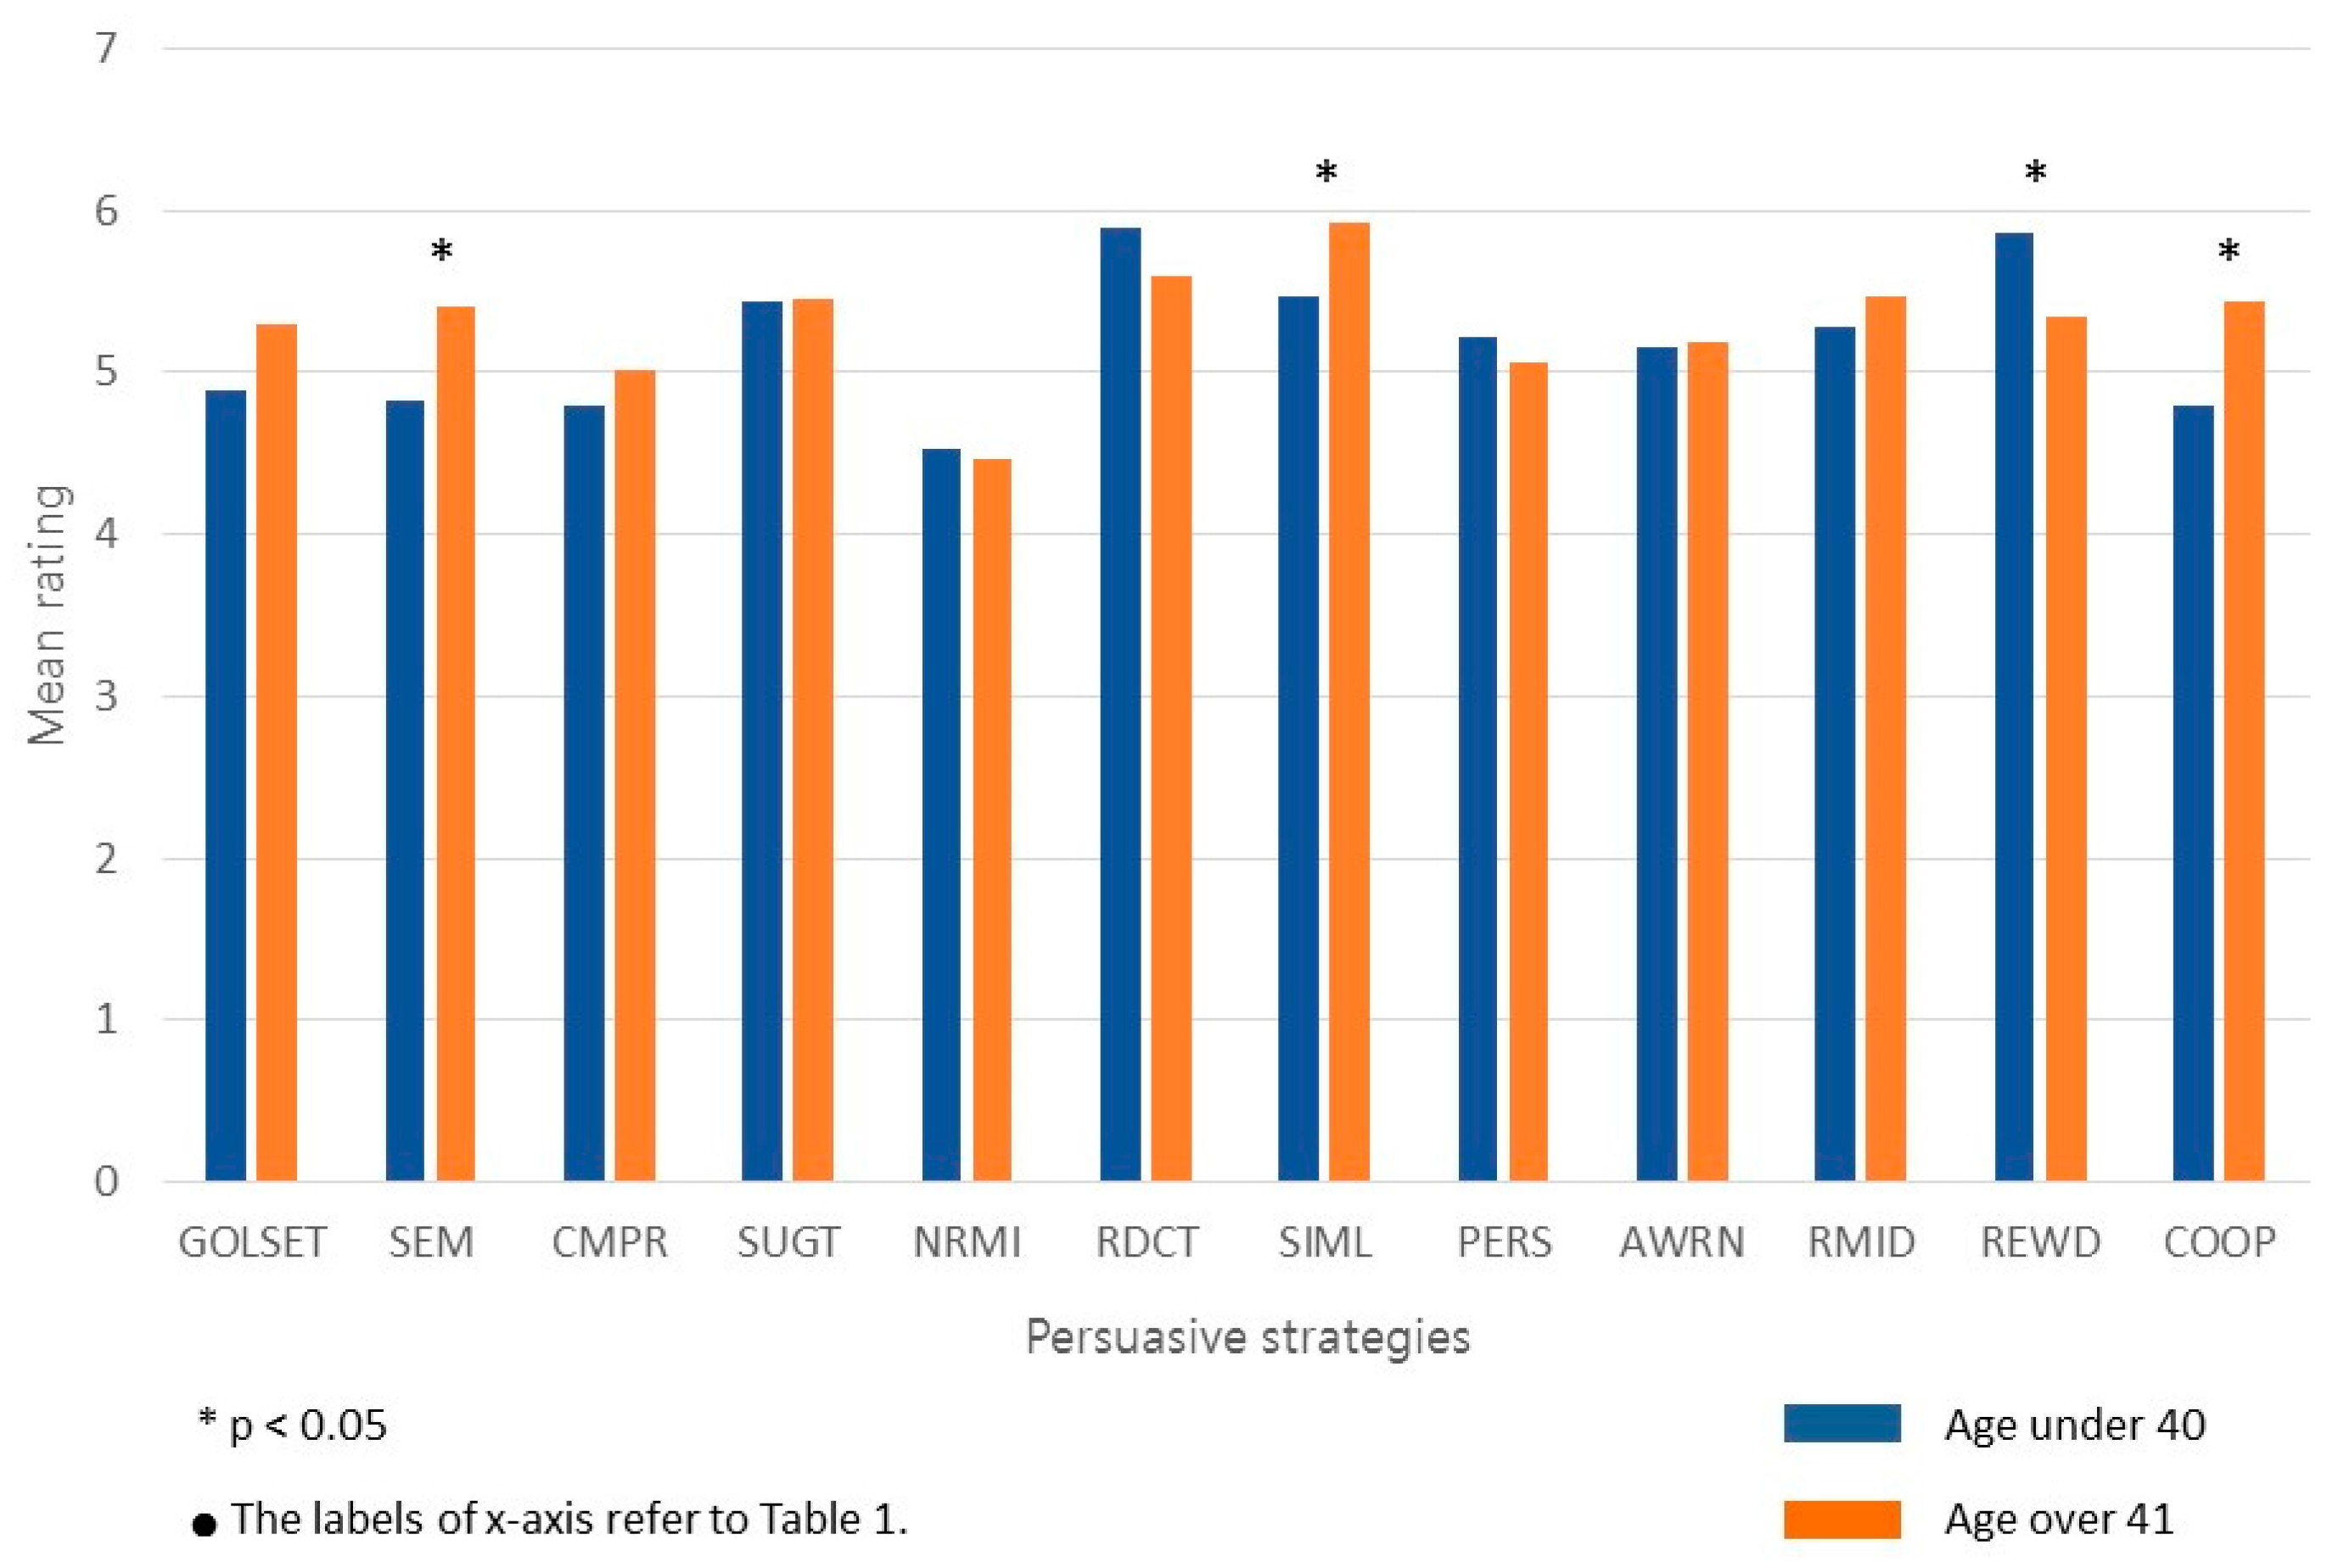
To further test whether age difference would have significant effects on the persuasiveness of each strategy, individual ANOVA tests were conducted. The results show that the perceived persuasiveness of self-monitoring, simulation, reward, and cooperation exhibits significant differences for different age groups. After comparing the means of two age groups for each strategy, people under age 40 significantly prefer the reward strategy than people over age 41. People over age 41 found three out of twelve strategies significantly more persuasive than people under age 40, which are self-monitoring, simulation, and cooperation. The results are shown in
Figure 3, where the mark “*” means there is significant difference.
In addition, two ANOVA tests for the main effect of a persuasive strategy were taken for two age groups, respectively. For people under age 40, the main effect of twelve persuasive strategies on perceived persuasiveness is significant. The results in
Table 3 show that the top six persuasive strategies including reduction, reward, simulation, suggestion, reminder, and personalization are significantly more persuasive than the last four strategies from the bottom up, namely self-monitoring, social-comparison, cooperation, and normative influence. For people above age 41, the results show that the top seven persuasive strategies including simulation, reduction, reminder, suggestion, cooperation, self-monitoring, and reward are significantly more persuasive than the last strategy, namely normative influence. These results in
Table 3 suggest that designers should pick different persuasive strategies when facing target users with different ages.
4.2. Persuasive Strategies for Groups with Different Environmental Awareness Levels
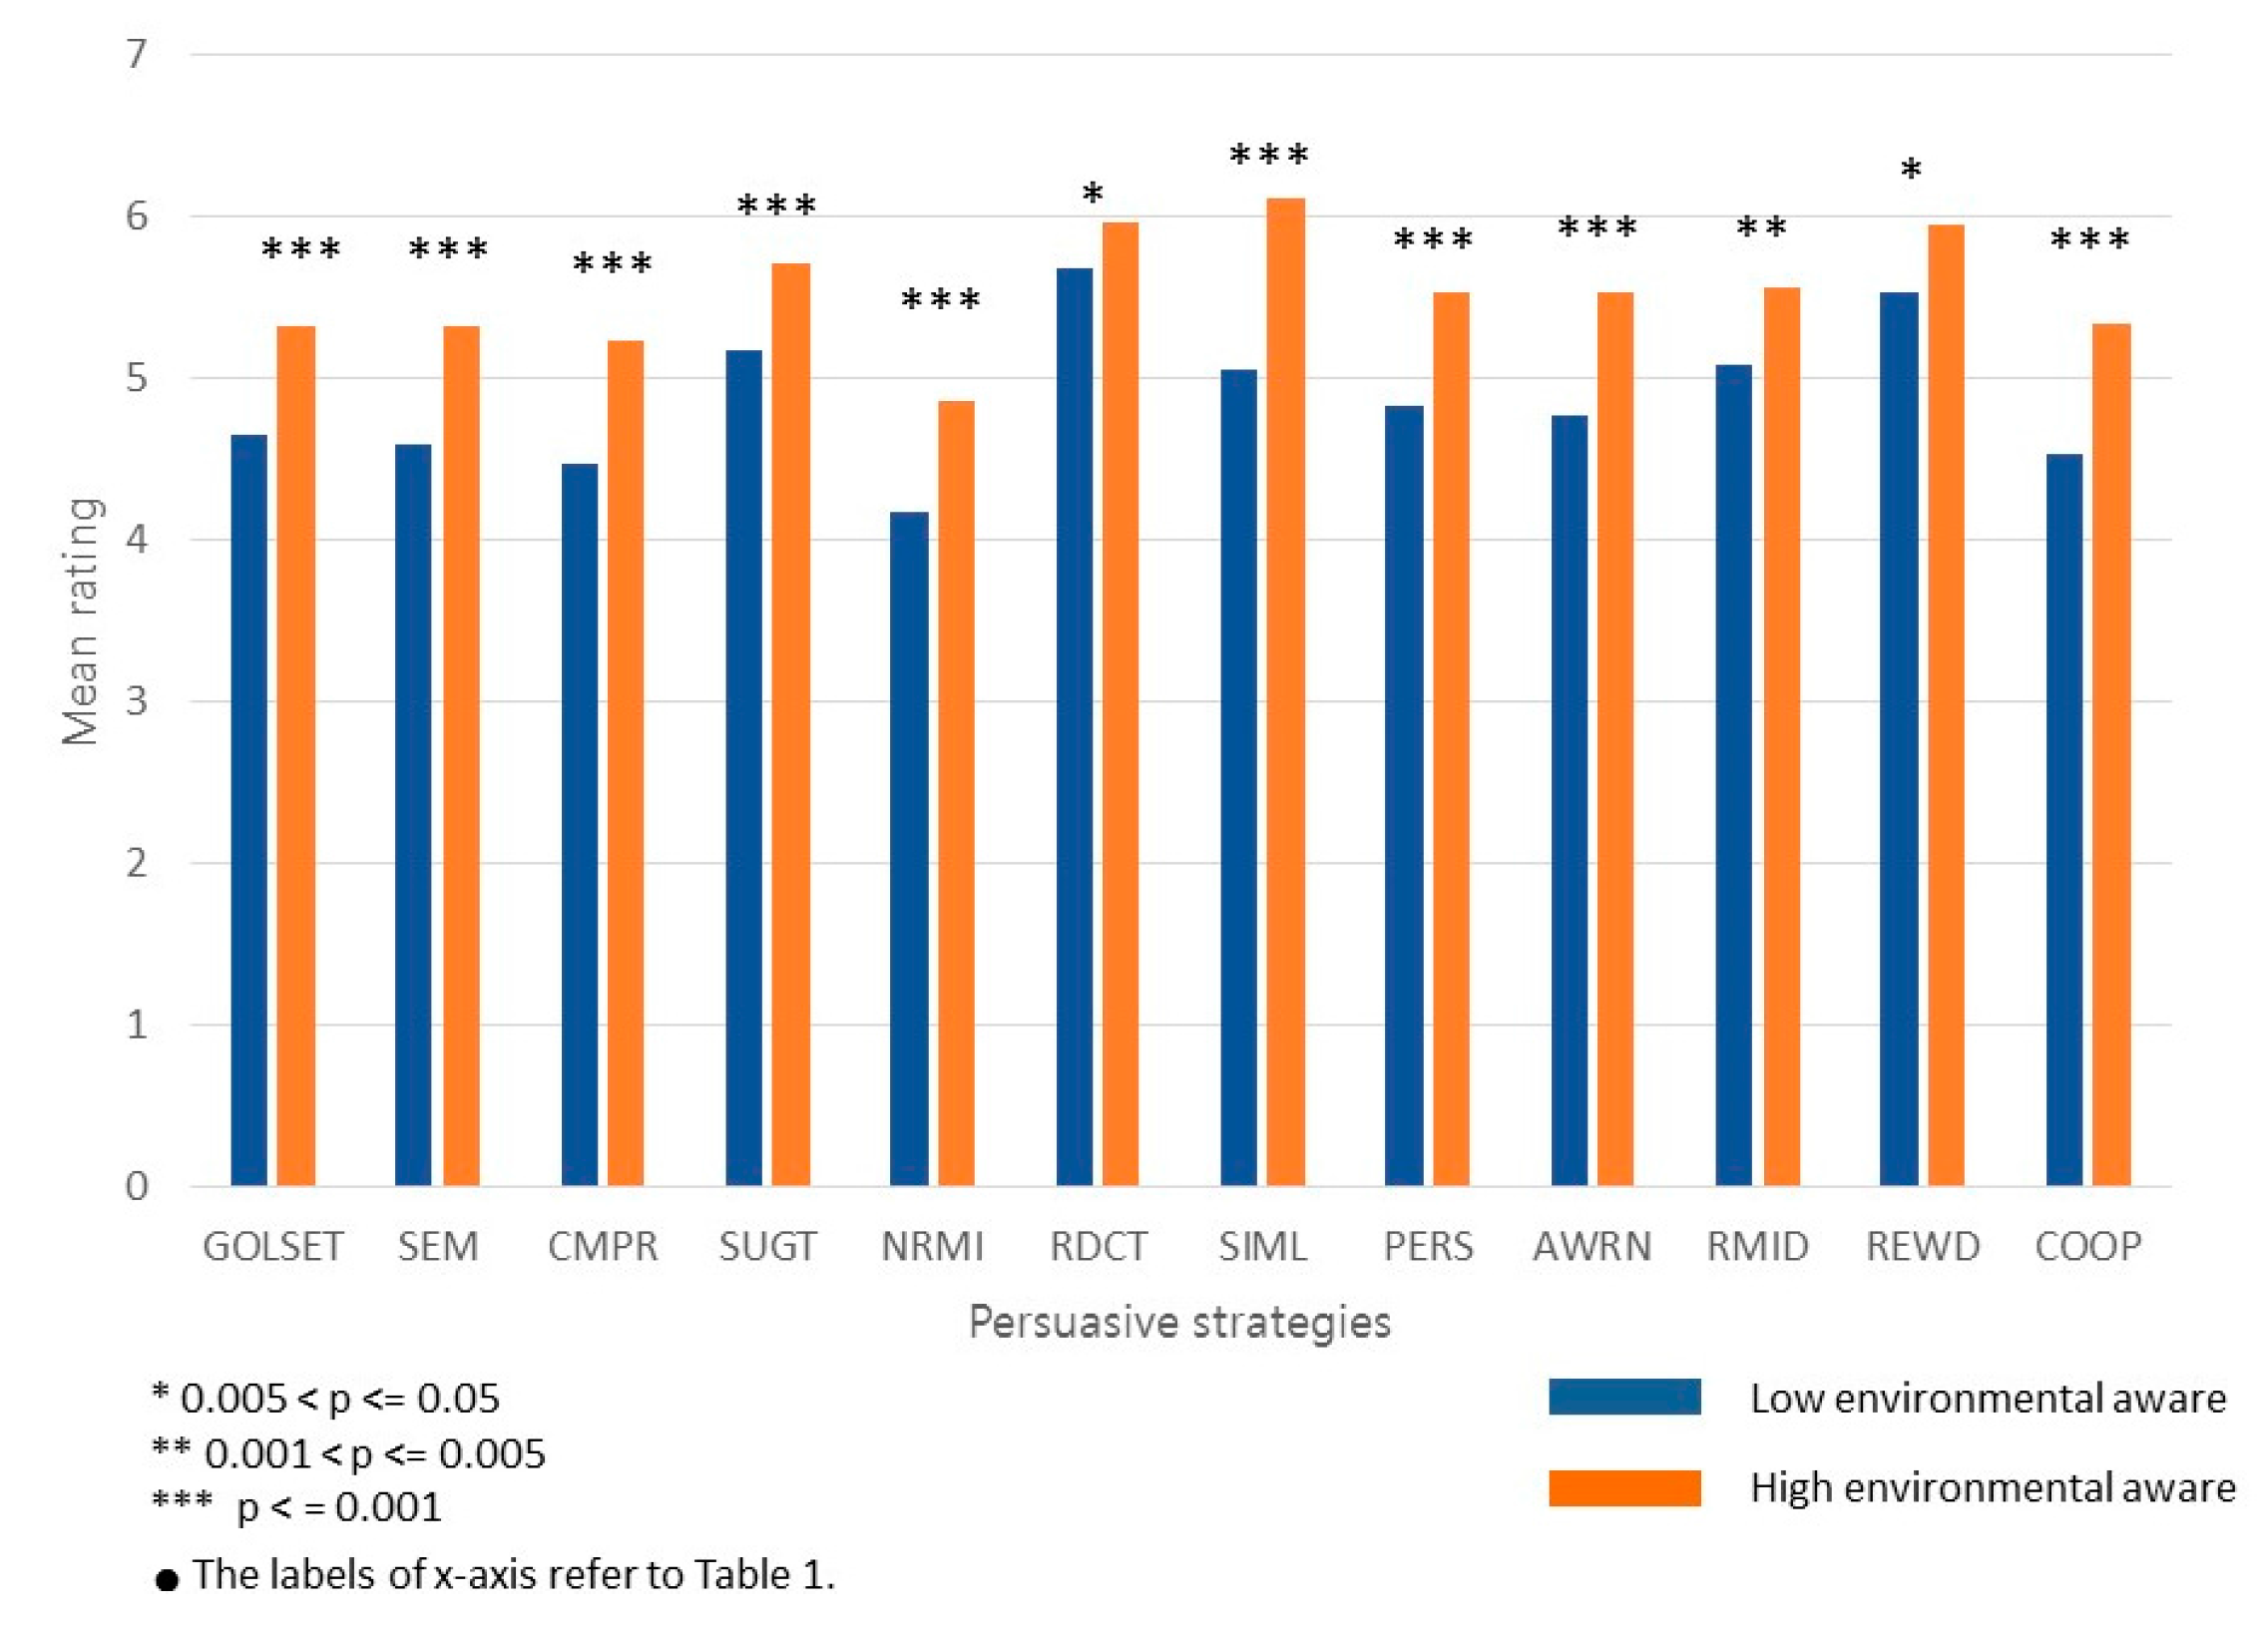
As mentioned before, the environmental awareness of respondents is measured with 5-point scales ranging from “Strongly Disagree” on one end to “Strongly Agree” on the other with “Neither Agree nor Disagree” in the middle. With respect to the environmental awareness difference, people with a mean environmental awareness measure above 3 are categorized into the high level of environmental awareness group and people with a mean of environmental awareness below 3 are in the low level of environmental awareness group. The results of RM-ANOVA show that interaction effect between persuasive strategy and environmental awareness is significant, meaning designers should pick different strategies for people with different levels of environmental awareness. After testing the two means of persuasiveness of each strategy of two groups,
Figure 4 shows that people with a high level of environmental awareness experience higher persuasiveness for all persuasive strategies than people with a low level of environmental awareness, but with different significant levels.
In addition, two ANOVA tests for the main effects of persuasive strategies were conducted for two groups of respondents, respectively. For people with a low level of environmental awareness, the perceived persuasiveness of the twelve persuasive strategies are significantly different, and the top two persuasive strategies, namely reduction and reward, are significantly more persuasive than the other persuasive strategies. For people with a high level of environmental awareness, the results show that the top four persuasive strategies including simulation, reduction, reward, and suggestion are significantly more persuasive than the last four persuasive strategies, namely self-monitoring, goal-setting, social-comparison, and normative influence.
5. Mapping Game Design Elements to Persuasive Strategies
After selecting persuasive strategies, the next question is how to select appropriate game design elements that can help achieve a great deal of persuasion coupled with the picked persuasive strategies. An affinity diagram method was used to map game design elements to persuasive strategies. Before conducting the affinity diagram, various gamification elements were collected from the literature and well-known gamification websites using the MDA framework (Hunicke et al. [
17]). It is essential to screen the collected game elements to a limited number of game design elements that are workable in the affinity diagram method, as well as useful in persuading users of energy-saving behavior. The following three-step procedure describes how game design elements were selected in this study:
- (1)
Gamification techniques were collected from the literature, e.g., Xu [
35] listed seven gamification techniques, Werbach and Hunter [
15] mentioned 30 gamification techniques and game dynamics, and Uskov and Sekar [
36] listed 20 gamification techniques. Besides, some gamification techniques were collected from well-known gamification websites, e.g., Schonfeld [
37] listed 47 gamification techniques, Manrique [
38] provided 35 gamification techniques toolkit, and Marczewski [
39] proposed 47 gamification techniques. If all of these were included, a total of 187 gamification techniques are collected.
- (2)
If categorizing them with the MDA framework, 72 gamification techniques were identified as game mechanics, 77 gamification techniques were identified as game dynamics, 29 gamification techniques were game aesthetics, and 9 gamification techniques do not fall into any categories of MDA. After excluding the nine gamification techniques that do not fall into MDA and those of game aesthetics, since they are simply explaining how users would react and feel about gamification, 149 game design elements were left after screening. The screening was conducted by checking whether game design elements were overlapped or have similar descriptions. These 149 game design elements were further reduced to 41 game design elements (18 game mechanics and 23 game dynamics).
- (3)
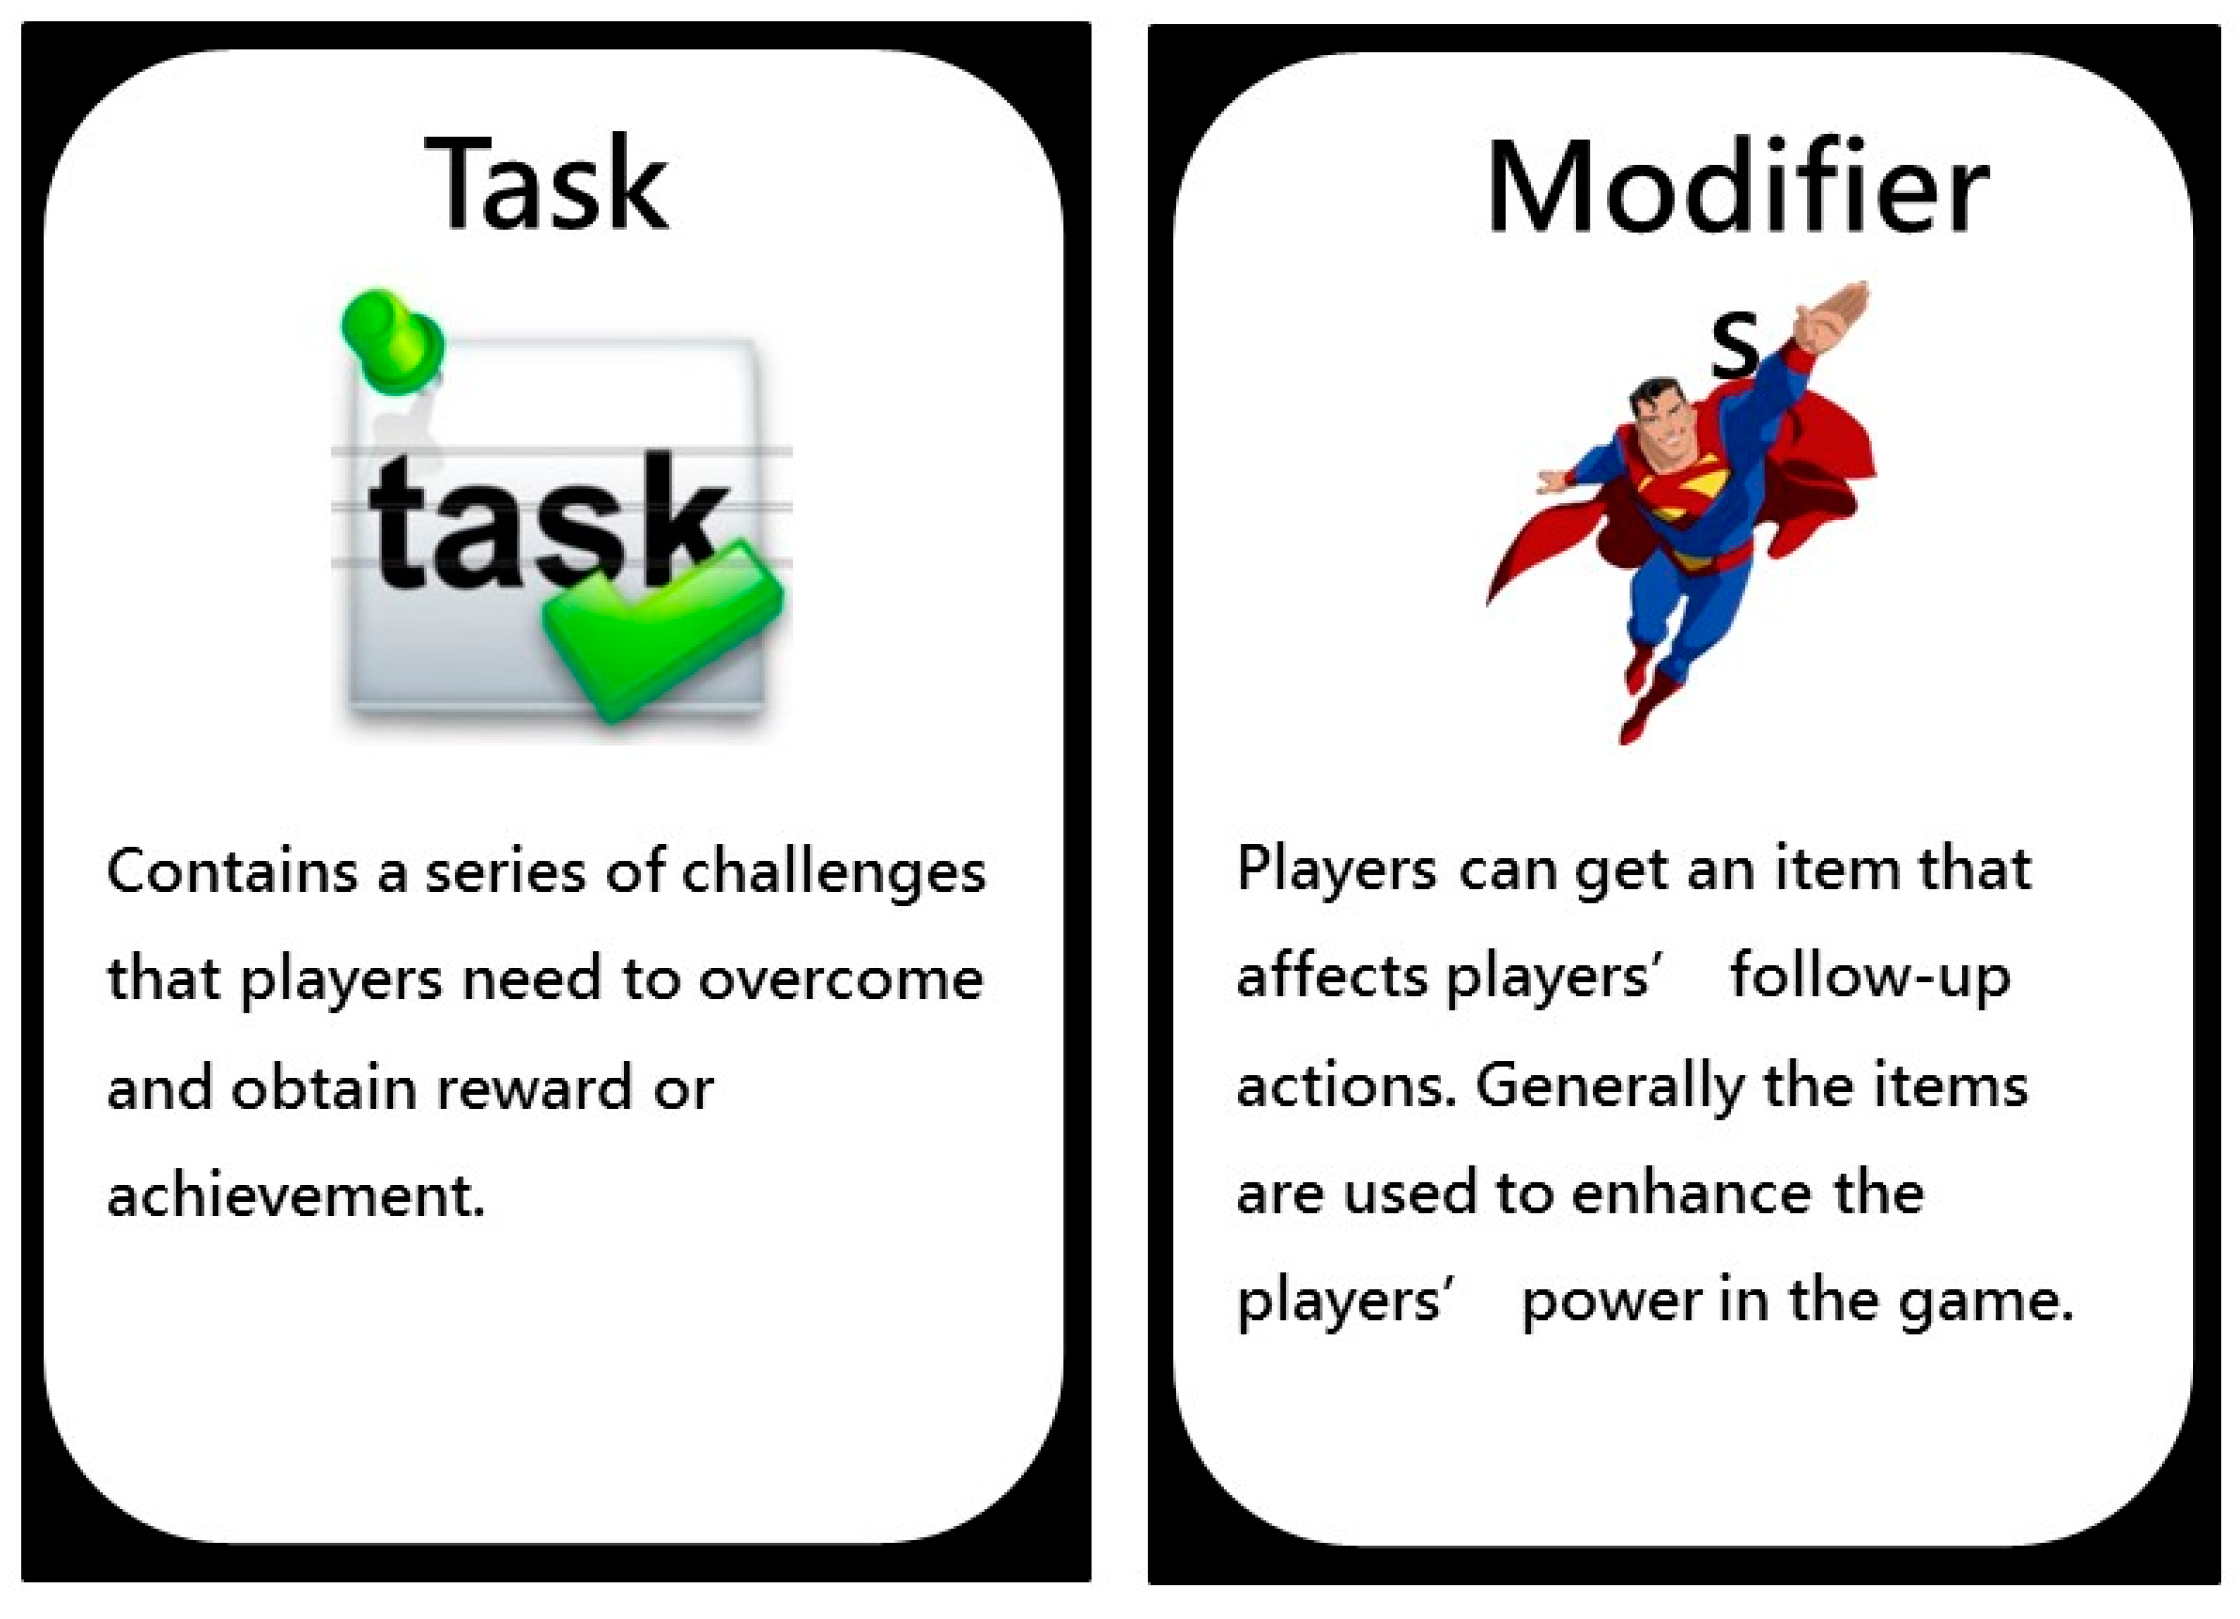
At this stage, the above 41 game design elements were presented to 3 domain experts for further screening, after turning each technique into a card with a short description and a simple sketch (examples are in
Figure 5). When a card that was presented to experts caused confusion, the card was erased or combined with another card (technique). The purpose is to avoid vague or dependent design concepts being presented repeatedly and causing confusion in the mapping of the affinity diagram. As a result, twelve game mechanics and game dynamics were eliminated or merged into others. A total of 29 game design elements were chosen for conducting an affinity diagram. In
Table 4, the total 29 game design elements are presented.
To map 29 game design elements onto 12 persuasive strategies, an affinity diagram method suggested in Jonasson [
40] and Huang [
41] was adopted, wherein 29 game design elements were mapped onto the predefined category (12 persuasive strategies). The following six steps describe the procedures of the affinity diagram adopted in this study:
Step 1: Determine the goal. The goal herein is to help designers use the concept of gamification coupled with a persuasive strategy for a gamified design for energy-saving behavior. Particularly, how each game design element can be associated and applied with each persuasive strategy is what we want to know.
Step 2: Select game design elements and persuasive strategies. Following the goal, the gathered information included 29 game design elements and 12 persuasive strategies that could be employed in the BCSSs for energy-saving behavior.
Step 3: Transform gathered information into cards. The twenty-nine game design elements and twelve persuasive strategies were transformed into cards that could be presented. Essentially, the verbal and graphical description in each card were carefully arranged so that presentation on the cards wouldn’t be too lengthy, vague, or incomplete. Example cards prepared for representing persuasive strategies are like those in
Figure 1.
Figure 5 shows two game element cards as demonstrating examples.
For conducting steps 4 to 6, six domain experts with game design experiences were invited and divided into two groups (group 1 and group 2). Regarding the background of these six experts, one is a manager of a game design company, one is an industrial designer, two have their major in computer science and have software design experience, and two are engineering graduate students with extensive experience in playing computer games. For mapping game design elements onto persuasive strategies, the workshops of the affinity diagram were held four times. Each time, one group of participants was invited to map twenty-nine game design elements to three persuasive strategies. Before each workshop began, the purpose of the workshop and the processes of the affinity diagram were introduced to all participants. Twenty-nine game design elements cards were shuffled and dealt to the participants. Cards that represent agreement and disagreement were also sent to the participants for voting.
Step 4: Match game element cards to each strategy. The process had two steps. (1) At the beginning, one of the 12 persuasive strategies was introduced in detail by the host. (2) Experts were asked to open their game design element cards. Then, according to the descriptions presented in the cards, participants needed to think if there existed some possible associations between the game design element card they held and the persuasive strategy just introduced.
Step 5: Conduct an A-type diagram. If domain experts agree that some possible association does exist between a game element and a strategy, then the card for agreement should be raised, and vice versa. For each game element card at hand, every participant must show that he/she either agree or disagree. In general, for each persuasive strategy, the method helps find a group of associated game design elements based on participants’ opinions.
Step 6: Conduct B-type writing with two sub steps. (1) Participants were asked to share their opinions about why they thought there were possible associations between the game design element and the persuasive strategy. After all participants shared their opinions with a short discussion, all participants voted using agreement and disagreement cards. (2) If the reason of why a game design element could be associated with a persuasive strategy was agreed on by at least one of the participants, the reason was recorded and the levels of the agreement of each reason were evaluated by all participants with the Likert scale of 1 to 5. The agreement level of each mapping reason revealed the strength of the association between the game design element and the persuasive strategy. If the reason why a game design element was associated to a persuasive strategy was disagreed on by everyone, the game element card was put aside and no recording was made anymore.
Step 4 to step 6 were repeatedly conducted until the mapping of twenty-nine game design elements to one persuasive strategy was finished. For each workshop, three persuasive strategies were raised for mapping-related game design elements. The average agreement levels of each mapping between game design elements and persuasive strategies were obtained and
Table 5 shows the top five game elements with the highest agreement levels for each persuasive strategy. The agreement level on each mapping can be a good reference for designers to select the appropriate game design elements employed together with persuasive strategies. In addition to the top five game elements shown in
Table 5, the ones with an average level (from Likert scale 5) above three should be recommended when designers want to select additional game design elements. Detailed results could be found in Jheng [
42].
6. An Illustrative Example for Applying the Research Results
To show how the research results and the proposed approach can be applied in design for energy-saving behavior, an illustrative example is presented. The results of
Section 3 and
Section 4 could help select appropriate persuasive strategies for different user groups (different ages and environmental awareness levels), while the results in
Section 5 from the affinity diagram approach can help select associated game design elements that could work with chosen persuasive strategies. By integrating the two, a more persuasive and attractive product design for encouraging energy-saving behavior could be achieved.
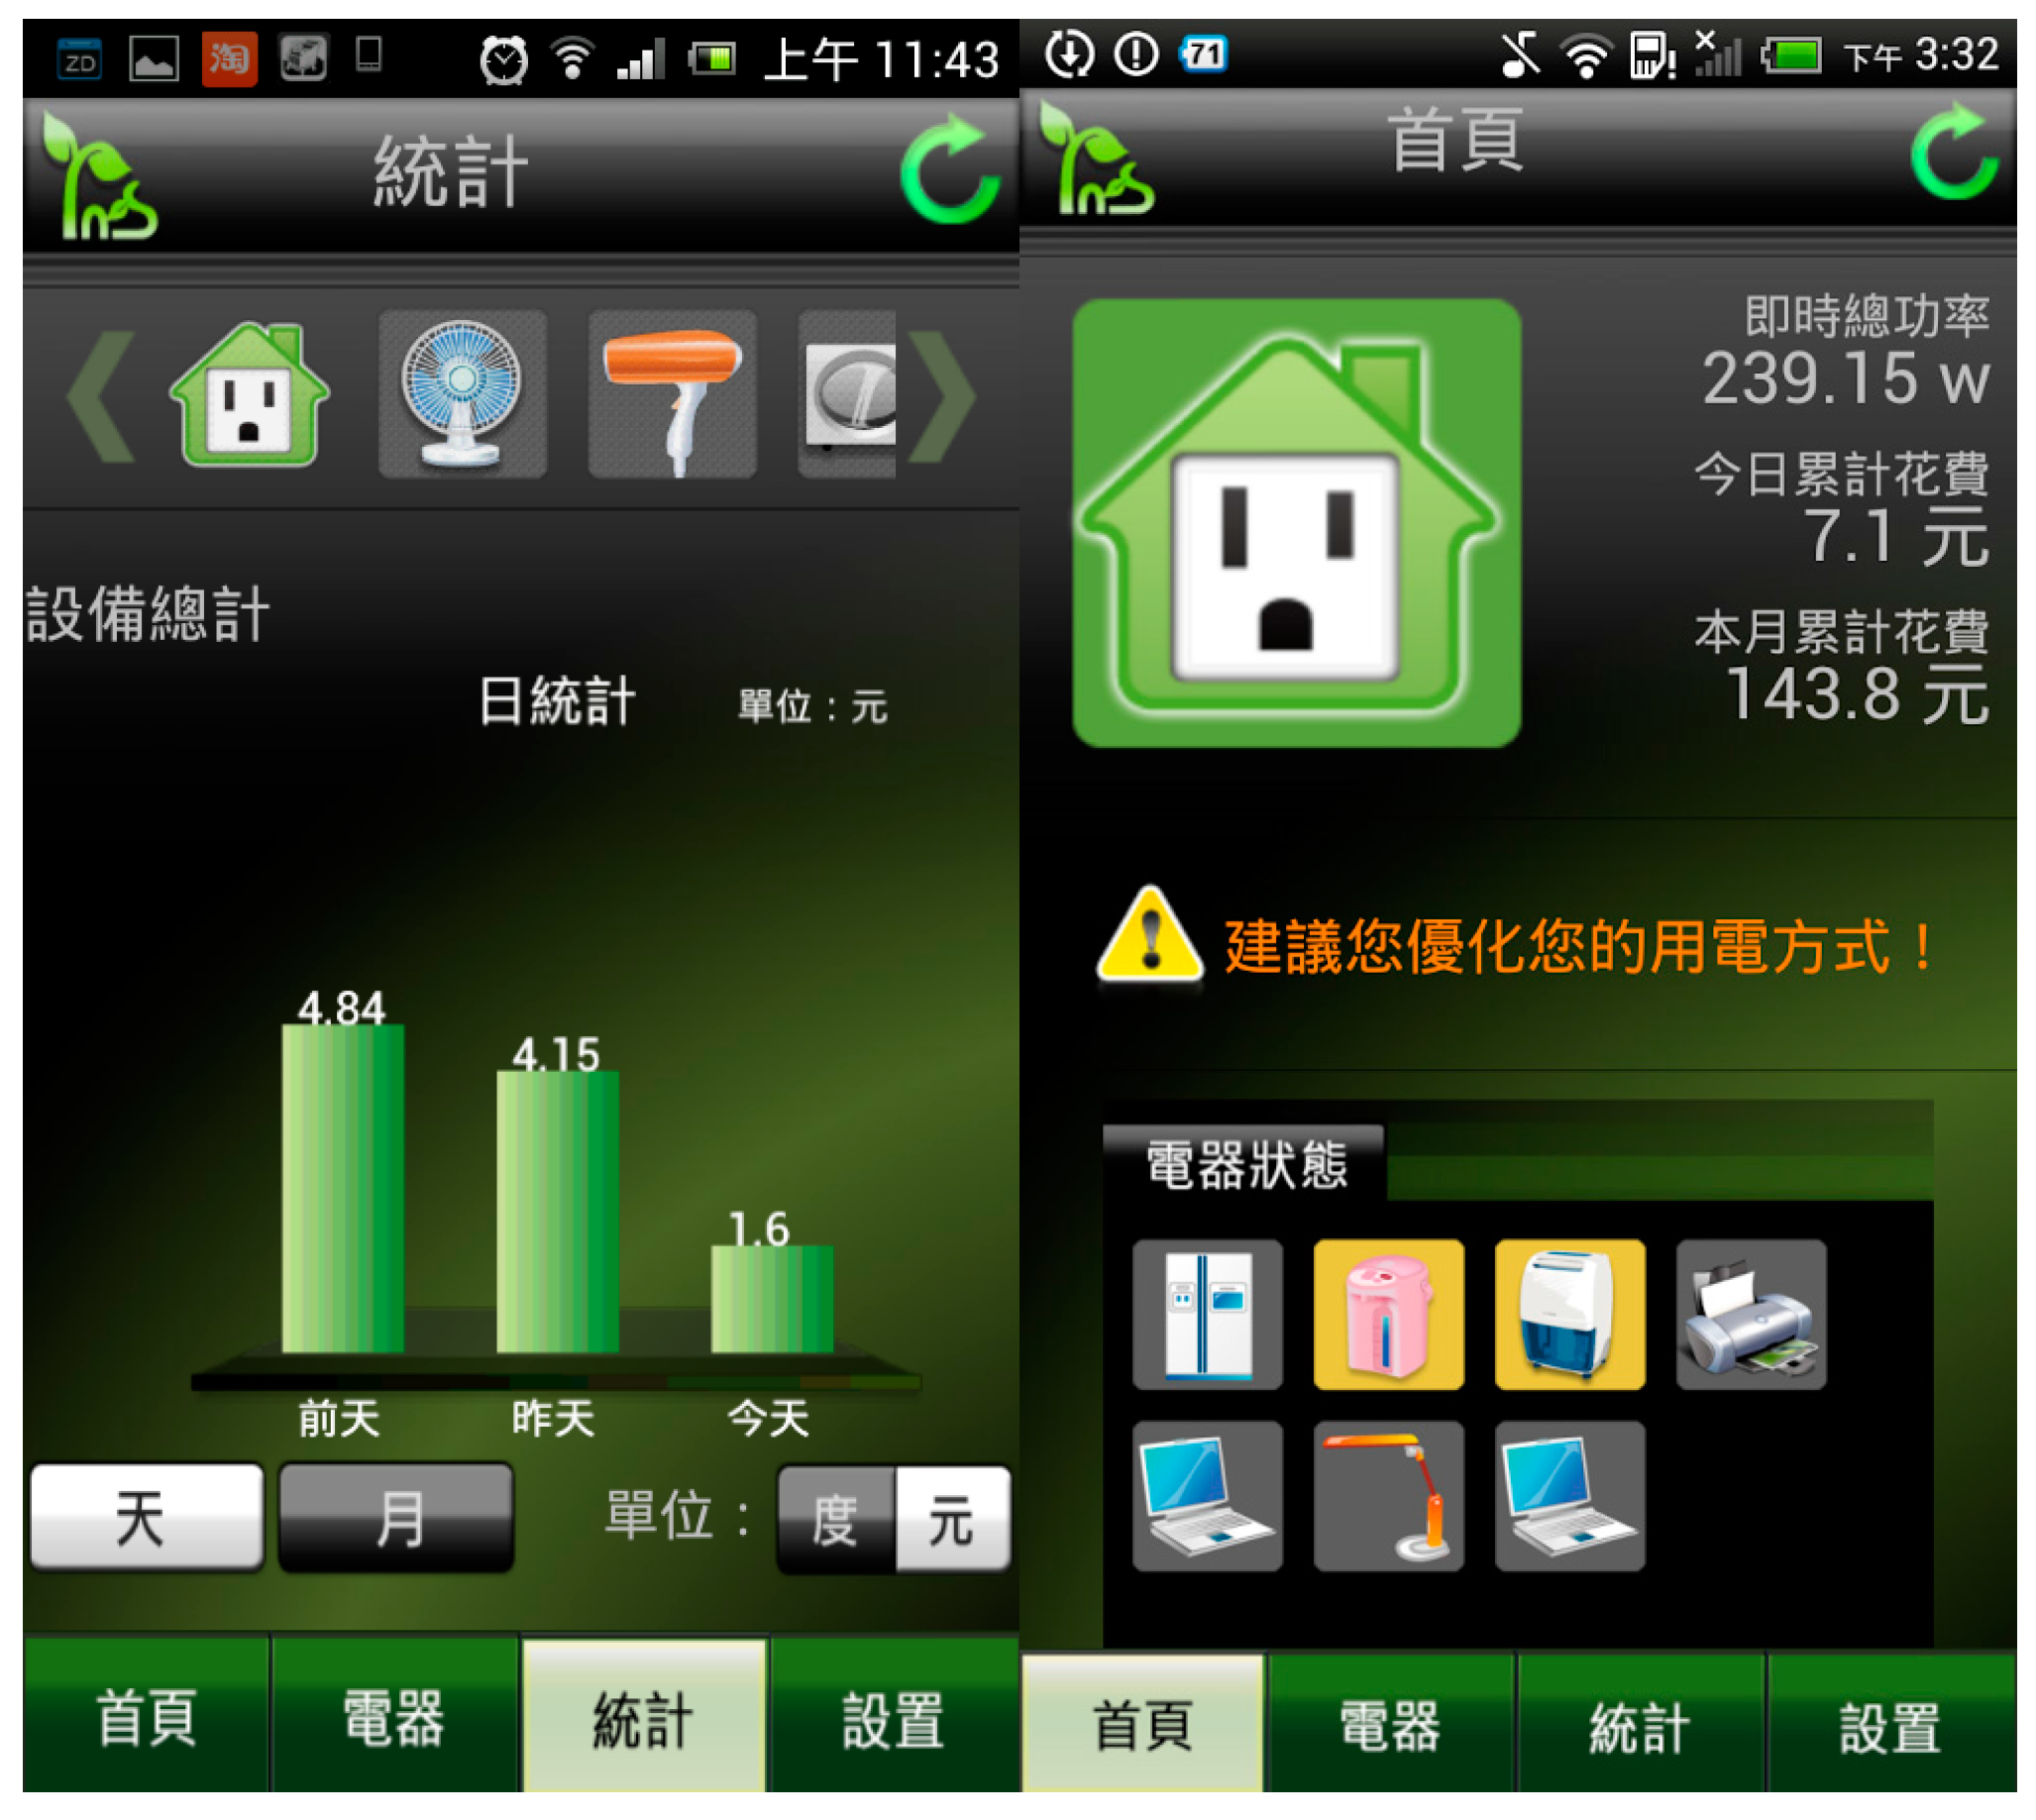
The product selected in this example is a product designed for encouraging energy-saving behavior called In-Snergy Family, developed by the Institute for Information Industry that is a non-governmental organization (NGO) in Taiwan. The major functions of the selected product include (a) collecting real-time energy consumption information with intelligent sockets, (b) delivering information to a gateway through the Internet, (c) analyzing information by a cloud system and (d) generating various reports, analyses, and plots for energy usage. Through Internet and mobile networks, users could obtain their real-time energy usage information anywhere with mobile devices. The product, In-Snergy Family, is developed for general users in various settings, including residential houses, community buildings, or corporate institutions.
Figure 6 shows two application screens on cell phones, where the left screen shows electricity consumption in three days and the right screen shows the total electricity bill of a day and the cumulative bill of a month. After carefully checking the product, several persuasive strategies were already applied. For example, the persuasive strategy “self-monitor” was adopted in the product design, as shown in
Figure 6. However, the persuasive strategies are employed without considering user attributes and the design has not included gamification techniques. The following illustration is intended to help designers choose more effective persuasive strategies by considering user attributes and finding some associated game design elements based on the research results.
Firstly, the authors assumed that designers want to redesign In-Snergy Family for both target user groups, including people below age 40 and people above age 41. Then, a four-step approach is recommended and illustrated, as following. Firstly, useful persuasive strategies for target users could be found by using the results in
Section 4. Secondly, existing strategies in the example product should be identified before actually making design suggestions, since some new strategies may be added while some existing strategies may be removed. Thirdly, associated game design elements to the recommended strategies could be identified using the results in
Section 5. Finally, new designs might be inspired by considering the recommended persuasive strategies and game design elements. In the following paragraphs, the results of the four steps are presented for illustration.
Step 1: Referring to the results of the statistical analysis in
Table 3, for the people below age 40, the strategies including reduction, reward, simulation, suggestion, reminder, personalization, and creating of awareness have higher persuasiveness than the strategies like goal-setting, self-monitoring, social comparison, cooperation, and normative influence (means of persuasiveness < 5). For the people above age 41, only the strategy of normative influence has a lower persuasive effect (mean of persuasiveness < 5) than the other persuasive strategies. These results also indicate the priority of applying persuasive strategies for both groups of users.
Step 2: After checking the design and the functions of the example product, several strategies already existed, as shown in
Table 6 with a tick sign. For illustration, the strategies with high persuasiveness ought to be added like awards and creating awareness, which have not appeared in the product. On the other hand, the existing strategies with less persuasiveness could be eliminated, as illustrated in
Table 6. The suggestions for adding or eliminating strategies shown in
Table 6 and
Table 7 are for target users under age 40 and above age 41, respectively, and are simply for illustrating the application potential of the research results. Detailed and practical considerations are needed in reality.
Step 3: If designers want to include game design elements coupled with the recommended persuasive strategies to make design more attractive and persuasive, a number of game design elements could be added into the system’s design by referring to the results derived from the affinity diagram in
Section 5.
Table 5 provides the top five game elements associated with each persuasive strategy. For example, to make the strategy “reward” more attractive, game design elements like shell game, virtual trade, lottery, reward schedule, and free lunch are recommended.
Step 4: After getting suggestions on persuasive strategies and game design elements for target users, new design concepts could be inspired and incorporated into new products. For the example product, In-Snergy Family, recommended persuasive strategies and game design elements are obtained as shown in the previous steps. For example, the strategy “reward” is suggested to be added in, and five highly associated game elements are recommended. Designers may take into account an individual element or a combination of them for inspiring new design concepts. For illustration, taking the combination of “reward” and “shell game” into consideration, designers may employ the idea of a shell game in the example product so that a surprising, unknown reward may be randomly offered to a user whenever the user chooses an energy-saving function. By taking the game design element “virtual trade”, designers may let users convert energy-saving decisions into “points” as rewards, and those points can be accumulated to redeem some physical or virtual gifts.
7. Conclusions
The goal of this work is to help design systems for encouraging energy-saving behavior by selecting effective persuasive strategies and their associated game design elements by considering the differences in users’ attributes. A data-driven approach is adopted by combining a questionnaire survey, statistical analysis, and the affinity diagram method. Firstly, twelve persuasive strategies are selected based on a literature review and analysis of existing cases for design for energy-saving behavior. Secondly, a questionnaire survey is conducted in Taiwan to investigate the possible demographic differences on persuasiveness of those 12 selected persuasive strategies. With statistical analyses, the persuasiveness of the strategies is found to be significantly different depending on some users’ demographic attributes, such as users’ age and environmental awareness. The results that identify persuasive strategies with high and low levels of persuasiveness could help designers choose effective persuasive strategies for different target users. Thirdly, 29 game design elements are selected to be mapped onto the 12 selected persuasive strategies using an affinity diagram method. A table that contains the top five associated game elements to each persuasive strategy is presented to bridge the gap between game designers and persuasive technology designers.
The results derived from the statistical analyses of a questionnaire survey and an affinity diagram method are presented in several useful tables and turn into good bases for giving design suggestions for making more persuasive and attractive designs for energy-saving behavior. Designers should use different persuasive strategies for target users with different ages and environmental awareness levels. An illustrative example is presented at the end for demonstrating how the research results could be applied. Several game design elements as well as persuasive strategies for different age groups are recommended, while two new design concepts are generated accordingly for illustration.


