1. Introduction
Rice is an important cereal grain that provides a stable source of food for more than half of the world’s population [
1]. Accurate estimation of rice parameters, like above ground biomass (AGB), are very important for rice growth monitoring, the assessment of rice nutrition status, and the prediction of rice yield [
2]. Traditional methods to estimate biomass are both labor-intensive and time-consuming, and are difficult to apply over large areas [
3]. Remote sensing is a non-contact and non-destructive measuring method that can acquire both spectral and structural properties of the target at different spatial and temporal scales. These characteristics make remote sensing an optimal method for large area biomass estimation [
3].
Currently, the spectrum used for the estimation of AGB are sourced from either ground-based spectral data or satellite-based spectral data [
3,
4,
5,
6]. Obtaining ground-based spectral data is labor-intensive and time-consuming, which can cause scalability issues. On the other hand, satellite-based data may not provide sufficient data resolution for applications in precision agriculture. LiDAR (light detection and ranging) is another technique and has been used to estimate biomass. The high spatial resolution of LiDAR can provide a precise crop surface model (CSM), which further allows the biomass to be estimated using plant height [
7,
8]. However, a high computational resource is required for processing LiDAR data, which would not be ideal for applications that cover a large area [
9].
The emergence and development of unmanned aerial vehicles (UAV) and lightweight sensors has filled the existing gap between satellite and terrestrial remote sensing, which offers a promising tool for precision agriculture. For example, Jin [
10] estimated wheat plant density using red-green-blue (RGB) images acquired from an UAV at low altitude (3 m–7 m); Pádua [
11] monitored the growth of grapevines with multi-temporal UAV-based RGB images; Zhou [
12] used two cameras with different spectral ranges mounted on an UAV to acquire multi-temporal images to predict rice yield; Marcial-Pablo [
13] used RGB and multispectral UAV images to estimate vegetation fraction of maize.
Three-dimensional (3D) point clouds generated from a series of overlapped 2D images acquired by an UAV using the Structure from motion (SfM) algorithm offer new options for the acquisition of crop surfaces. SfM is a computer vision technology that generates 3D geometry by repetitive bundle adjustment of the multiple unordered overlapped images and image matching techniques, like the scale-invariant feature transform (SIFT) [
14,
15]. Crop surface models (CSMs) derived from 3D point clouds contain crop canopy vertical distribution information, which can be used for crop monitoring, e.g., plant height measurement [
16], biomass estimation [
17,
18,
19,
20], and yield prediction [
21]. In addition to CSMs, RGB images, and multi- and hyper-spectral images acquired for UAV were combined with CSMs to estimate biomass [
22,
23,
24,
25,
26,
27].
Although CSMs derived from 3D point clouds were used in the research mentioned above, they focused mostly only on the plant heights derived from gridded CSMs. Triangulated irregular network (TIN) [
28] is a kind of digital elevation model (DEM) derived from point clouds. TIN represents the surface with a series of continuous, non-overlapping, irregular triangles using the Delaunay triangulation algorithm. TIN has been used for studying the catchment hydrologic response [
29], surface flow routing [
30], and crown volume extraction [
31]. Compared with gridded DEM, TIN is able to show surface structure details more accurately and more efficiently without the interpolation process [
32,
33].
Temperature is one of the most important driving variables for the simulation of crop growth and development [
34]. Thermal time, mainly based on growing degree days (GDD), was introduced as the meteorological information in this study. GDD is calculated by subtracting a base temperature, below which no significant crop development is expected, from the daily mean temperature. Previous studies used GDD to predict winter wheat yield [
35], estimate the growth stages of rice [
36], map early season large-area winter crops [
37], and estimate biomass accumulation of maize kernels [
38].
The main goal of our study is to evaluate the potential of biomass estimation using multitemporal spectral and structural information obtained with an UAV. More specifically, our study aims to: (1) Evaluate the performance of AGB estimations based on multispectral features and structure features; (2) establish and evaluate models based on a combination of multispectral and structure features; and (3) establish and evaluate biomass estimation models based on a combination of spectral, structural, and meteorological features.
4. Discussion
The results of this study showed that both multispectral features and TIN-based structural features are capable of estimating rice AGB. The combination of these two types of features improves the estimation accuracy and the addition of meteorological information (GDD) further improves the performance.
When a single spectral variable was used for AGB estimation, we found that NDRE, CIrededge, and
ρ700 had better performance among all the remotely sensed features. NDRE and CIrededge are red-edge-based vegetation indices and
ρ700 is included in the red-edge spectrum. Previous study suggested that red-edge-based indices have a relationship with biomass. Mutanga and Kanke [
64,
65] reported that vegetation indices based on red-edge bands have strong relationships with AGB compared with red-based indices. Cheng [
66] suggested that CIrededge has a significant relationship with leaf biomass and weaker relationship with total biomass. In our study, we found that not only red-edge-based vegetation indices, but also red-edge band reflectance have good relationships with biomass; this phenomenon might be caused by the fact that the red-edge spectrum are sensitive to chlorophyll absorption [
60]. Compared with NDRE, NDVI had a weaker relationship with biomass (R
2 = 0.41) (
Table 6). We believe this difference was caused by the saturation in the red spectral band after canopy closure [
64], which, in this case, appeared since the first flight.
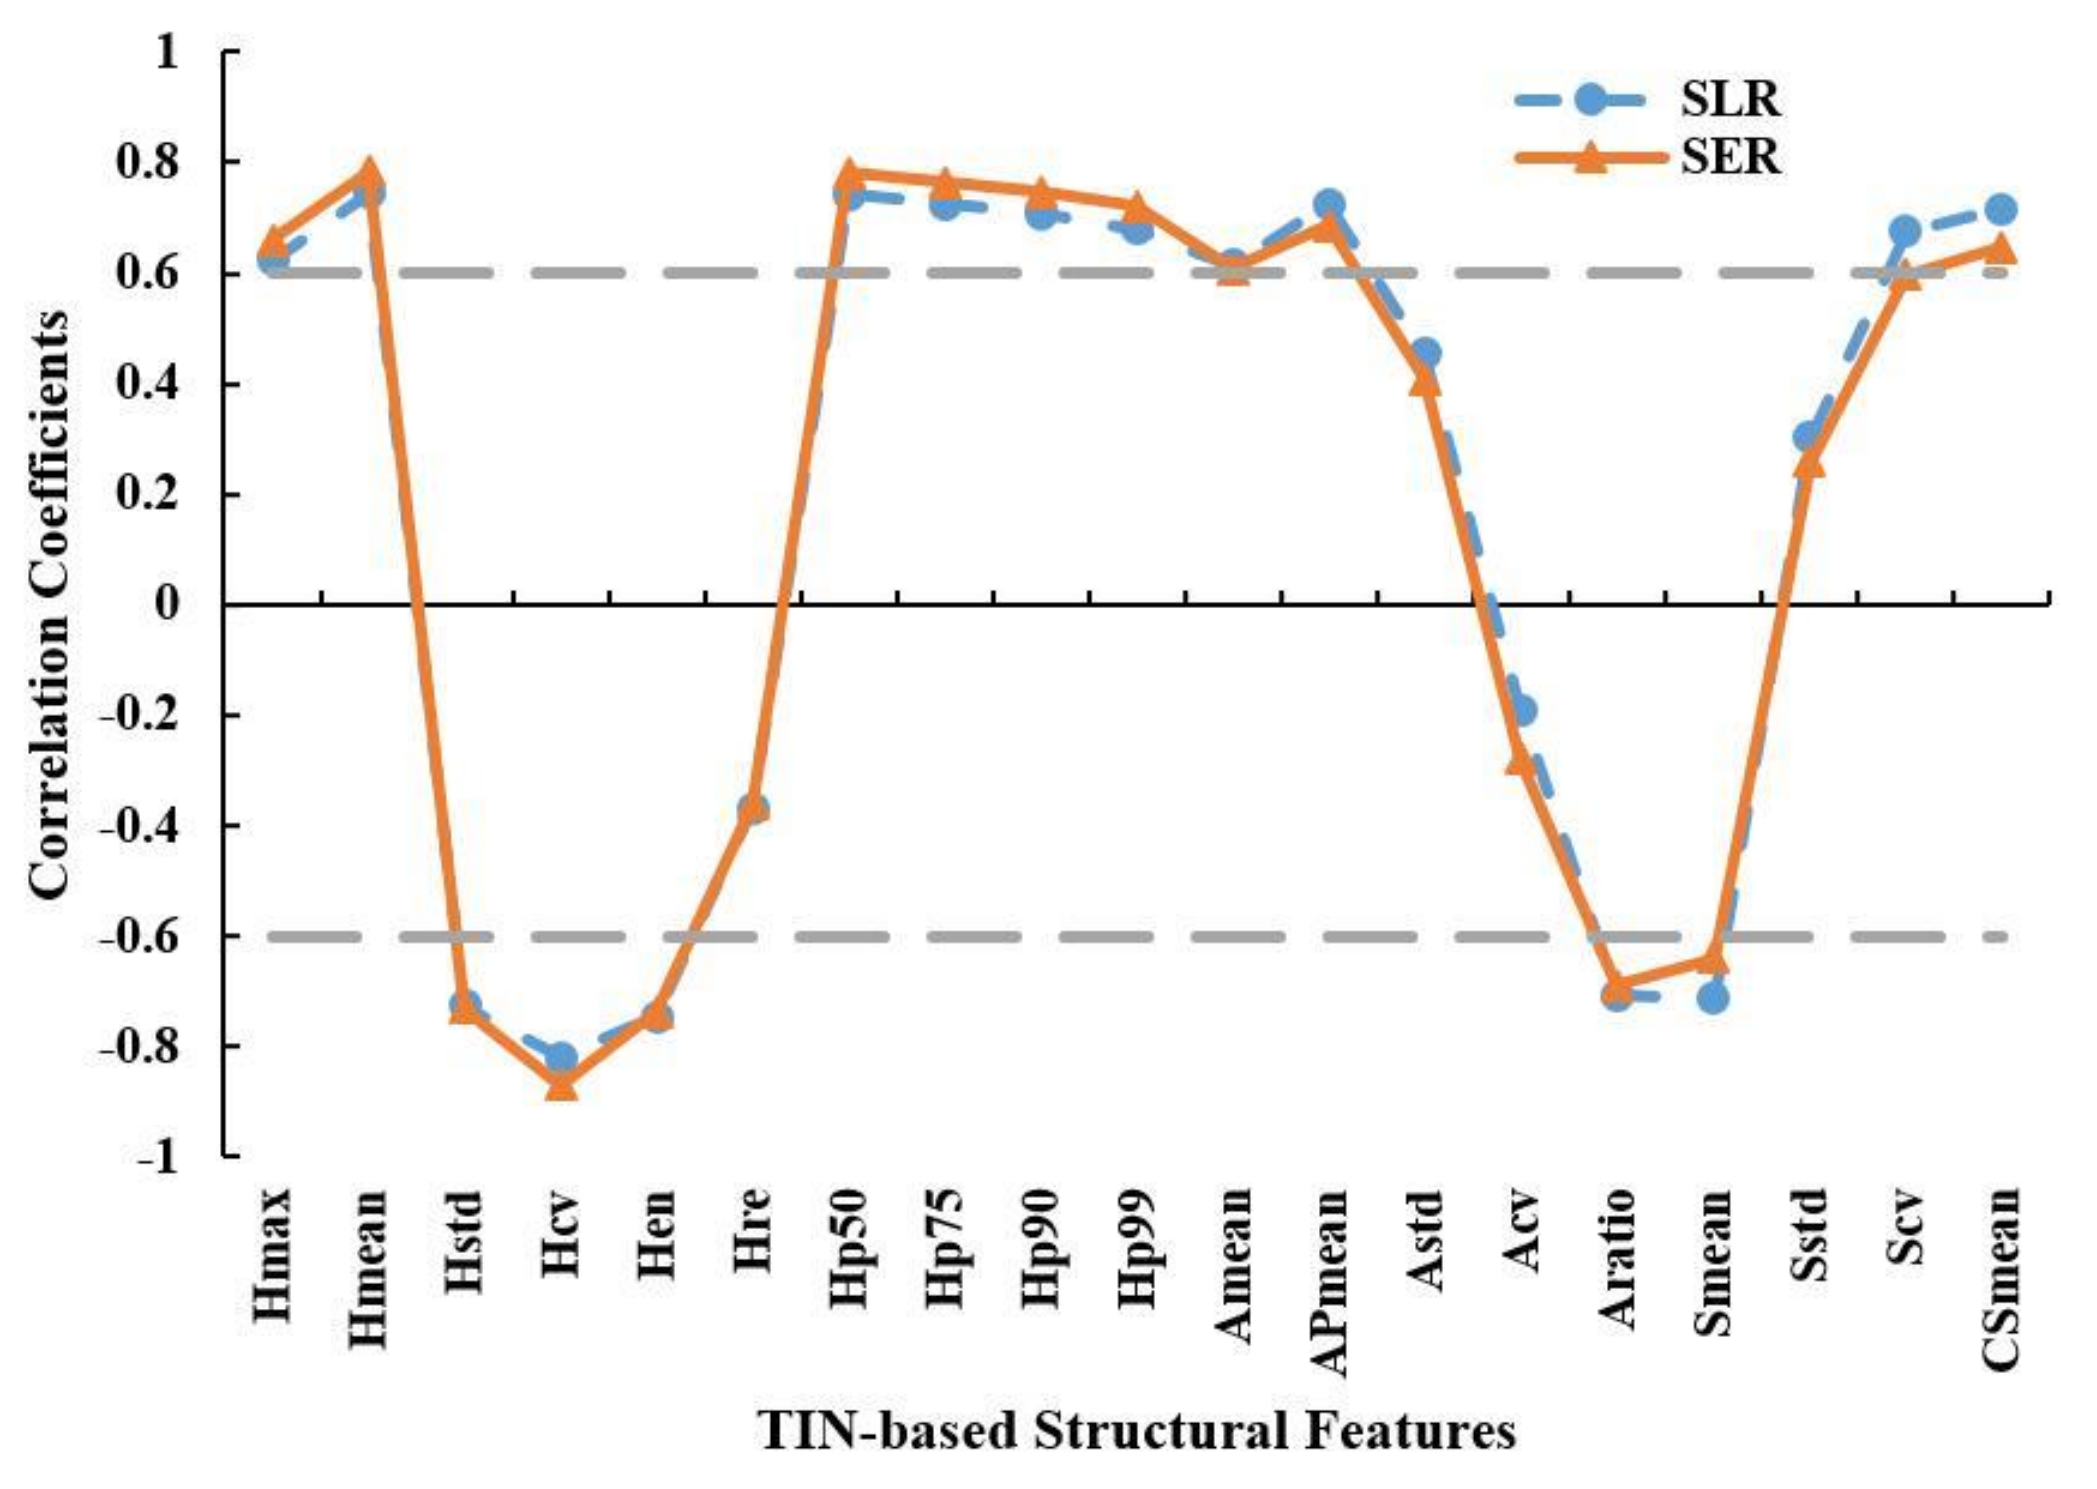
Among the TIN-based structural features, Hcv was the best predictor for AGB estimation. Previous study [
17,
22] suggested that plant height is a good predictor for biomass. However, in our study, we found that plant height was moderately correlated with biomass (R
2 = 0.53). This moderate correlation may be caused by the variation of the stem diameter, canopy thickness, leaf width, and leaf thickness among different hybrid species, which influence the biomass of the stem and leaves and cannot be reflected by crop height. Hcv is the coefficient of variance of the plant height, which reflects the roughness of the crop canopy within a plot. Higher Hcv values indicate a more uneven crop canopy surface [
67]. The results in
Table 7 are in line with the findings in [
23,
68,
69], which suggested that Hcv is an important parameter for estimating biomass.
It is clear that height-related structural features are often exponentially related to biomass as reported in [
17,
69] and confirmed in this study. Interestingly, however, our results show that area-related and angle-related structural features are linearly related to biomass. To the best of the authors’ knowledge, such a relationship has not been reported before, and further investigation is required to confirm this relationship.
Aasen [
70] suggested that the combination of multiple features may improve the estimation accuracy of crop parameters, which was confirmed in this study. Combining multispectral features with TIN-based structural features improved the estimation accuracy of biomass. This is probably explained by the fact that TIN-based structural features are structural features and they contain information about the crop canopy distribution both horizontally and vertically. The combination takes advantage of both features, i.e., the biochemical information and biophysical information. In this study, the multivariate models with Hcv and APmean produced the best accuracies while models with Hmean had a moderate performance. The Hmean did not appear to be the most influential factor for the model, which implies that plant height might not be the best feature for multivariate biomass estimation. Moreover, TIN was generated directly from dense point clouds created by the SfM algorithm while CSMs required the interpolation procedure of dense point clouds, which needs extra time and may cause a loss of detailed information of the canopy structure. Therefore, we believe the TIN-based structural features, like Hcv and APmean, are more appropriate for biomass estimation. The combination changed the estimation forms of VIs while the estimation forms of the band reflectance were unchanged, indicating that VIs are more easily influenced than band reflectance when combined with structural features. It should be noted that the combination with structural features significantly reduced the difference in the estimation accuracy between NDRE and NDVI (
Table 8), indicating that the combination with structural features can relieve the saturation of NDVI after the canopy closure. A possible explanation is that NDVI is a vegetation index based on the reflectance of the red band (670 nm) and near-infrared (NIR) band (800 nm). When canopy closure appears (canopy cover reaches 100%), the absorption of red light reaches its maximum value [
71]. At the same time, NIR reflectance still increases with biomass accumulation because the addition of leaves results in multiple scattering [
72]. The imbalance between the reflectance of the red band and NIR band results in an almost unchanged NDVI ratio while biomass keeps increasing. Structural features used in this study, like Hcv and APmean, describe the vertical and horizontal distribution of rice leaves. By combining structural features with NDVI, the lack of distribution information of leaves was compensated, thus improving the estimation accuracy of NDVI. However, this hypothesis needs to be tested in a future study.
Traditionally, temporal variables, like GDD, were used to predict biomass [
73]. In this study, we used GDD as one of the model features to support biomass estimation. The results show an improved estimation accuracy, which is in line with the results in [
73]. This suggests that it is worthwhile to consider more features in the estimation model that are not directly related to the properties of biomass.
We applied the random forest algorithm to different combinations of features to verify our results and the algorithm performed better than the univariate and multivariate estimation models. The random forest algorithm makes full use of all input data and tolerates outliers and noise, hence we chose it as the verification algorithm. The best model was RFd, which contains all spectral, structural and meteorological features, while the model containing only structural features (RFb) performed the worst. The results confirmed that combining different types of features improves estimation accuracy.
Previous studies used RGB indices/multispectral indices in combination with RGB SfM height/multispectral SfM height to estimate biomass. Either the spectral resolution or the image resolution was low, reducing estimation accuracy. To solve the problem of resolution, Tilly [
2] used TLS and a field spectrometer to acquire plant height and vegetation indices. However, both instruments are ground-based sensors and cannot be applied over a large area. Furthermore, they are expensive and require extra training to operate. We used a combination of the MCA multispectral camera (12 bands) and DJI FC6310 RGB camera (20 M pixels) to acquire high spectral resolution and high spatial resolution images. Furthermore, we used TIN instead of raster DEM to ensure that the high spatial resolution was preserved. Additional attention needs to be paid to avoid hotspot and sun glint effects (
Figure 2) since both introduce unexpected error [
48]. Our future work will evaluate the transferability of this multivariate biomass estimation model to varying crops and climate conditions.

 ,
, 


