
Multi-Temporal Landsat Images and Ancillary Data for Land Use/Cover Change (LULCC) Detection in the Southwest of Burkina Faso, West Africa

 ,
,
Abstract
:
1. Introduction
2. Materials and Method
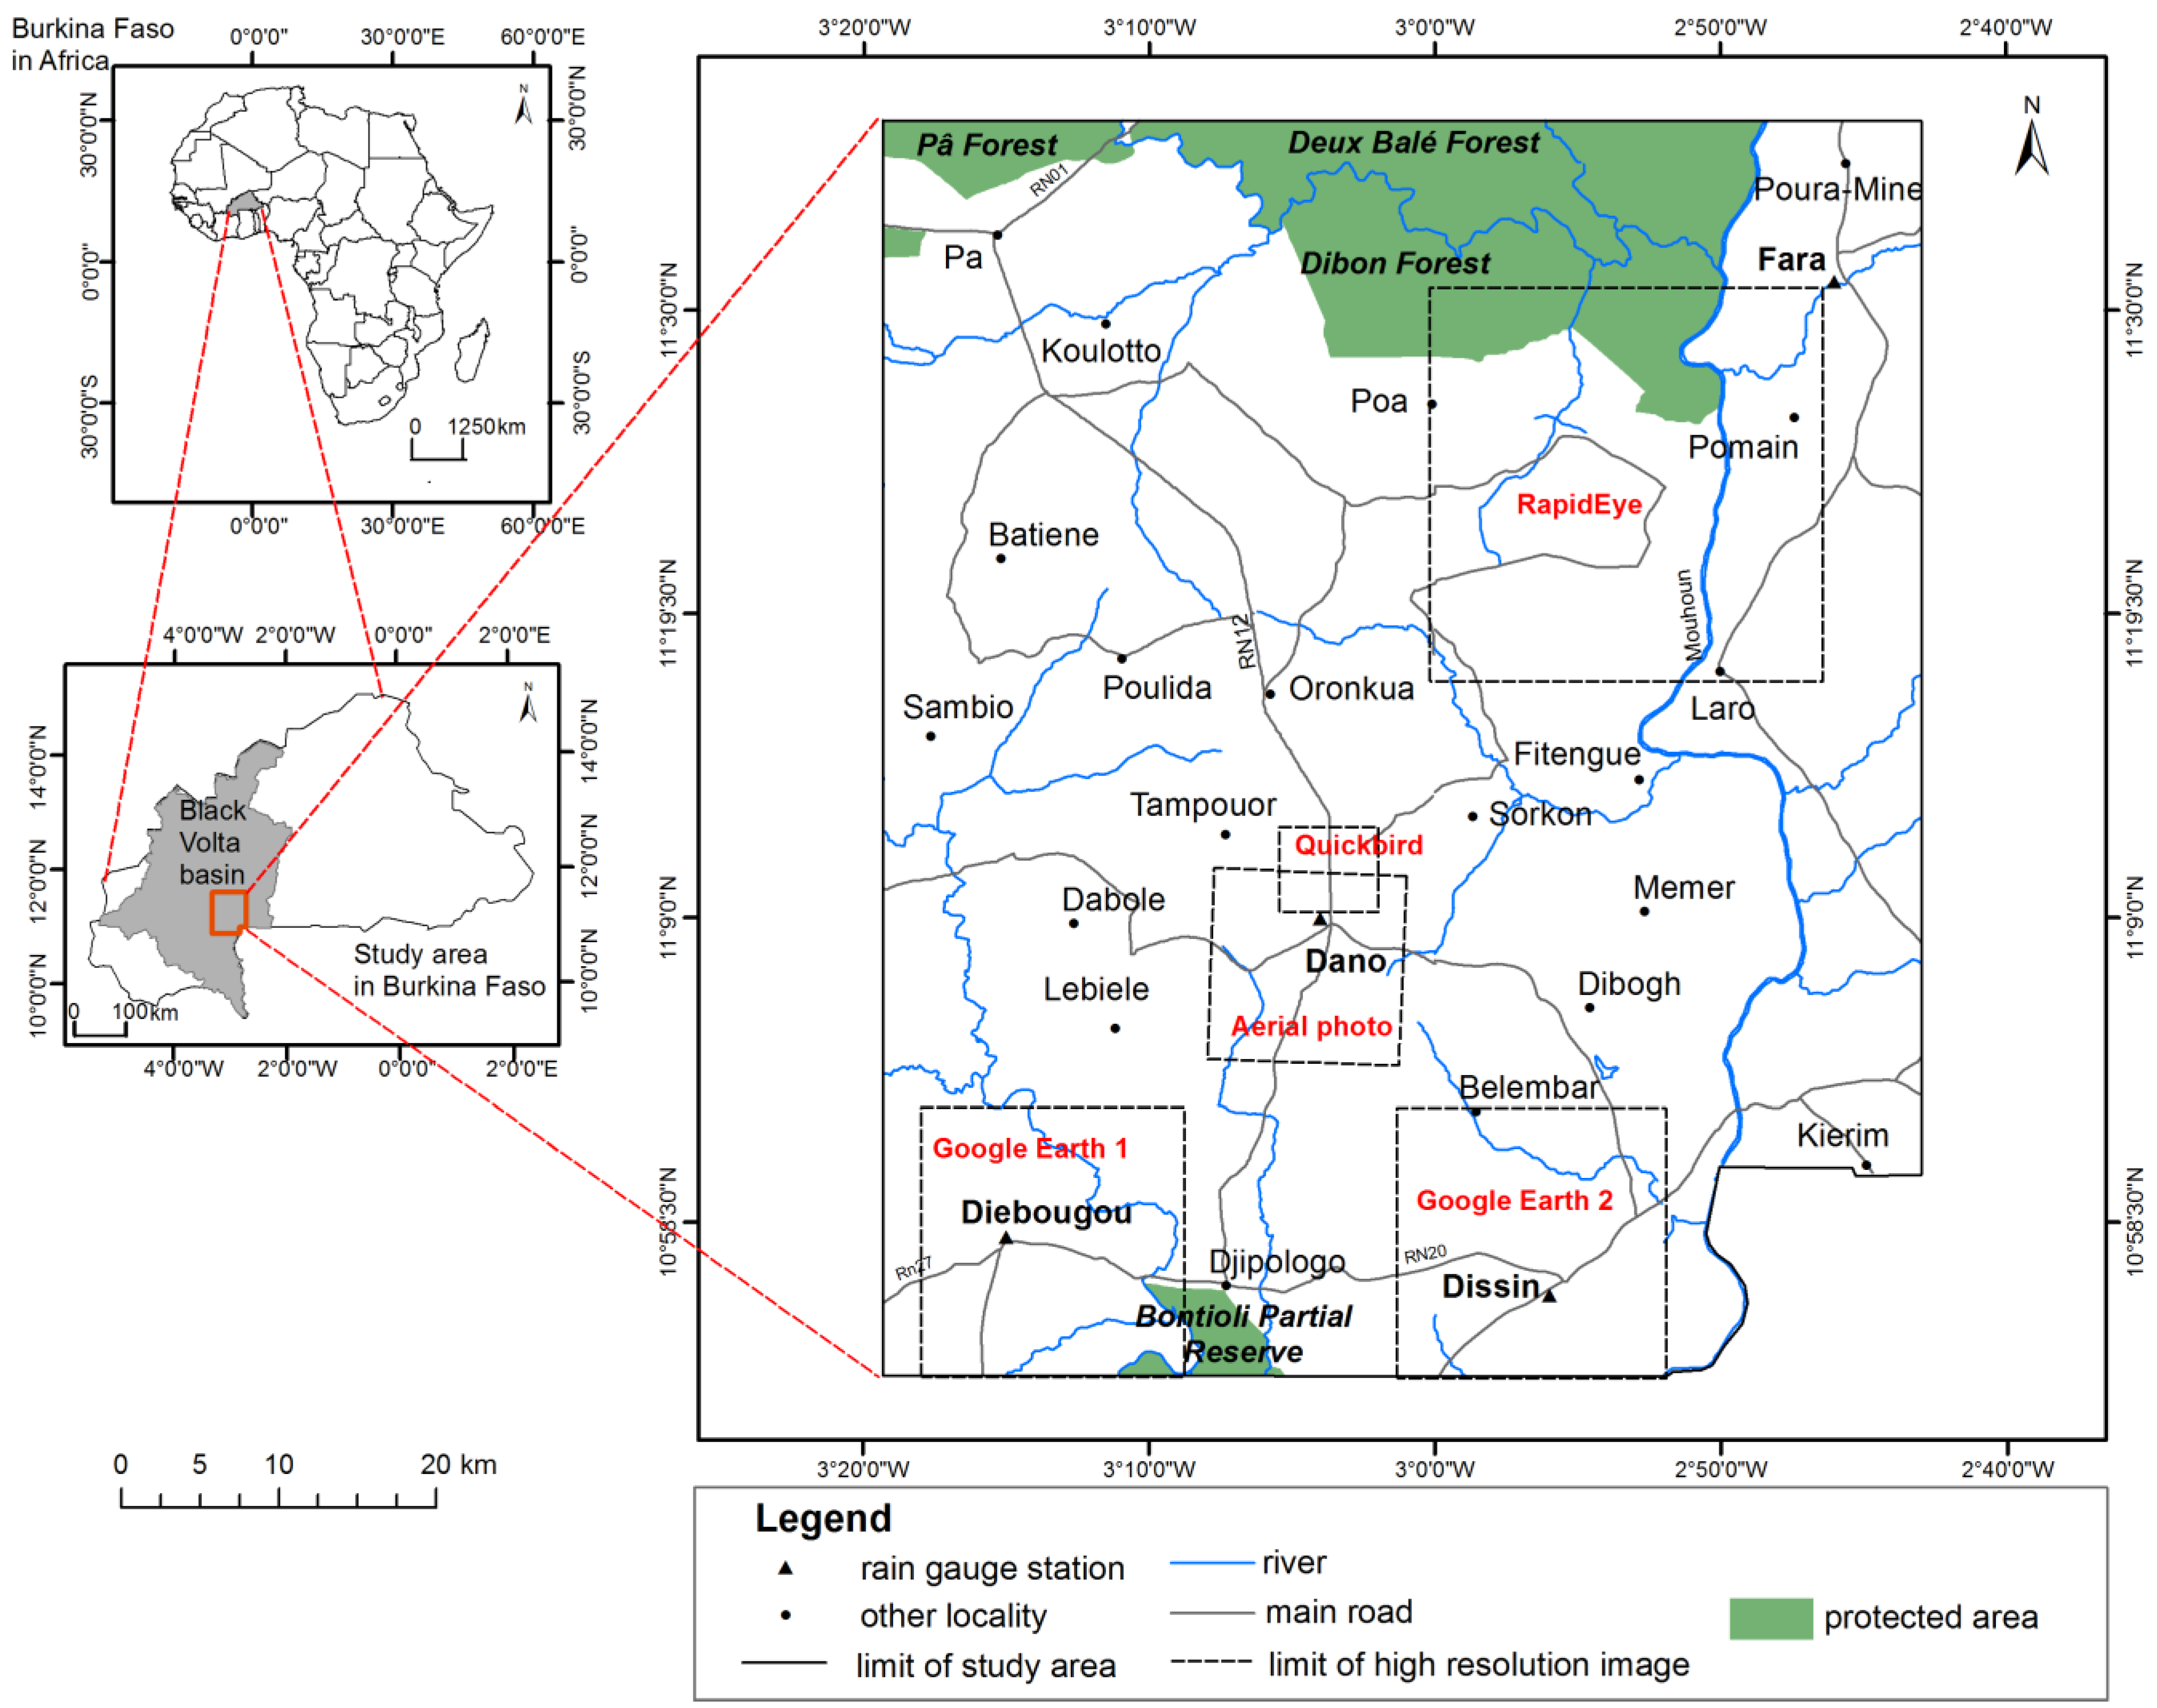
2.1. Study Area

2.2. Data and Pre-Processing
2.2.1. Landsat Images

| 2011 | 2006 | 1999 |
|---|---|---|
| 3 March | 31 October | 20 October |
| 6 May | 16 November | 14 February |
| 7 June | 18 December | - |
| 9 July | - | - |
| 29 October | - | - |
2.2.2. Environmental Ancillary Data
| Ancillary data | Source | Description | resolution |
|---|---|---|---|
| Elevation | ASTER | Height | 30 m × 30 m |
| Slope | ASTER | degree | 30 m × 30 m |
| Soil | BUNASOL-BF | Soil types | 30 m × 30 m |
| Geomorphology | BUNASOL-BF | geomorphological units | 30 m × 30 m |
2.2.3. Reference Data Sources
| Images | Date | Resolution | Extent | % of study area covered |
|---|---|---|---|---|
| RapidEye | April 2011 | 5 m × 5 m | 625 km2 | 12.20 |
| Quickbird | October 2012 | 2.4 m × 2.4 m | 25.7 km2 | 0.50 |
| Aerial photo | June 1999 | 2.3 m × 2.3 m | 188 km2 | 3.70 |
| Google Earth image 1 | November 2007 | 2.4 m × 2.4 m | 306.9 km2 | 6.00 |
| Google Earth image 2 | October 2006 | 2.4 m × 2.4 m | 309.8 km2 | 6.05 |
| Non-Modified | Modified | |
|---|---|---|
| Level 1 | Level 2 | Adopted LULC classes |
| Vegetated | Woodland | Woodland |
| Mixture of grasses, shrubs and trees | Mixed vegetation | |
| Cultivated area | Agricultural area | |
| Non-vegetated | Bare land | Bare surface |
| Built up | ||
| Tarred road | ||
| Rock | ||
| Rivers | Water | |
| Artificial water bodies | ||
| Lakes | ||
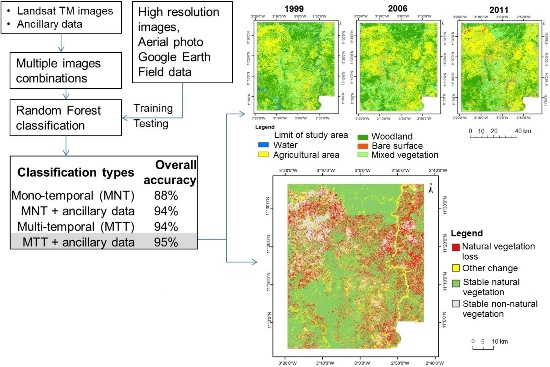
2.3. LULC Classification
2.3.1. Image Combinations
| Mono-Temporal Image | Mono-Temporal Image Plus Ancillary Data | Multi-Temporal Images | Multi-Temporal Images Plus Ancillary Data | |
|---|---|---|---|---|
| Landsat bands | Five images (October, July, June, May and March) | Image which achieved the highest accuracy in mono-temporal classification | Five images (October, July, June, May and March) | Five images (October, July, June, May and March) |
| Ancillary data | Elevation | Elevation | ||
| Slope | Slope | |||
| Geomorphology | Geomorphology | |||
| Soil types | Soil types |
2.3.2. Classification Algorithm: Random Forest Classification Algorithm
2.4. LULCC Mapping: Post Classification Change Detection
| Name | Stable Natural Vegetation | Natural Vegetation Loss | Stable non-Natural Vegetation | Other Change |
|---|---|---|---|---|
| Change classes | Stable woodland | Woodland to other LULC unless mixed vegetation | Stable agricultural area | Agricultural area to all other LULC |
| Stable mixed vegetation | Mixed vegetation to other LULC unless woodland | Stable bare surface | Bare surface to all other LULC | |
| Woodland to mixed vegetation | ||||
| Mixed vegetation to woodland | ||||
| Stable water area | Water to all other LULC |
2.5. Accuracy and Area Assessment
2.5.1. Sampling Design
2.5.2. Response Design
| Sample Allocated | |||
|---|---|---|---|
| LULC classes (strata) | 2011 | 2006 | 1999 |
| Water | 42 | 40 | 42 |
| Woodland | 100 | 97 | 111 |
| Bare surfaces | 59 | 45 | 45 |
| Mixed vegetation | 75 | 78 | 89 |
| Agric. Area | 95 | 68 | 58 |
| Total column | 371 | 328 | 345 |
| LULCC Classes (strata) | Sample Allocated |
|---|---|
| Stable natural vegetation | 125 |
| Natural vegetation loss | 56 |
| Stable non-natural vegetation | 42 |
| Other change | 77 |
| Total | 300 |
2.5.3. Analysis
| Reference | ||||||||
|---|---|---|---|---|---|---|---|---|
| 1 | 2 | … | j | … | q | Total | ||
| Map | 1 | … | ||||||
| 2 | … | … | ||||||
| ⋮ | ⋮ | ⋮ | ⋮ | ⋮ | ⋮ | ⋮ | ⋮ | |
| i | … | … | ||||||
| ⋮ | ⋮ | ⋮ | ⋮ | ⋮ | ⋮ | ⋮ | ||
| q | … | … | ||||||
| Total | … | … | 1 | |||||
3. Results
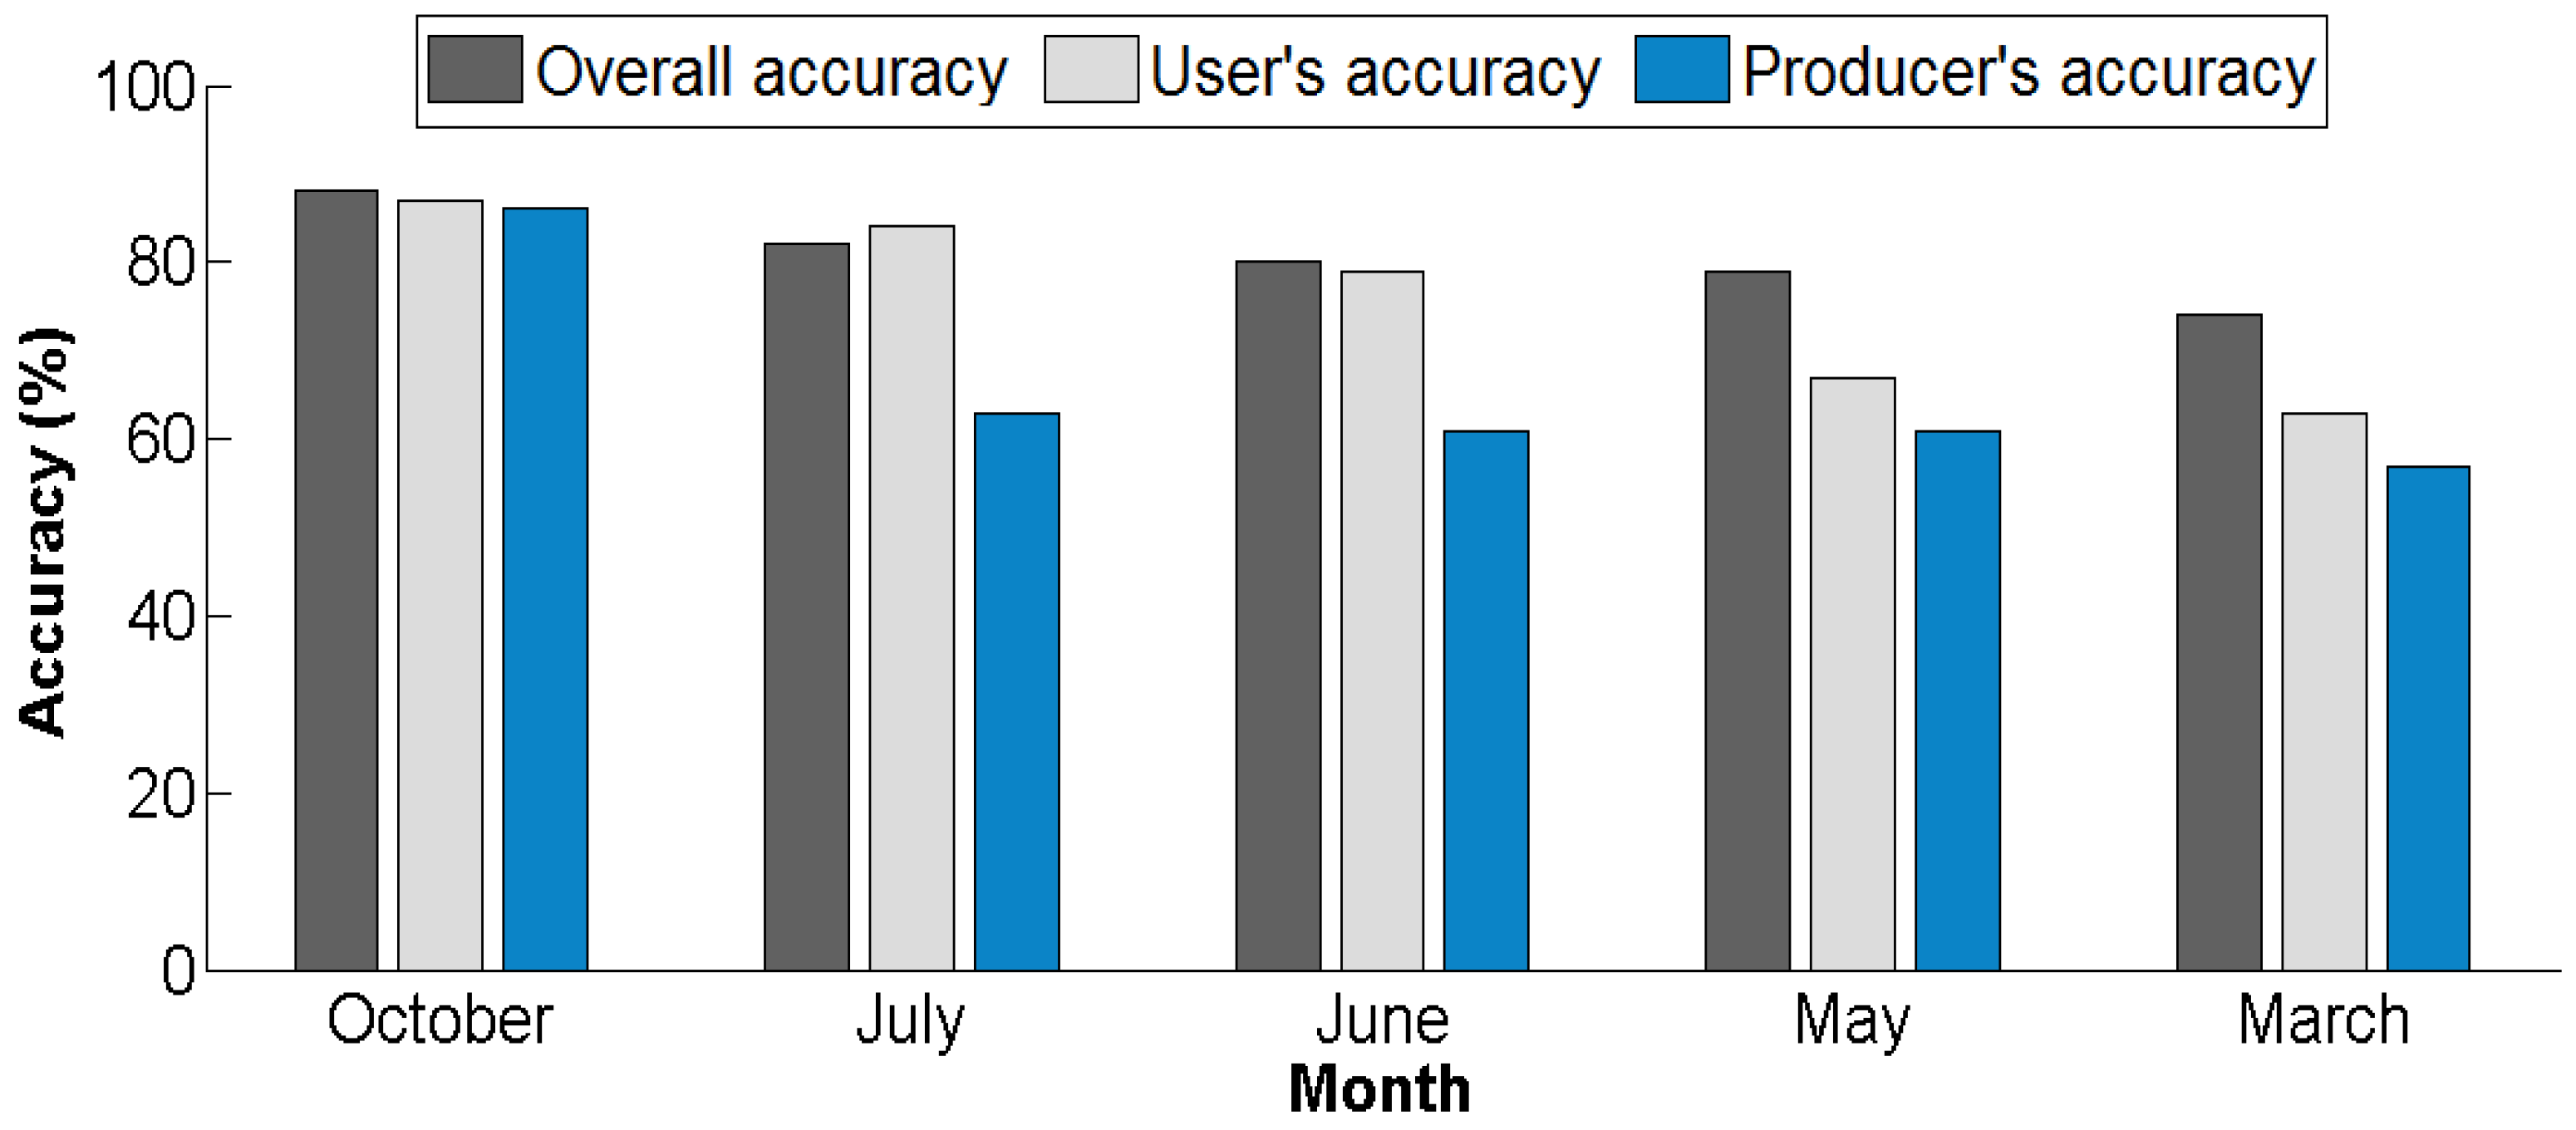
3.1. Suitable Period for Mono-Temporal LULC Classification

3.2. LULC Classification Accuracies According to Images Combinations
| March | ||||||
|---|---|---|---|---|---|---|
| 1 | 2 | 3 | 4 | 5 | Total | |
| 1 | 15 | 0 | 2 | 0 | 25 | 42 |
| 2 | 0 | 79 | 0 | 5 | 16 | 100 |
| 3 | 0 | 4 | 35 | 7 | 11 | 57 |
| 4 | 1 | 16 | 12 | 34 | 14 | 77 |
| 5 | 0 | 0 | 0 | 5 | 90 | 95 |
| Total | 16 | 99 | 49 | 51 | 156 | 371 |
| May | ||||||
| 1 | 2 | 3 | 4 | 5 | Total | |
| 1 | 13 | 0 | 16 | 0 | 13 | 42 |
| 2 | 3 | 91 | 0 | 3 | 3 | 100 |
| 3 | 0 | 2 | 44 | 5 | 8 | 59 |
| 4 | 0 | 20 | 4 | 39 | 12 | 75 |
| 5 | 1 | 4 | 2 | 5 | 83 | 95 |
| Total | 17 | 117 | 66 | 52 | 119 | 371 |
| June | ||||||
| 1 | 2 | 3 | 4 | 5 | Total | |
| 1 | 37 | 0 | 0 | 0 | 5 | 42 |
| 2 | 4 | 91 | 2 | 1 | 2 | 100 |
| 3 | 0 | 5 | 46 | 3 | 5 | 59 |
| 4 | 0 | 20 | 9 | 36 | 10 | 75 |
| 5 | 0 | 3 | 1 | 5 | 86 | 95 |
| Total | 41 | 119 | 58 | 45 | 108 | 371 |
| July | ||||||
| 1 | 2 | 3 | 4 | 5 | Total | |
| 1 | 42 | 0 | 0 | 0 | 0 | 42 |
| 2 | 6 | 87 | 1 | 3 | 3 | 100 |
| 3 | 0 | 6 | 46 | 2 | 5 | 59 |
| 4 | 0 | 9 | 8 | 43 | 15 | 75 |
| 5 | 0 | 2 | 1 | 0 | 92 | 95 |
| Total | 48 | 104 | 56 | 48 | 115 | 371 |
| October | ||||||
| 1 | 2 | 3 | 4 | 5 | Total | |
| 1 | 40 | 2 | 0 | 0 | 0 | 42 |
| 2 | 0 | 90 | 0 | 6 | 4 | 100 |
| 3 | 0 | 0 | 48 | 6 | 5 | 59 |
| 4 | 0 | 5 | 4 | 57 | 9 | 75 |
| 5 | 0 | 0 | 0 | 5 | 90 | 95 |
| Total | 40 | 97 | 52 | 74 | 108 | 371 |
| Images Combinations | Overall Accuracy | Av. User’s acc. | Av. Producer’s Acc. |
|---|---|---|---|
| Mono-temporal | 88 | 87 | 86 |
| Mono-temporal plus ancillary | 94 | 93 | 91 |
| Multi-temporal | 94 | 93 | 91 |
| Multi-temporal plus ancillary data | 95 | 95 | 92 |
| Mono-Temporal | ||||
|---|---|---|---|---|
| Chi-square | p-value | |||
| Multi-temporal | 4 | 22 | 12.5 | 0.0004 |
| Mono-temporal plus ancillary data | 6 | 23 | 10 | 0.001 |
| Multi-temporal plus ancillary data | 1 | 19 | 16.2 | 0.00005 |
| Mono-temporal plus ancillary | ||||
| Chi-square | p-value | |||
| Multi-temporal | 6 | 7 | 0.08 | 0.8 |
| Multi-temporal plus ancillary data | 10 | 5 | 1.7 | 0.2 |
| Multi-temporal plus ancillary data | Multi-temporal | |||
| Chi-square | p-value | |||
| 8 | 3 | 2.3 | 0.1 | |
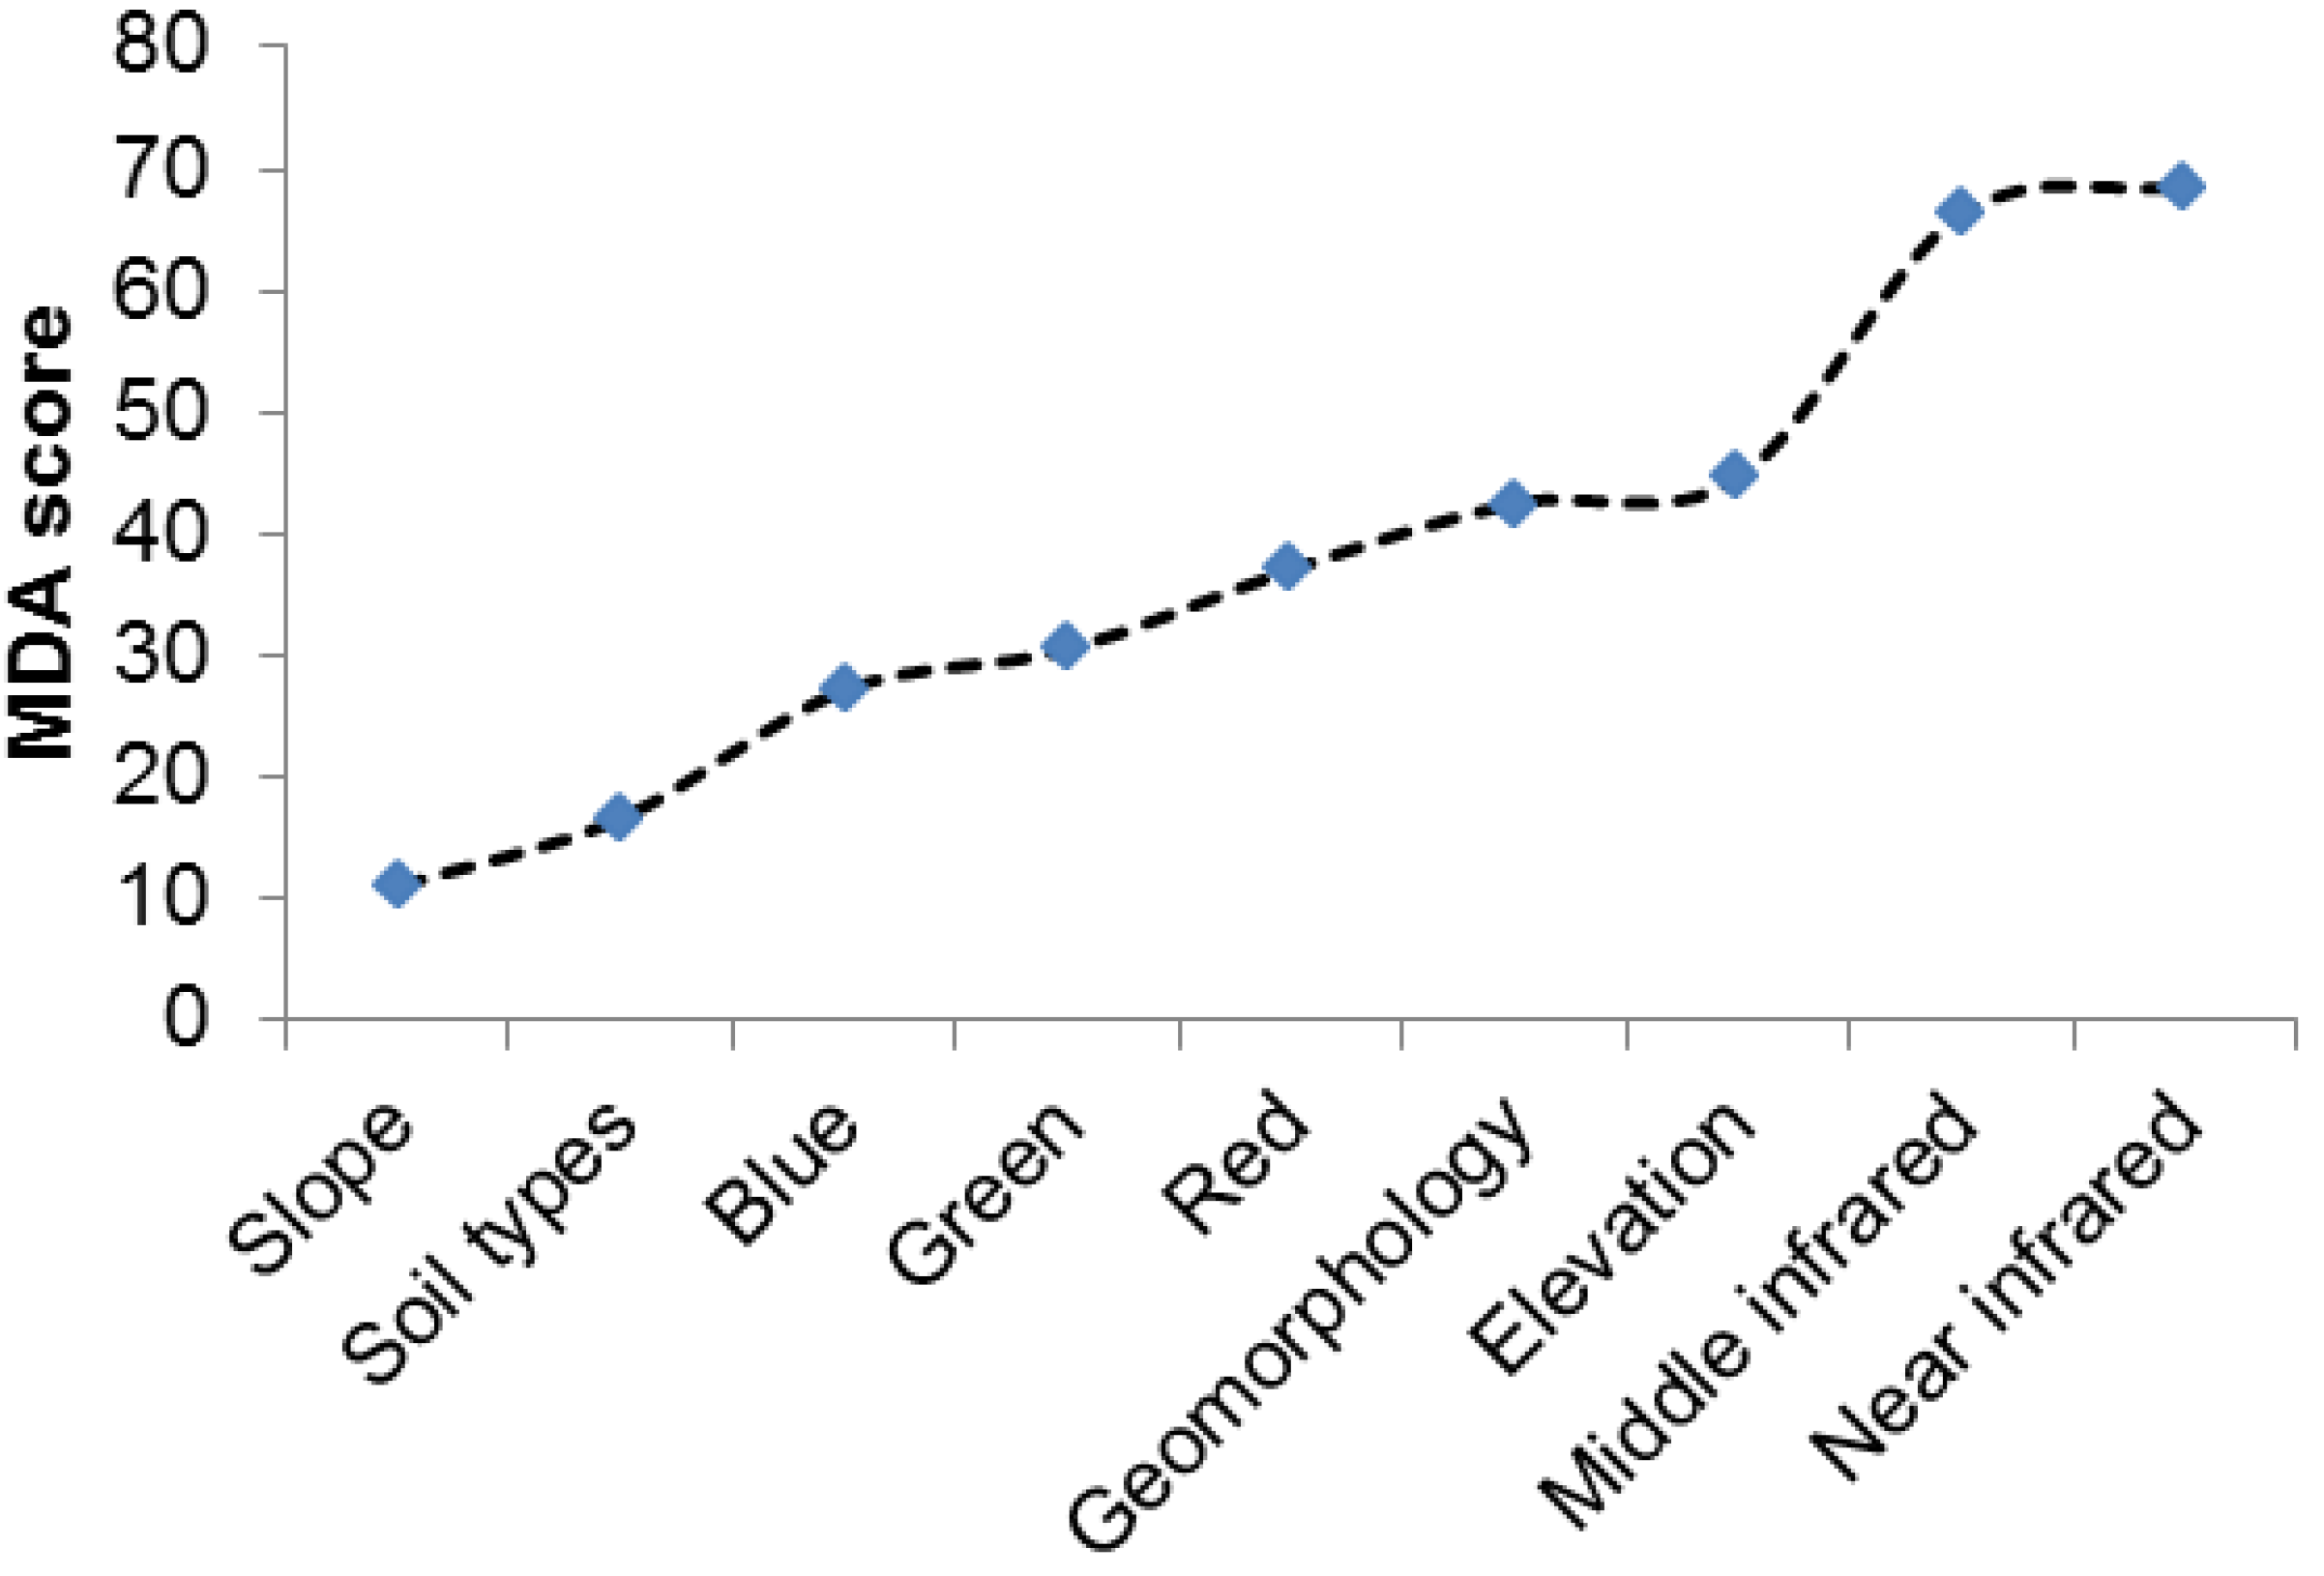
3.3. Contribution of Remotely Sensed Bands and Ancillary Data to LULC Classification
| Classification Approach | Water | Woodland | Bare Surface | Mixed Vegetation | Agricultural Area |
|---|---|---|---|---|---|
| Mono-temporal | 95 | 90 | 81 | 76 | 94 |
| Mono-temporal plus ancillary | 95 | 98 | 90 | 88 | 95 |
| Multi-temporal | 95 | 96 | 90 | 89 | 97 |
| Multi-temporal plus ancillary | 98 | 99 | 93 | 88 | 97 |
| Classification Approach | Water | Woodland | Bare Surface | Mixed Vegetation | Agricultural. Area |
|---|---|---|---|---|---|
| Mono-temporal | 100 | 96 | 66 | 81 | 85 |
| Mono-temporal plus ancillary | 100 | 100 | 69 | 92 | 93 |
| Multi-temporal | 100 | 100 | 71 | 92 | 93 |
| Multi-temporal plus ancillary | 100 | 98 | 69 | 94 | 97 |

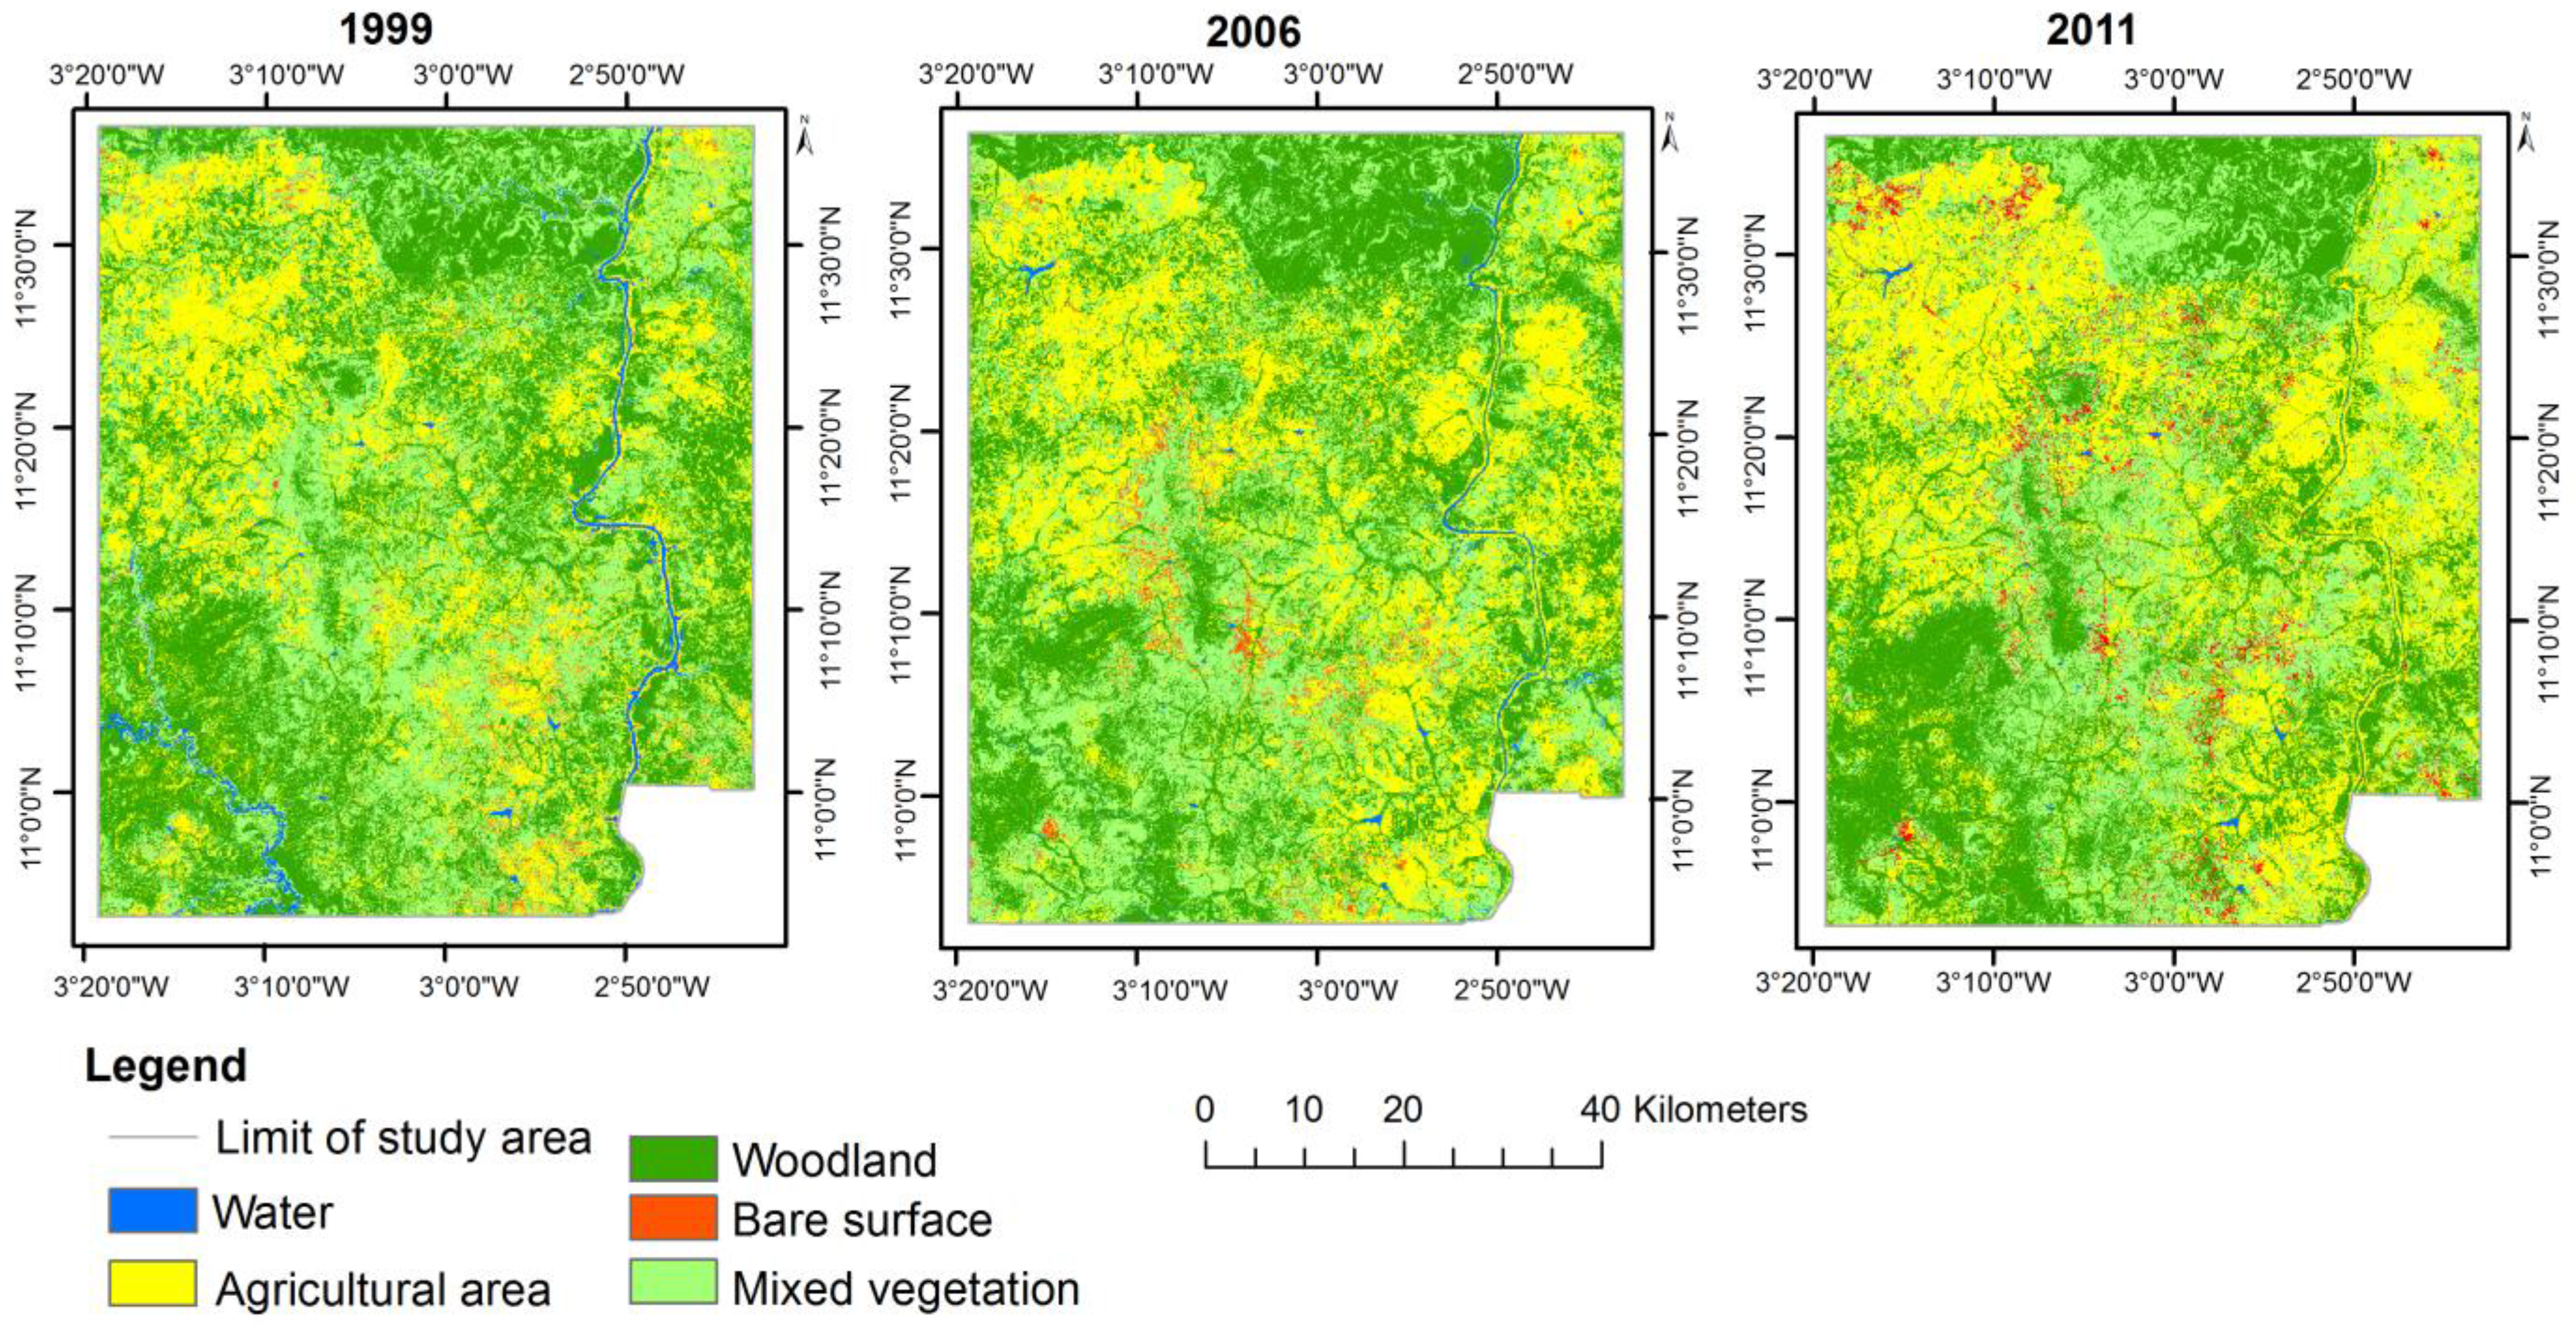
3.4. The Dynamics of LULC in the Study Area over the Years 1999, 2006 and 2011
| LULC | Mapped Area % | Estimated Area % | Confidence Interval % |
|---|---|---|---|
| Water | 1.7 | 1.7 | ± 0.1 |
| Woodland | 41.5 | 40.1 | ± 2.0 |
| Bare surface | 1.8 | 2.4 | ± 1.0 |
| Mixed vegetation | 33.2 | 33.2 | ± 2.3 |
| Agricultural area | 21.8 | 22.6 | ± 2.3 |
| Total | 100 | 100 |
| LULC | Mapped Area % | Estimated Area % | Confidence Interval % |
|---|---|---|---|
| Water | 0.7 | 0.7 | ± 0.04 |
| Woodland | 39 | 38.1 | ± 1.3 |
| Bare surface | 1.8 | 2.9 | ± 1.3 |
| Mixed vegetation | 32.5 | 32.3 | ± 1.7 |
| Agricultural area | 26 | 26 | ±2 .6 |
| Total | 100 | 100 |
| LULC | Mapped Area% | Estimated Area % | Confidence Interval % |
|---|---|---|---|
| Water | 0.2 | 0.2 | ± 0.01 |
| Woodland | 35.3 | 36.4 | ± 2.1 |
| Bare surface | 2.9 | 3.3 | ± 1.4 |
| Mixed vegetation | 31.6 | 30.4 | ± 1.3 |
| Agricultural area | 30 | 29.7 | ± 1.6 |
| Total | 100 | 100 |

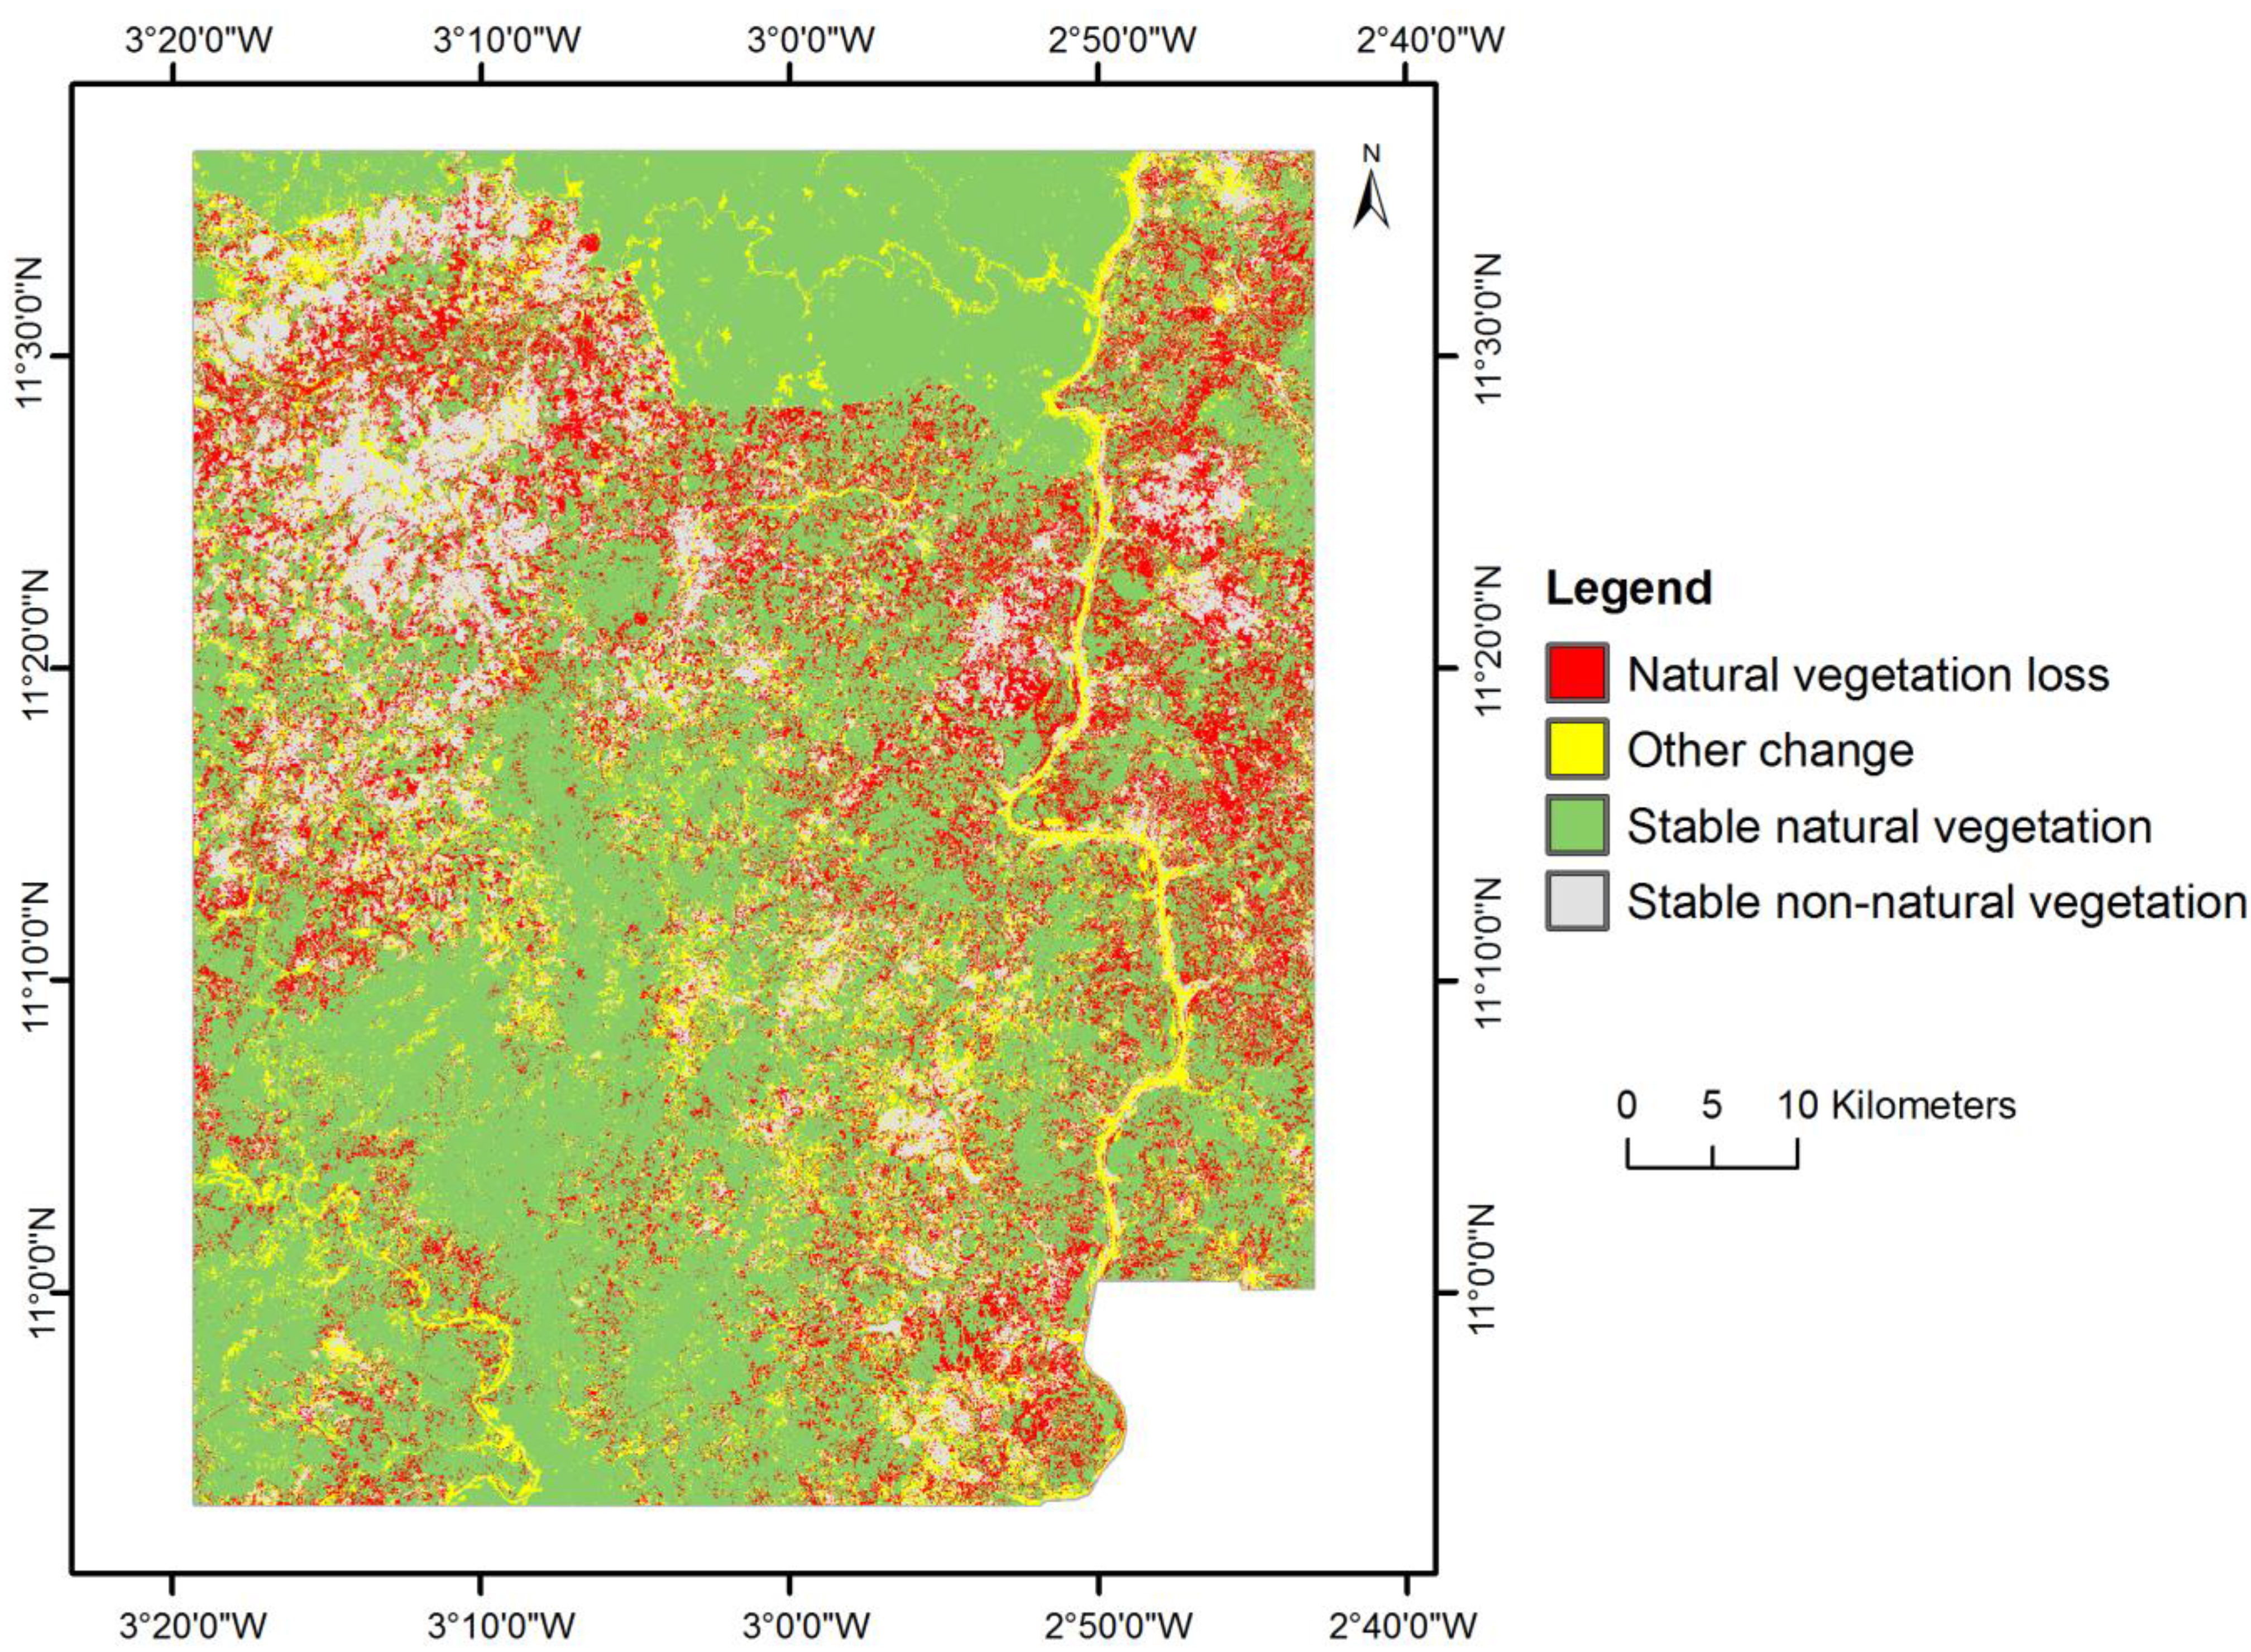
3.5. LULCC in the Study Area between 1999 and 2011
| SNV | NVL | SNNV | OC | Total | User’s (%) | |
|---|---|---|---|---|---|---|
| SNV | 0.547 | 0.014 | 0 | 0.014 | 0.575 | 95 |
| NVL | 0.016 | 0.151 | 0.003 | 0.003 | 0.173 | 87 |
| SNNV | 0.004 | 0.01 | 0.129 | 0 | 0.143 | 90 |
| OC | 0.007 | 0.004 | 0.004 | 0.094 | 0.109 | 86 |
| Total | 0.574 | 0.179 | 0.136 | 0.111 | 1 | |
| Producer’s (%) | 95 | 84 | 95 | 85 | 92 |
| Map Area | Estimated Area | ||
|---|---|---|---|
| LULCC classes | % | % | Conf. interval (%) |
| Stable natural vegetation | 57.5 | 57.4 | ± 2.7 |
| Natural vegetation loss | 17.2 | 17.9 | ± 2.5 |
| Stable non-natural vegetation | 14.3 | 13.6 | ± 1.5 |
| Other change | 11 | 11.1 | ± 1.9 |
| Total | 100 | 100 | |

| 2011 | |||||||
|---|---|---|---|---|---|---|---|
| Water | Woodland | Bare Surfaces | Mixed Veg. | Agric. Area | Area 1999 | ||
| 1999 | Water | 0.2 | 1.1 | 0 | 0.1 | 0.3 | 1.7 |
| Woodland | 0 | 24.1 | 0.4 | 8.4 | 8.6 | 41.5 | |
| Bare surfaces | 0 | 0.2 | 0.3 | 0.8 | 0.5 | 1.8 | |
| Mixed veg. | 0.01 | 7.2 | 1.4 | 17.8 | 6.8 | 33.2 | |
| Agric. Area | 0 | 2.7 | 0.8 | 4.5 | 13.8 | 21.8 | |
| Area 2011 | 0.2 | 35.3 | 2.9 | 31.6 | 30 | 100 | |
4. Discussion
4.1. LULC Classification

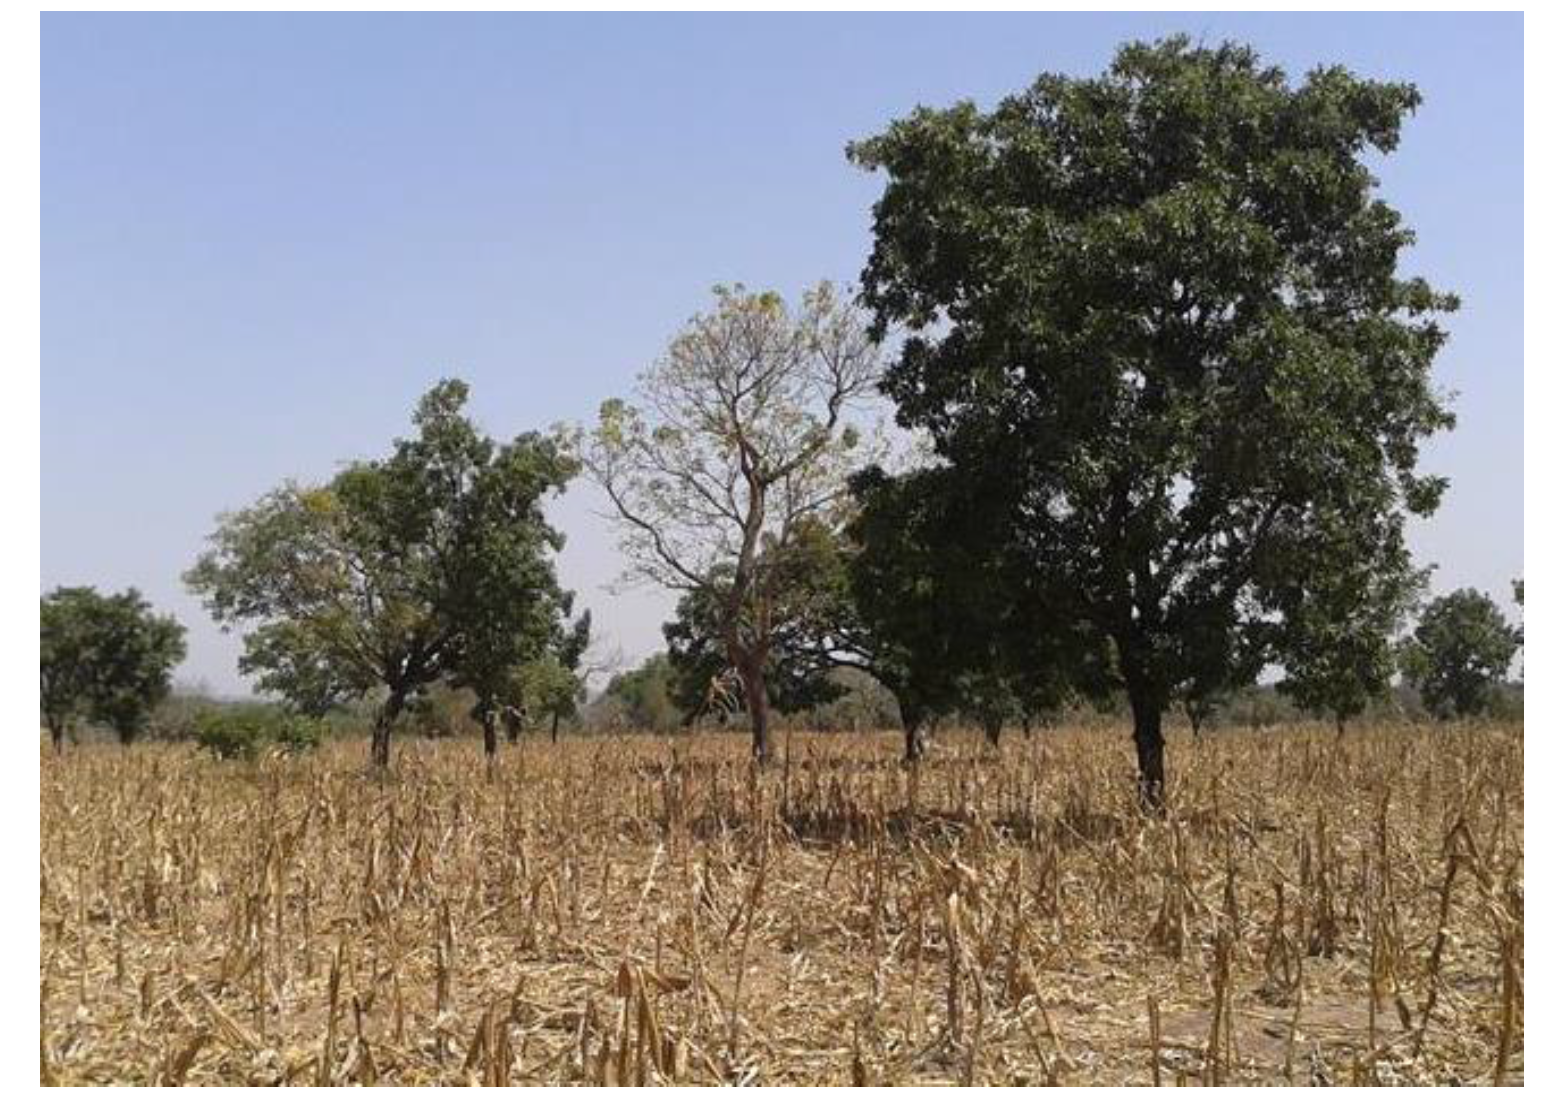
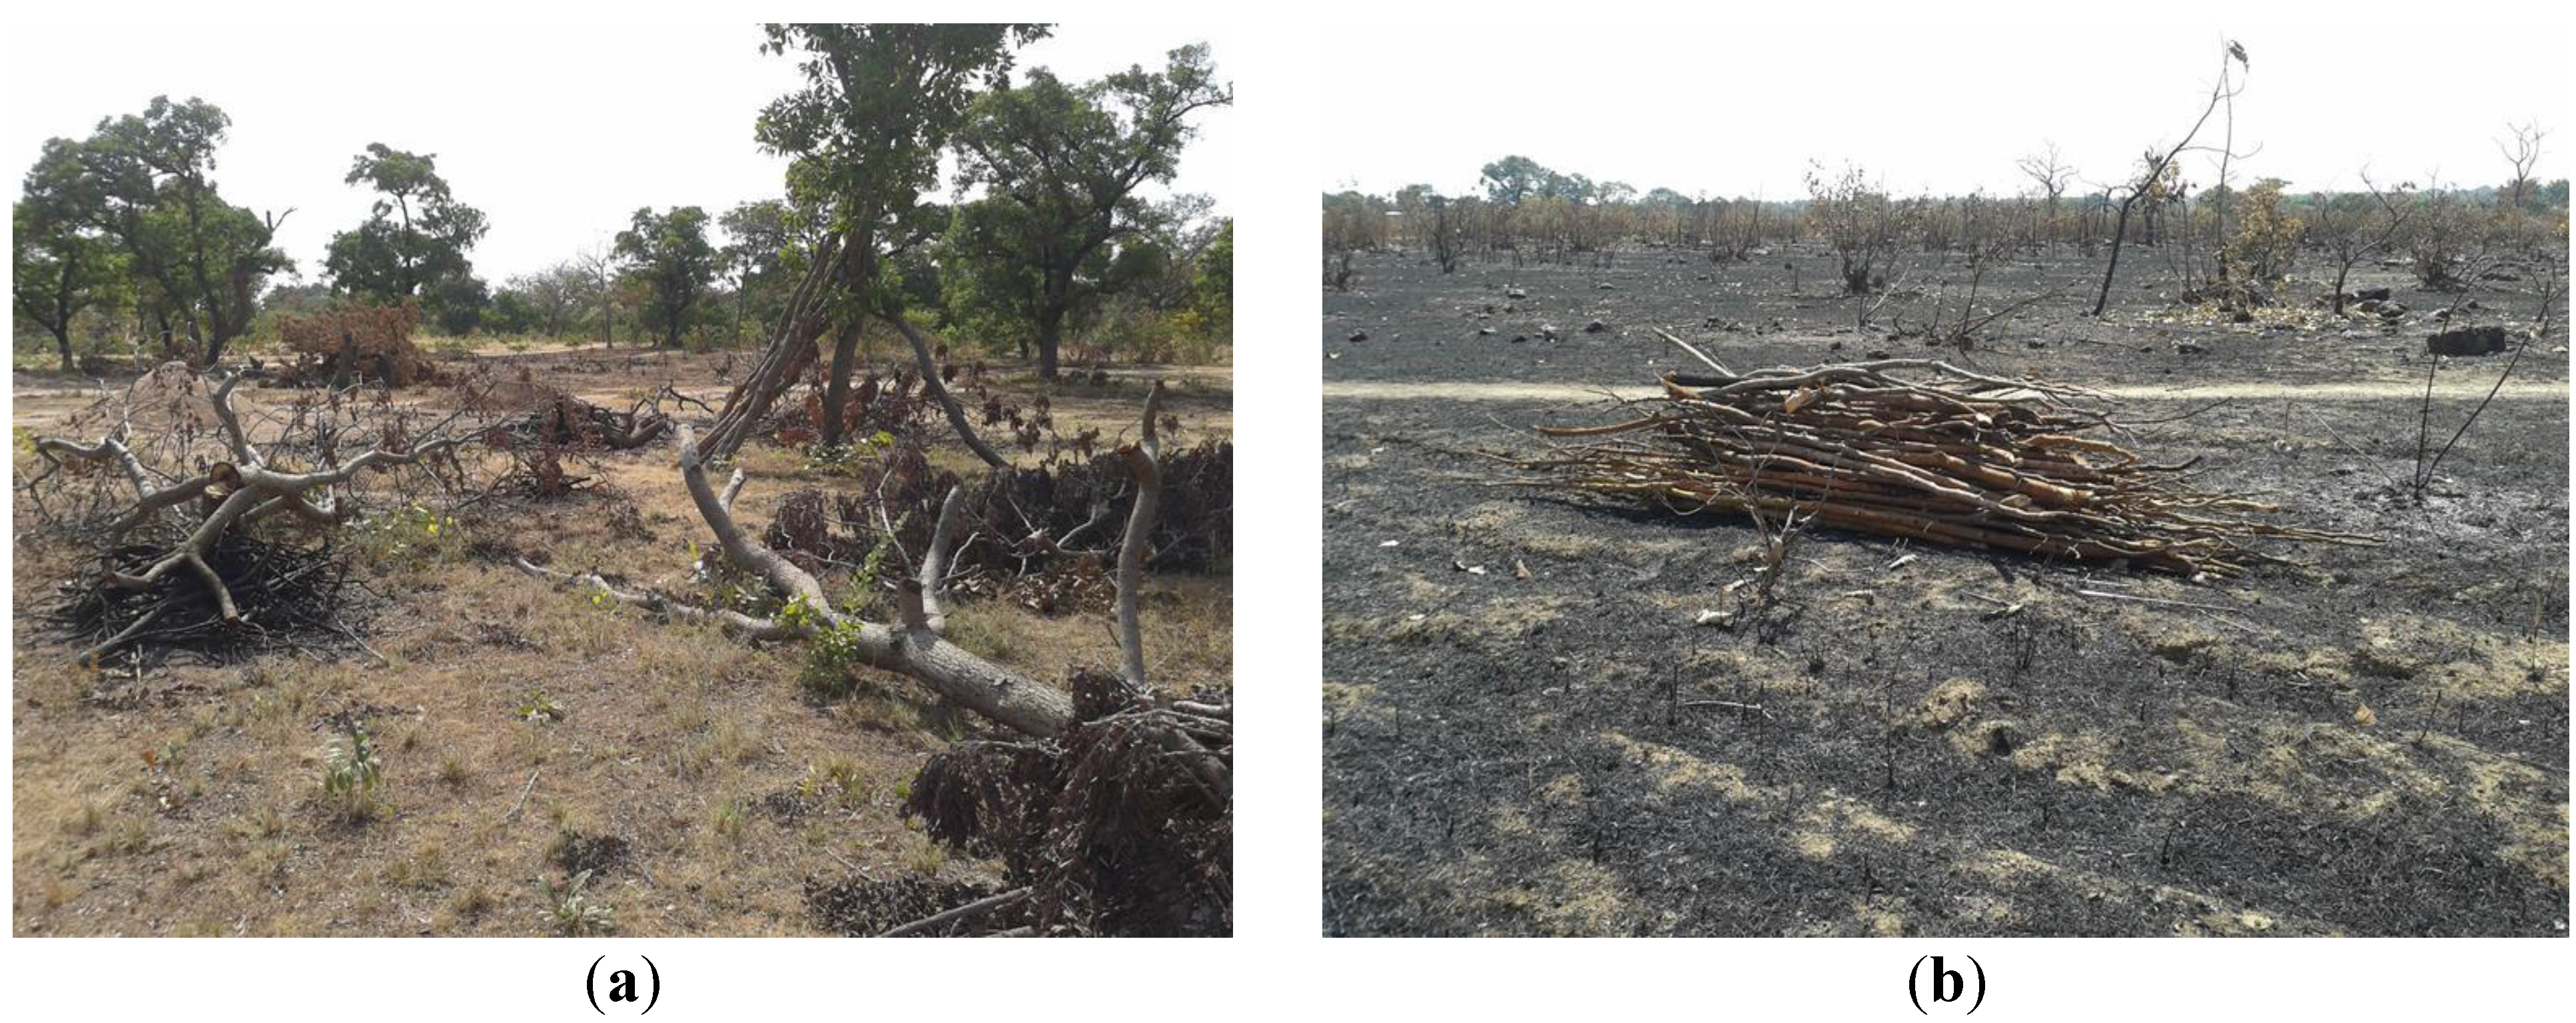
4.2. LULCC in the Study Area


5. Conclusions
Acknowledgments
Author Contributions
Conflicts of Interest
References
- Lambin, E.F. Modeling and monitoring land-cover change processes in tropical regions. Prog. Phys. Geogr. 1997, 21, 375–393. [Google Scholar] [CrossRef]
- Sala, O.E.; Chapin, F.S.; Armesto, J.J.; Berlow, E.; Bloomfield, J.; Dirzo, R.; Huber-Sanwald, E.; Huenneke, L.F.; Jackson, R.B.; Kinzig, A.; et al. Global biodiversity scenarios for the year 2100. Science 2000, 287, 1770–1774. [Google Scholar] [CrossRef] [PubMed]
- Chase, T.N.; Pielke, R.A.; Kittel, T.G.F.; Nemani, R.R.; Running, S.W. Simulated impacts of historical land cover changes on global climate in northern winter. Clim. Dyn. 1999, 16, 93–105. [Google Scholar] [CrossRef]
- Houghton, R.A.; Hackler, J.L.; Lawrence, K.T. The U.S. carbon budget: Contribution from land-use change. Science 1999, 285, 574–578. [Google Scholar] [CrossRef] [PubMed]
- Vitousek, P.M.; Mooney, H.A.; Lubchenco, J.; Melillo, J.M. Human domination of earth’s ecosystems. Science 1997, 277, 494–499. [Google Scholar] [CrossRef]
- Duadze, S.E.K. Land Use and Land Cover Study of the Savannah Ecosystem in the Upper West Region (Ghana) Using Remote Sensing; Cuvillier Verlag: Göttingenn, Germany, 2004. [Google Scholar]
- Di Gregorio, A.D.; Jansen, L.J. Land Cover Classification System, Classification Concepts and User Manual, Software Version2; Food and Agriculture Organization of the United Nations: Rome, Italy, 2005. [Google Scholar]
- Blanzieri, E.; Melgani, F. Nearest neighbor classification of remote sensing images with the maximal margin principle. IEEE Trans. Geosci. Remote Sens. 2008, 46, 1804–1811. [Google Scholar] [CrossRef]
- Shalaby, A.; Tateishi, R. Remote sensing and GIS for mapping and monitoring land cover and land-use changes in the Northwestern coastal zone of Egypt. Appl. Geogr. 2007, 27, 28–41. [Google Scholar] [CrossRef]
- Lunetta, R.S.; Balogh, M.E. Application of multi-temporal Landsat 5 TM imagery for wetland identification. Photogramm. Eng. Remote Sens. 1999, 65, 1303–1310. [Google Scholar]
- Rogan, J.; Miller, J.; Stow, D.; Franklin, J.; Levien, L.; Fischer, C. Land-cover change monitoring with classification trees using landsat TM and ancillary data. Photogramm. Eng. Remote Sens. 2003, 69, 793–804. [Google Scholar] [CrossRef]
- Ouedraogo, I.; Runge, J.; Eisenberg, J.; Barron, J.; Sawadogo, S. The re-greening of the Sahel: Natural cyclicity or human-induced change? Land 2014, 3, 1075–1090. [Google Scholar] [CrossRef]
- Cord, A.; Conrad, C.; Schmidt, M.; Dech, S. Standardized FAO-LCCS land cover mapping in heterogeneous tree savannas of West Africa. J. Arid Environ. 2010, 74, 1083–1091. [Google Scholar] [CrossRef]
- Key, T.; Warner, T.A.; McGraw, J.B.; Fajvan, M.A.F. A comparison of multispectral and multitemporal information in high spatial resolution imagery for classification of individual tree species in a temperate hardwood forest. Remote Sens. Environ. 2001, 75, 100–112. [Google Scholar] [CrossRef]
- Sesnie, S.E.; Hagell, S.E.; Otterstrom, S.M.; Chambers, C.L.; Dickson, B.G. SRTM-DEM and landsat ETM+ data for mapping tropical dry forest cover and biodiversity assessment in Nicaragua. Rev. Geogr. Acad. 2008, 2, 53–65. [Google Scholar]
- Trietz, P.; Howarth, P. Integrating spectral, spatial and terrain variables for forest ecosystem classification. Photogramm. Eng. Remote Sens. 2000, 66, 305–317. [Google Scholar]
- Ouedraogo, I.; Tigabu, M.; Savadogo, P.; Compaore, H.; Oden, P.C.; Ouadba, J.M. Land cover change and its relation with population dynamics in Burkina Faso, West Africa. Land Degrad. Dev. 2010, 21, 453–462. [Google Scholar] [CrossRef]
- Houessou, L.G.; Teka, O.; Imorou, I.T.; Lykke, A.M.; Sinsin, B. Land use and Land-cover change at “W” Biosphere Reserve and its surroundings areas in Benin Republic (West Africa). Environ. Nat. Resour. Res. 2013, 3, 87–101. [Google Scholar] [CrossRef]
- Langley, S.K.L.; Cheshire, H.M.; Humes, K.S. A comparison of single date and multitemporal satellite image classifications in a semi-arid grassland. J. Arid Environ. 2001, 49, 401–411. [Google Scholar] [CrossRef]
- Mickelson, J.G., Jr.; Civco, D.L.; Silander, J.A., Jr. Delineating forest canopy species in the northeastern United States using multi-temporal TM imagery. Photogramm. Eng. Remote Sens. 1998, 64, 891–904. [Google Scholar]
- Aduah, M.S.; Aabeyir, R. Land cover dynamics in WA municipality, upper west region of Ghana. Res. J. Environ. Earth Sci. 2012, 4, 658–664. [Google Scholar]
- Braimoh, A.K. Seasonal migration and land-use change in Ghana. Land Degrad. Dev. 2004, 15, 37–47. [Google Scholar] [CrossRef]
- Ruelland, D.; Dezetter, A.; Puech, C.; Ardoin-Bardin, S. Long-term monitoring of land cover changes based on Landsat imagery to improve hydrological modelling in West Africa. Int. J. Remote Sens. 2008, 29, 3533–3551. [Google Scholar] [CrossRef]
- Reenberg, A.; Oksen, P.; Svendsen, J. Landuse changes vis-à-vis agricultural development in southeastern Burkina Faso: The field expansion dilemma. Geogr. Tidsskr. Dan. J. Geogr. 2003, 103, 57–69. [Google Scholar] [CrossRef]
- Yuan, J.; Niu, Z. Evaluation of atmospheric correction using FLAASH. In Proceedings of the Earth Observation and Remote Sensing Applications, Beijing, China, June 30–July 2 2008.
- Atmospheric Correction Module: QUAC and FLAASH User’s Guide, Version 4.7. Available online: https://www.exelisvis.com/portals/0/pdfs/envi/Flaash_Module.pdf (accessed on 1 July 2015).
- Land cover classification system (LCCS): classification concepts and user manual. Available online: http://www.fao.org/docrep/003/x0596e/x0596e00.HTM (accessed on 1 July 2015).
- Breiman, L. Random forests. Mach. Learn. 2001, 45, 5–32. [Google Scholar] [CrossRef]
- Rodriguez-Galiano, V.F.; Chica-Olmo, M.; Abarca-Hernandez, F.; Atkinson, P.M.; Jeganathan, C. Random Forest classification of Mediterranean land cover using multi-seasonal imagery and multi-seasonal texture. Remote Sens. Environ. 2012, 121, 93–107. [Google Scholar] [CrossRef]
- Mellor, A.; Haywood, A.; Stone, C.; Jones, S. The performance of random forests in an operational setting for large area sclerophyll forest classification. Remote Sens. 2013, 5, 2838–2856. [Google Scholar] [CrossRef]
- Akar, O.; Güngör, O. Classification of multispectral images using Random Forest algorithm. J. Geod. Geoinf. 2013, 1, 105–112. [Google Scholar] [CrossRef]
- Waske, B.; Braun, M. Classifier ensembles for land cover mapping using multi temporal SAR imagery. ISPRS J. Photogramm. Remote Sens. 2009, 64, 450–457. [Google Scholar] [CrossRef]
- Löw, F.; Conrad, C.; Michel, U. Decision fusion and non-parametric classifiers for land use mapping using multi-temporal RapidEye data. ISPRS J. Photogramm. Remote Sens. 2015. [Google Scholar] [CrossRef]
- Rodriguez-Galiano, V.F.; Ghimire, B.; Rogan, J.; Chica-Olmo, M.; Rigol-Sanchez, J.P. An assessment of the effectiveness of a random forest classifier for land-cover classification. ISPRS J. Photogramm. Remote Sens. 2012, 67, 93–104. [Google Scholar] [CrossRef]
- Breiman, L. Bagging predictors. Mach. Learn. 1996, 24, 123–140. [Google Scholar] [CrossRef]
- Liaw, A.; Wiener, M. Classification and regression by random Forest. R News 2002, 2, 18–22. [Google Scholar]
- Horning, N. Random forests: An algorithm for image classification and generation of continuous fields data sets. In Proceedings of the International Conference on Geoinformatics for Spatial Infrastructure Development in Earth and Allied Sciences, Osaka, Japan, 9–11 December 2010.
- Gislason, P.O.; Benediktsson, J.A.; Sveinsson, J.R. Random Forests for land cover classification. Pattern Recognit. Lett. 2006, 27, 294–300. [Google Scholar] [CrossRef]
- Nicodemus, K.K. Letter to the editor: On the stability and ranking of predictors from random forest variable importance measures. Brief. Bioinform. 2011, 12, 369–373. [Google Scholar] [CrossRef] [PubMed]
- Olofsson, P.; Foody, G.M.; Heroldc, M.; Stehman, S.V.; Woodcock, C.E.; Wulder, M.A. Good practices for estimating area and assessing accuracy of land change. Remote Sens. Environ. 2014, 148, 42–57. [Google Scholar] [CrossRef]
- Stehman, S.V.; Czaplewski, R.L. Design and analysis for thematic map accuracy assessment: Fundamental principles. Remote Sens. Environ. 1998, 64, 331–344. [Google Scholar] [CrossRef]
- Olofsson, P.; Foody, G.M.; Stehman, S.V.; Woodcock, C.E. Making better use of accuracy data in land change studies: Estimating accuracy and area and quantifying uncertainty using stratified estimation. Remote Sens. Environ. 2013, 129, 122–131. [Google Scholar] [CrossRef]
- Stehman, S.V. Impact of sample size allocation when using stratified random sampling to estimate accuracy and area of land-cover change. Remote Sens. Lett. 2012, 3, 111–120. [Google Scholar] [CrossRef]
- Congalton, R.G.; Green, K. Assessing the Accuracy of Remotely Sensed Data: Principles and Practices; CRC Press: London, UK, 2009. [Google Scholar]
- Mas, J.F.; Pérez-Vega, A.; Ghilardi, A.; Martínez, S.; Loya-Carrillo, J.O.; Vega, E. A suite of tools for assessing thematic map accuracy. Geogr. J. 2014. [Google Scholar] [CrossRef]
- Manandhar, R.; Odeh, I.O.A.; Ancev, T. Improving the accuracy of land use and land cover classification of Landsat data using post-classification enhancement. Remote Sens. 2009, 1, 330–344. [Google Scholar] [CrossRef]
- Förster, M.; Schmidt, T.; Schuster, C.; Kleinschmit, B. Multi-temporal detection of grassland vegetation with RapidEye imagery and a spectral-temporal library. IEEE Geosci. Remote Sens. Symp. 2012, 4930–4933. [Google Scholar]
- Conrad, C.; Dech, S.; Dubovyk, C.; Fritsch, S.; Klein, D.; Löw, F.; Schorcht, G.; Zeidler, J. Derivation of temporal windows for accurate crop discrimination in heterogeneous croplands of Uzbekistan using multitemporal RapidEye images. Comput. Electron. Agr. 2014, 103, 63–74. [Google Scholar] [CrossRef]
- Forkuor, G.; Conrad, C.; Thiel, M.; Ullmann, T.; Zoungrana, E. Integration of optical and Synthetic Aperture Radar imagery for improving crop mapping in Northwestern Benin, West Africa. Remote Sens. 2014, 6, 6472–6499. [Google Scholar] [CrossRef]
- Machwitz, M.; Gessner, U.; Conrad, C.; Falk, U.; Richters, J.; Dech, S. Modelling the gross primary productivity of West Africa with the regional biomass model RBM+, using optimized 250 m MODIS FPAR and fractional vegetation cover information. Int. J. Appl. Earth Obs. 2015. [Google Scholar] [CrossRef]
- Herold, M.; Woodcock, C.E.; Loveland, T.R.; Townshend, J.; Brady, M.; Steenmans, C.; Schmullius, C.C. Land-cover observations as part of a Global Earth Observation System of Systems (GEOSS): Progress, Activities, and prospects. IEEE Syst. J. 2008, 2, 414–423. [Google Scholar] [CrossRef]
- Boateng, P.K. Agricultural production, land-use/cover change and the desertification debate in the West African Savannah: An adapted political ecology approach. J. Arts Hum. 2013, 2, 21–35. [Google Scholar]
- Bado, B.V.; Bationo, A.; Lompo, F.; Traore, K.; Sedogo, M.P.; Cescas, M.P. Long term effects of crop rotations with fallow or groundnut on soil fertility and succeeding sorghum yields in the Guinea Savannah of West Africa. In Lessons learned from Long-term Soil Fertility Management Experiments in Africa; Springer Netherlands: Berlin, Germany, 2012; pp. 27–40. [Google Scholar]
- Intergovernmental Panel on Climate Change. IPCC Fourth Assessment Report: Climate Change 2007; Intergovernmental Panel on Climate Change: Geneva, Switzerland, 2007. [Google Scholar]
- Sahel Weather and Crop Situation 1999, Global Information and Early Warning System on Food and agriculture, Report No 4. Available online: ftp://ftp.fao.org/docrep/fao/003/x3004e/x3004e00.pdf (accessed on 1 July 2015).
- Zoungrana, B.J.B.; Conrad, C.; Amekudzi, L.K.; Thiel, M.; Da, E.D. Land use/cover response to rainfall variability: A comparing analysis between NDVI and EVI in the Southwest of Burkina Faso. Climate 2015, 3, 63–77. [Google Scholar] [CrossRef]
© 2015 by the authors; licensee MDPI, Basel, Switzerland. This article is an open access article distributed under the terms and conditions of the Creative Commons Attribution license (http://creativecommons.org/licenses/by/4.0/).
Share and Cite
Zoungrana, B.J.-B.; Conrad, C.; Amekudzi, L.K.; Thiel, M.; Da, E.D.; Forkuor, G.; Löw, F. Multi-Temporal Landsat Images and Ancillary Data for Land Use/Cover Change (LULCC) Detection in the Southwest of Burkina Faso, West Africa. Remote Sens. 2015, 7, 12076-12102. https://doi.org/10.3390/rs70912076
Zoungrana BJ-B, Conrad C, Amekudzi LK, Thiel M, Da ED, Forkuor G, Löw F. Multi-Temporal Landsat Images and Ancillary Data for Land Use/Cover Change (LULCC) Detection in the Southwest of Burkina Faso, West Africa. Remote Sensing. 2015; 7(9):12076-12102. https://doi.org/10.3390/rs70912076
Chicago/Turabian StyleZoungrana, Benewinde J-B., Christopher Conrad, Leonard K. Amekudzi, Michael Thiel, Evariste Dapola Da, Gerald Forkuor, and Fabian Löw. 2015. "Multi-Temporal Landsat Images and Ancillary Data for Land Use/Cover Change (LULCC) Detection in the Southwest of Burkina Faso, West Africa" Remote Sensing 7, no. 9: 12076-12102. https://doi.org/10.3390/rs70912076
APA StyleZoungrana, B. J.-B., Conrad, C., Amekudzi, L. K., Thiel, M., Da, E. D., Forkuor, G., & Löw, F. (2015). Multi-Temporal Landsat Images and Ancillary Data for Land Use/Cover Change (LULCC) Detection in the Southwest of Burkina Faso, West Africa. Remote Sensing, 7(9), 12076-12102. https://doi.org/10.3390/rs70912076